The chromatin remodelers RSC and ISW1 display functional and chromatin-based promoter antagonism
- Howard Hughes Medical Institute, University of Utah School of Medicine, United States
- University of Utah School of Medicine, United States
Figures
Figure 1 with 1 supplement

Suppressors of rsc2 and rsc7 alleles obtained by genetic screen.
(A) Suppression of the rsc7Δ temperature sensitivity by the isw1Δ mutation. Wild-type (YBC62) and rsc7Δ (YBC2039) were transformed with plasmids containing RSC7, ISW1, or empty vector and spotted as fivefold serial dilutions to SC-URA media and grown at 35°. (B) Histone H3 and H4 suppressors of rsc2-V457M. YBC2140 (rsc1Δ rsc2-V457M hht1hhf1 hht2-hhf2 [H3-H4.URA]) was transformed with TRP1-marked plasmids bearing histone mutations, streaked to SC-TRP + 5FOA to force loss of the WT histone plasmid, and then spotted as 10-fold serial dilutions to SC-TRP at 30°C or 33°C. (C) 10-fold dilutions of YBC2140 transformed with H3 or H4 mutations and spotted to SC-TRP + 5FOA at 30°C or 33°C. Figure 1—figure supplement 1 shows that Rsc2 alleles are not suppressed by dot1Δ or sir3Δ.
Figure 1—figure supplement 1
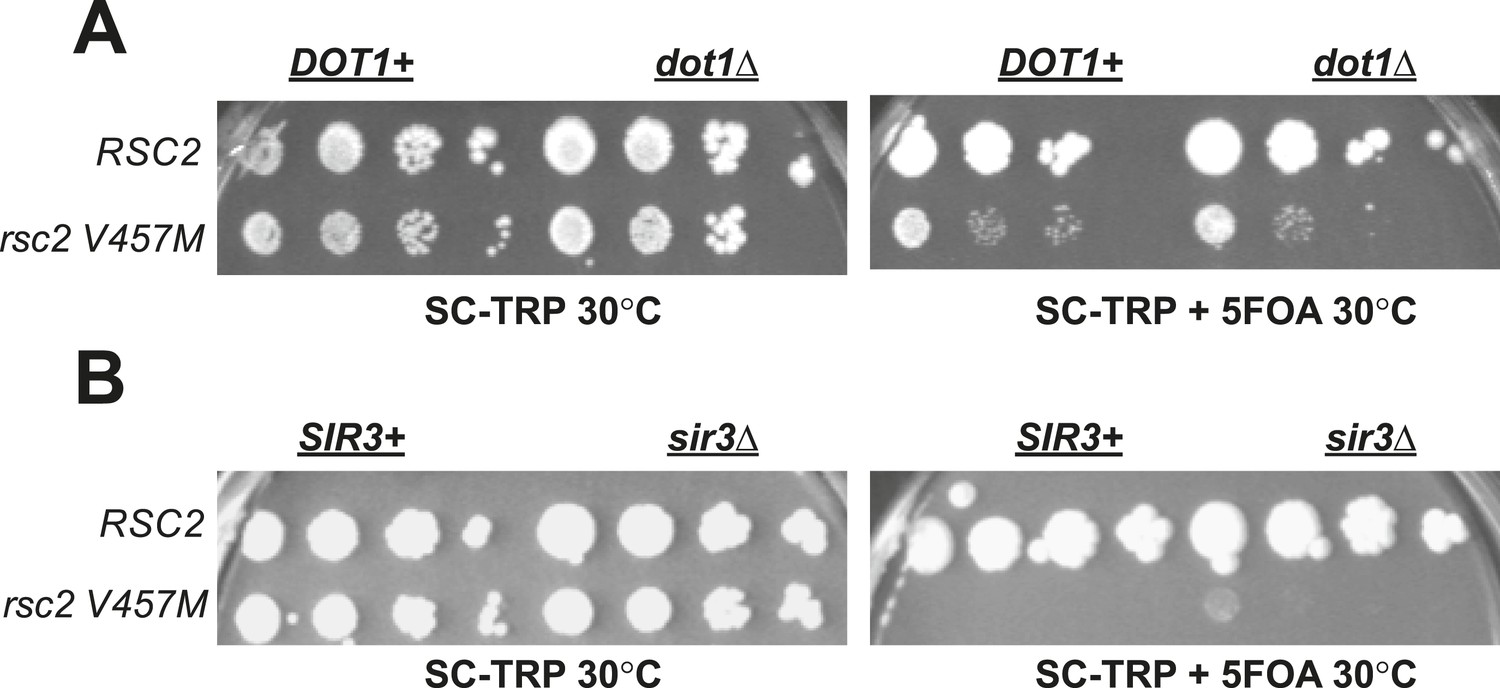
Rsc2 mutations are not suppressed by dot1Δ or sir3Δ.
(A) dot1Δ does not suppress rsc2-V457M. YBC803 (rsc1Δrsc2Δ [RSC1.URA3]) and YBC1683 (rsc1Δ rsc2Δ dot1Δ [RSC1.URA3]) were transformed with TRP1-marked RSC2 (p604) or rsc2-V457M (p776) and spotted to SC-TRP 30°C and SC-TRP + 5FOA 30°C. (B) A null mutation in SIR3 does not suppress rsc2-V457M. YBC803 (rsc1Δrsc2Δ [RSC1.URA3]) and YBC3185 (rsc1Δ rsc2Δ sir3Δ [RSC1.URA3]) were transformed with TRP1-marked RSC2 (p604) or rsc2-V457M (p776) and spotted to SC-TRP 30°C and SC-TRP + 5FOA 32°C.
Figure 2 with 1 supplement
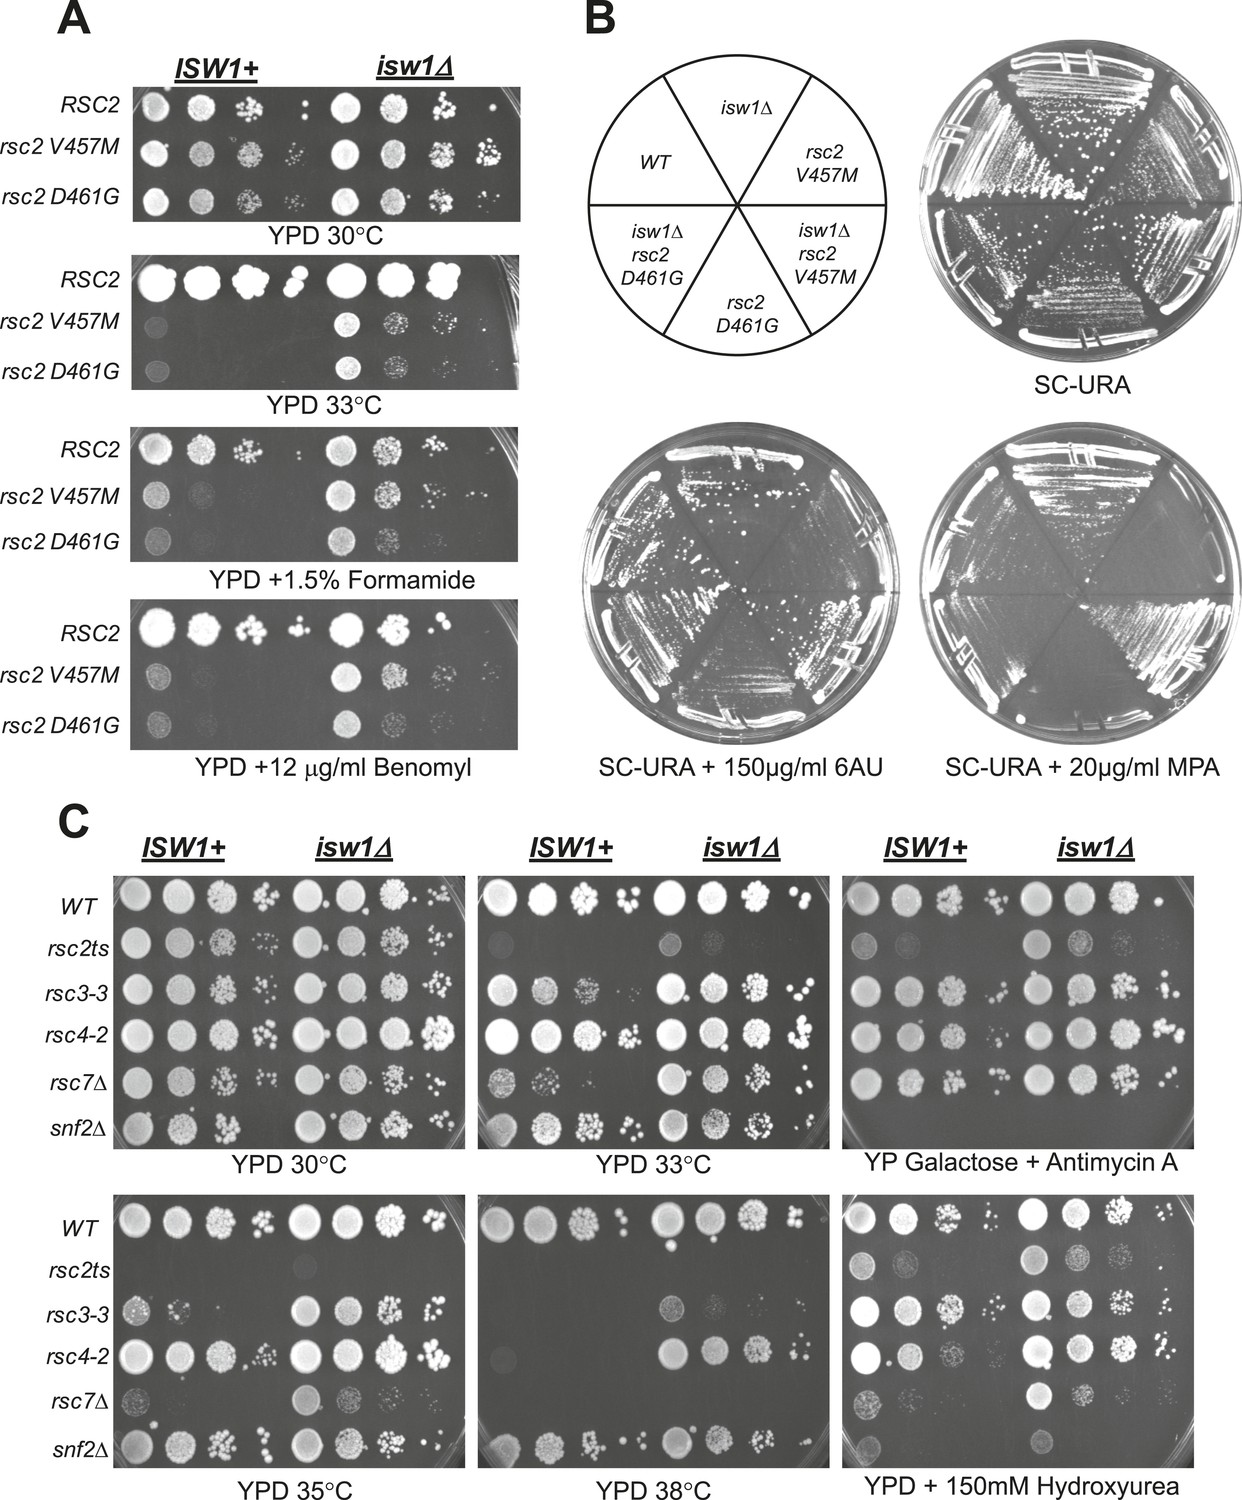
A null mutation of isw1 suppresses RSC mutations.
(A) rsc2 Ts− alleles are suppressed by isw1Δ. An ISW1+ strain (YBC1231; rsc1Δ rsc2Δ [RSC1.URA3]) and an isw1Δ strain (YBC1479; rsc1Δ rsc2Δ isw1Δ [RSC1.URA]) were transformed with TRP1-marked RSC2 (p604), rsc2-V457M (p776), or rsc2-D461G (p777), streaked to SC-TRP + 5FOA to force loss of the RSC1 plasmid, and then spotted as 10-fold dilutions to YPD at 30°C, 33°C, and YPD containing 1.5% formamide (Form) or 12 μg/ml benomyl. (B) isw1Δ suppresses 6-azauracil (6AU) and MPA phenotypes of rsc2 mutations. YBC1231 (ISW1+) and YBC1479 (isw1Δ) were transformed with TRP1-marked RSC2 (p776), rsc2-V457M (p776), or rsc2-(YBC777), streaked to SC-TRP + 5FOA to force loss of the RSC1 plasmid, and then transformed with URA3-marked vector. Strains were then streaked to SC-URA medium containing 20 μg/ml MPA or 150 μg/ml 6AU. (C) isw1Δ suppresses additional RSC mutations but does not suppress snf2. WT (YBC62), isw1Δ (YBC1416), rsc2-V457M (YBC1111), rsc2-V457M isw1Δ (YBC2810), rsc33 (YBC906), rsc3-3 isw1Δ (YBC1485 p817), rsc4-2 (YBC1278), rsc4-2 isw1Δ (YBC2867), rsc7Δ (YBC1333), rsc7Δ isw1Δ (YBC2233), snf2Δ (YBC26), and snf2Δ isw1Δ (YBC2812) were spotted as 10-fold serial dilutions to YPD 30°C, 33°C, 35°C, 38°C, YPD containing 150 mM Hydroxyurea (HU), and YPGal + Antimycin A (AA). Figure 2—figure supplement 1 shows suppression of rsc2 alleles by catalytic isw1 and isw2Δ mutants.
Figure 2—figure supplement 1
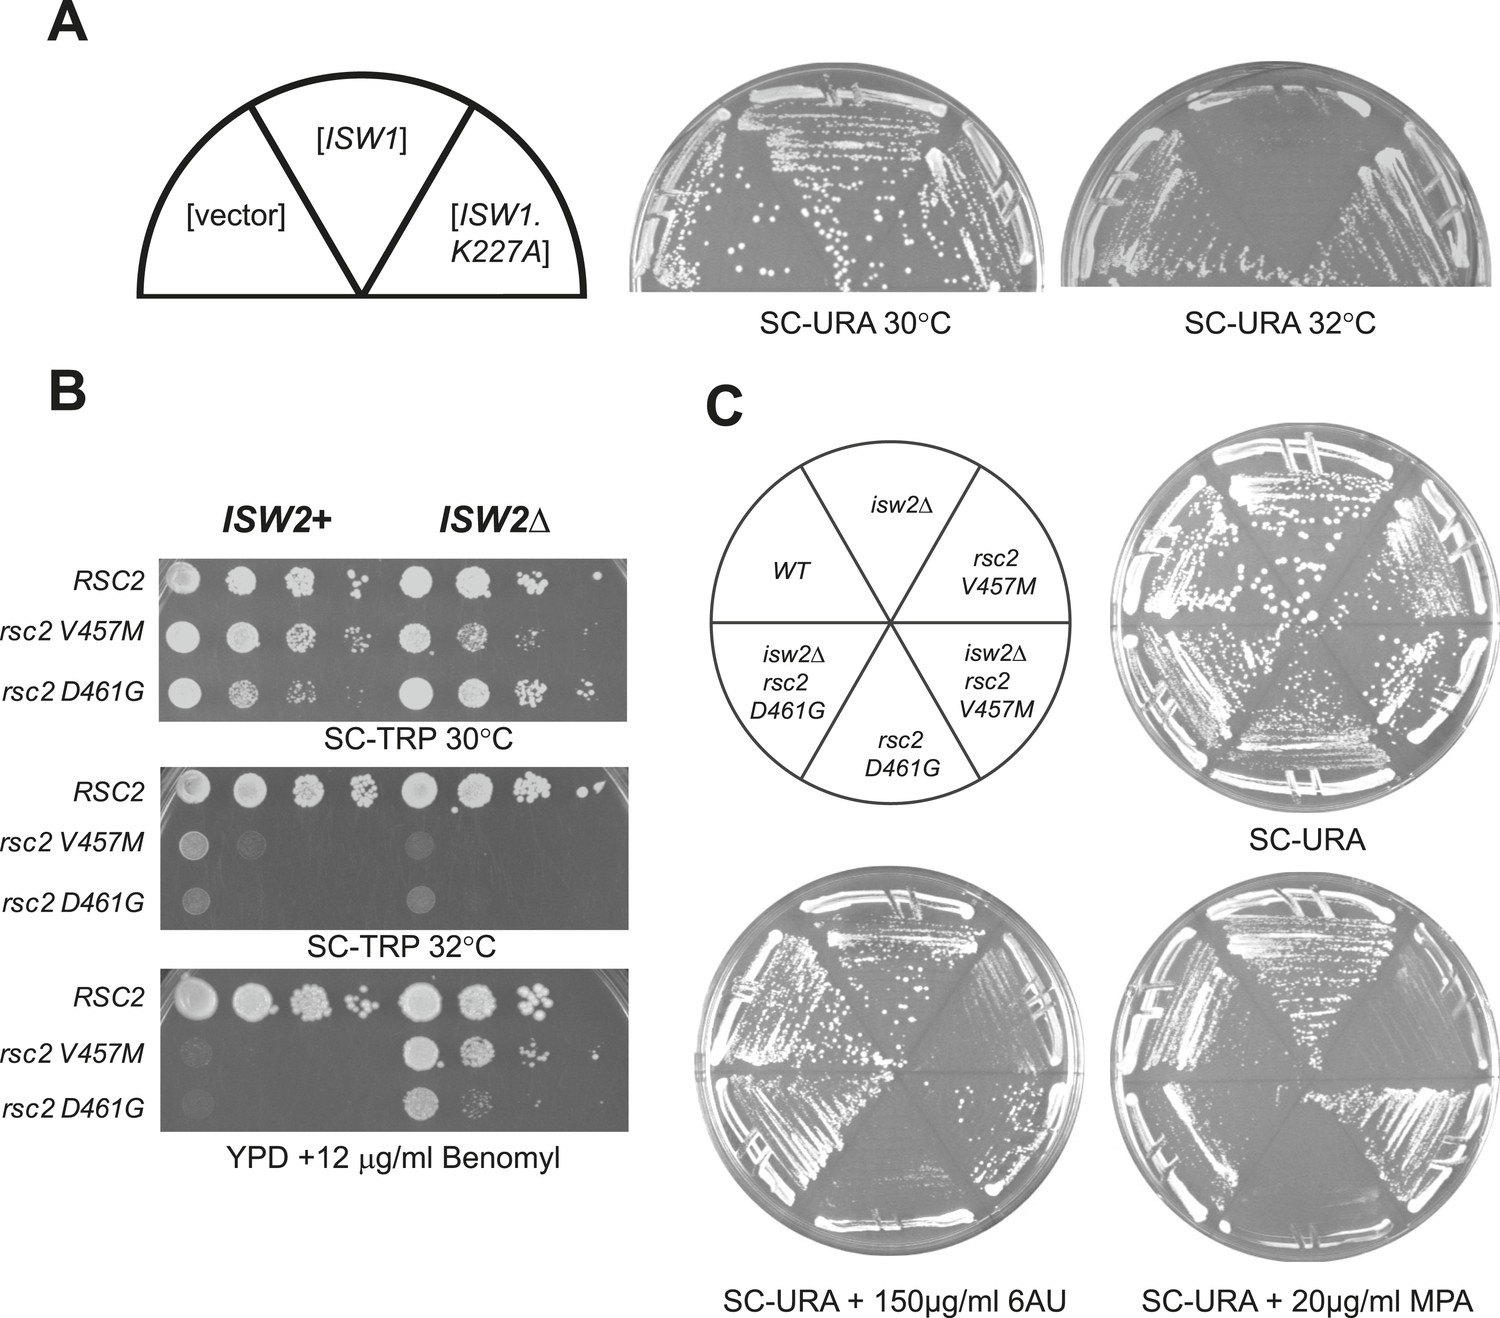
rsc2 mutations are suppressed by an ISW1 ATPase mutation and an ISW2 null mutation.
(A) Growth ability of rsc2-V457M isw1Δ at the non-permissive temperature in the presence of ISW1+, or ISW1-K227A. (B) rsc2 Ts− alleles in combination with isw2Δ. An ISW2+ strain (YBC1231; rsc1Δ rsc2Δ [RSC1.URA3]) and an isw2Δ strain (YBC1480; rsc1Δ rsc2Δ isw2Δ [RSC1.URA3]) were transformed with TRP1-marked RSC2 (p604), rsc2-V457M (p776), or rsc2-D461G (p777), streaked to SC-TRP + 5FOA to force loss of the RSC1 plasmid, and then spotted as 10-fold dilutions to YPD at 30°C, 32°C, and YPD containing 12 μg/ml Benomyl. (C) isw2Δ suppresses 6-azauracil (6AU) and MPA phenotypes of rsc2 mutations. YBC1231 (ISW1+) and YBC1480 (isw2Δ) were transformed with TRP1-marked RSC2 (p776), rsc2-V457M (p776), or rsc2-D461G (YBC777), streaked to SC-TRP + 5FOA to force loss of the RSC1 plasmid, and then transformed with URA3-marked vector. Strains were then streaked to SC-URA medium containing 20 μg/ml MPA or 150 μg/ml 6-azauracil 6AU.
Figure 3 with 2 supplements
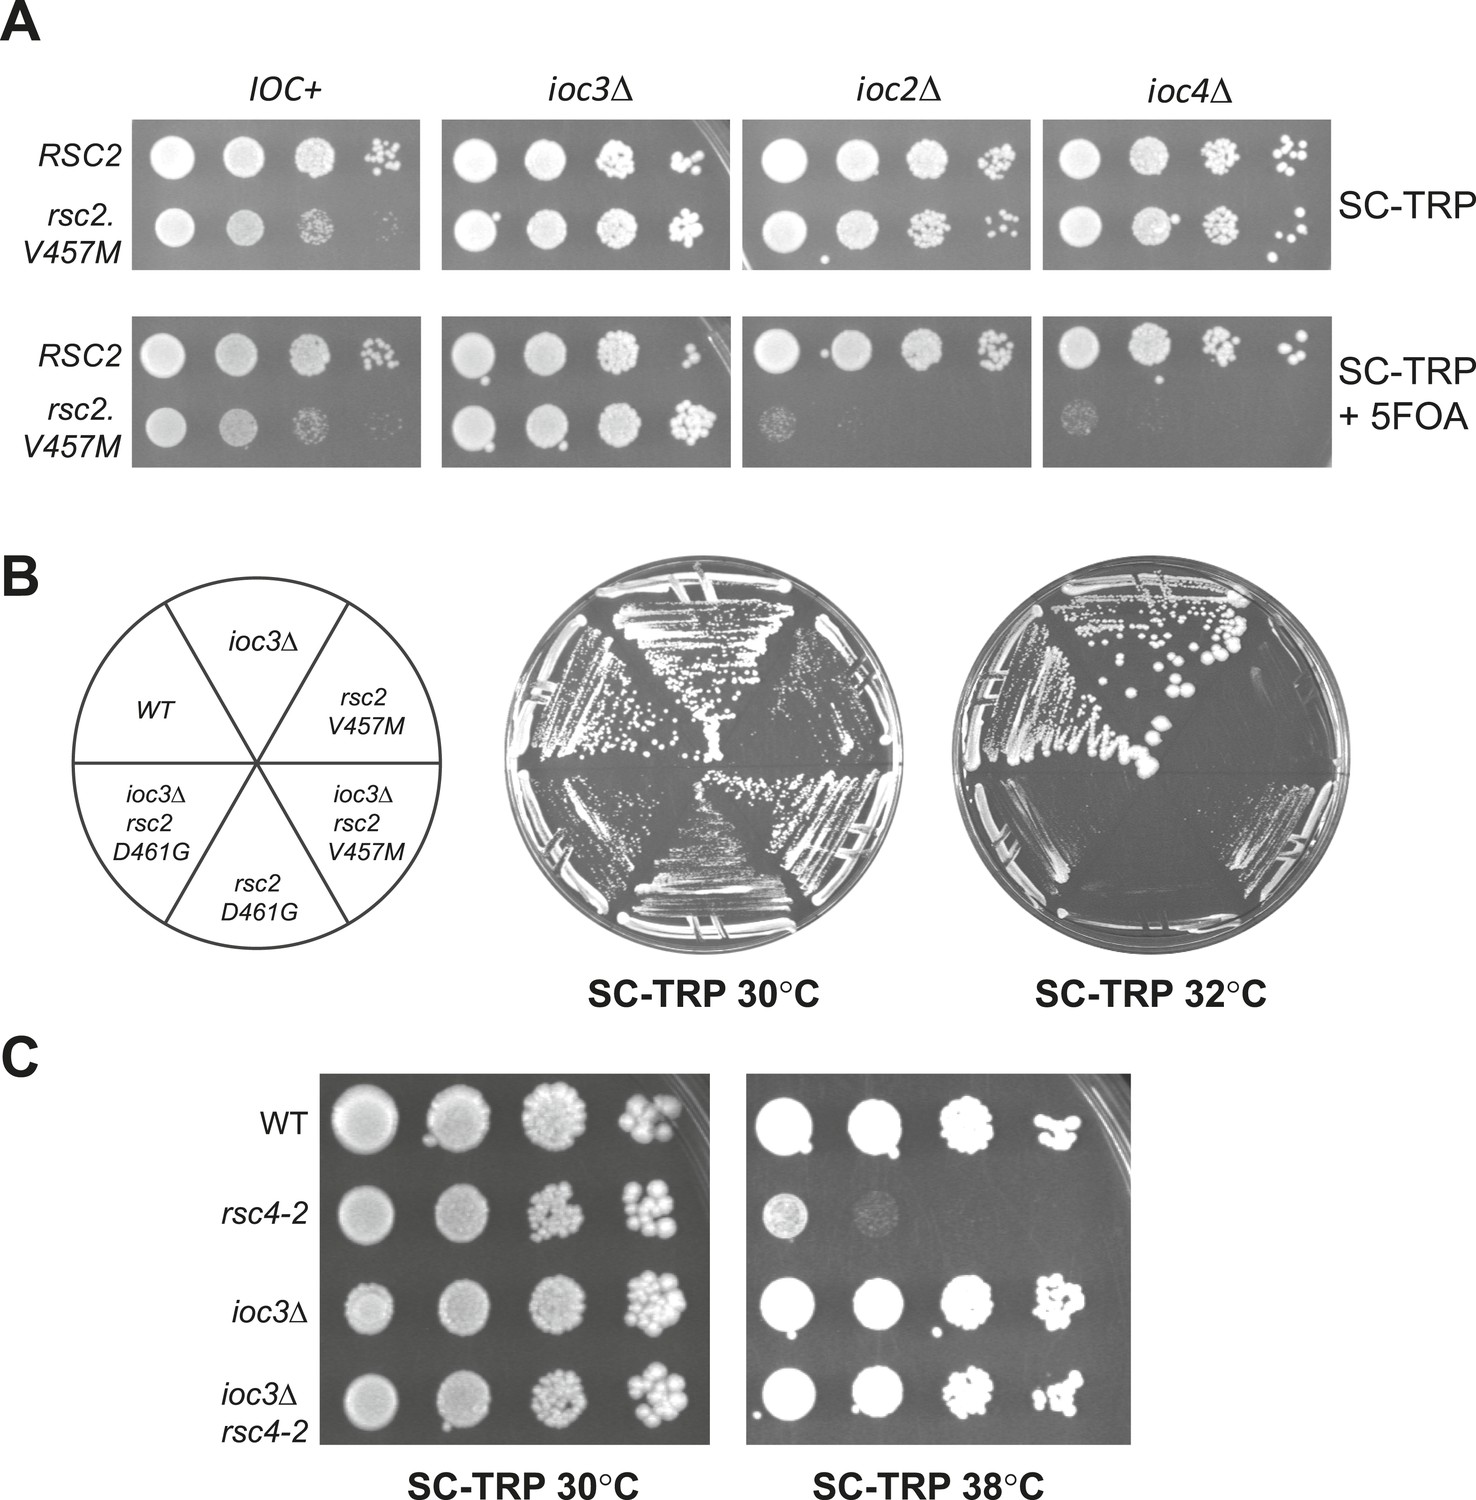
Suppression of RSC mutants is specific to Isw1a.
(A) rsc2-V457M is lethal in combination with ioc2Δ and ioc4Δ, but not ioc3Δ. YBC803 (rsc1Δ rsc2Δ [RSC1.URA3]), YBC2730 (rsc1Δ rsc2Δ ioc3Δ [RSC1.URA3]), YBC2729 (rsc1Δ rsc2Δ ioc2Δ [RSC1.URA3]), and YBC2731 (rsc1Δ rsc2Δ ioc4Δ [RSC1.URA3]) were transformed with TRP1-marked RSC2 (p604) or rsc2-V457M (p776), and spotted as 10-fold dilutions to SC-TRP 30°C or SC-TRP + 5FOA 30°C. (B) rsc2 Ts mutations can be partially suppressed by ioc3Δ. YBC803 (rsc1Δ rsc2Δ [RSC1.URA3]) and YBC 2730 (rsc1Δ rsc2Δ ioc3Δ [RSC1.URA3]) were transformed with TRP1-marked RSC2 (p604), rsc2-V457M (p776), or rsc2-D461G (p777), streaked to SC-TRP + 5FOA to force loss of the RSC1 plasmid, and then streaked to SC-TRP at 30°C or 32°C. (C) rsc4-2 is suppressed by ioc3Δ. Strain YBC627 (rsc4 [RSC4.URA3]) and YBC3020 (rsc4Δ ioc3Δ [RSC4.URA3]) were transformed with TRP1-marked RSC4 (p1060) or rsc4-2 (p1083), streaked to SC-TRP + 5FOA to lose RSC4.URA3, and then spotted as 10-fold serial dilutions to SC-TRP 30°C or SC-TRP 38°C. Figure 3—figure supplement 1 shows suppression of rsc1 mutants by ioc3Δ. Figure 3—figure supplement 2 shows the suppression of rsc2 synthetic lethality with set1Δ and gcn5Δ by mutations in ISW1a.
Figure 3—figure supplement 1
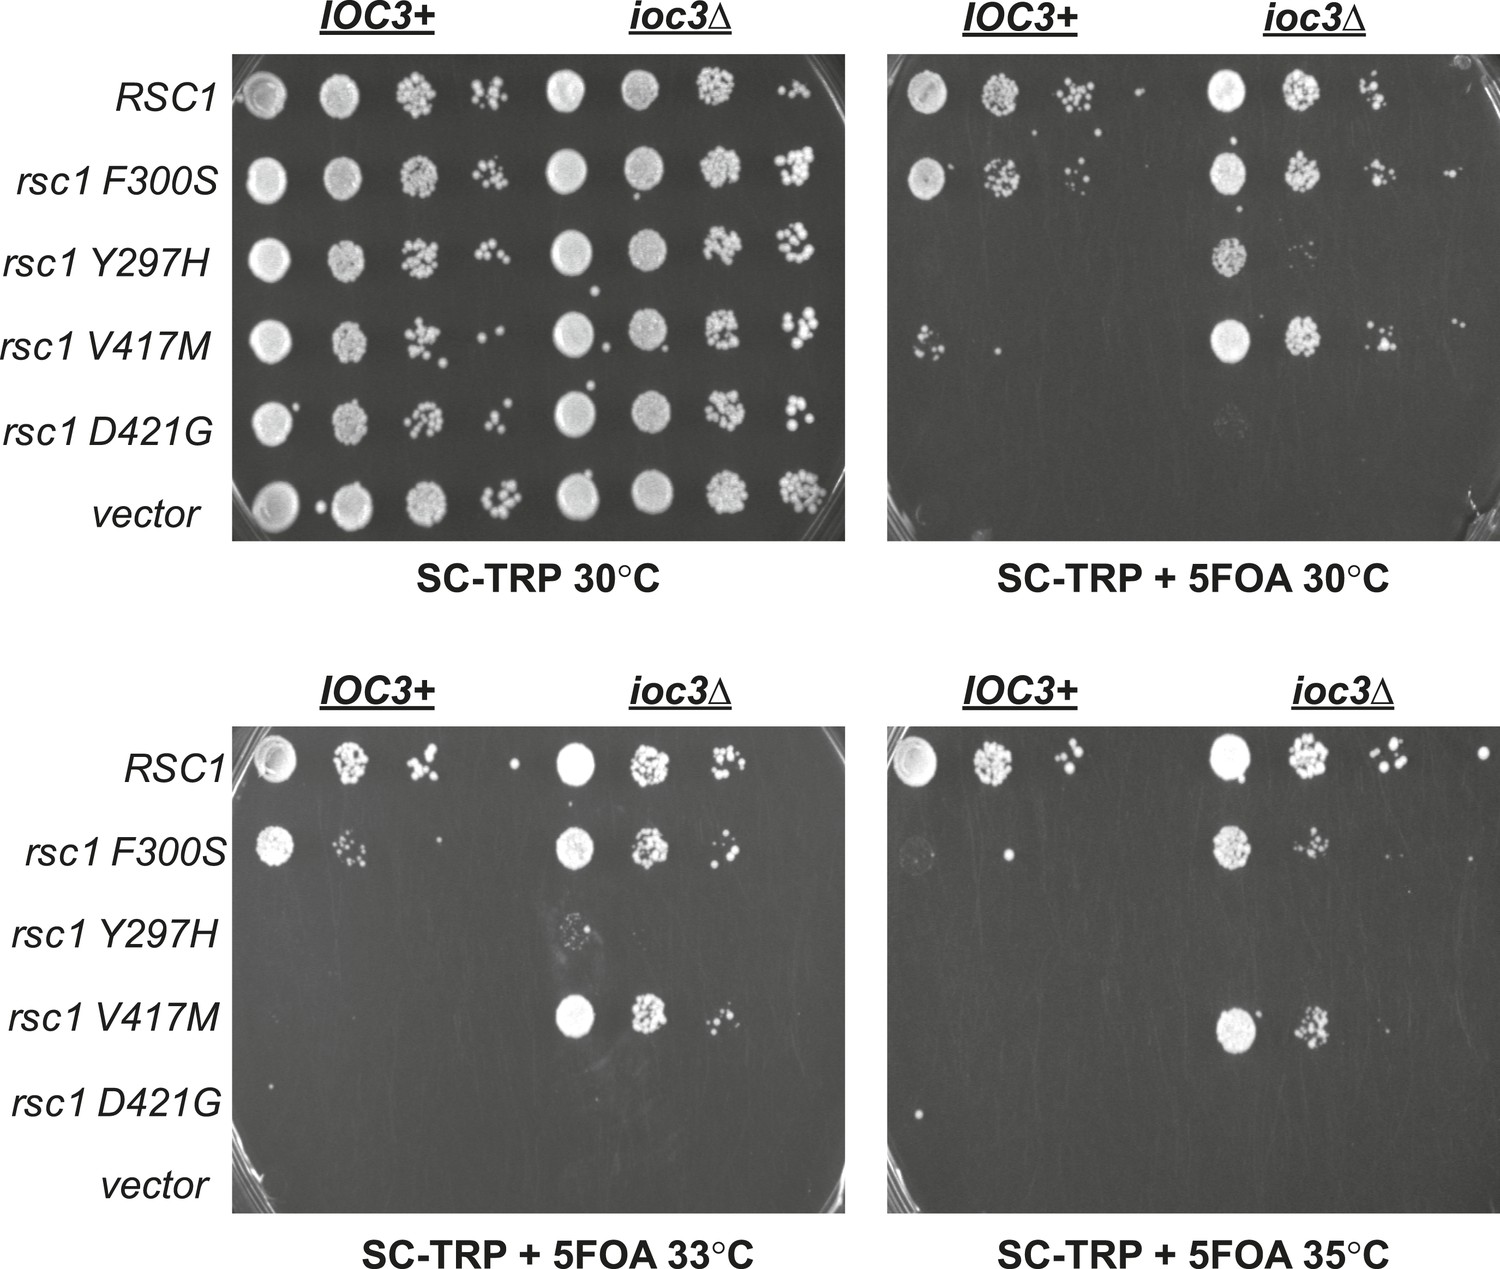
Mutations in RSC1 are suppressed by ioc3Δ.
An IOC3+ strain (YBC803; rsc1Δ rsc2Δ [RSC1.URA3]) and an ioc3Δ strain (YBC2730; rsc1Δ rsc2Δ ioc3Δ [RSC2.URA3]), were transformed with TRP1 marked RSC1 (p609), rsc1-F300S (p1525), rsc1-Y297H (p1526), rsc1-V417M (p1527), rsc2-D421G (p1528), or vector (pRS314), and spotted as tenfold dilutions to SC-TRP, or SC-TRP + 5FOA to force loss of the RSC1 or RSC2 plasmid, and growth was assessed at 30°C, 33°C, and 35°C.
Figure 3—figure supplement 2
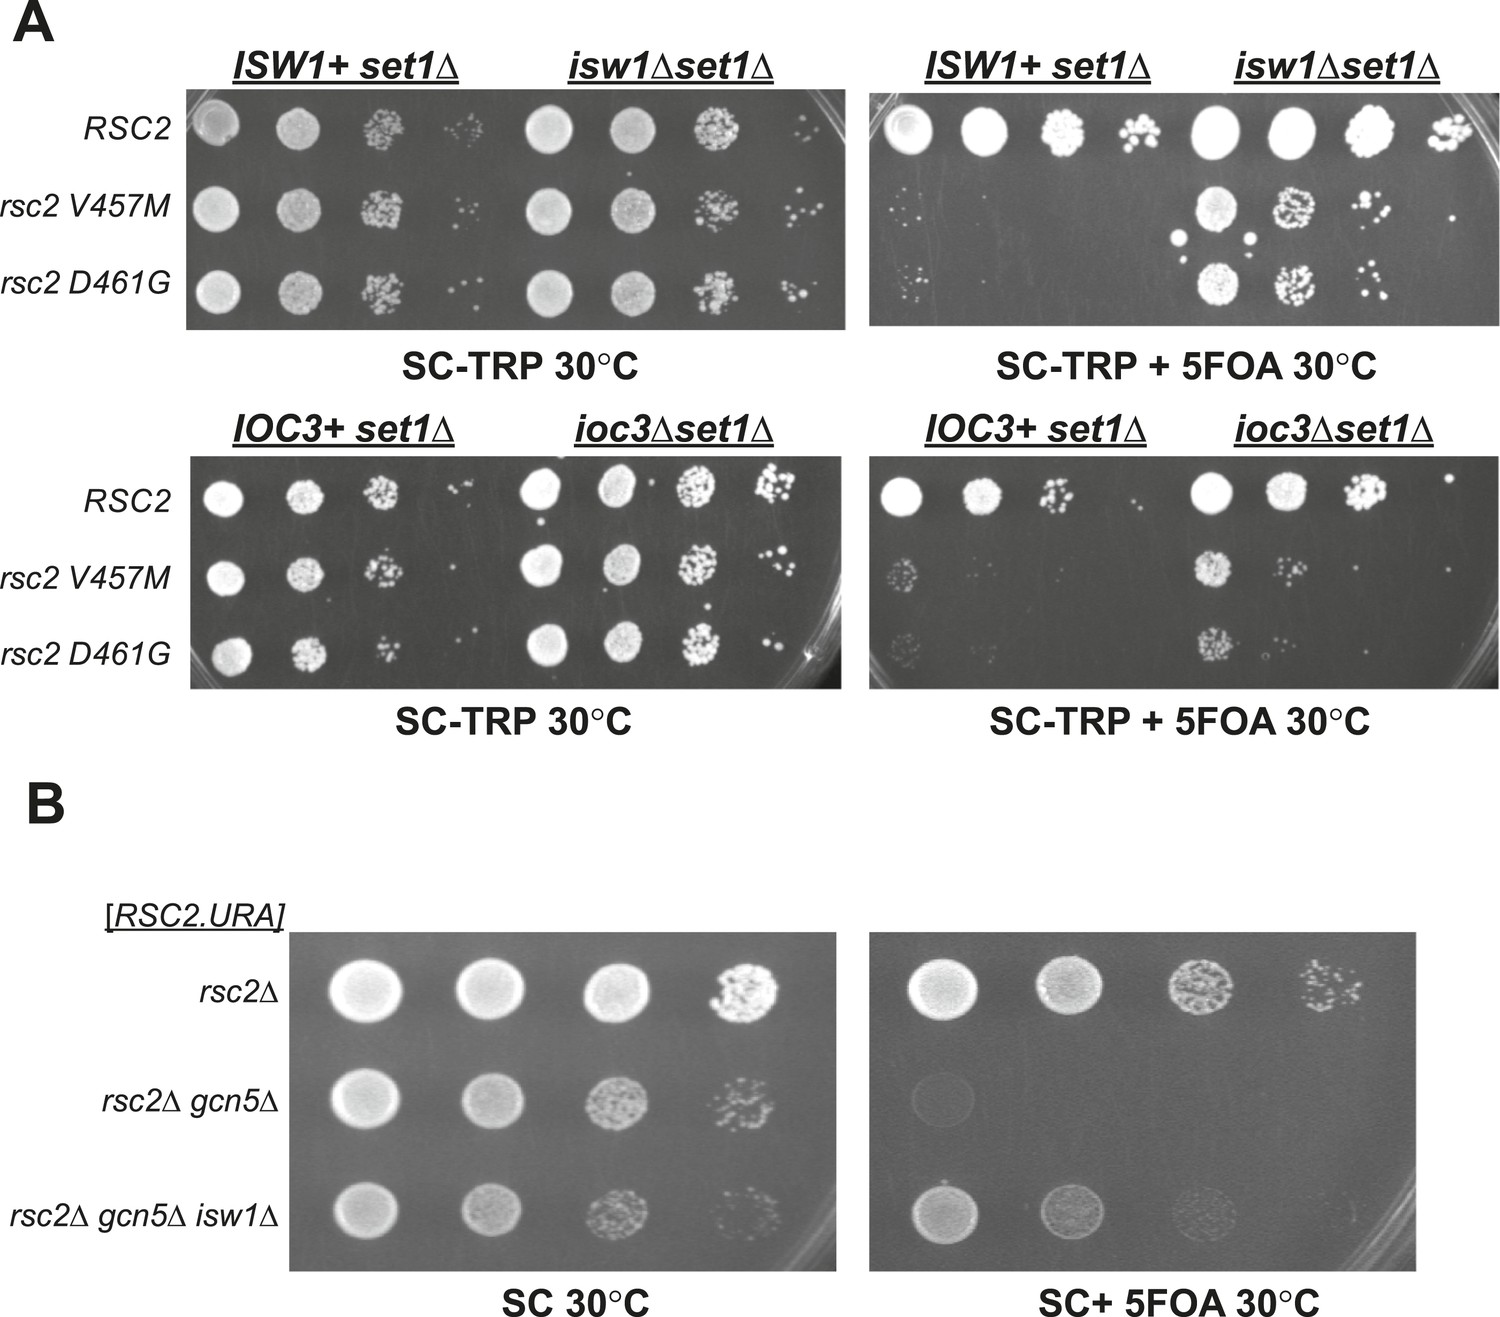
Synthetic lethality of rsc2 mutations with set1Δ and gcn5Δ can be suppressed by isw1 and ioc3.
(A) Mutations in rsc2 that are synthetic lethal with loss of Set1 (the sole H3 K4 methyltransferase in yeast) are suppressed by null mutations in ISW1 and IOC3. Strains with rsc1Δ rsc2Δ set1Δ [RSC1.URA3] (YBC1245) were combined with isw1Δ (YBC2744) or ioc3Δ (YBC2803), transformed with TRP1-marked plasmids RSC2 (p604), rsc2-V457M (p776), or rsc2-D461G (p777), and spotted as 10-fold serial dilutions to SC-TRP and SC-TRP + 5FOA (to enforce loss of the RSC1 plasmid) at 30°C. Additionally, we combined each of the rsc2 isw1Δ mutant combinations with hyperactive Set1D alleles (Schlichter and Cairns, 2005) and did not see further suppression (data not shown). (B) Synthetic lethality of rsc2Δ with loss of the histone acetyltransferase Gcn5 is suppressed by isw1Δ. YBC3496 (rsc2Δ), YBC 3494 (rsc2Δ gcn5Δ), and YBC3495 (rsc2Δ gcn5Δ isw1Δ) each covered with [p199; RSC2.URA3] were spotted as 10-fold serial dilutions to SC 30°C and SC + 5FOA 30°C.
Figure 4 with 2 supplements
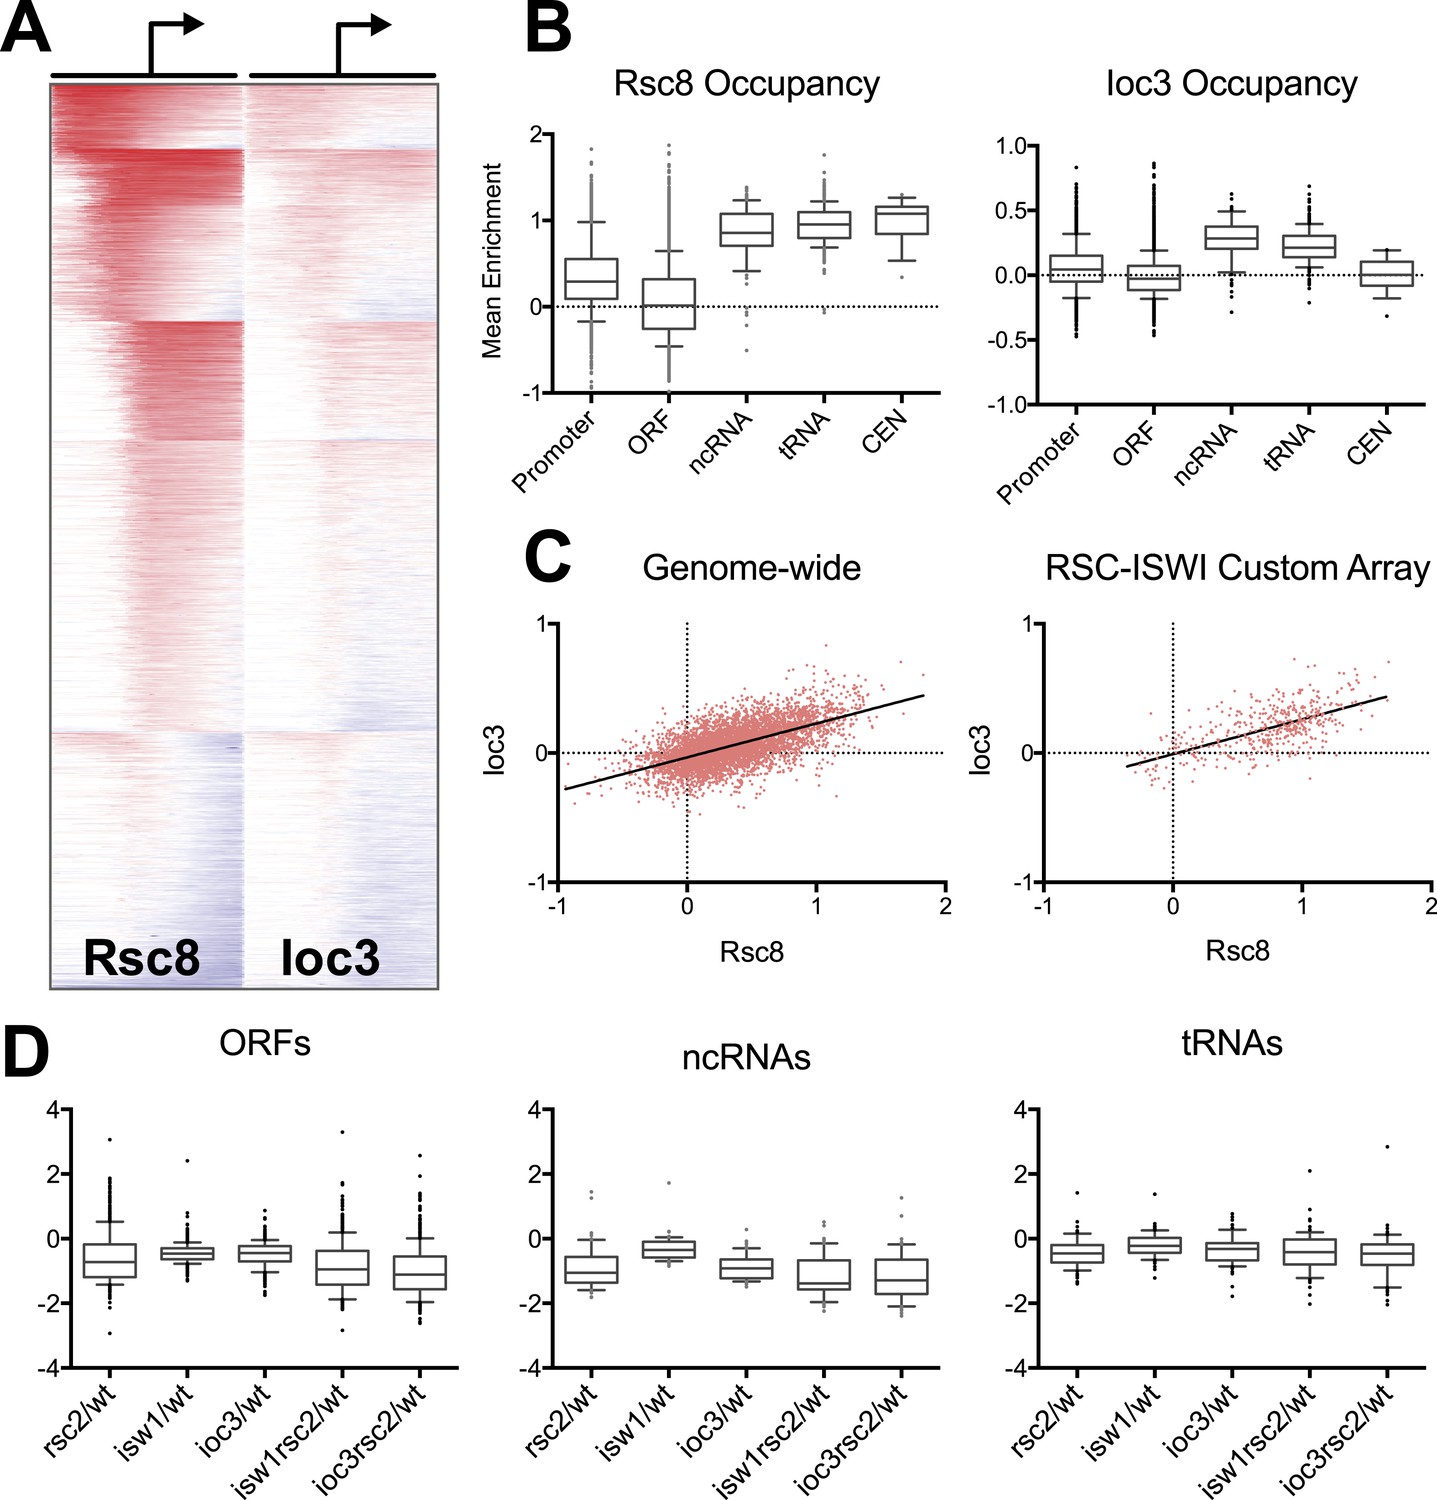
RSC and ISW1a co-occupy many locations, and their loss impacts gene expression in a complex manner.
(A) Heat map of Rsc8 and Ioc3 protein occupancy as determined by ChIP at all TSS. Each row represents a gene, with occupancy scored in 50 bp windows, ±800 bp relative to the TSS (bent arrow). Windows overlapping neighboring genes are excluded. Occupancy above global mean is indicated in red, below in blue. Genes are clustered by a k-means algorithm into 6 groups. (B) The distributions of mean Rsc8 and Ioc3 occupancy values shown as box and whisker plots for different annotation features. (C) The correlation between Rsc8 and Ioc3 at promoters shown as a XY plot, either genome-wide or restricted to the 500 coding genes selected for the custom HybMap microarray. (D) The distribution of the mean mutant/wild-type gene expression ratios as determined by the HybMap microarray for three classes of gene types are presented as box and whisker plots. Figure 4—figure supplement 1 compares the ChIP results obtained from microarray vs deep sequencing. Figure 4—figure supplement 2 displays the genes that appear suppressed by isw1Δ or ioc3Δ as determined by HybMap.
Figure 4—figure supplement 1
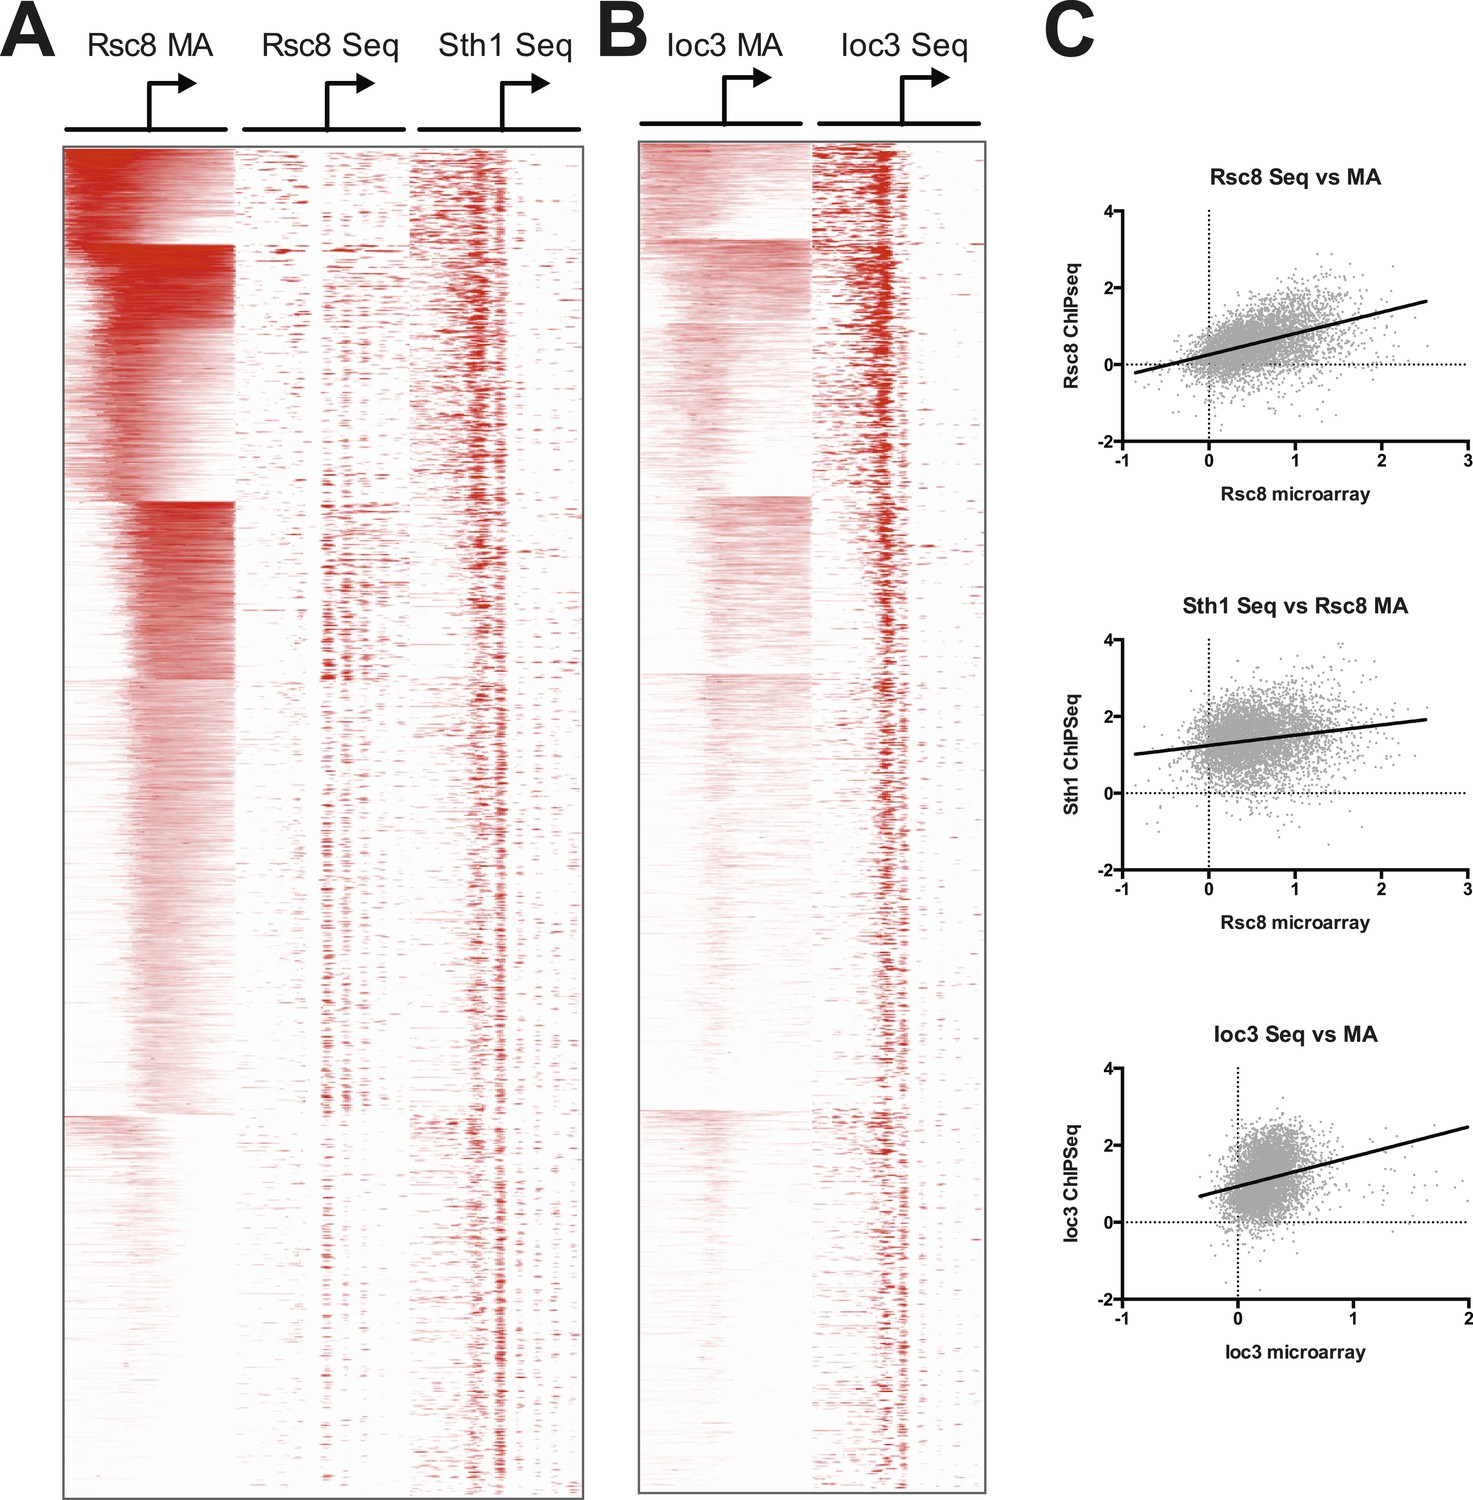
RSC and ISW1a occupancy correlate between microarray and sequence studies.
Heat map of RSC (A) and ISW1a (B) occupancies. RSC occupancy was determined by Rsc8 ChIP applied to microarray (MA), Rsc8 ChIP paired-end sequencing (Seq), and Sth1 paired-end sequencing. ISW1a occupancy was determined by Ioc3 ChIP applied to microarray and Ioc3 ChIP paired-end sequencing. Occupancy, expressed as log2 fold enrichment over input, was measured in 20 bp windows flanking the TSS ±800 bp; windows overlapping neighboring genes were excluded. Genes were organized into six clusters using a k-means algorithm based on the Rsc8 microarray occupancy and is identical to Figure 4. Only windows with positive (enriched) values (red) are plotted to simplify visualization. (C) To show correlation between the microarray and sequencing data sets, the maximum occupancy value for each gene determined in a 500 bp window encompassing the TSS (±250 bp) was plotted as a pairwise scatter plot, with the microarray data set on the X axis for each plot. A linear regression line is plotted as a thick black line.
Figure 4—figure supplement 2
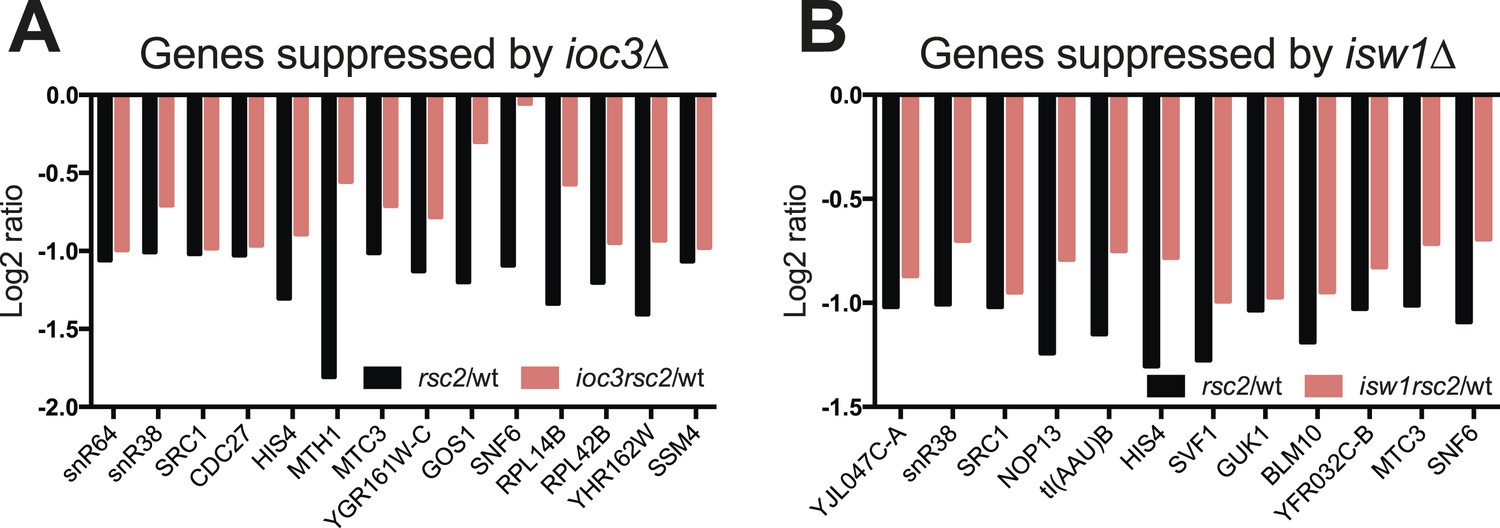
Some genes show transcriptional suppression in rsc2 isw1Δ double mutants.
The change in expression relative to wild type as determined by HybMap are presented. (A) The 14 (ioc3Δ) genes that appear downregulated in the single rsc2 mutant (black bars) and suppressed in the double mutants (red bars). (B) The 12 (isw1Δ) genes that appear downregulated in the single rsc2 mutant (black bars) and suppressed in the double mutants (red bars).
Figure 5 with 1 supplement

Loss of ISW1 partially suppresses nucleosomal changes exhibited by loss of RSC function.
(A) The promoter profile of nucleosome occupancy ratios between sth1td degron (rscΔ) and control (RSC) strains is presented as a heat map, where red represents a gain in nucleosome occupancy and blue represents a loss. Genes (rows) are organized into six groups by k-means clustering. Columns represent 50 bp windows, ±800 bp relative to the TSS. Windows overlapping neighboring genes are excluded. (B, C, D) The mean profiles of nucleosome occupancies for all genes within each cluster are shown. Profiles from mutant backgrounds are shown in red, and wild-type profiles are shown in blue. The y-axis represents log2 occupancy relative to genome average. Figure 5—figure supplement 1 compares the nucleosome profiles obtained from microarray and deep sequencing, as well as the predicted nucleosome occupancy.
Figure 5—figure supplement 1
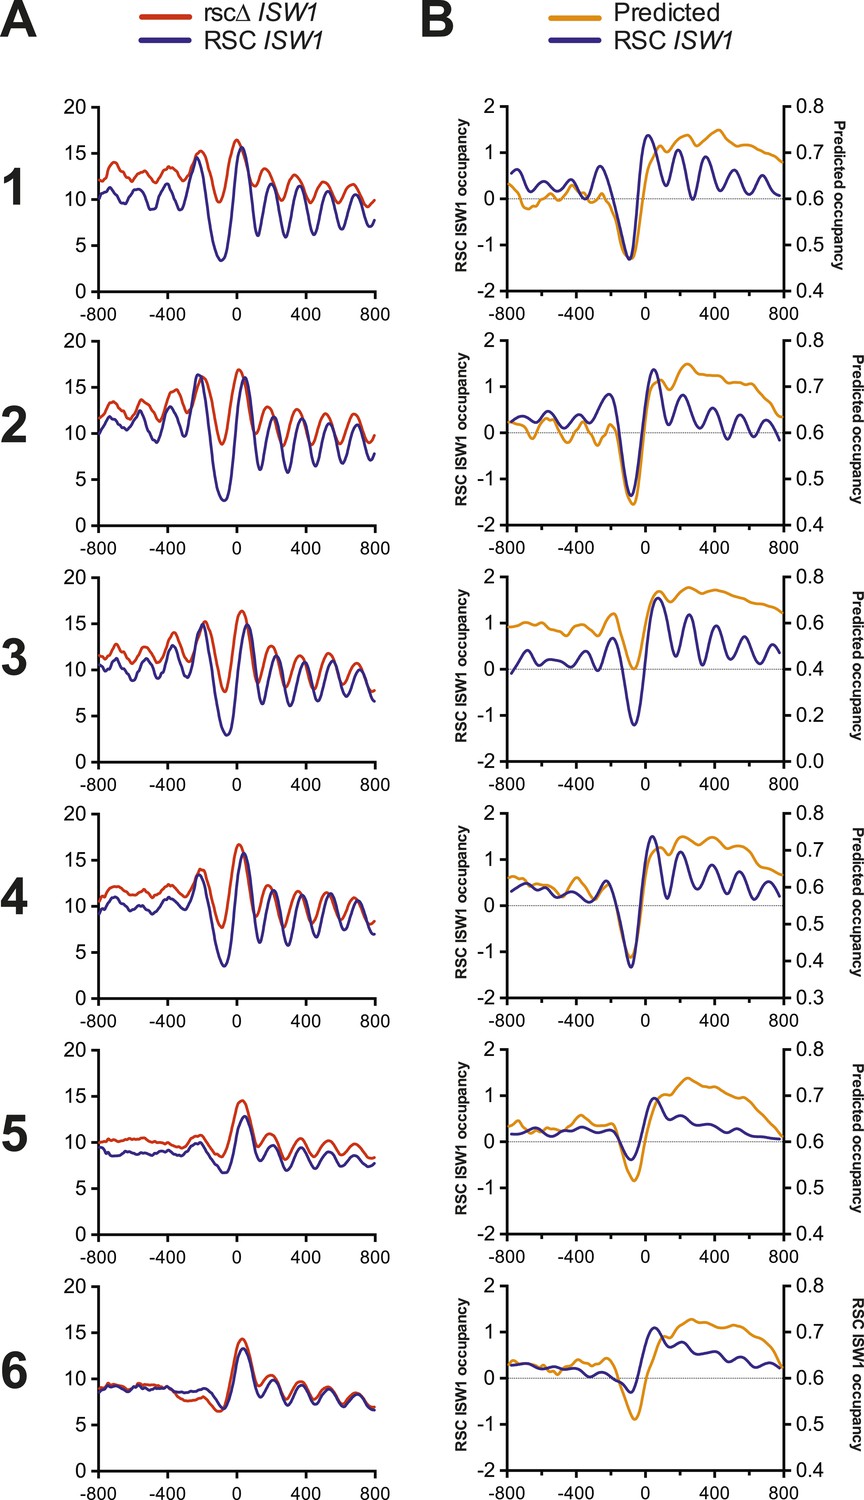
Nucleosome profiles from microarray and sequencing show strong correlation with each other and predicted occupancy.
(A) The mean nucleosome profiles for each of the six gene clusters derived in Figure 5 are shown using data derived from paired-end sequencing. (B) The predicted mean nucleosome profile (Segal et al., 2006) is shown in orange along with the observed wild-type nucleosome occupancy derived from microarray.
Figure 6 with 2 supplements
Gene clusters identified by their response to RSC loss reveal different promoter classes.
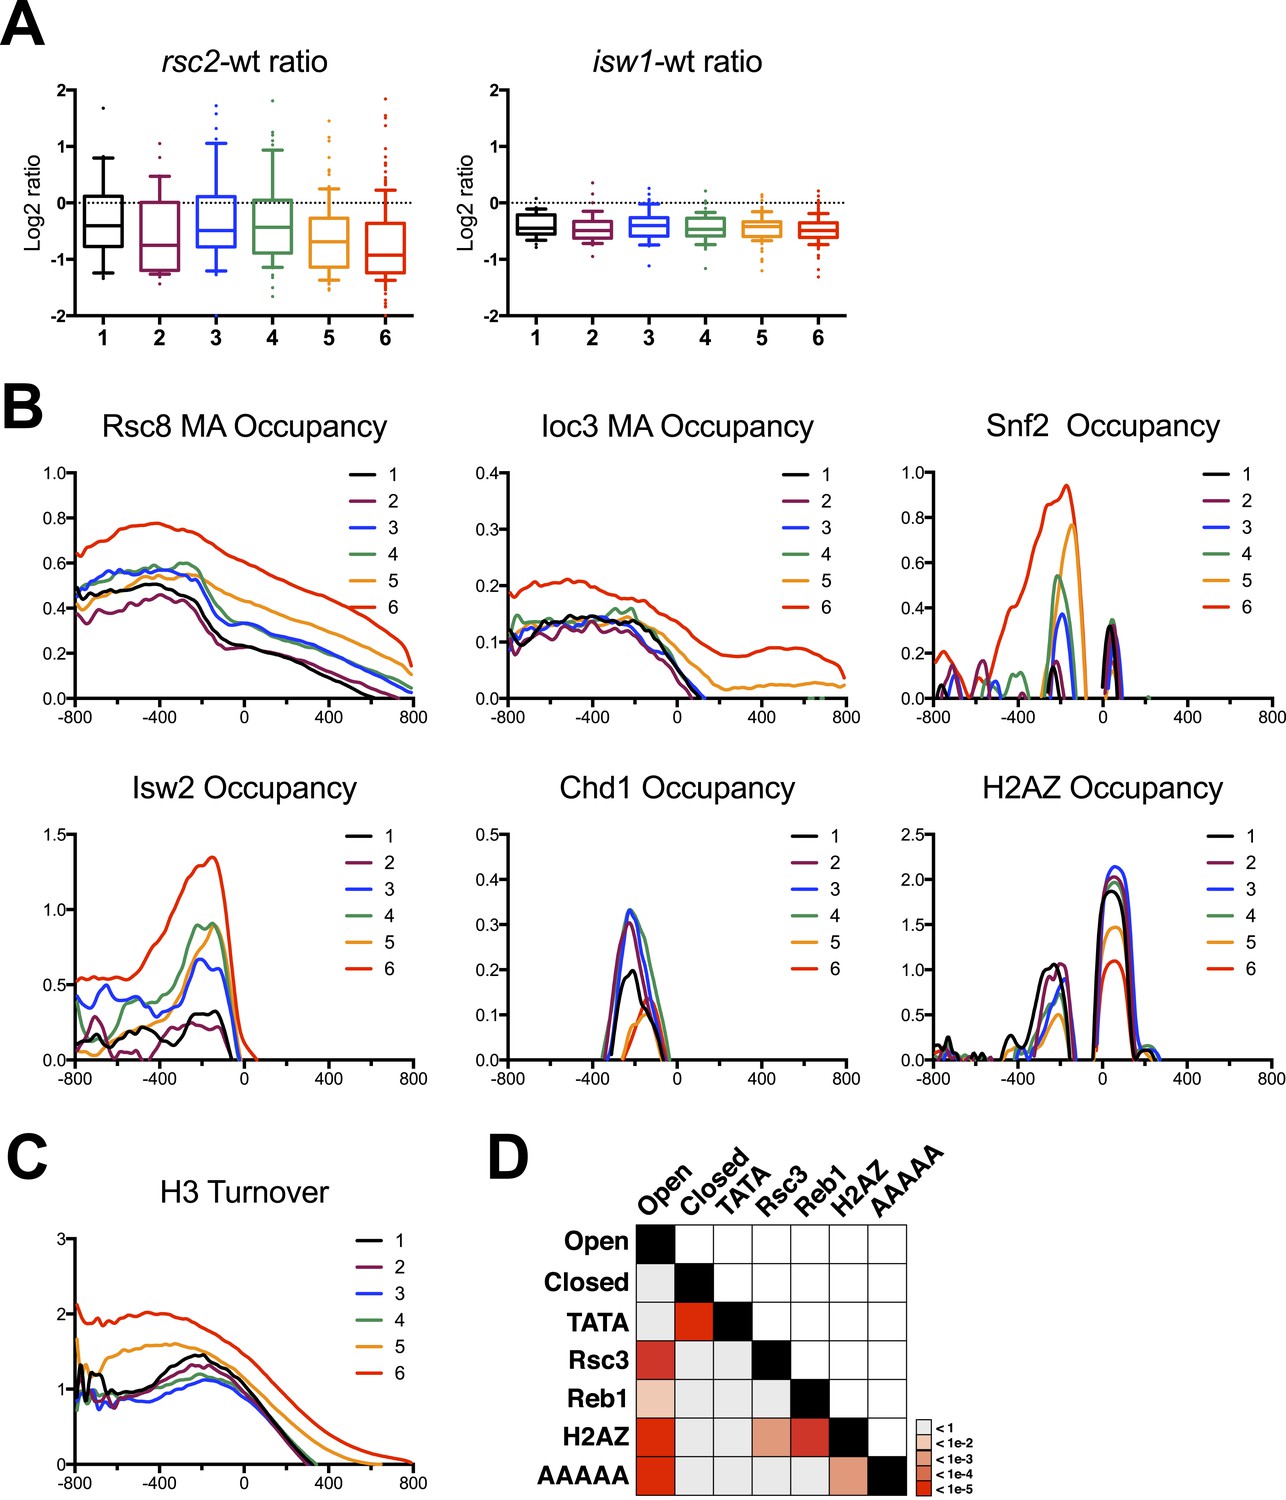
(A) The relative expression in rsc2 (left) or isw1Δ (right) mutants relative to wild type as measured by the HybMap assay are plotted as box and whisker distribution plots for each of the six gene clusters identified by their response to RSC loss. (B) The mean occupancy profile over each of the six gene clusters is presented for six different factors, including RSC, ISW1, SNF2, ISW2 (Zentner and Henikoff, 2013), CHD1 (Zentner and Henikoff, 2013), and H2AZ (Albert et al., 2007). (C) The mean profile for histone turnover over the six gene clusters is shown. Higher values represent higher turnover. (D) Heat map representing the p-value significance for the intersection between genes in different categories. Open promoters include genes in clusters 1–4. Closed promoters include genes in clusters 5 and 6. Figure 6—figure supplement 1 shows the distribution of normal gene expression for each of the clusters. Figure 6—figure supplement 2 shows the occupancy profile for RSC and ISW1a as determined by deep sequencing.
Figure 6—figure supplement 1
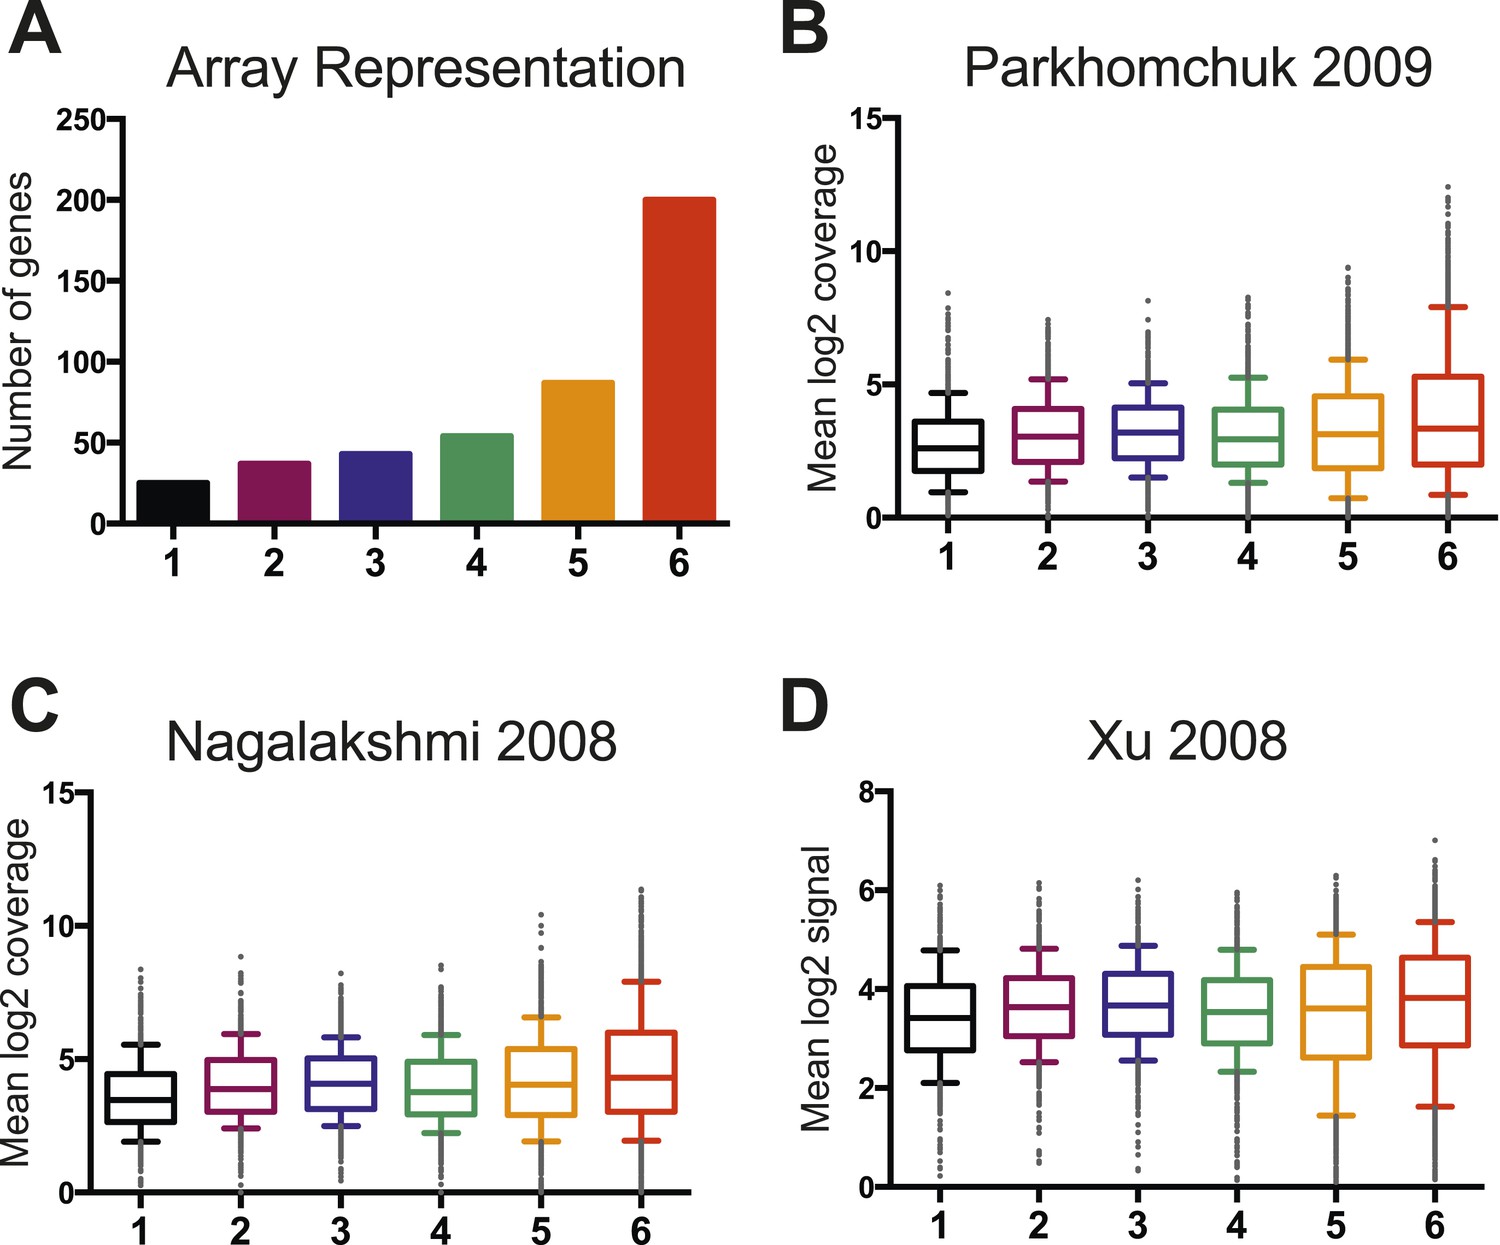
Wild-type RNA expression levels are not significantly different between the six clusters.
(A) A histogram displays the representation of genes from each cluster on the custom mini-HybMap microarray. Cluster 6 is over-represented because of higher levels of RSC occupancy at these genes. (B) A box and whisker plot representing the distribution of median log2 coverage from stranded RNA sequencing for genes in each cluster. Data are from (Parkhomchuk et al., 2009). (C) A box and whisker plot representing the distribution of median log2 coverage from unstranded RNA sequencing for genes in each cluster. Data are from (Nagalakshmi et al., 2008). (D) A box and whisker plot representing the distribution of median log2 coverage from stranded RNA microarray for genes in each cluster. Data are from (Xu et al., 2009).
Figure 6—figure supplement 2
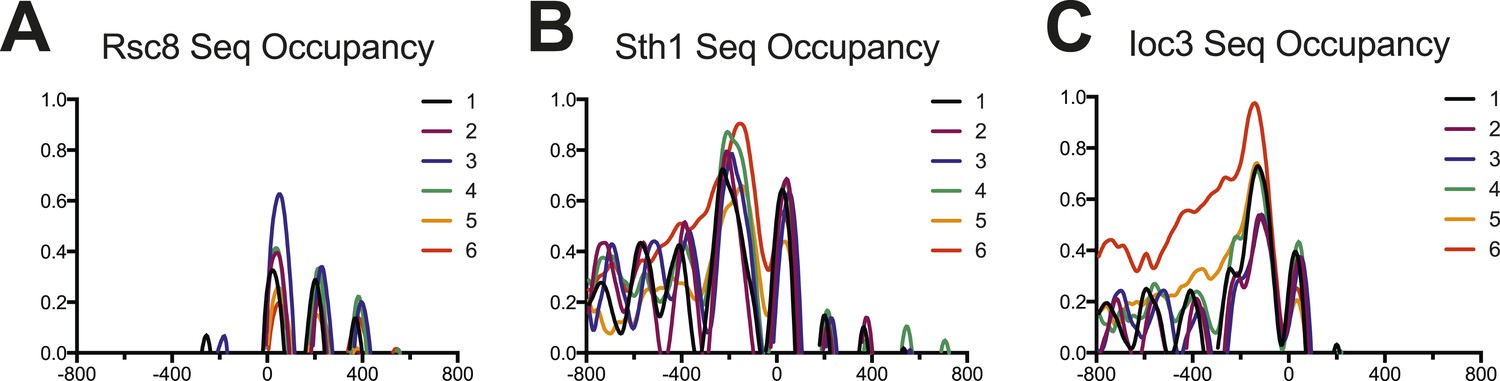
Occupancy of RSC and ISW1a as measured by sequencing.
Enrichment profiles for each of the six gene clusters derived in Figure 5 are shown for RSC (parts (A) and (B)) and ISW1a (part (C)). The profile for each cluster is drawn in a different color. Values are log2 fold enrichments over input and collected in 20 bp windows flanking the TSS ±800 bp. Windows overlapping neighboring genes were excluded. The Rsc8 enrichment shows strong enrichment for the +1 nucleosome but not upstream locations, possibly due to altered protein configurations or low efficiency. The Sth1 enrichment shows strong enrichment at both −1 and +1 nucleosomes, as well as a broad upstream enrichment for cluster 6, similar to the Rsc8 microarray. The Ioc3 enrichment also shows a broad enrichment over the upstream region for cluster 6.
Figure 7
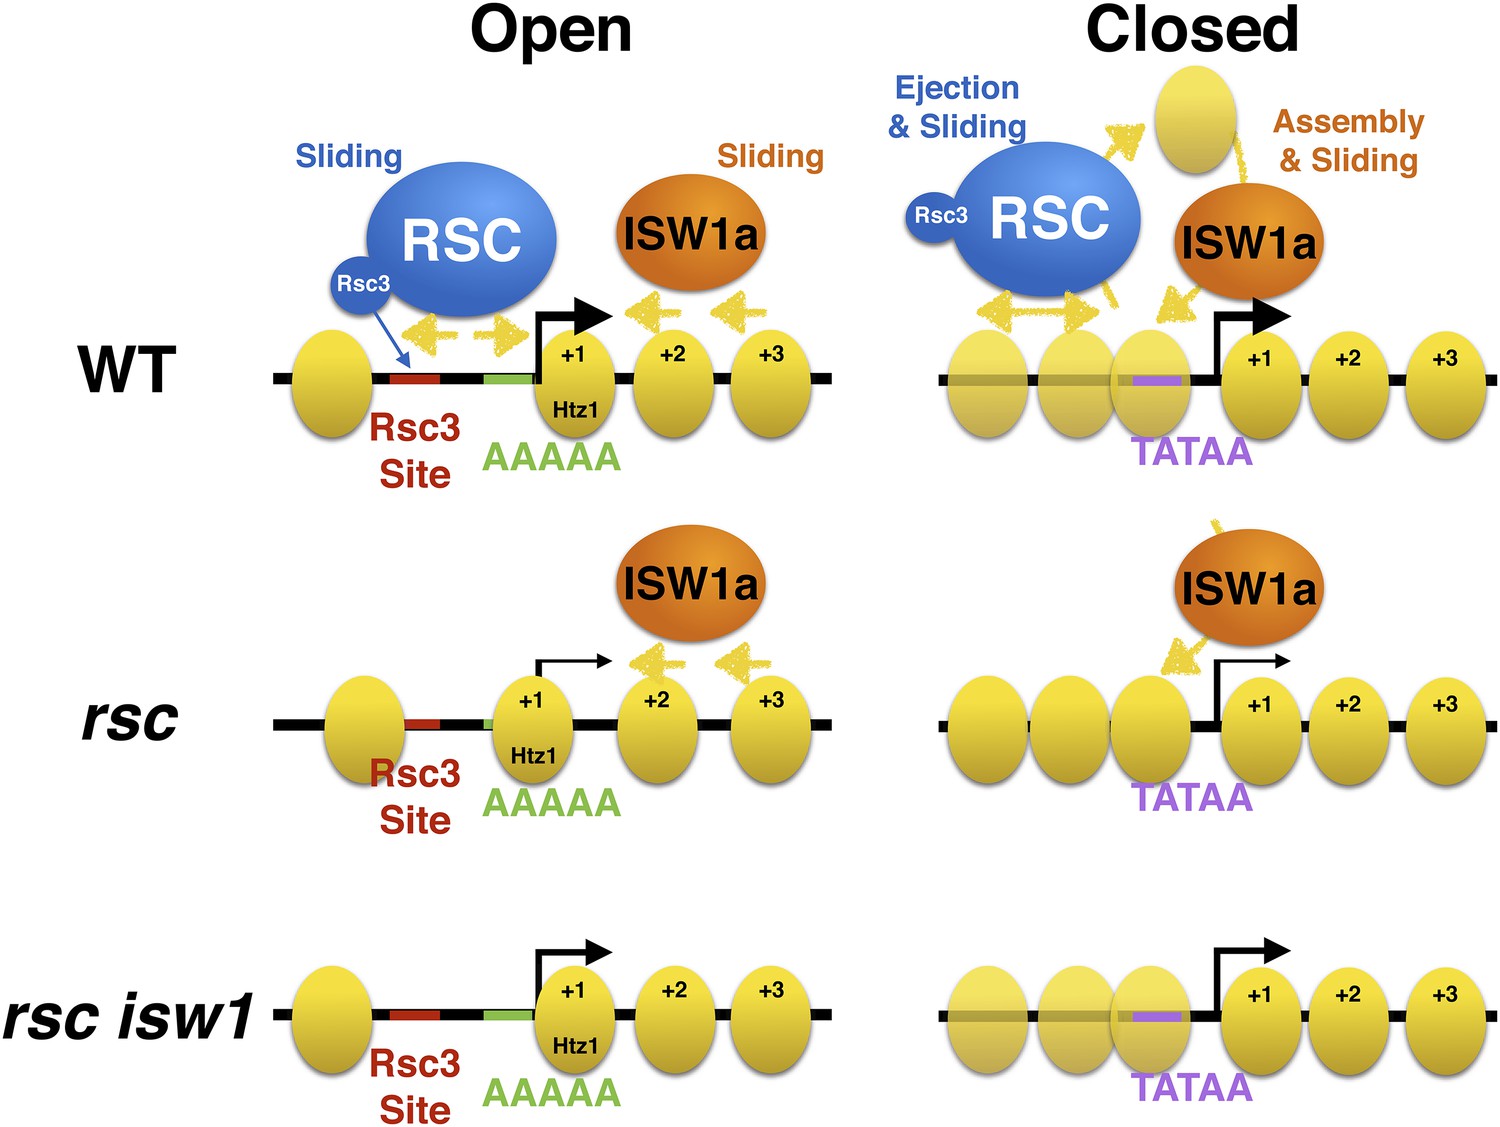
Model of action by RSC and ISWI remodelers at open and closed promoters.
An open or structured promoter is depicted on the left with regularly spaced nucleosomes (yellow ovals) and a predominate NDR that frequently contains sequence elements (colored lines), including Rsc3 and Reb1 binding sites as well AT-rich sequence tracts unfavorable to nucleosome formation. Remodelers such as RSC (blue oval) help to maintain nucleosome deficiency, while ISWIa (orange oval) antagonizes by ‘filling-in’ the NDR. (Note: Rsc3 is not required for RSC activity nor is Rsc3 required for all RSC recruitment.) In the absence of RSC, this filling-in occurs and is conducted by ISW1a, as filling-in is not observed in rsc isw1 double mutants. A closed or unstructured promoter is depicted on the right, evidenced by the lack of a clearly defined NDR and obscured promoter sequence elements, such as the TATA. Nucleosome density (or likelihood of occupancy) is depicted by the opacity of the nucleosomes. These promoters have increased nucleosome movement and histone turnover (yellow arrows), likely aided by chromatin remodelers such as RSC and ISWI, which eject or reposition nucleosomes, respectively. In the absence of RSC, nucleosome ejection is reduced, leading to higher nucleosome density (opaque nucleosomes) and a reduction in transcription. Additional loss of ISW1a may reduce the assembly/organization of nucleosomes in the promoter, partially restoring transcription.
Additional files
-
Supplementary file 1
Table of yeast strains. List of yeast strains and their genotypes used in this study.
- https://doi.org/10.7554/eLife.06073.019
-
Supplementary file 2
Table of plasmids. List of plasmid names and their sources used in this study.
- https://doi.org/10.7554/eLife.06073.020
Download links
A two-part list of links to download the article, or parts of the article, in various formats.
Downloads (link to download the article as PDF)
Open citations (links to open the citations from this article in various online reference manager services)
Cite this article (links to download the citations from this article in formats compatible with various reference manager tools)
The chromatin remodelers RSC and ISW1 display functional and chromatin-based promoter antagonism
eLife 4:e06073.
https://doi.org/10.7554/eLife.06073


