Inhibition of mutant EGFR in lung cancer cells triggers SOX2-FOXO6-dependent survival pathways
- Massachusetts General Hospital, Harvard Medical School, United States
- Howard Hughes Medical Institute, Massachusetts General Hospital, Harvard Medical School, United States
Figures
Figure 1 with 4 supplements
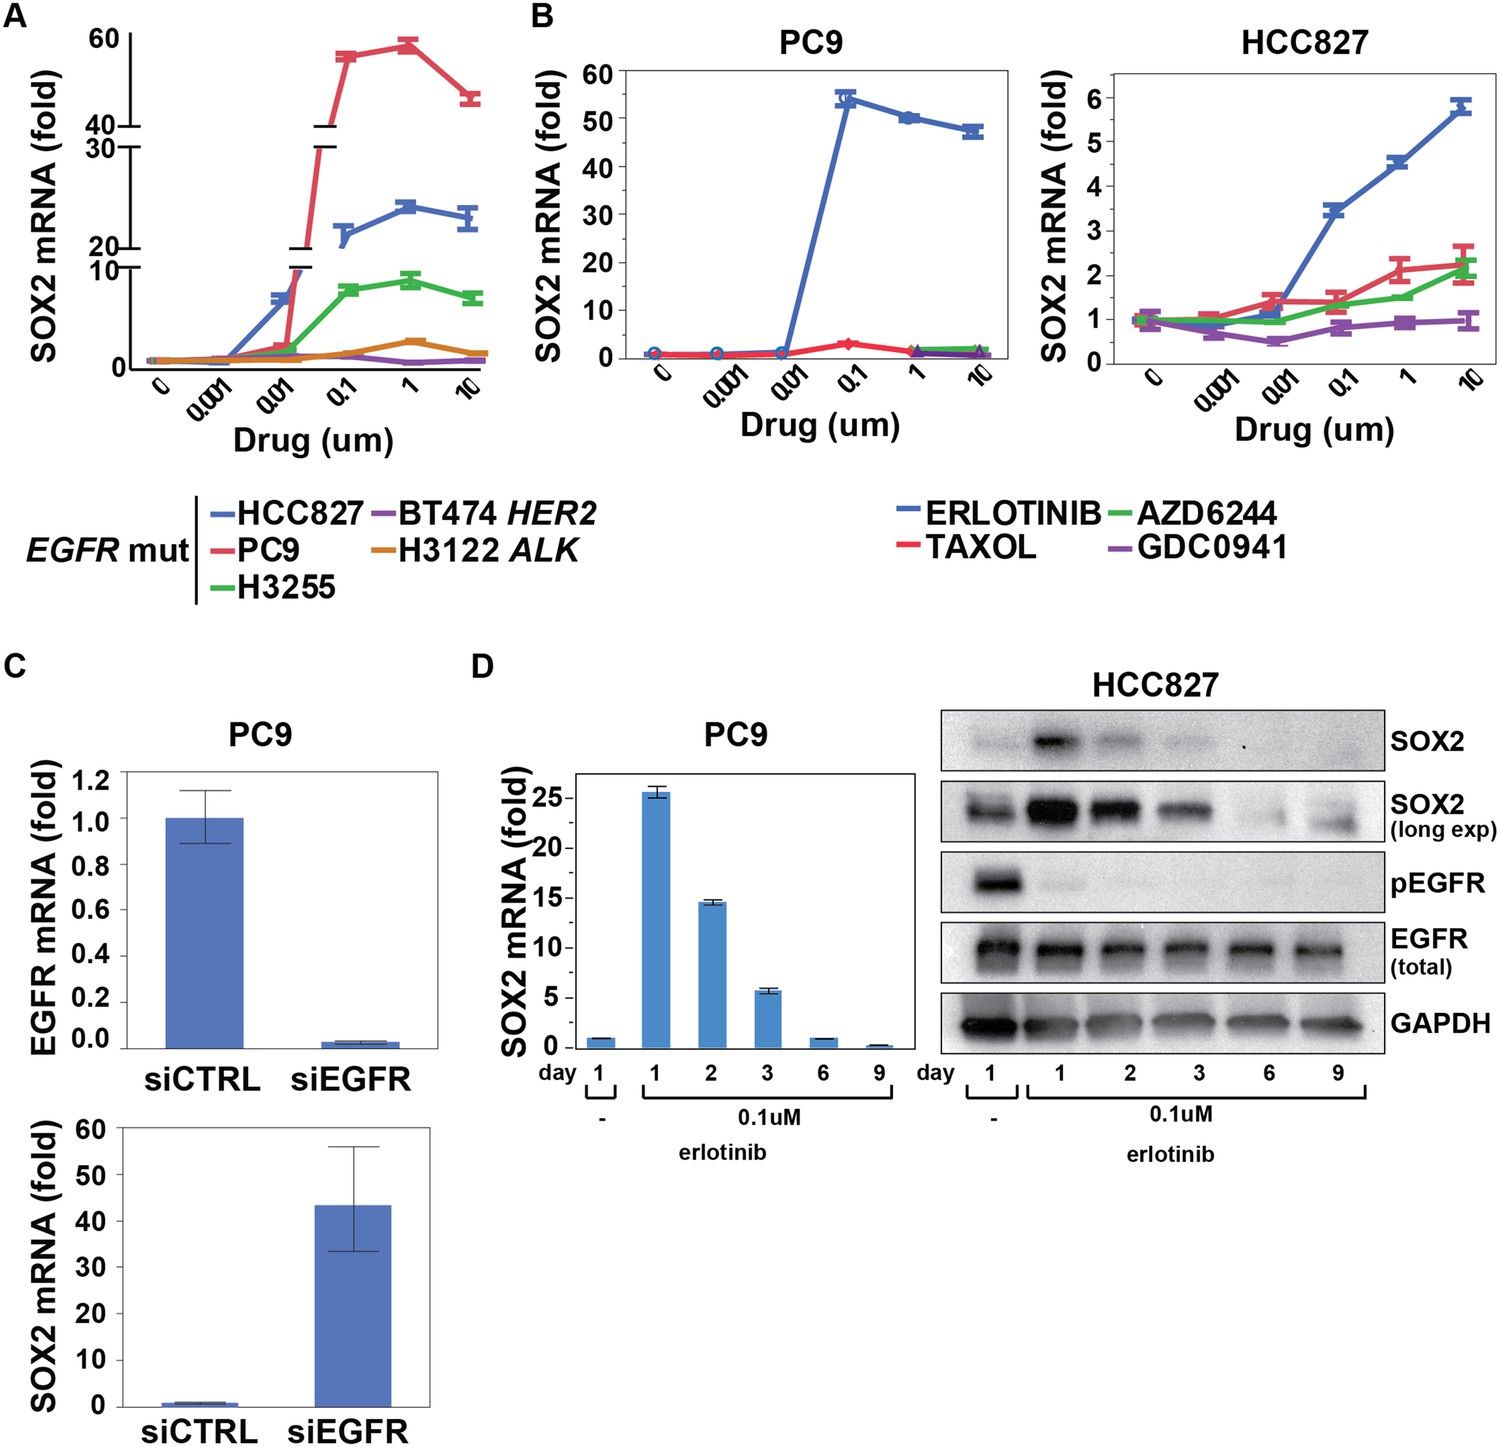
SOX2 transcript is specifically induced by erlotinib in EGFR-mutant and addicted lung cancer cell lines.
(A) Cell lines were treated with an inhibitor of the driving oncogenic lesion for 24 hr (erlotinib for EGFR-mutant, lapatinib for HER2-amplified and crizotinib for ALK-translocated cells), followed by isolation of total RNA and quantitative PCR for SOX2 transcript. (B) PC9 and HCC827 cells were treated with different agents, followed by quantitative PCR for SOX2. The IC50 for PC9 of erlotinib, taxol, AZD6244, and GDC0941 is 0.05, 0.005, 5, and >10 μM; for HCC827, 0.1, 0.01, >10, and 1 µM (data not shown). (C) PC9 cells were transfected with control siRNA or siRNA targeting EGFR. 48 hr after transfection, the levels of SOX2 and EGFR were determined by qPCR. (D) PC9 and HCC827 cells were treated continuously with 0.1 µM erlotinib for 9 days, with fresh media/drug added every 3 days. SOX2 level at each time point was analyzed by qPCR (left) or immunoblot (right). All qPCR data are displayed as mean Ct value (normalized to GAPDH and untreated cells) of 3–6 replicates −/+ SEM, with data in (C) normalized to untreated siCTRL cells.
Figure 1—figure supplement 1
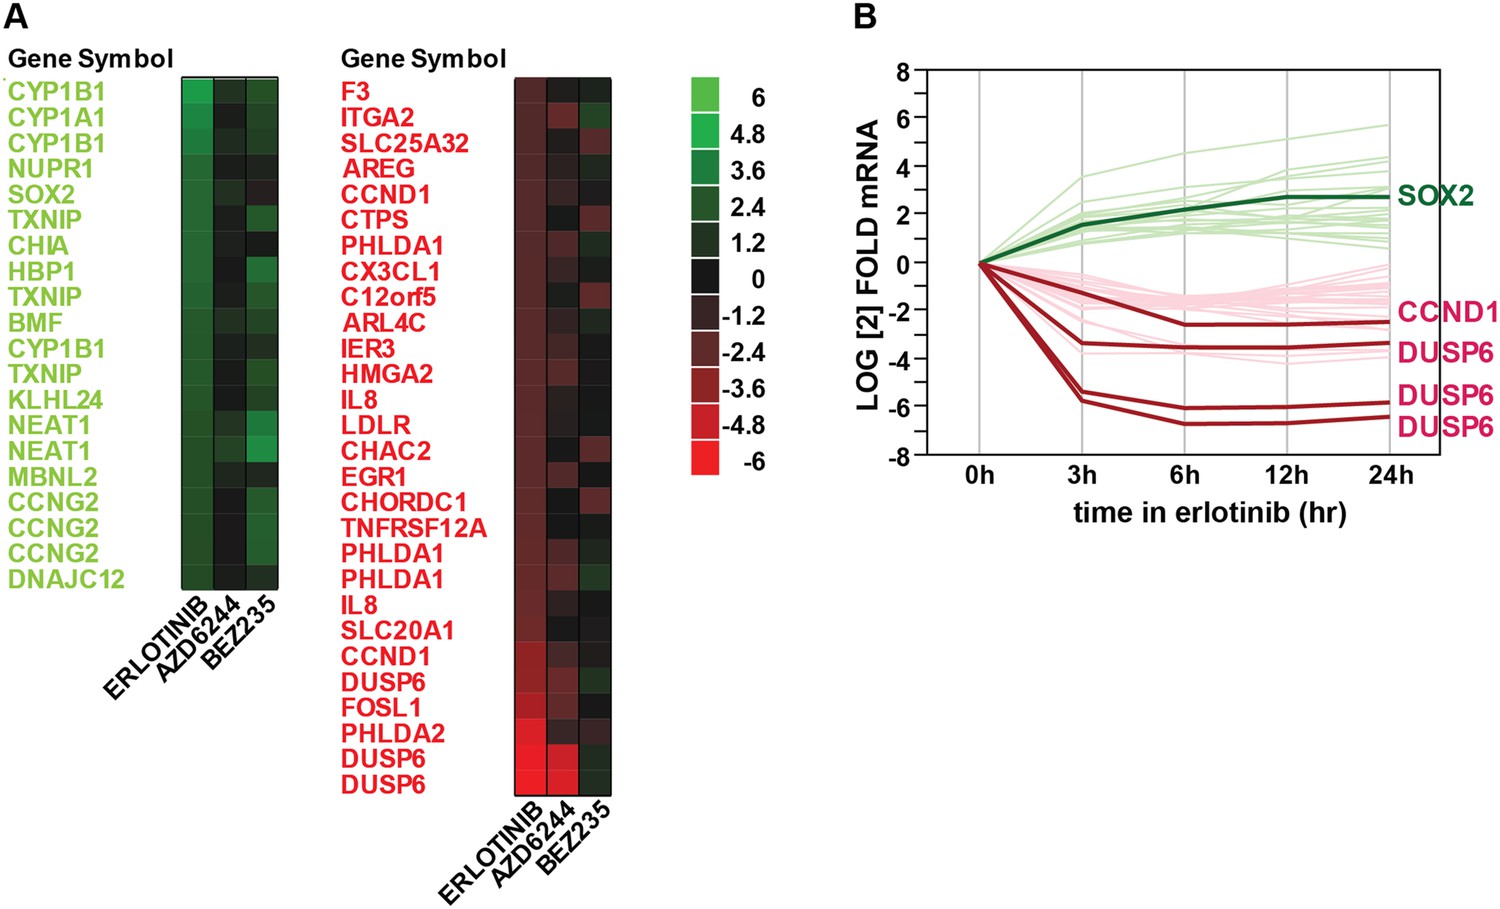
Gene expression profiling after erlotinib treatment.
(A) Heat map showing the list of fourfold significantly (FDR <0.05) upregulated (green) or downregulated (red) transcripts in HCC827 cells with erlotinib treatment. (B) Time course of changes in transcript levels for erlotinib-responsive genes.
Figure 1—figure supplement 2
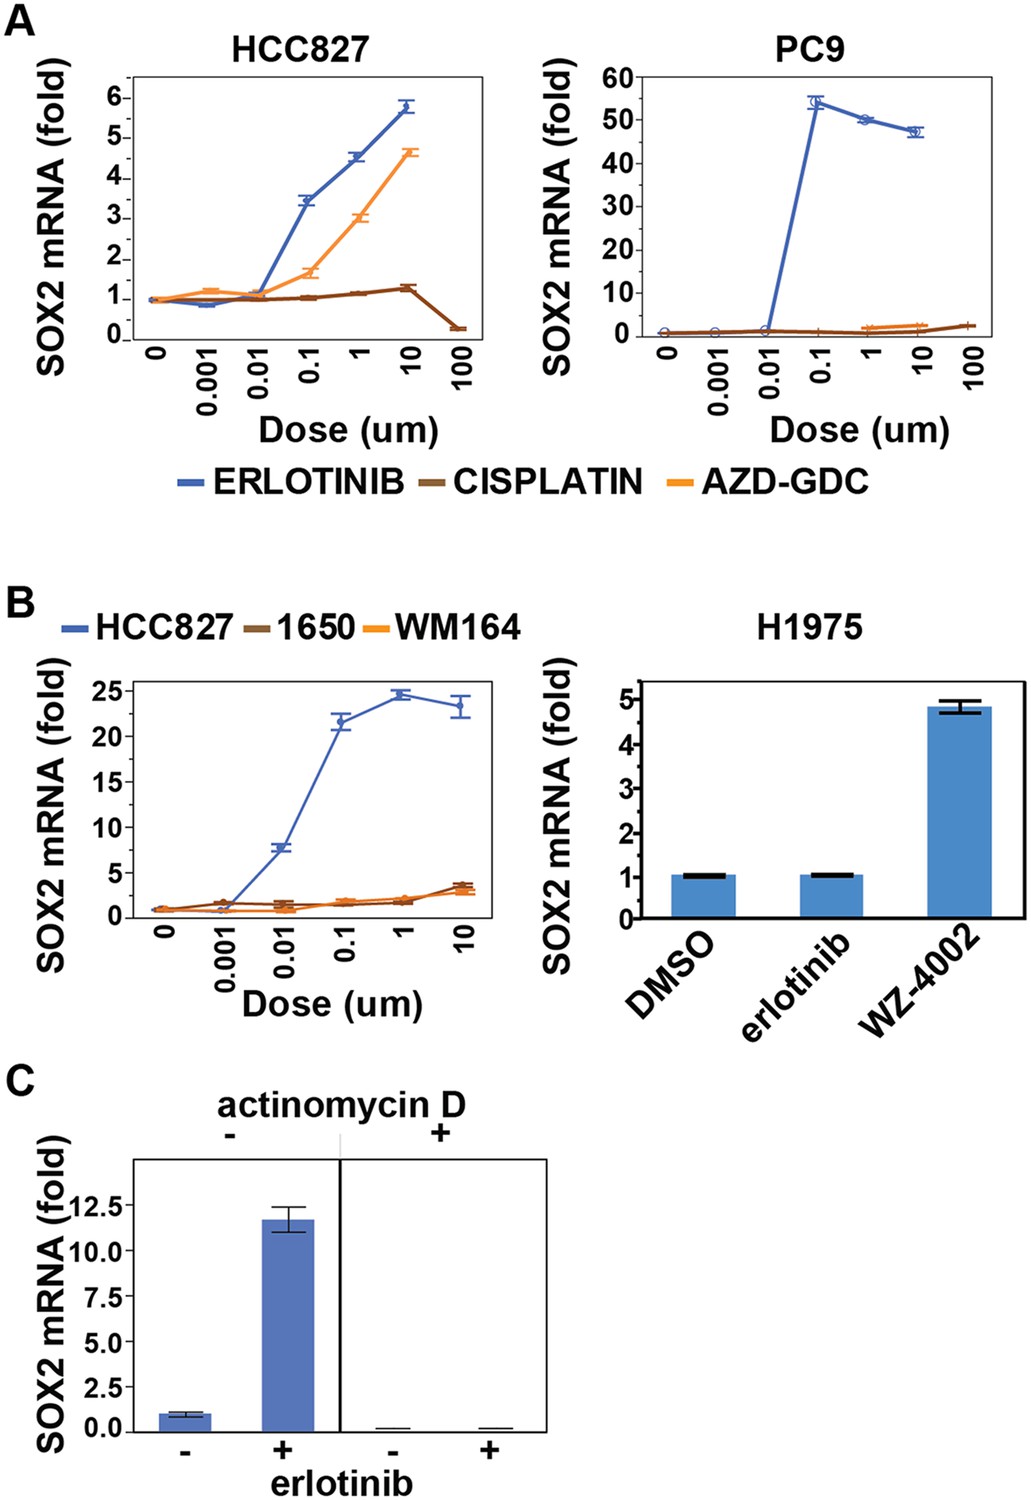
Effect of various treatments on SOX2 expression in different cell contexts.
(A) HCC827 and PC9 cells. The erlotinib curve is the same as in Figure 1B. (B) Left panel, H1650 cells (EGFR DEL15 activating but IC50 >1 µM) and WM164 (BRAF V600E) show minimal induction following treatment with erlotinib or the MEK inhibitor AZD6244, respectively. Data for HCC827 cells are from Figure 1A. Right panel, H1975 cells, possessing an EGFR activating L858R mutation and a T790M erlotinib-resistance gatekeeper mutation, do not induce SOX2 with erlotinib treatment (1 µM) but do with the EGFR/T790M selective inhibitor WZ4002 (1 µM). (C) Effect of actinomycin D on induction of SOX2 transcript in HCC827 cells treated with erlotinib.
Figure 1—figure supplement 3
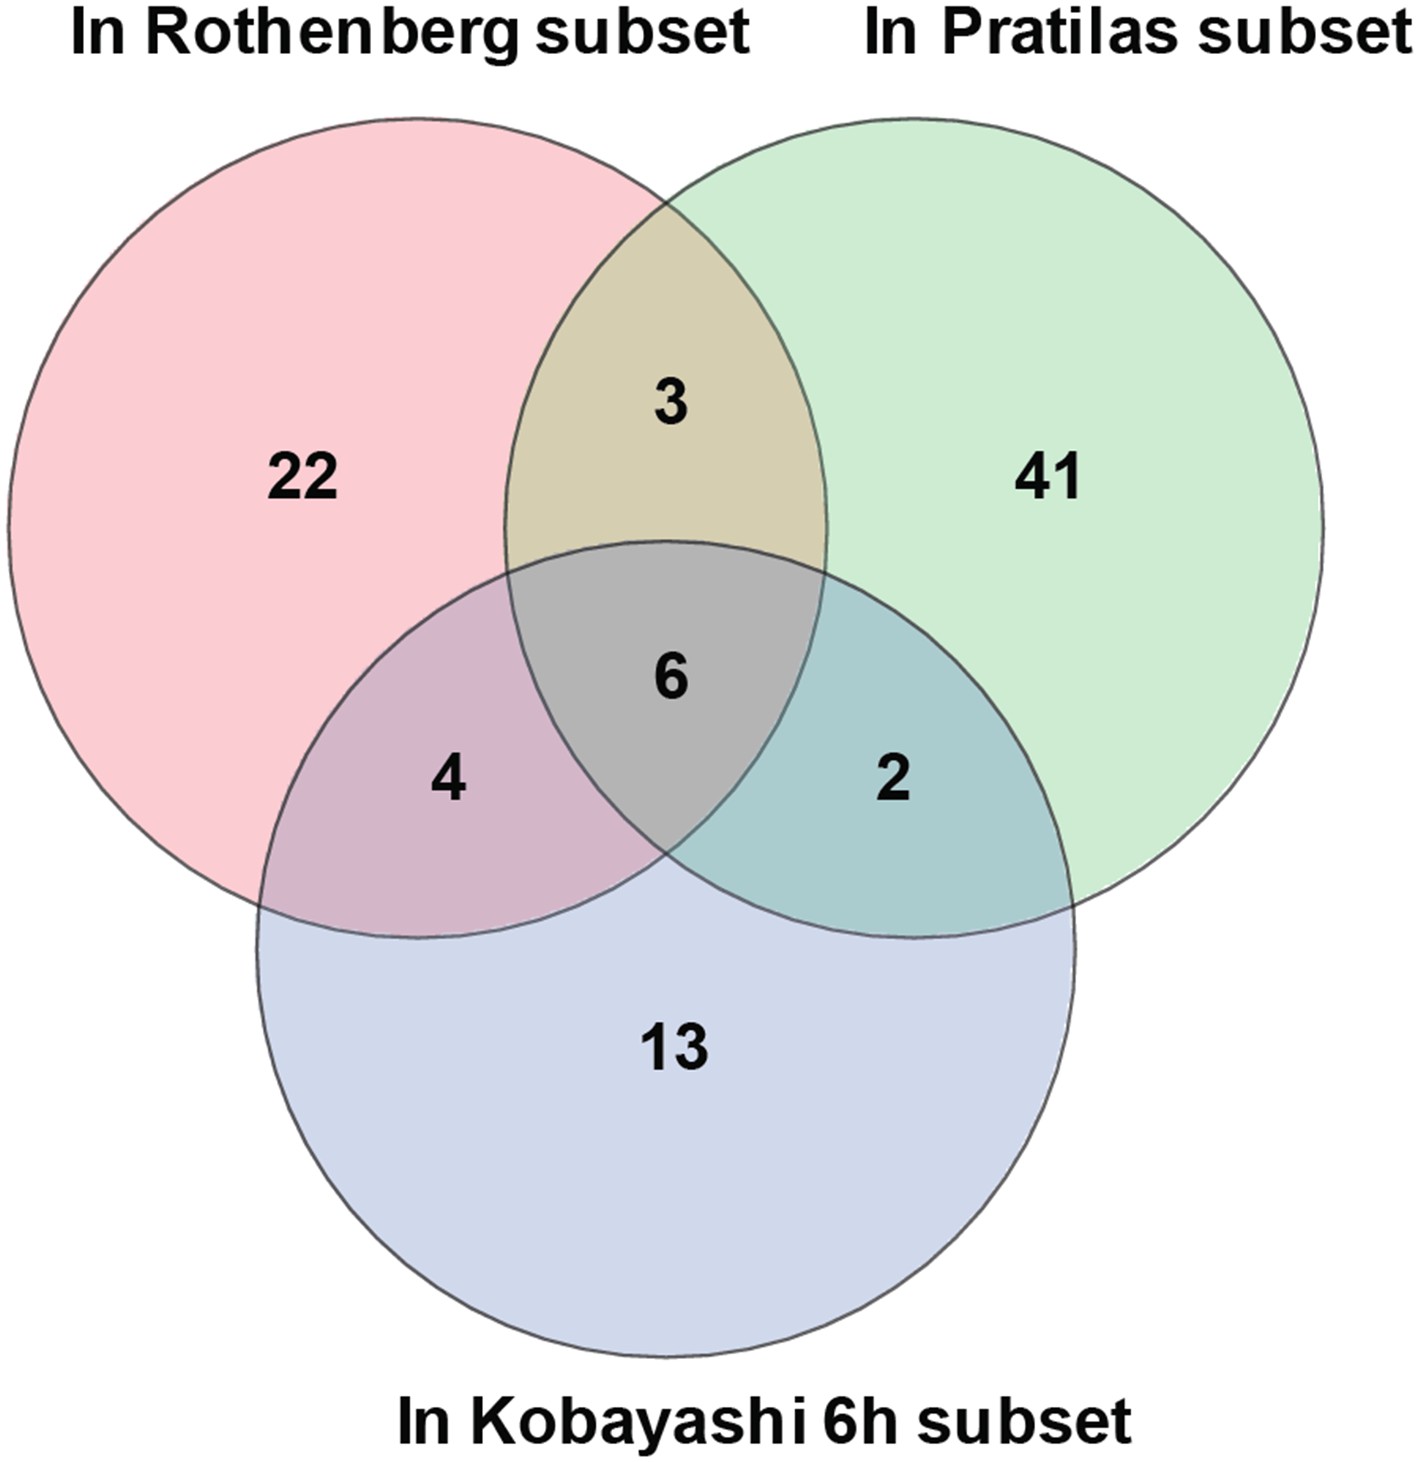
Overlap of differentially expressed genes.
Erlotinib treatment of EGFR-mutant cells was compared to MEK inhibitor treatment of BRAF-mutant melanoma cells lines and CL-387,785 (irreversible EGFR inhibitor) treatment of EGFR-mutant lung cancer cells.
Figure 1—figure supplement 4
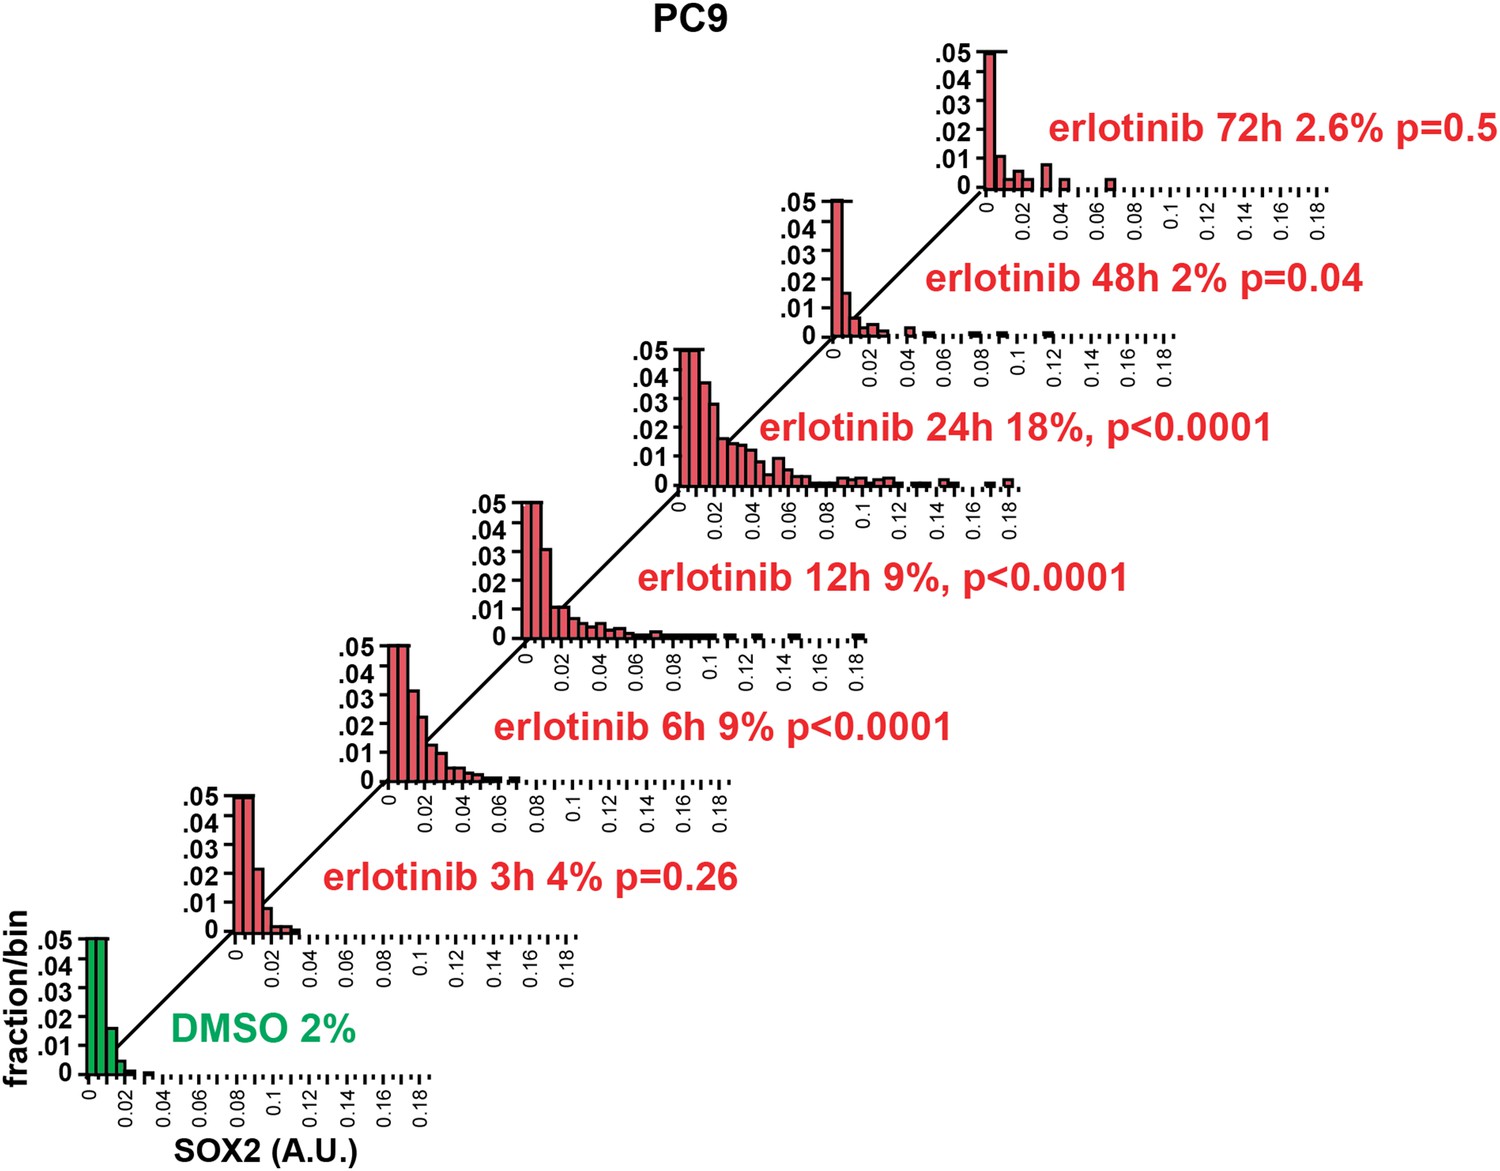
Time course of SOX2 induction by quantitative immunofluorescence microscopy.
The data for the 24 hr time points are the same as in Figure 2A. p-values are shown for the comparison of mean SOX2 fluorescence of each treated population to DMSO (Student's t-test, unequal variances, N = 341–3485, % SOX2+ is shown). Source data are included as Figure 2—source data 2.
Figure 2 with 6 supplements
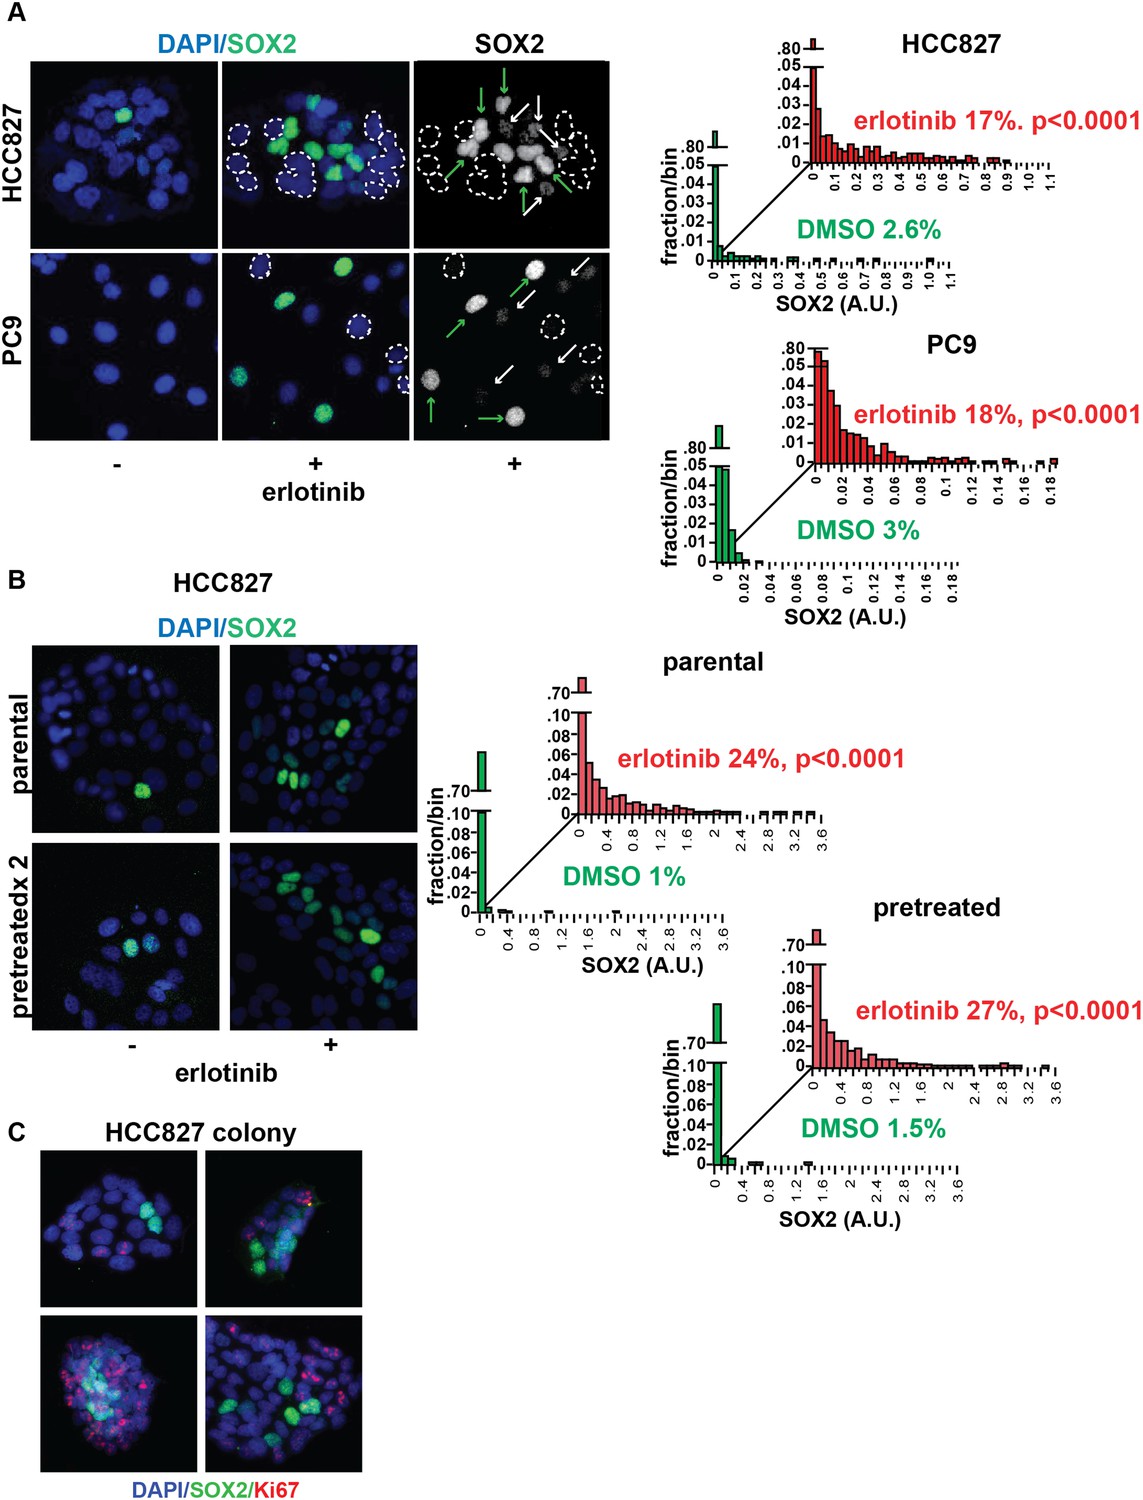
Induction of SOX2 in erlotinib-treated cells.
(A) Left, HCC827 (upper) or PC9 (lower) cells were treated with 0.1 µM erlotinib for 24 hr, followed by immunofluorescence staining using an antibody to SOX2 and DAPI. For erlotinib-treated cells (middle and right pairs of images), the heterogeneity in induced SOX2 levels per cell in each population is indicated by dashed outlines indicating DAPI+ nuclei lacking SOX2, white arrows for nuclei with low (but detectable) SOX2 and green arrows for nuclei with high SOX2. Right, distribution of SOX2 fluorescence in each sample. Mean fluorescence counts for each cell were quantitated and normalized to exposure time as described in ‘Materials and methods’. p < 0.0001 for the comparison of erlotinib-treated cells to DMSO (Student's t-test, unequal variances, N = 1219–3485, means are 0.005/0.04 for untreated/treated HCC827 and 0.001/0.008 for untreated/treated PC9, % SOX2+ is shown). Source data are included as Figure 2—source data 1, 2. (B) Induction of SOX2 in erlotinib-retreated cells. HCC827 cells were treated with 1.0 µM erlotinib for 24 hr (75% cell killing), followed by removal of drug, replating of cells after 7 days of recovery and retreatment with the same concentration of erlotinib. This protocol was repeated, and then cells were treated a third time with erlotinib for 24 hr and analyzed by immunofluorescence microscopy using antibodies to SOX2 and DAPI. The increase in SOX2-positive cells was highly significant for both erlotinib pretreated and untreated cells, but no enrichment was observed as a consequence of pretreatment p < 0.0001 for the comparison of erlotinib-treated cells to DMSO (Student's t-test, unequal variances, N = 1106–2143, means are 0.005/0.17 for untreated/treated-parental, 0.007/0.2 for untreated/treated-pretreated, % SOX2+ is shown). Source data are included as Figure 2—source data 3. (C) Immunofluorescence analysis of single colonies formed from single clones of HCC827 cells stained for DAPI (blue), SOX2 (green), and Ki67 (red).
-
Figure 2—source data 1
Raw immunofluorescence data for quantitation of SOX2 staining in HCC827 cells with erlotinib treatment in Figure 2A, and SOX2+ Ki67 staining in Figure 2—figure supplement 3.
- https://doi.org/10.7554/eLife.06132.009
-
Figure 2—source data 2
Raw immunofluorescence data for quantitation of SOX2 staining in PC9 cells with erlotinib treatment in Figure 2A and Figure 1—figure supplement 4.
- https://doi.org/10.7554/eLife.06132.010
-
Figure 2—source data 3
Raw immunofluorescence data for quantitation of SOX2 staining in HCC827 cells recovered after retreatment (x2) with erlotinib, compared to previously untreated, in Figure 2B.
- https://doi.org/10.7554/eLife.06132.011
-
Figure 2—source data 4
Raw immunofluorescence data for quantitation of SOX2 staining in HCC827 and PC9 cells with increasing dose of erlotinib in Figure 2—figure supplement 1.
- https://doi.org/10.7554/eLife.06132.012
-
Figure 2—source data 5
Raw immunofluorescence data for quantitation of SOX2 staining in PC9 cells recovered after retreatment (x2) with erlotinib, compared to previously untreated cells, in Figure 2—figure supplement 4A.
- https://doi.org/10.7554/eLife.06132.013
-
Figure 2—source data 6
Raw immunofluorescence data for quantitation of phospho-EGFR (pY1068) in parental and erlotinib-resistant PC9 cells in Figure 2—figure supplement 4B.
- https://doi.org/10.7554/eLife.06132.014
Figure 2—figure supplement 1
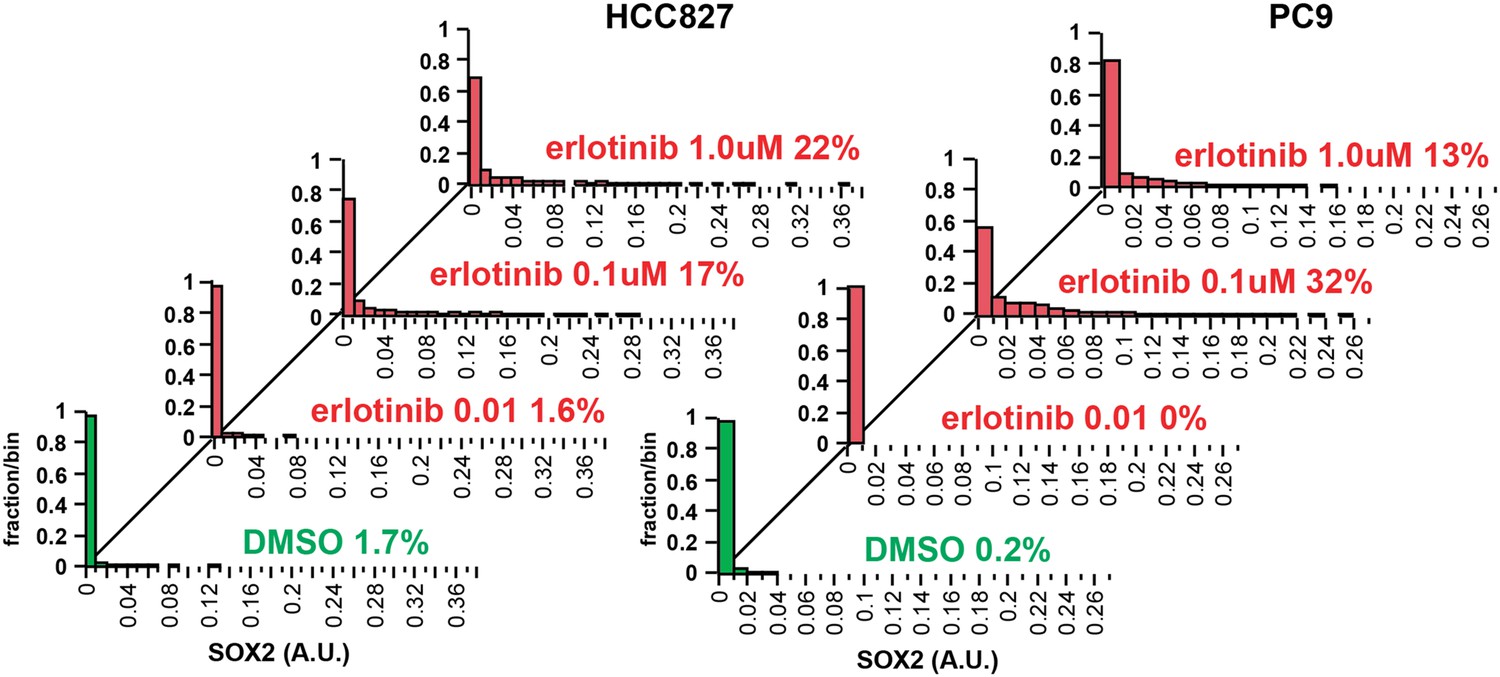
Increasing the dose of erlotinib does not significantly increase the fraction of SOX2+ cells.
HCC827 (left) and PC9 (right) cells were treated for 24 hr with the indicated dose of erlotinib, followed by immunofluorescence microscopy with antibodies to SOX2 and DAPI. The distribution of SOX2+ cells is shown. N = 607–1169 for HCC827 cells, 2746–6818 for PC9, % SOX2+ is shown. Note: increased cell death at the highest dose of erlotinib precludes accurate determination of SOX2+ PC9 cells. Source data are included as Figure 2—source data 4.
Figure 2—figure supplement 2

Stem cell markers do not colocalize with SOX2+ cells.
Immunofluorescence microscopy was carried out on erlotinib-treated HCC827 (upper panels) or PC9 (lower panels) cells using antibodies to SOX2 and various stem cell markers. CD133 (upper row of panels) could be detected in a rare population of PC9 cells (but not HCC827 cells) that was clearly mutually exclusive from SOX2+ cells, while CD44 and MYC were expressed in the majority of cells, irrespective of SOX2 expression. Neither membrane localization of CD24 (rightmost panel, middle rows) nor expression of OCT4 and KLF4 (data not shown) could be detected in either cell line.
Figure 2—figure supplement 3
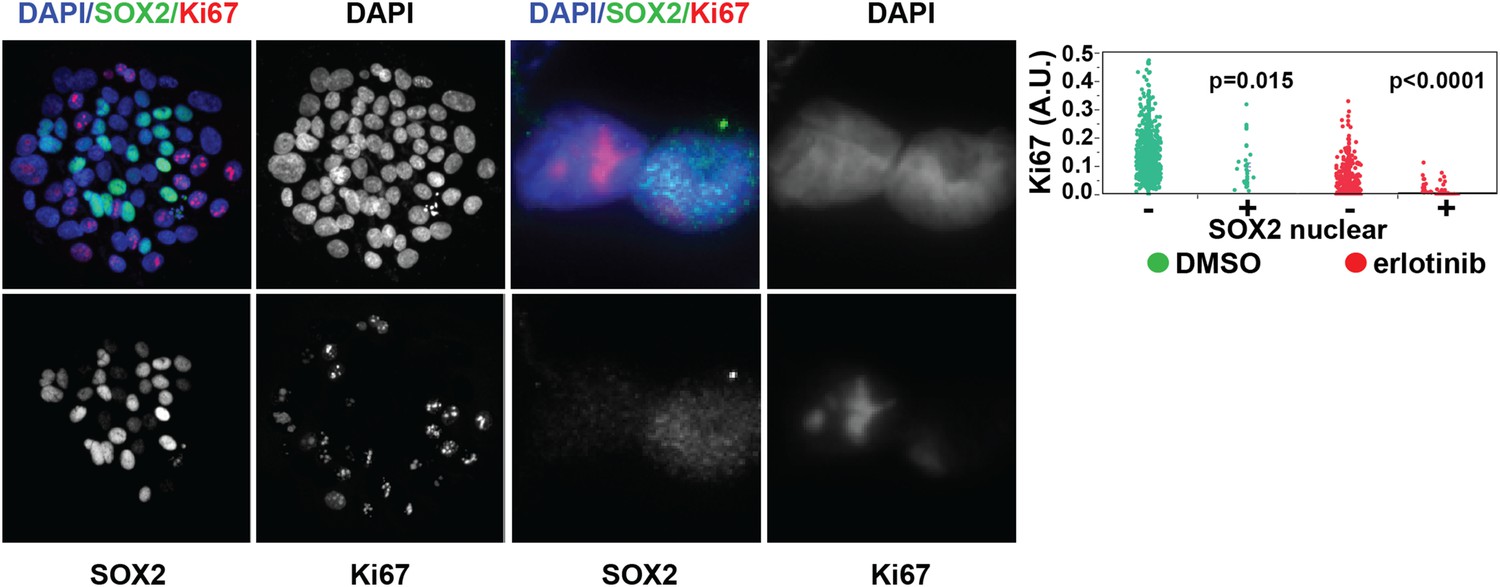
SOX2 is expressed most highly in nonproliferative cells.
Left panels, HCC827 cells were treated for 24 hr with 0.1 µM erlotinib, followed by immunofluorescence microscopy with antibodies to SOX2, Ki-67, and DAPI. The left three pairs of panels show HCC827 cells at 20× magnification, the right pair of panels shows a doublet of cells at 60× magnification. Right panel, the distribution of nuclear Ki-67 mean fluorescence in the SOX2− and SOX2+ cells in DMSO-treated (green) and erlotinib treated (red) cells is displayed. p = 0.015 and p < 0.0001 for the comparison of each SOX2+ population to the corresponding SOX2− population (Student's t-test, unequal variances, N = 31–1834, means of Ki67 fluorescence for SOX2 −/+ cells are 0.13/0.1 for DMSO-treated and 0.03/0.007 for erlotinib-treated). Source data are included as Figure 2—source data 1.
Figure 2—figure supplement 4
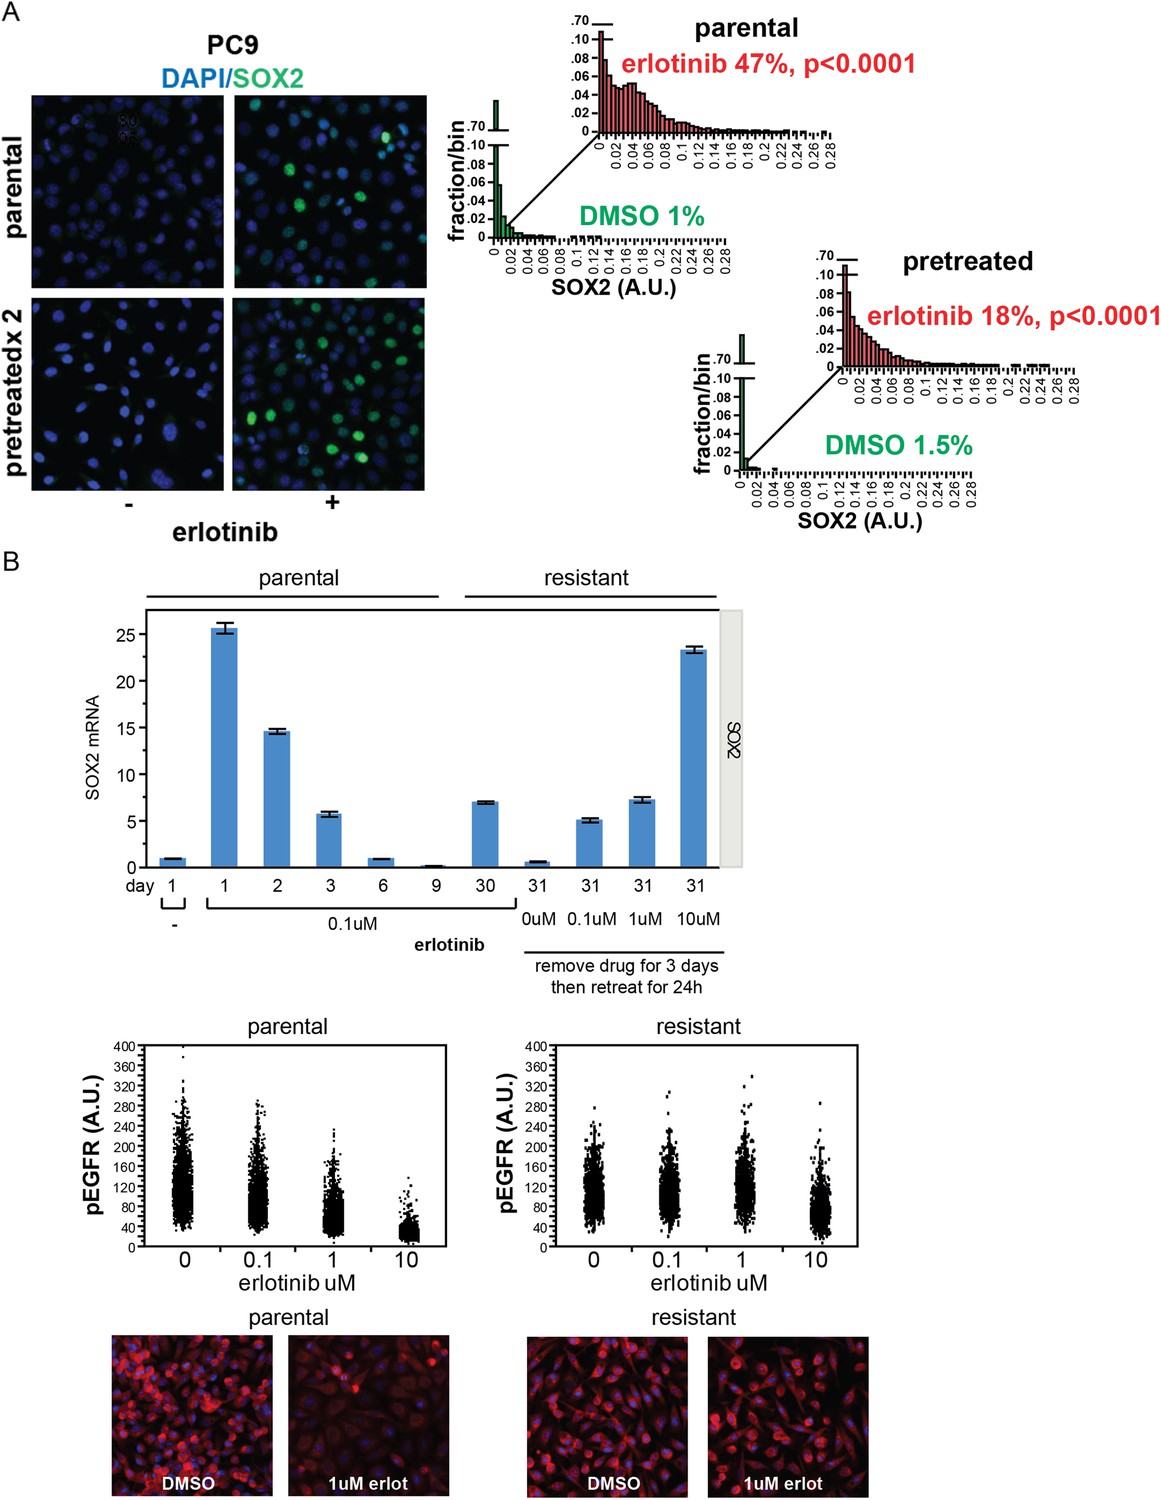
Stochastic induction of SOX2 by erlotinib in PC9 cells.
(A) Retreatment of PC9 cells after a period of recovery does not increase the fraction of cells capable of inducing SOX2. Left panels, images of cells stained for SOX2 (green) and DAPI (blue). Right panels, p < 0.0001 for the comparison of erlotinib-treated cells to DMSO (Student's t-test, unequal variances, N = 3834–7951 cells, means of SOX2 fluorescence are 0.002/0.04 for untreated/treated-parental and 0.001/0.03 for untreated/treated-pretreated, % SOX2+ is shown). Note: the apparent decrease in SOX2+ fraction with retreatment is likely the result of partial selection for erlotinib resistance with serial retreatment, as shown in (B) below. Source data are included as Figure 2—source data 5. (B) Induction of SOX2 in cells with acquired resistance to erlotinib. PC9 cells were made resistant to erlotinib by continuous culture in the presence of 0.1 µM drug for 30 days. Upper panel, qPCR for SOX2 expression was performed on lysates prepared from cells at the indicated time points. On day 30, resistant cells were replated in the absence of drug and then retreated with increasing concentrations of erlotinib on day 31. Data are shown as mean Ct of 4 replicates (normalized to ACTB and untreated cells) −/+ SEM. The first six data points are the same as in Figure 1D. Middle panels, parental and resistant PC9 cells were treated with increasing concentrations of erlotinib for 6 hr, followed by quantitative immunofluorescence analysis for pEGFR. N = 2073–6297 cells. Source data are included as Figure 2—source data 6. Lower panels, representative images show strong decrease in pEGFR (red) with 1 µM erlotinib in parental (left) but not resistant (right) cells.
Figure 2—figure supplement 5
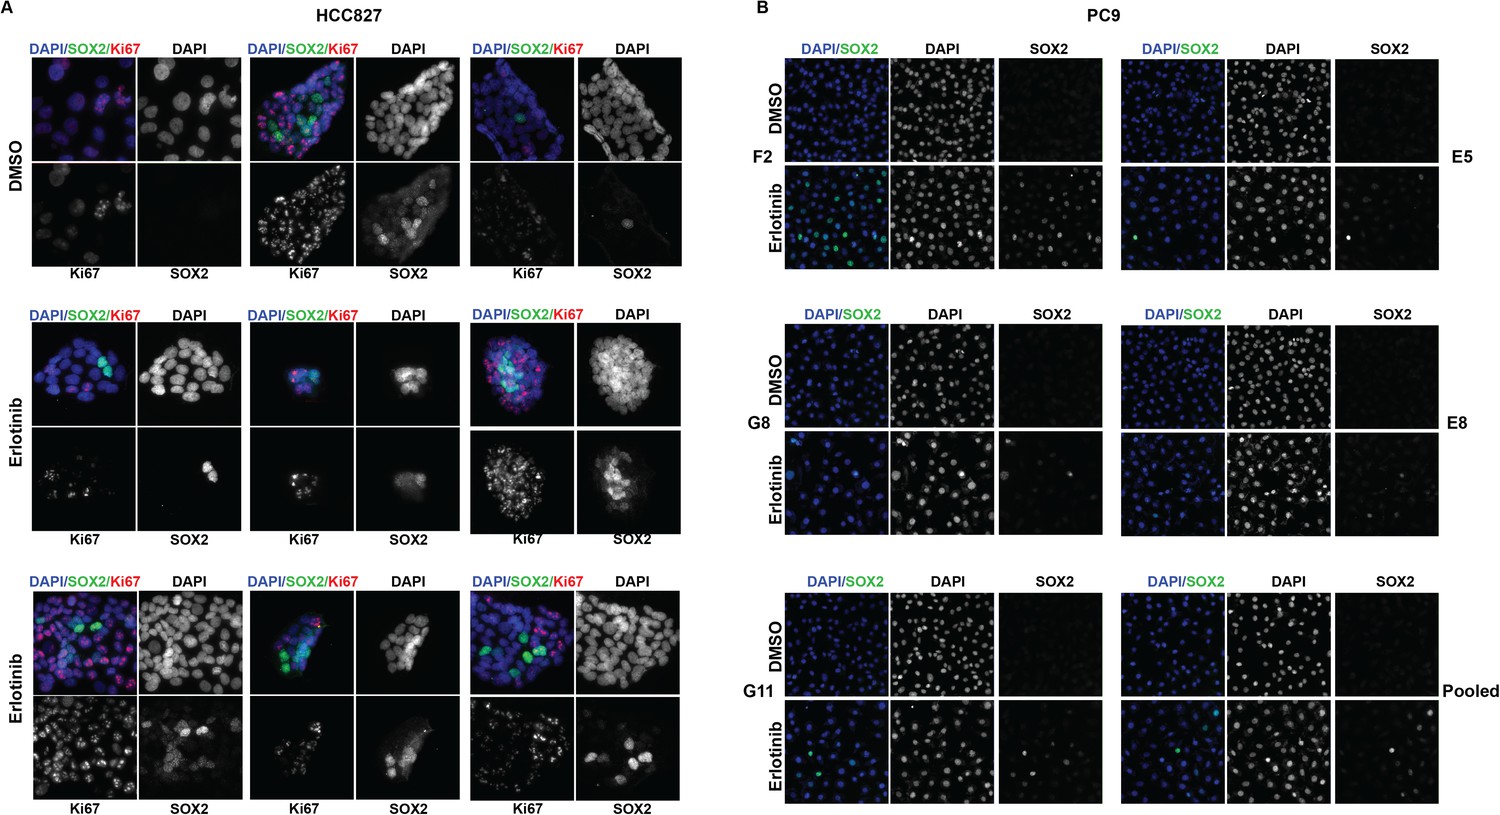
The highest induction of SOX2 in individually isolated subclones of EGFR-mutant cells occurs in a subset of cells, as for the parental cells.
(A) Immunofluorescence analysis of colonies formed from single HCC827 cells for DAPI (blue), SOX2 (green), and Ki67 (red). (B) Similar analysis of DAPI (blue) and SOX2 (green) in PC9 cells. For HCC827 cells, because the cloning efficiency is extremely low (<1%), a single cell suspension of HCC827 cells was plated at low density and allowed to form discrete colonies. PC9 cells were cloned by limiting dilution, and individual subclones were expanded prior to analysis.
Figure 2—figure supplement 6
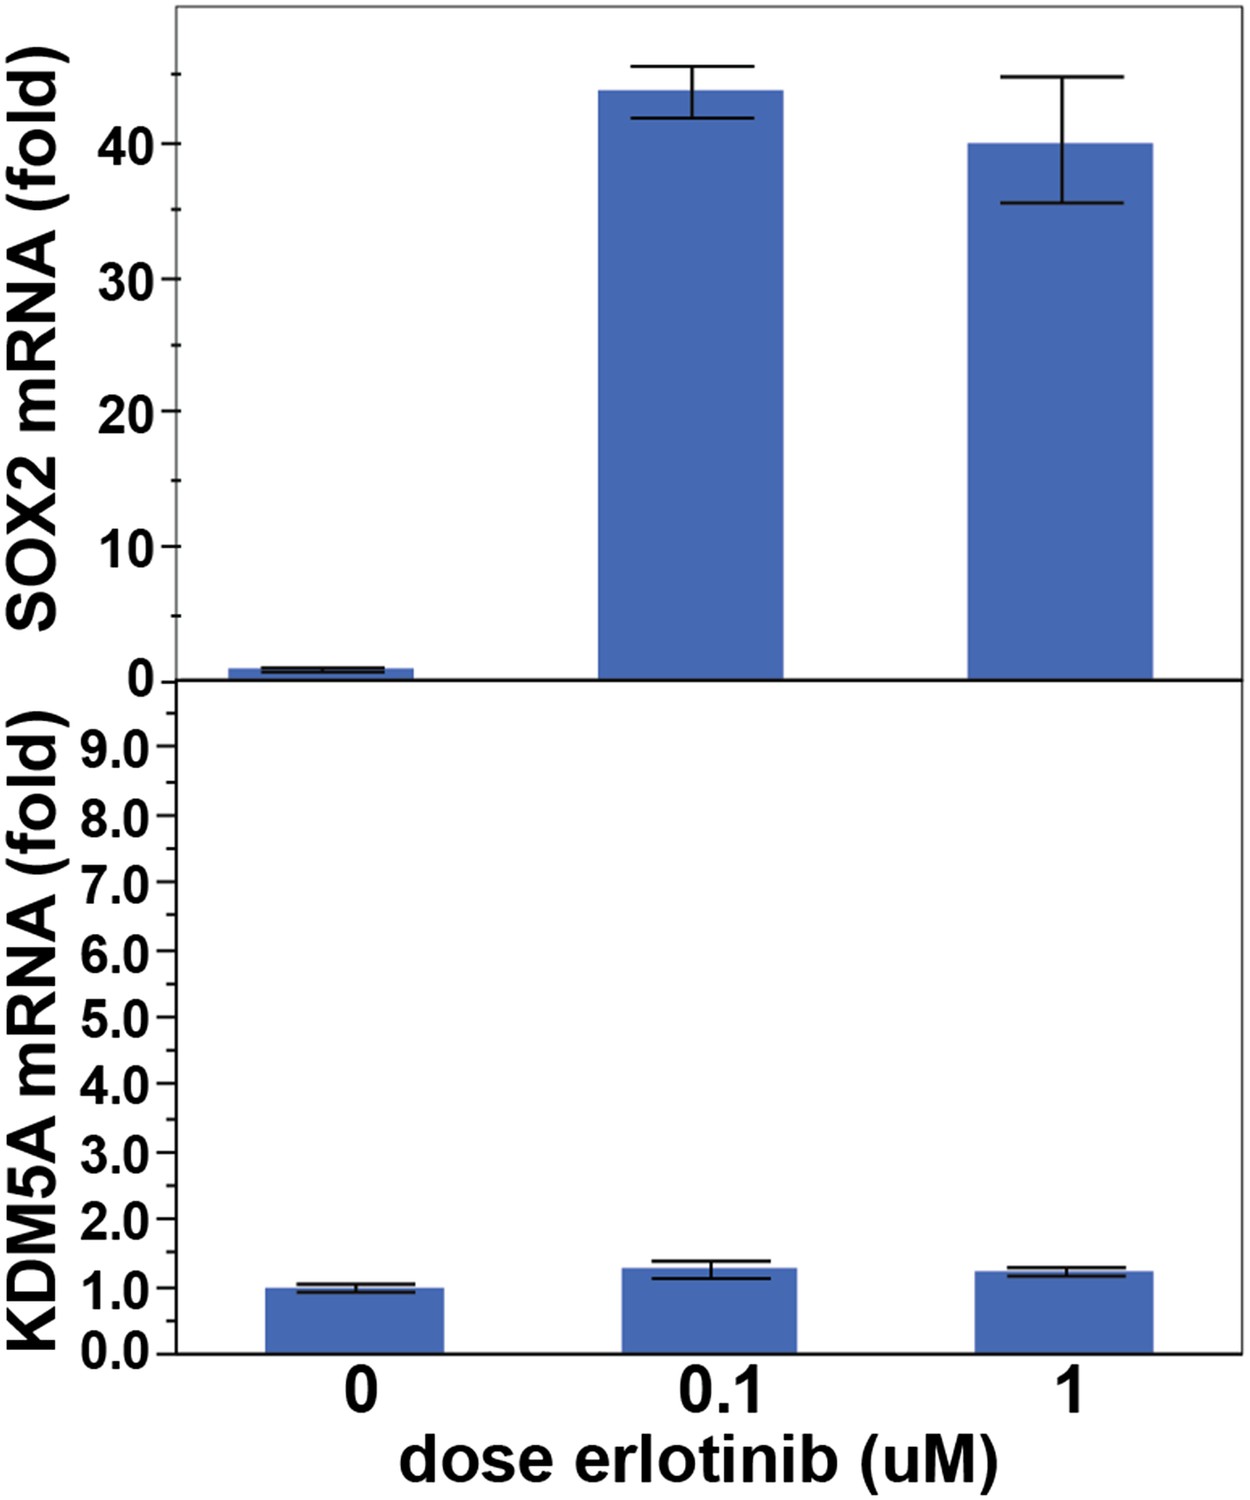
KDM5A is not induced following treatment of PC9 cells with erlotinib for 24 hr.
Data are shown as mean Ct (normalized to GAPDH and untreated cells) of 3 replicates −/+ SEM.
Figure 3 with 1 supplement
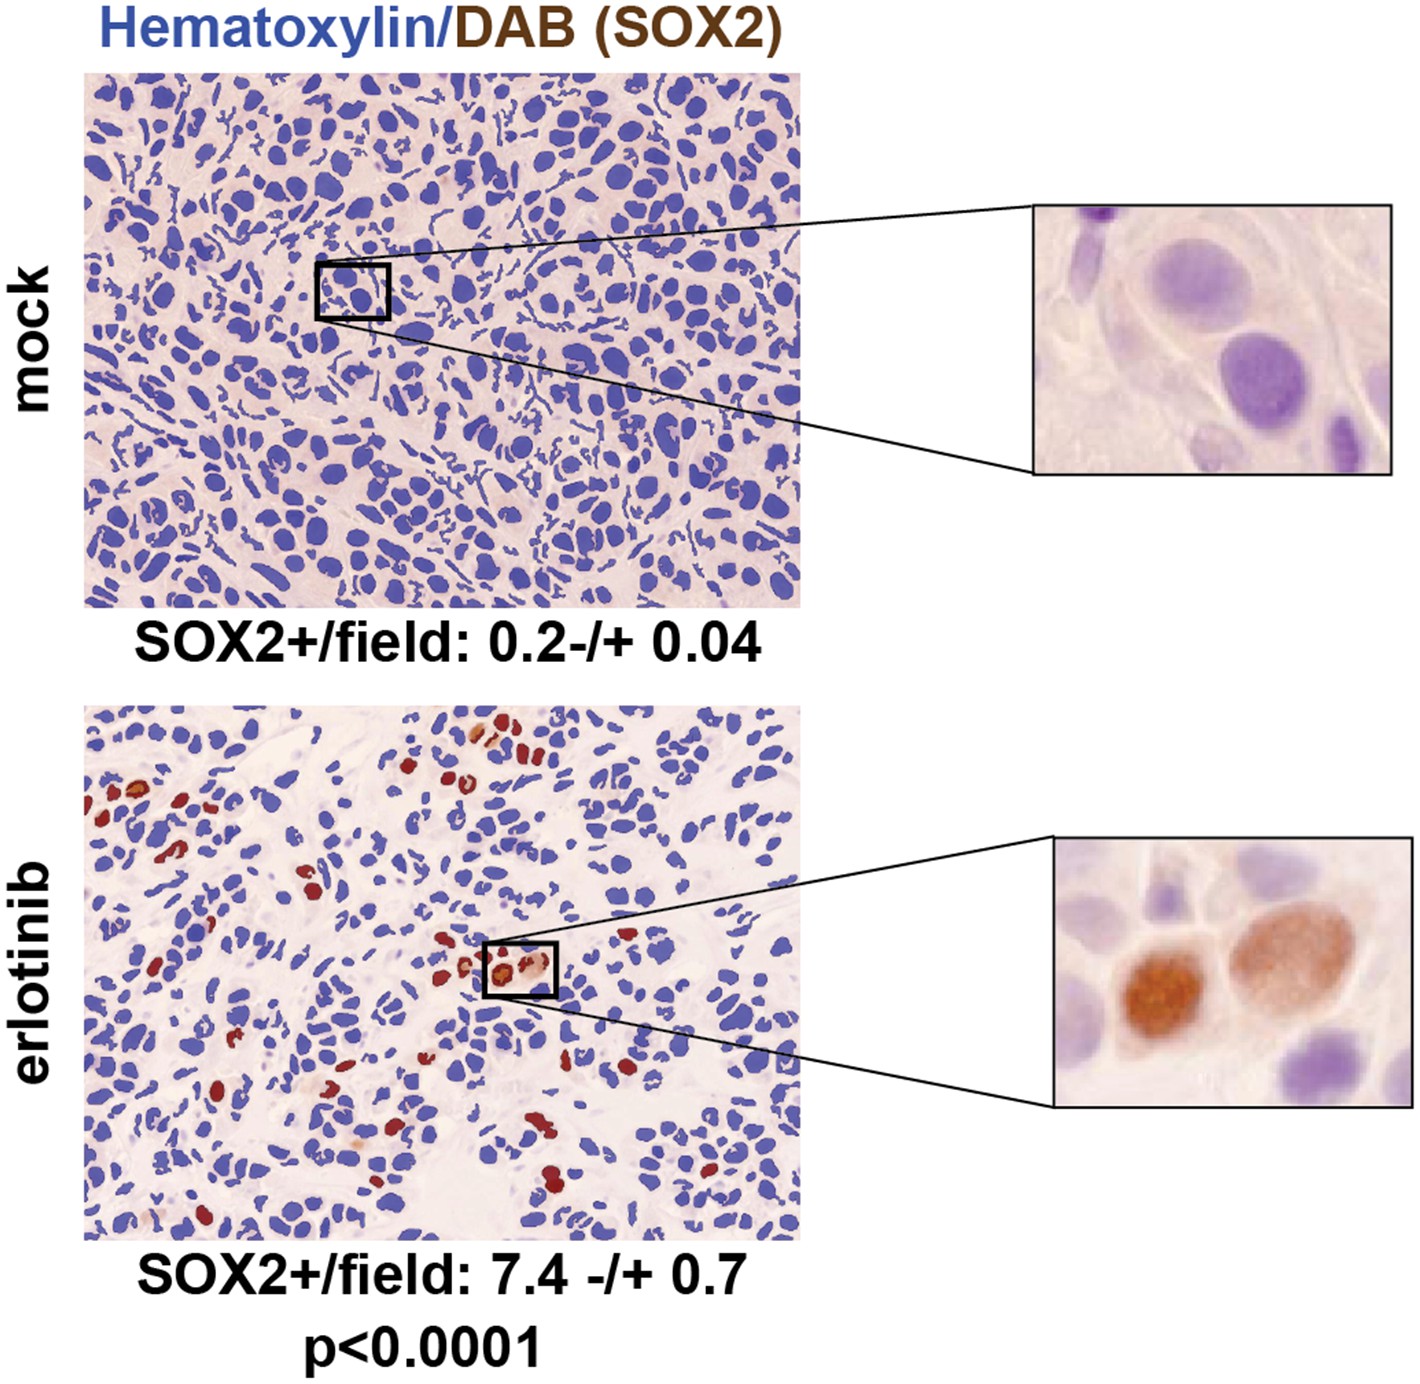
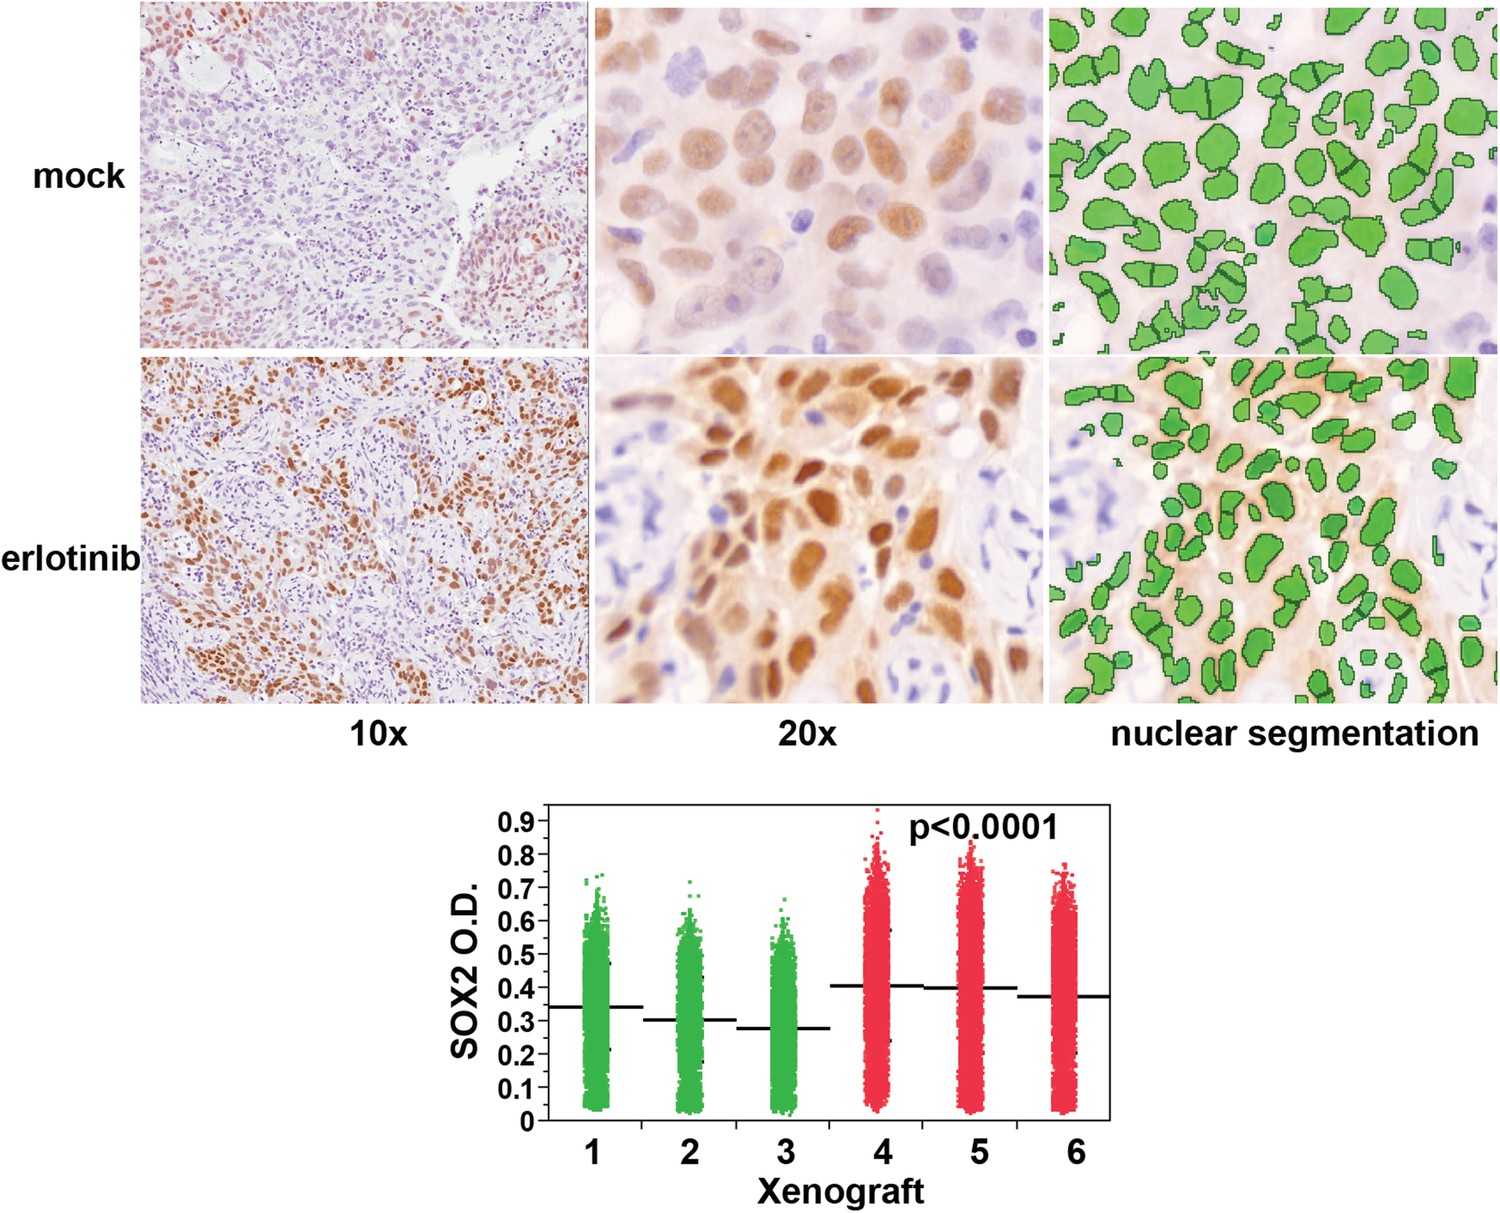
SOX2 is induced by erlotinib in a subset of EGFR-mutant cells in vivo.
Nude mice were xenografted subcutaneously with PC9 cells and treated with a single oral dose of erlotinib (100 mg/kg) (or carrier) when the tumors had reached ∼500 mm3. Tumors were harvested 24 hr after treatment, and immunohistochemistry for SOX2 was carried out on formalin-fixed, paraffin embedded tumor specimens. The panels show automated scoring of SOX2+ nuclei (brown) as described in ‘Materials and methods’. The actual IHC images for the areas indicated by rectangles are shown magnified to the right. p < 0.0001 for the comparison erlotinib-treated vs control (Student's t-test, unequal variances, N = 147–151 fields from 4 xenografts, mean SOX2+ nuclei/10× field −/+ SEM is shown for each treatment). Source data are included as Figure 3—source data 1.
-
Figure 3—source data 1
Number of SOX2+cells per field for quantitation of SOX2 staining in PC9 cell xenografts in Figure 3.
- https://doi.org/10.7554/eLife.06132.022
-
Figure 3—source data 2
Raw absorbance data for quantitation of SOX2 staining in HCC827 cell xenografts in Figure 3—figure supplement 1.
- https://doi.org/10.7554/eLife.06132.023
Figure 3—figure supplement 1
Erlotinib treatment results in induction of SOX2 in vivo.
Quantitative immunohistochemistry for SOX2 was performed in FFPE sections from mice xenografted subcutaneously with HCC827 cells and treated with a single oral dose of erlotinib (red in dot plot) or carrier (green). Because HCC827 cells possess a degree of basal SOX2 in vivo, the average mean fluorescence of tumor cells from each xenograft was used to determine significance. p < 0.0001 for the comparison of erlotinib-treated vs control (Analysis of Variance to control for the variation among individual mice, N = 12,893–16,140 cells). Source data are included as Figure 3—source data 2.
Figure 4
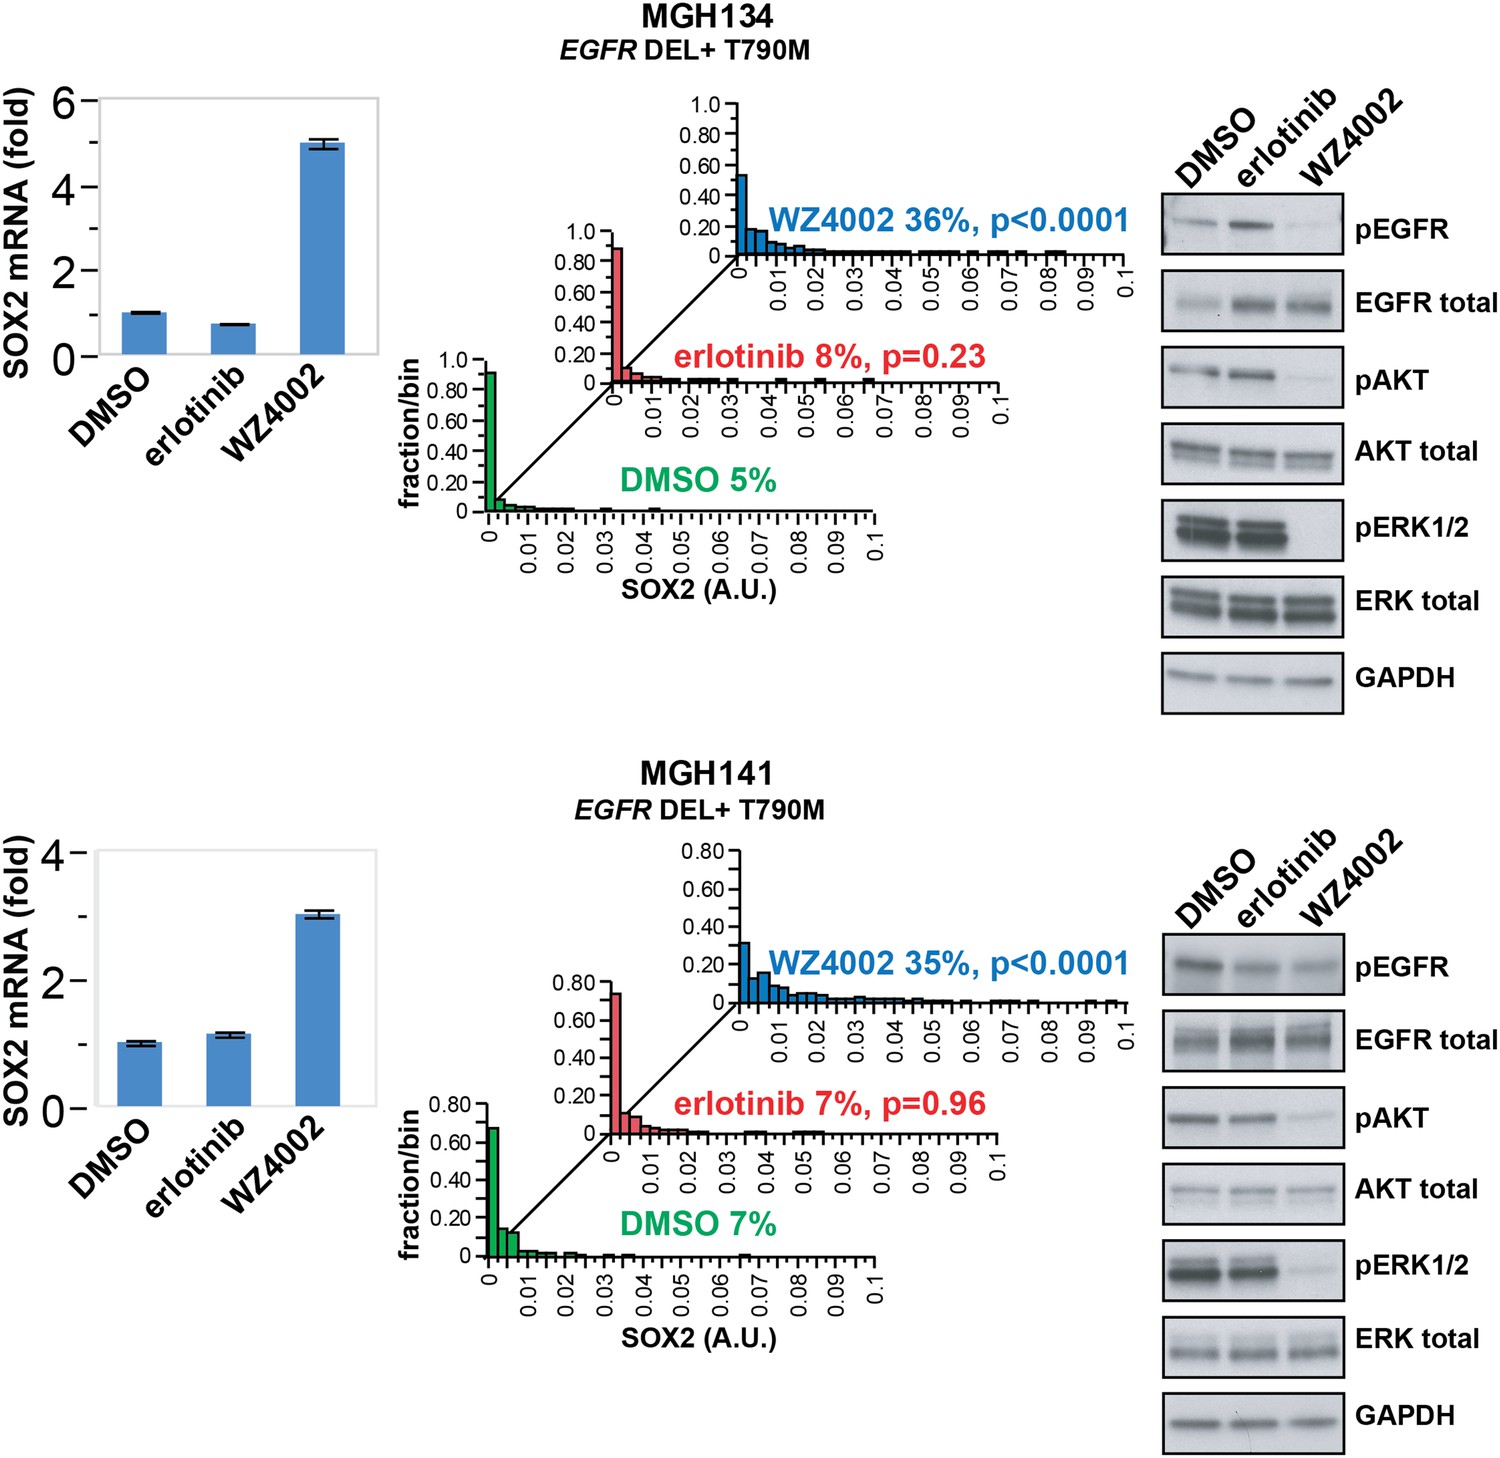
SOX2 is induced by therapy targeting the resistance genotype in cell lines derived by rebiopsy of patients.
Short-term cultures of tumor cells derived from patients at the time of acquired resistance (both tumors EGFR genotype exon 19 deletion + T790M) were treated with the indicated agents for 24 hr, followed by isolation of total RNA and qPCR for SOX2 transcript (left panels) or quantitative immunofluorescence analysis after staining with antibodies to SOX2 (middle panels). The effect of each treatment on downstream signaling was determined by immunoblot analysis with the indicated antibodies (right panels). For qPCR, data are displayed as the mean of 4 replicates −/+ SEM. For histograms, p-values are shown for the comparison of each treatment to DMSO (Student's t-test, unequal variances, N = 229–1808, means are 0.001/0.0014/0.0054 for DMSO/erlotinib/WZ4002-treated MGH134 and 0.003/0.003/0.011 for DMSO/erlotinib/WZ4002-treated MGH141, % SOX2+ is shown). Source data are included as Figure 4—source data 1.
-
Figure 4—source data 1
Raw immunofluorescence data for quantitation of SOX2 staining with different treatments in patient-derived tumor cells.
- https://doi.org/10.7554/eLife.06132.026
Figure 5 with 4 supplements
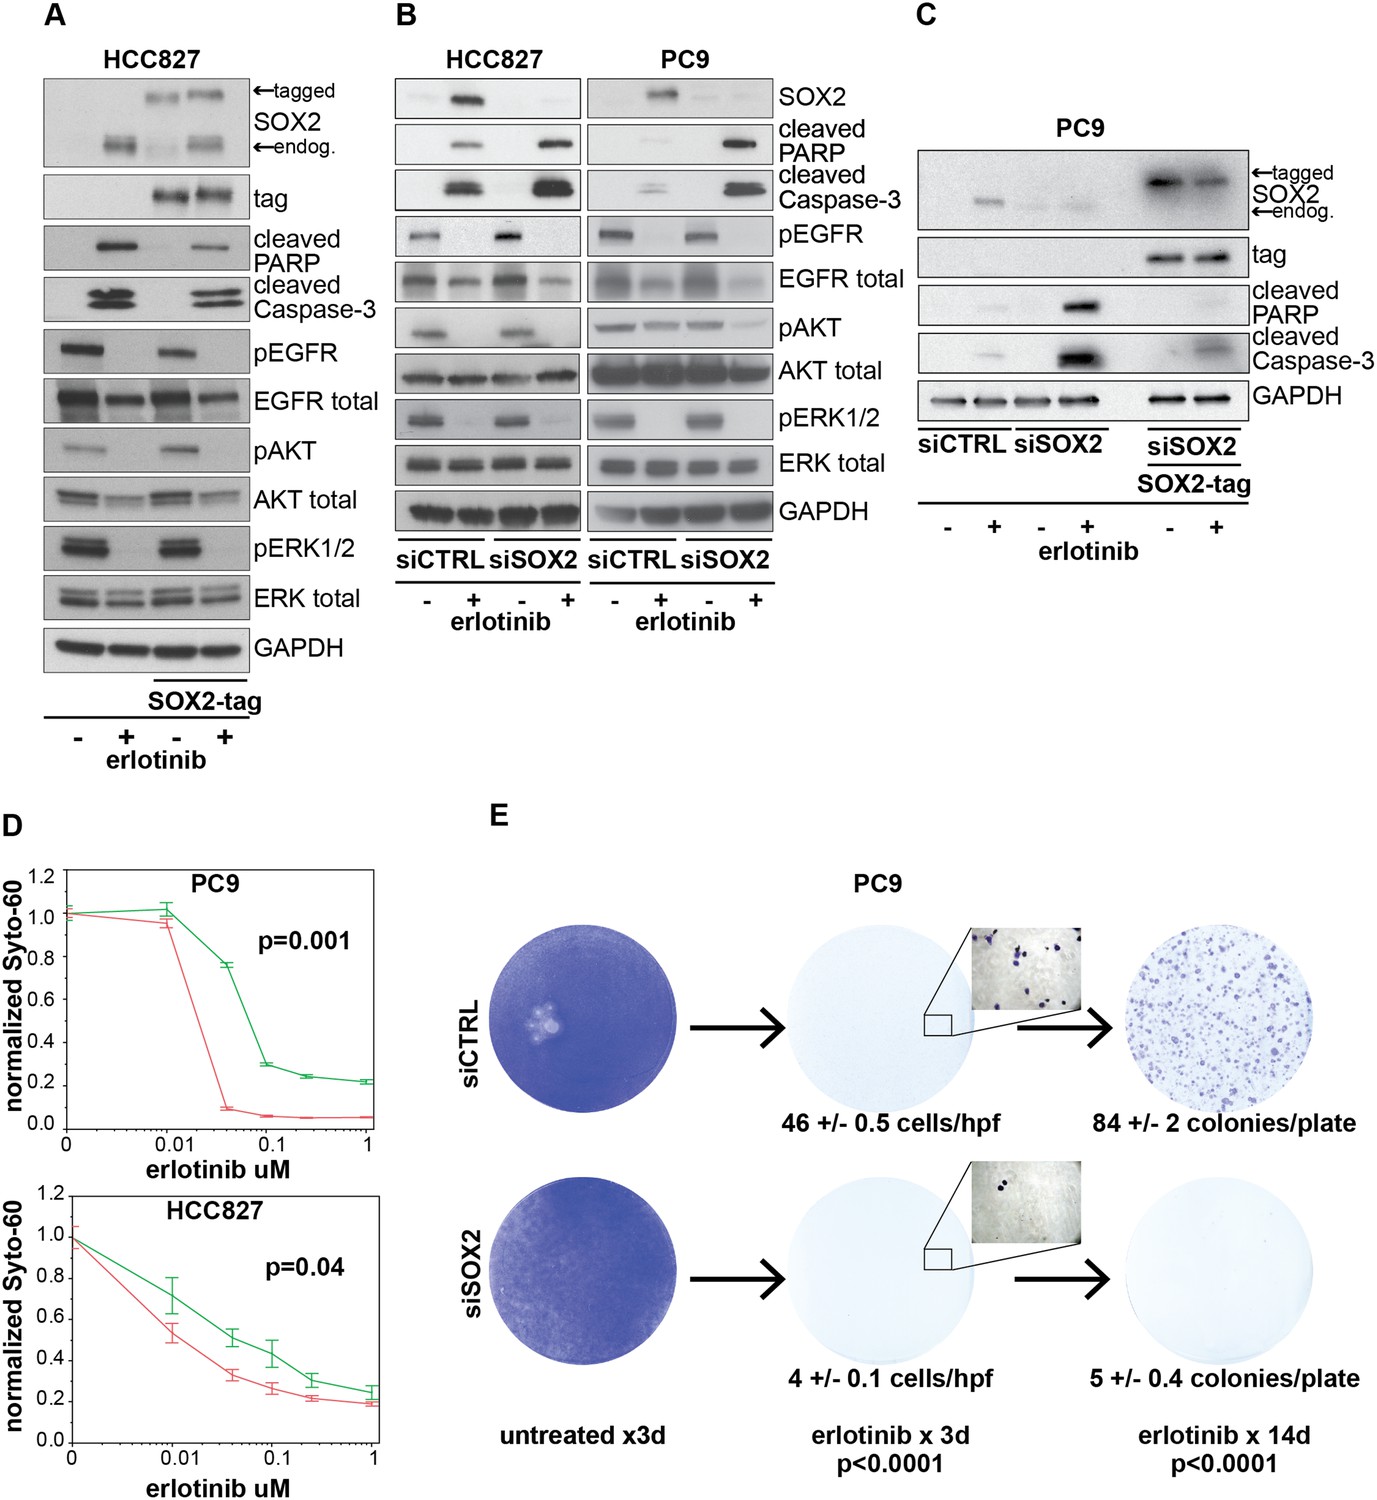
Induction of SOX2 protects cells from erlotinib-induced apoptosis.
(A) HCC827 cells were stably transduced with a doxycycline inducible epitope-tagged SOX2 lentiviral expression vector. Doxycycline was added for 3 hr (‘SOX2-tag’) and then removed prior to the addition of DMSO or 0.1 µM erlotinib for 24 hr, followed by immunoblot of protein lysates with the indicated antibodies. Exogenous SOX2 migrates more slowly than the endogenous protein due to the presence of the tag. (B) HCC827 (left) or PC9 (right) cells were transfected with control siRNA or siRNA targeting SOX2. 24-hr after transfection, DMSO or 0.1 µM erlotinib was added. The effect of SOX2 knockdown was assessed by immunoblot analysis of protein lysates with the indicated antibodies after overnight treatment. (C) PC9 cells were stably transduced with a tagged SOX2 lentiviral vector in which silent mutations were introduced into the target site for the most potent siRNA against SOX2. Cells were transfected with the indicated siRNAs, treated with doxycycline followed by erlotinib as in (A), and protein lysates were analyzed by immunoblot with the indicated antibodies after overnight treatment. The increased PARP and caspase-3 cleavage observed when erlotinib treatment is combined with siRNA targeting SOX2 (lane 4) is suppressed by siRNA-resistant, exogenous SOX2 (lane 6). (D) PC9 and HCC827 cells were transfected in 96-well plates and treated 24 hr later with a dilution series of erlotinib, followed by Syto-60 assay. Data are displayed as the mean of 3–5 replicates −/+ SEM. p = 0.001 (PC9) and 0.04 (HCC827) for the comparison of mean IC50 for siCTRL vs siSOX2 (Student's t-test, unequal variances). (E) Preventing SOX2 induction using siRNA decreases the development of acquired erlotinib resistance. PC9 cells were transfected with control siRNA or siRNA targeting SOX2, followed by treatment after 24 hr with 1.0 µM erlotinib. Erlotinib-containing medium was renewed every 3 days, and plates were fixed and stained with Crystal Violet at the indicated times. The left panels demonstrate the absence of toxicity following transfection with siRNA targeting SOX2 in the absence of erlotinib. Middle panels demonstrate cell loss after 3 days of treatment, due to erlotinib-induced apoptosis; at higher magnification, more control cells remain attached than cells transfected with siRNA against SOX2. Right panels show colonies of proliferating cells after 2 weeks of continuous erlotinib treatment. p < 0.0001for the number of cells per 20× field (N = 33 fields per sample) or the number of colonies per plate (N = 9 plates per sample from three independent experiments), for siRNA targeting SOX2 vs control cells (Student's t-test, unequal variances).
-
Figure 5—source data 1
Raw immunofluorescence data for quantitation of SOX2 staining in HCC827 cells with inducible SOX2 in Figure 5—figure supplement 1A.
- https://doi.org/10.7554/eLife.06132.028
-
Figure 5—source data 2
Raw immunofluorescence data for quantitation of SOX2 and cleaved caspase-3 costaining in PC9 cells transfected with siCTRL or siSOX2 in Figure 5—figure supplement 2.
- https://doi.org/10.7554/eLife.06132.029
Figure 5—figure supplement 1
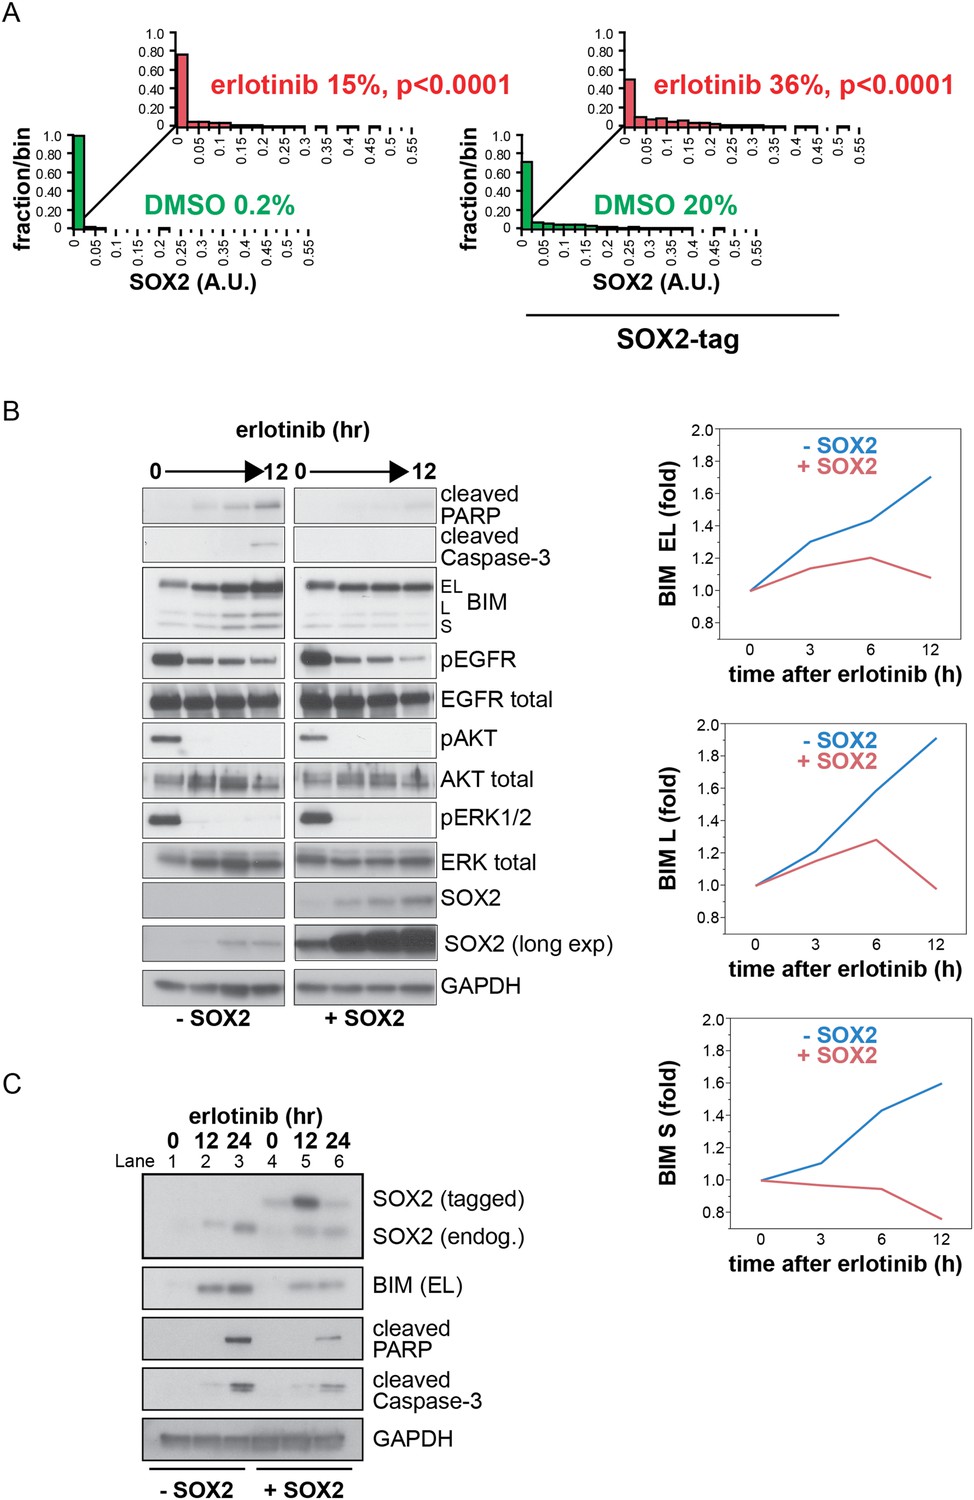
Induction of exogenous SOX2.
(A) Quantitative immunofluorescence analysis confirms that ectopic SOX2 expression with a short pulse of doxycycline increases the fraction of SOX2+ cells without significantly increasing the amount of SOX2 per cell. The same conditions were used as in Figure 5A p < 0.0001, for the comparison of erlotinib-treated to DMSO (Student's t-test, unequal variances, N = 830–1115 cells, means of SOX2 fluorescence are 0.0007/0.03 for untreated/treated cells without exogenous SOX2 and 0.03/0.06 for untreated/treated cells with exogenous SOX2, % SOX2+ is shown). Source data are included as Figure 5—source data 1. (B) Left, HCC827 cells were stably transduced with a tetracycline-inducible SOX2 expression vector (without an epitope tag). Cells were treated with carrier (lanes 1–4) or 0.1 µg/ml doxycycline (lanes 5–8) for 3 hr prior to addition of 0.1 µM erlotinib, with doxycycline left in the cell culture media during erlotinib treatment to ensure strong induction of exogenous SOX2. Protein lysates were prepared at 3-hr intervals, and immunoblot analysis was carried out with the indicated antibodies. The increase in the intensity of the SOX2 band in lane 1–4 with time is due to induction of endogenous SOX2 by erlotinib; in lanes 5–8, strong induction of exogenous SOX2 with increasing time in doxycycline masks the endogenous protein. Right, the levels of each BIM isoform were quantitated using ImageJ software and normalized to GAPDH and time zero, confirming suppression of their induction by ectopic SOX2. (C) Physiologic levels of ectopic SOX2 decrease BIM induction by erlotinib. Cells were treated with erlotinib for 12 or 24 hr, −/+ doxycycline to induce tagged SOX2, followed by immunoblot of lysates. Here, doxycycline was added for 3 hr and then removed prior to addition of erlotinib, to maintain ectopic SOX2 induction at physiologic levels during erlotinib treatment. Therefore, ectopic SOX2 is (slightly) apparent at time zero when erlotinib is added (lane 4), peaks 12 hr later (lane 5) and has decreased at 24 hr (lane 6). However, decreased BIM levels, together with decreased cleaved PARP/caspase-3 (lanes 5–6 vs 2–3), are apparent throughout. The use of a lower percentage acrylamide gel does not permit BIM L and S to be distinguished from BIM EL.
Figure 5—figure supplement 2
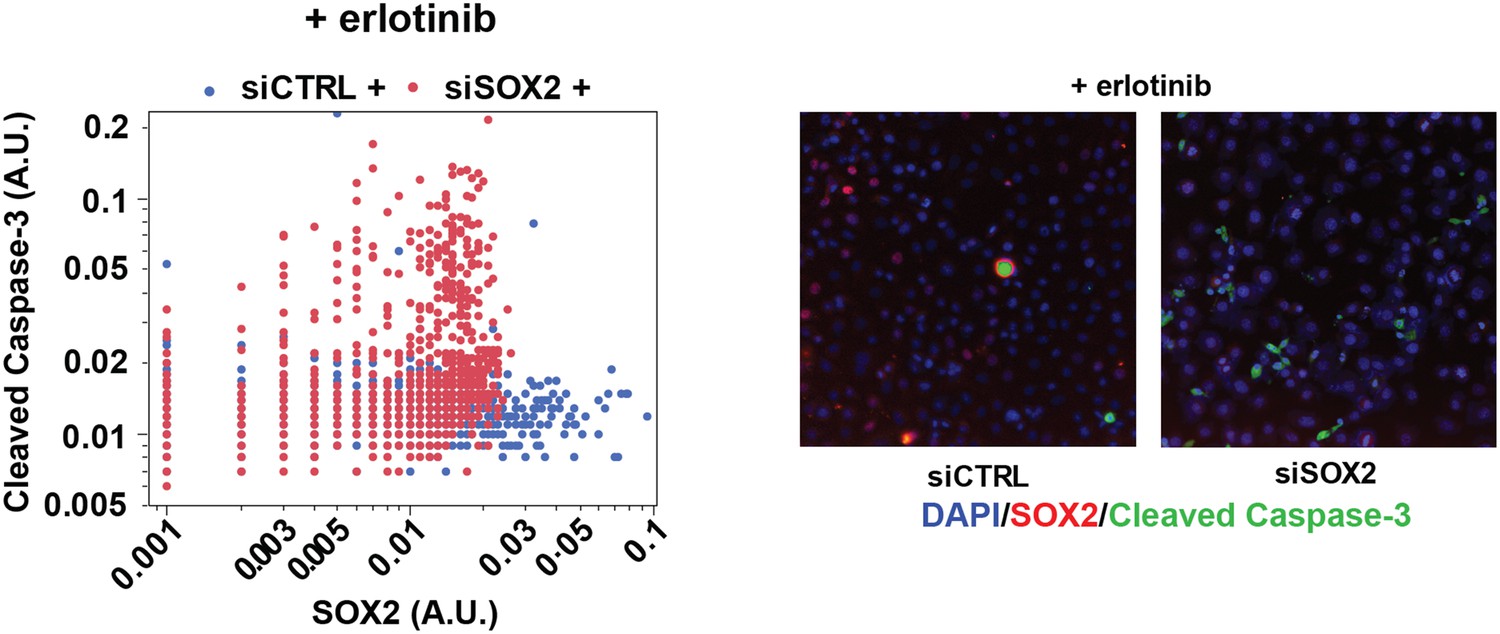
SOX2 expression modulates erlotinib-induced apoptosis.
Left panel, quantitative immunofluorescence analysis showing expression of SOX2 (x-axis) and cleaved caspase-3 (y-axis) in PC9 cells transfected with siCTRL (blue) or siSOX2 (red) and treated with erlotinib (N = 2452–3792). Knockout of SOX2 results in decreased SOX2 expression and increased cleaved caspase-3. Right panels, representative immunofluorescence images from erlotinib-treated cells showing DAPI (blue), SOX2 (red), and cleaved-caspase-3 (green) staining. Source data are included as Figure 5—source data 2.
Figure 5—figure supplement 3
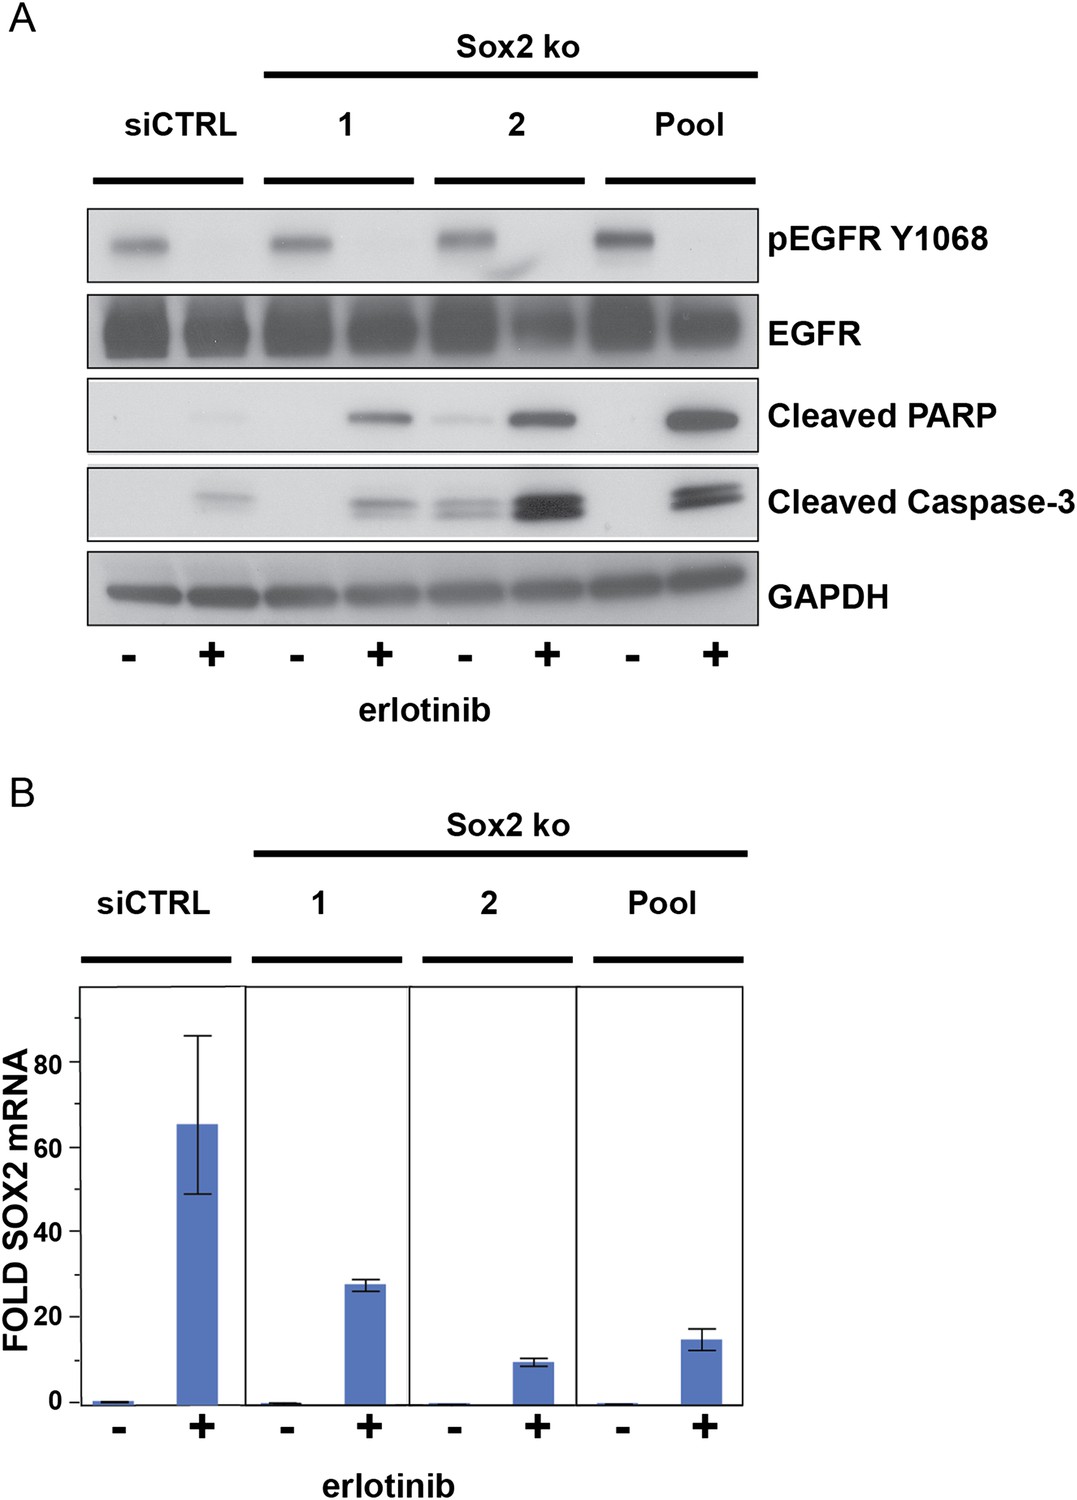
The effect of siRNA targeting SOX2 is specific.
(A), PC9 cells were transfected with two different siRNA duplexes targeting SOX2 (or control siRNA), followed by addition of DMSO or 0.1 µM erlotinib for 24 hr and immunoblot of protein lysates with the indicated antibodies. (B), the degree of knockdown of SOX2 was quantitatively assessed by qPCR. Data are shown as mean Ct (normalized to GAPDH and untreated siCTRL cells) of 3 replicates −/+ SEM.
Figure 5—figure supplement 4
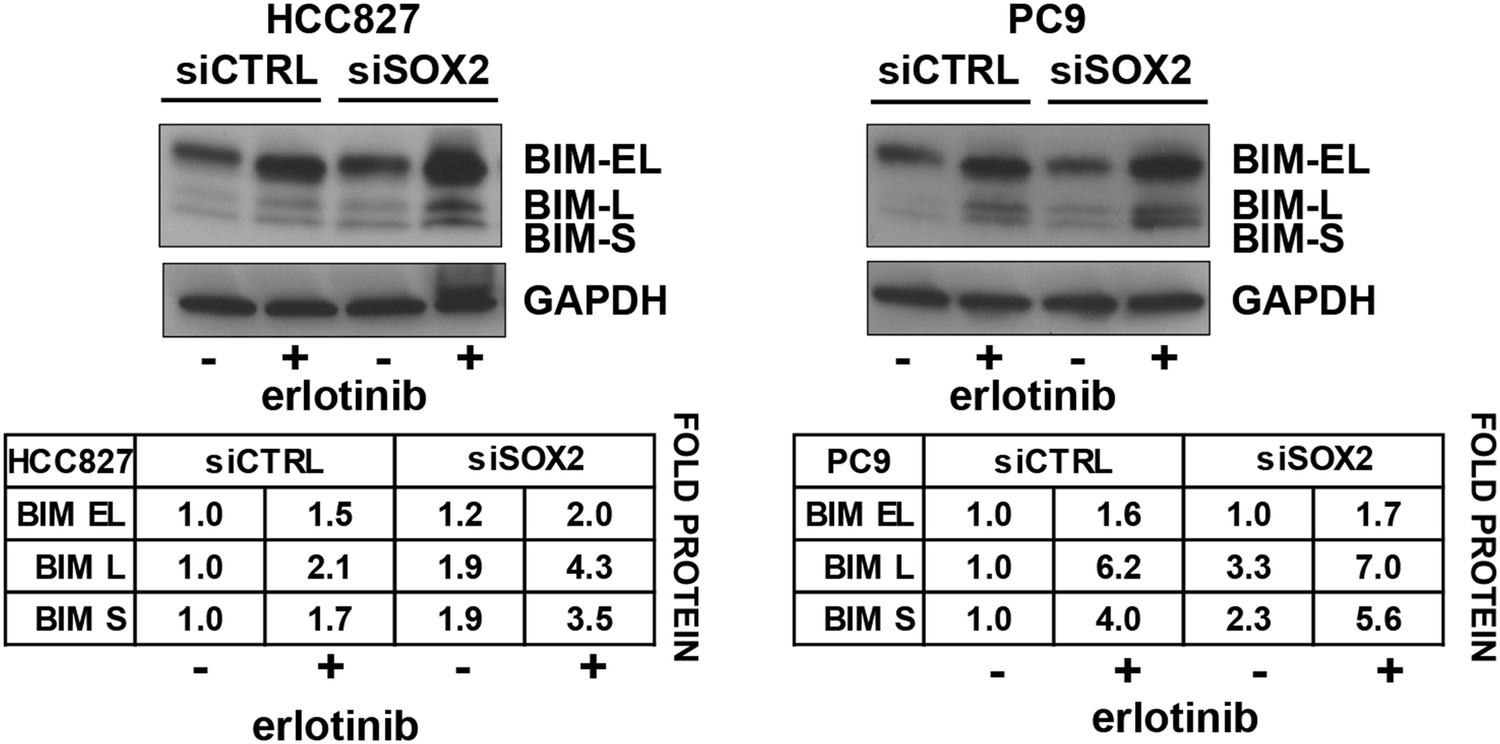
Quantitation of the effect of SOX2 knockdown on BIM levels.
Each BIM isoform (EL, L, and S) was normalized to the GAPDH loading control and untreated, siCTRL cells.
Figure 6 with 1 supplement

Erlotinib-induced SOX2 directly regulates expression of BIM and BMF.
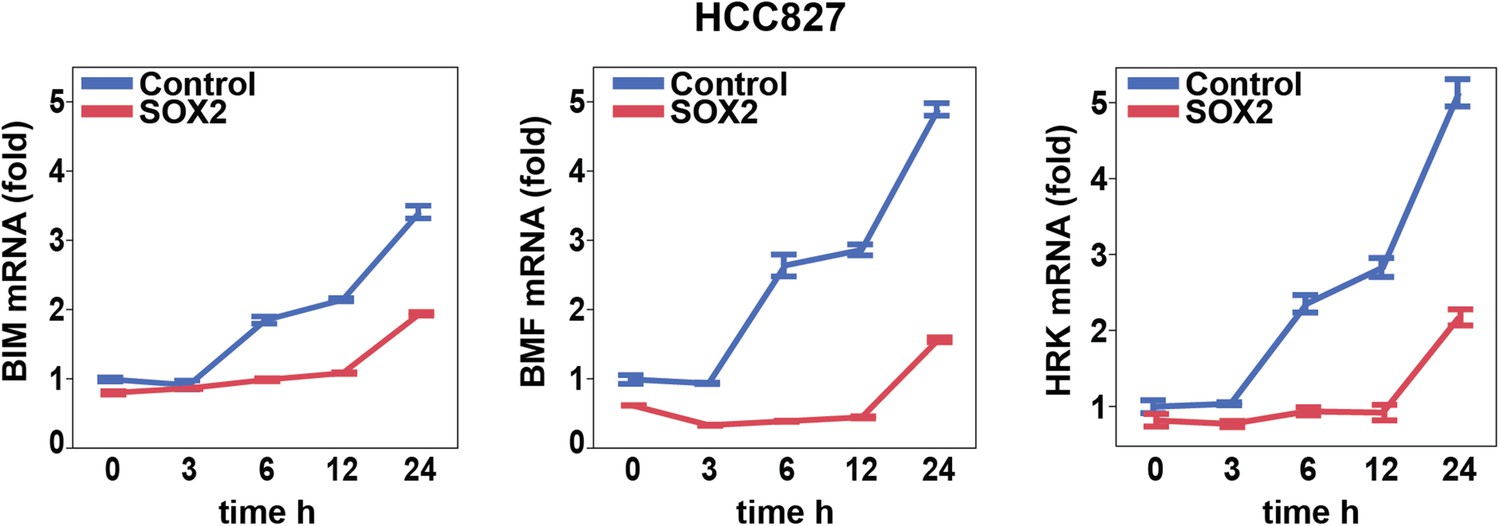
(A) The levels of transcripts for each of the indicated BH3 domain-containing proteins was assessed by quantitative PCR at multiple time points after erlotinib treatment in uninduced PC9 cells (blue lines) and in cells in which expression of SOX2 was induced with doxycycline (red lines), which was not removed prior to erlotinib addition in order to further increase SOX2 levels, as shown in Figure 5—figure supplement 1B. The y-axis maximum for all graphs is set to 4 except for HRK (y maximum = 11) and BMF (y maximum = 110). Data are displayed as mean Ct of 4 replicates (normalized to untreated cells and GAPDH) −/+ SEM. (B) Upper panel, ChIP seq demonstrates SOX2 binding to BIM and BMF. HCC827 cells were treated with 0.1 µM erlotinib for 24 hr, followed by chromatin immunoprecipitation (ChIP) using anti-SOX2 antibody and ChIP Seq as described in ‘Materials and methods’. ChIP seq signal tracks are displayed. Lower panel, HCC827 cells were left untreated or were treated with 0.1 µM erlotinib for 24 hr, followed by chromatin immunoprecipitation using anti-SOX2 antibody or IgG as a negative control, and qPCR with control primers or primers within the peaks indicated by the gray boxes in the ChIP seq tracks. Data are displayed as mean Ct value (normalized to input chromatin) of 4 replicates −/+ standard error, p-values for the comparison of untreated vs erlotinib treated cells are shown (Student's t-test, unequal variances). (C) Knockdown of BIM and BMF decreases apoptosis. Left panel, PC9 cells were transfected with siRNA constructs targeting BIM and BMF (alone or together) or a control siRNA. 24 hr after transfection, cells were treated with DMSO or 0.1 µM erlotinib. 24 hr after treatment, protein lysates were prepared, and immunoblot was performed with the indicated antibodies. Right panel, the efficiency of knockdown of BMF was confirmed by qPCR.
Figure 6—figure supplement 1
Effect of SOX2 overexpression on apoptotic regulators.
Induction of BIM, BMF, and HRK following erlotinib treatment of HCC827 cells was assessed as in Figure 6A.
Figure 7 with 4 supplements
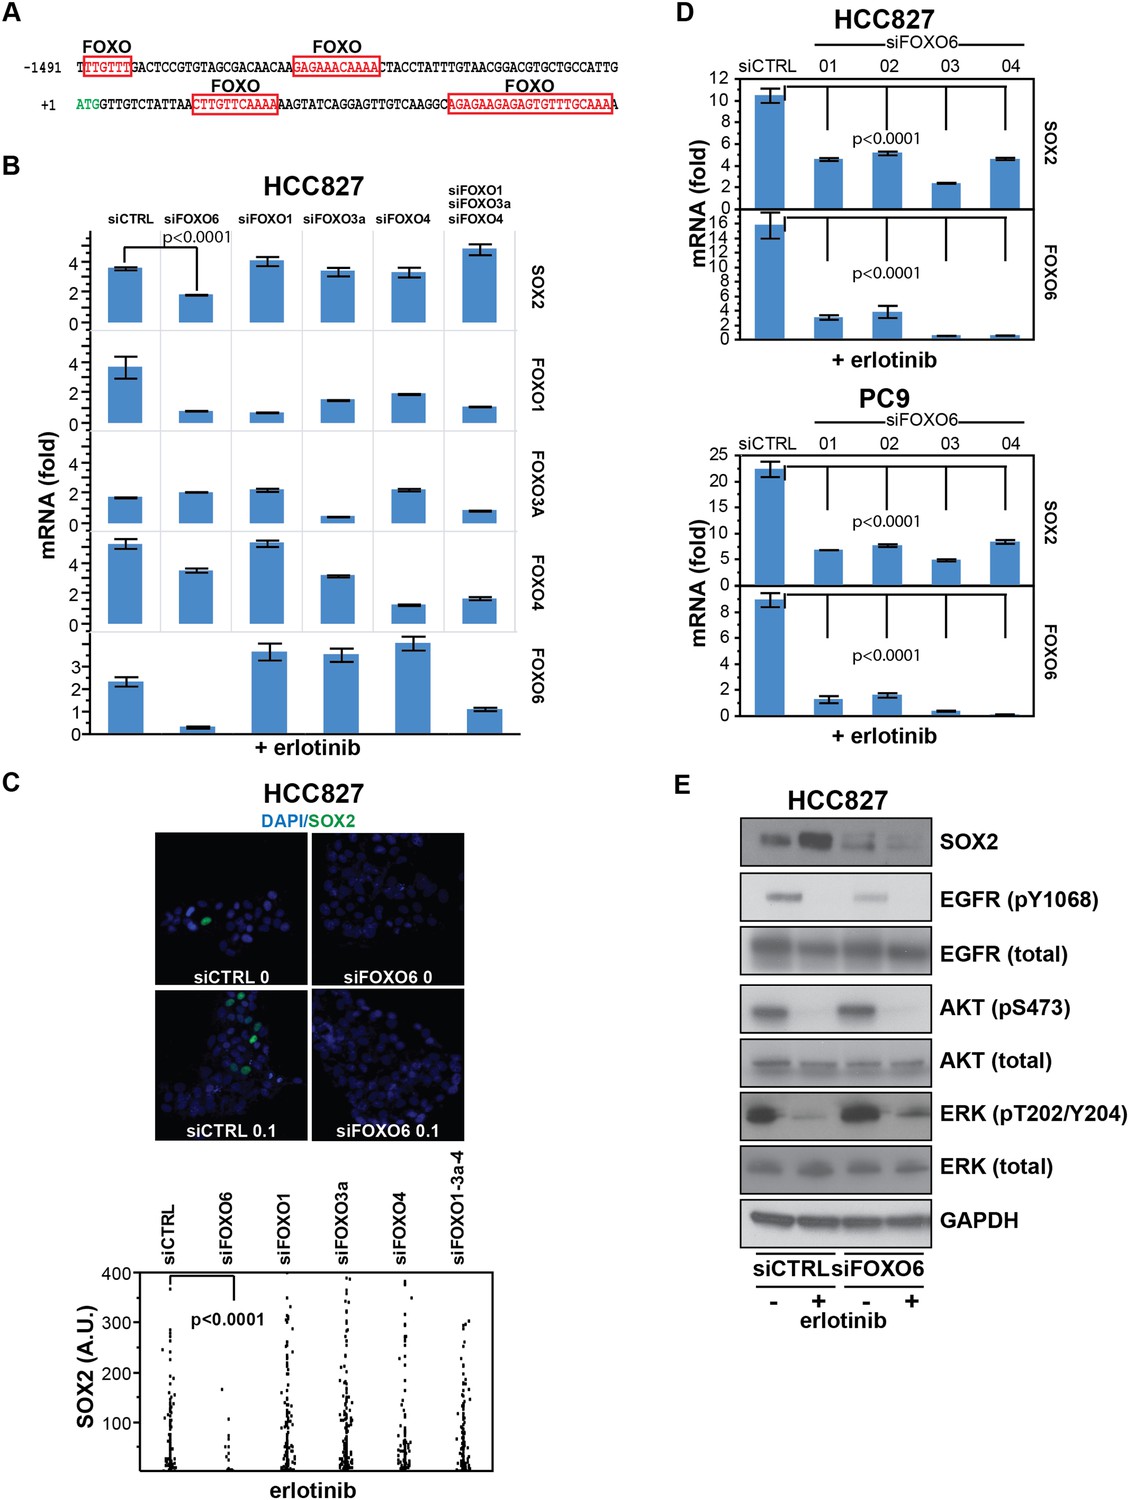
SOX2 expression in EGFR-mutant cells is regulated by FOXO6.
(A) Putative FOXO protein binding sites within the promoter of SOX2, identified using TRANSFAC and Zhang et al., 2011. (B) HCC827 cells were transfected with control siRNA or siRNA targeting the indicated FOXO proteins (alone or FOXOs 1, 3a and 4 in combination). 72-hr after transfection, DMSO or 0.1 µM erlotinib was added for 8 hr, and the levels of SOX2 and FOXO mRNAs were determined by qPCR. Data are shown as mean Ct (normalized to GAPDH and untreated siCTRL cells) of 3 replicates −/+ SEM. Only knockdown of FOXO6 results in significantly decreased induction of SOX2 mRNA by erlotinib compared to siCTRL cells. p < 0.0001, other siFOXOs are without significant decrease (Student's t-test, unequal variance). Although siRNA pools targeting FOXOs 3a and 4 also decrease FOXO1, the lack of a SOX2 effect with specific FOXO1 knockdown argues against their role in regulation of SOX2. (C) The effect of FOXO6 knockdown on induction of SOX2 in HCC827 cells is shown by immunofluorescence after staining of cells with SOX2 and DAPI (upper panels) and quantitated for knockdown of all of the FOXO isoforms (lower panel). Only knockdown of FOXO6 significantly decreases induction of SOX2 by erlotinib compared to siCTRL cells. p < 0.0001, other siFOXOs are without significant decrease (N = 766–1027 cells, Student's t-test, unequal variances). Source data are included as Figure 7—source data 1. Knockdown efficiency is demonstrated in Figure 7B. (D) Multiple different siRNAs effectively targeting FOXO6 block erlotinib-mediated induction of SOX2. HCC827 (upper) or PC9 (lower) cells were transfected with control siRNA or four different siRNA duplexes targeting FOXO6, treated with 0.1 µM erlotinib for 24 hr and mRNA was analyzed by qPCR. Data are shown as mean Ct (normalized to ACTB and untreated siCTRL cells) of 4 replicates −/+ SEM. p < 0.0001 for the comparison of each FOXO6 siRNA to siCTRL for both SOX2 and FOXO6 (Student's t-test, unequal variances). The effect of each siRNA on the levels of the other FOXO isoforms is shown in Figure 7—figure supplement 2C. (E) Knockdown of FOXO6 has minimal effects on other downstream components of EGFR signaling. HCC827 cells were transfected with siRNA targeting FOXO6 and treated with 0.1 µM erlotinib overnight followed by immunoblot analysis of protein lysates with the indicated antibodies. Knockdown of FOXO6 is demonstrated in Figure 7—figure supplement 2A.
-
Figure 7—source data 1
Raw immunofluorescence data for quantitation of SOX2 staining with different FOXO protein knockdown in Figure 7C.
- https://doi.org/10.7554/eLife.06132.037
-
Figure 7—source data 2
Raw immunofluorescence data for quantitation of SOX2 and FOXO6 costaining in HCC827 cells in Figure 7—figure supplement 3.
- https://doi.org/10.7554/eLife.06132.038
Figure 7—figure supplement 1
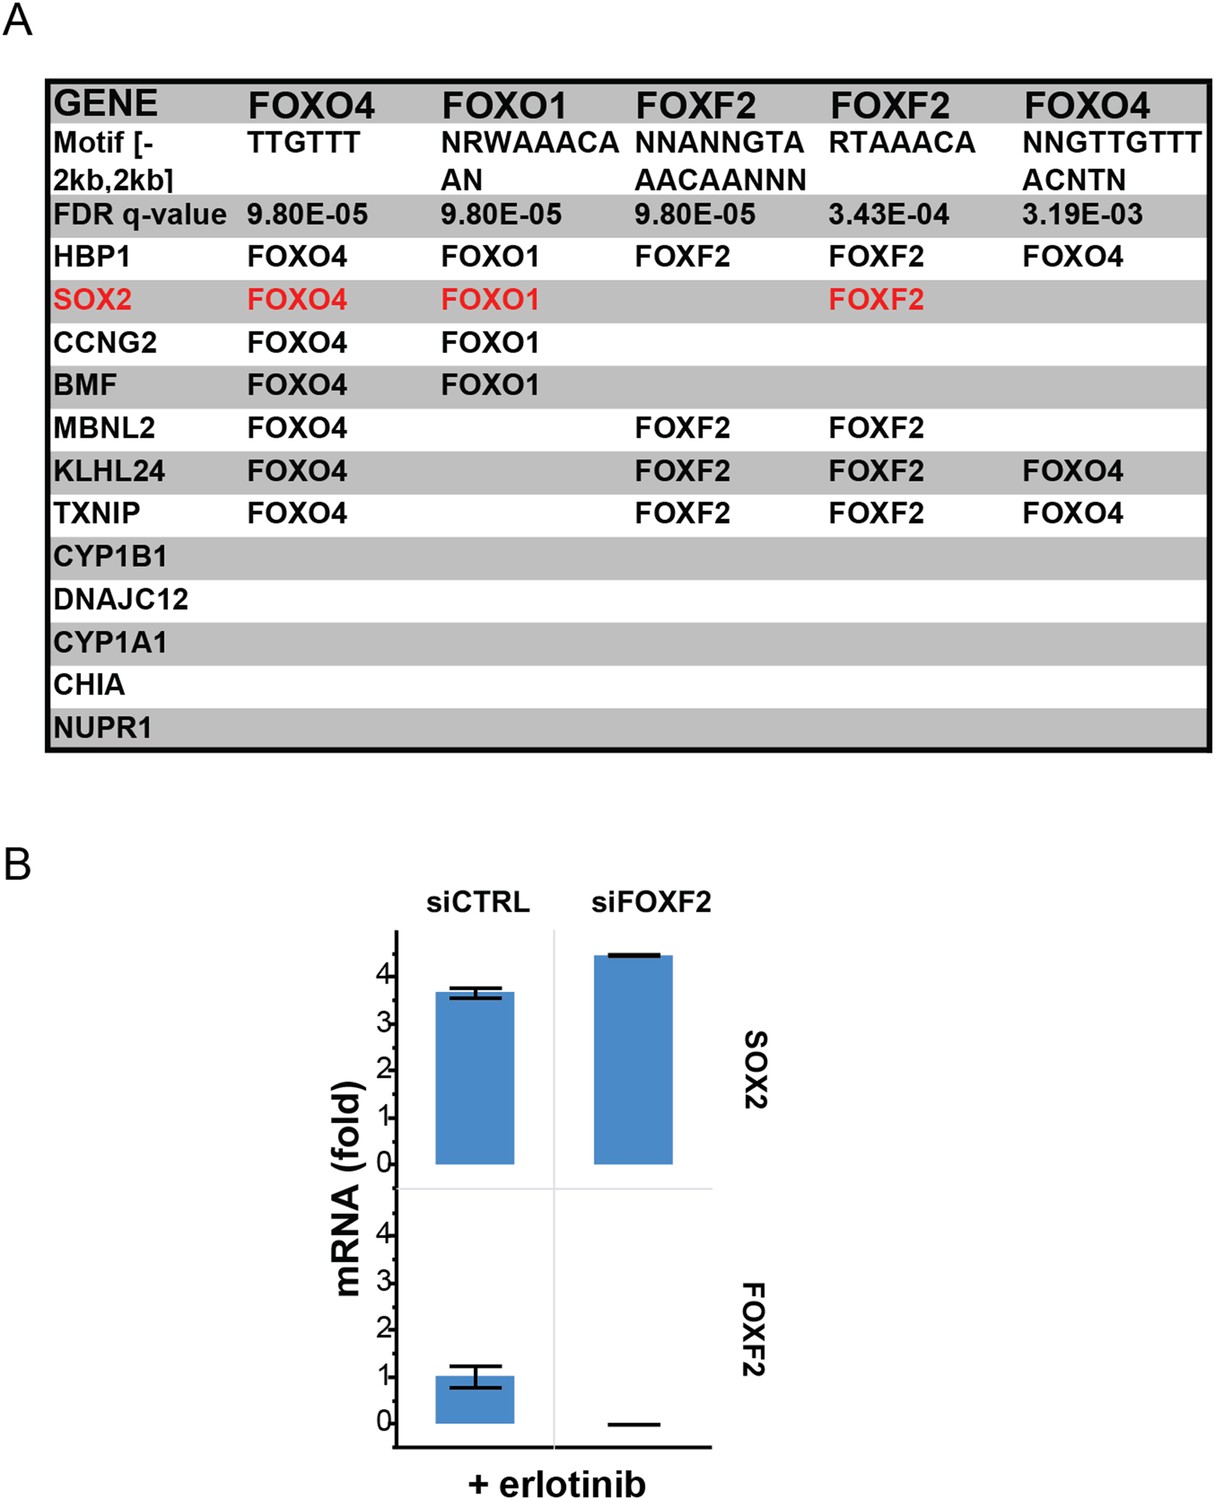
Recurrent FOXO binding sites in erlotinib-induced genes.
(A) MSigDB/TRANSFAC output for the 12 genes most highly upregulated by erlotinib (FDR <0.05). (B) Although binding sites for FOXF2 are also enriched, knockdown of FOXF2 does not decrease erlotinib-mediated induction of SOX2.
Figure 7—figure supplement 2
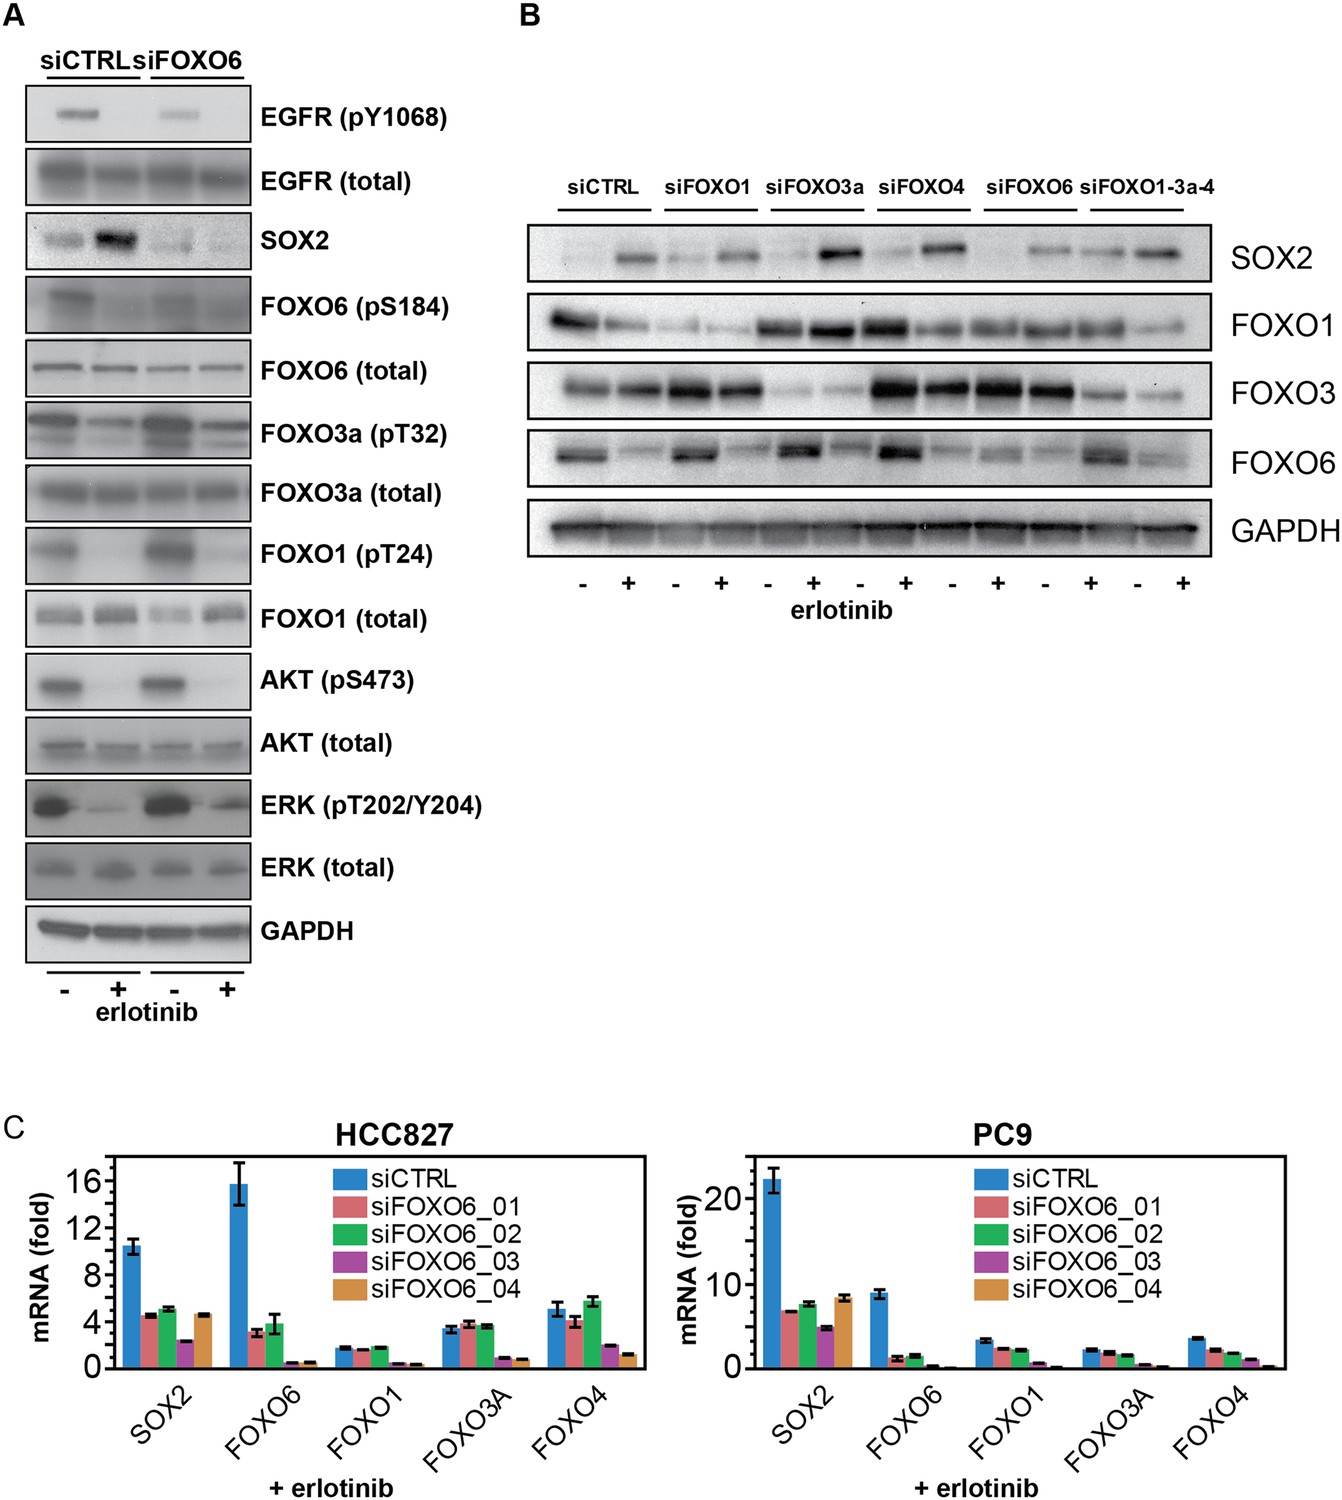
FOXO6 uniquely regulates SOX2 expression.
(A) Same lysates as Figure 7E, showing immunoblot for FOXO proteins. (B) Similar data as in Figure 7B, but shown after immunoblot of protein lysates with the indicated antibodies. Immunoblot for FOXO4 was consistently unable to detect a band of the correct size (65 kD). (C) Effect of individual siRNA duplexes targeting FOXO6 on the levels of other FOXO isoforms. Data are presented as in Figure 7D. Individual siFOXO6 siRNA duplexes −01 and −02 do not alter the levels of FOXOs 1, 3a or 4.
Figure 7—figure supplement 3
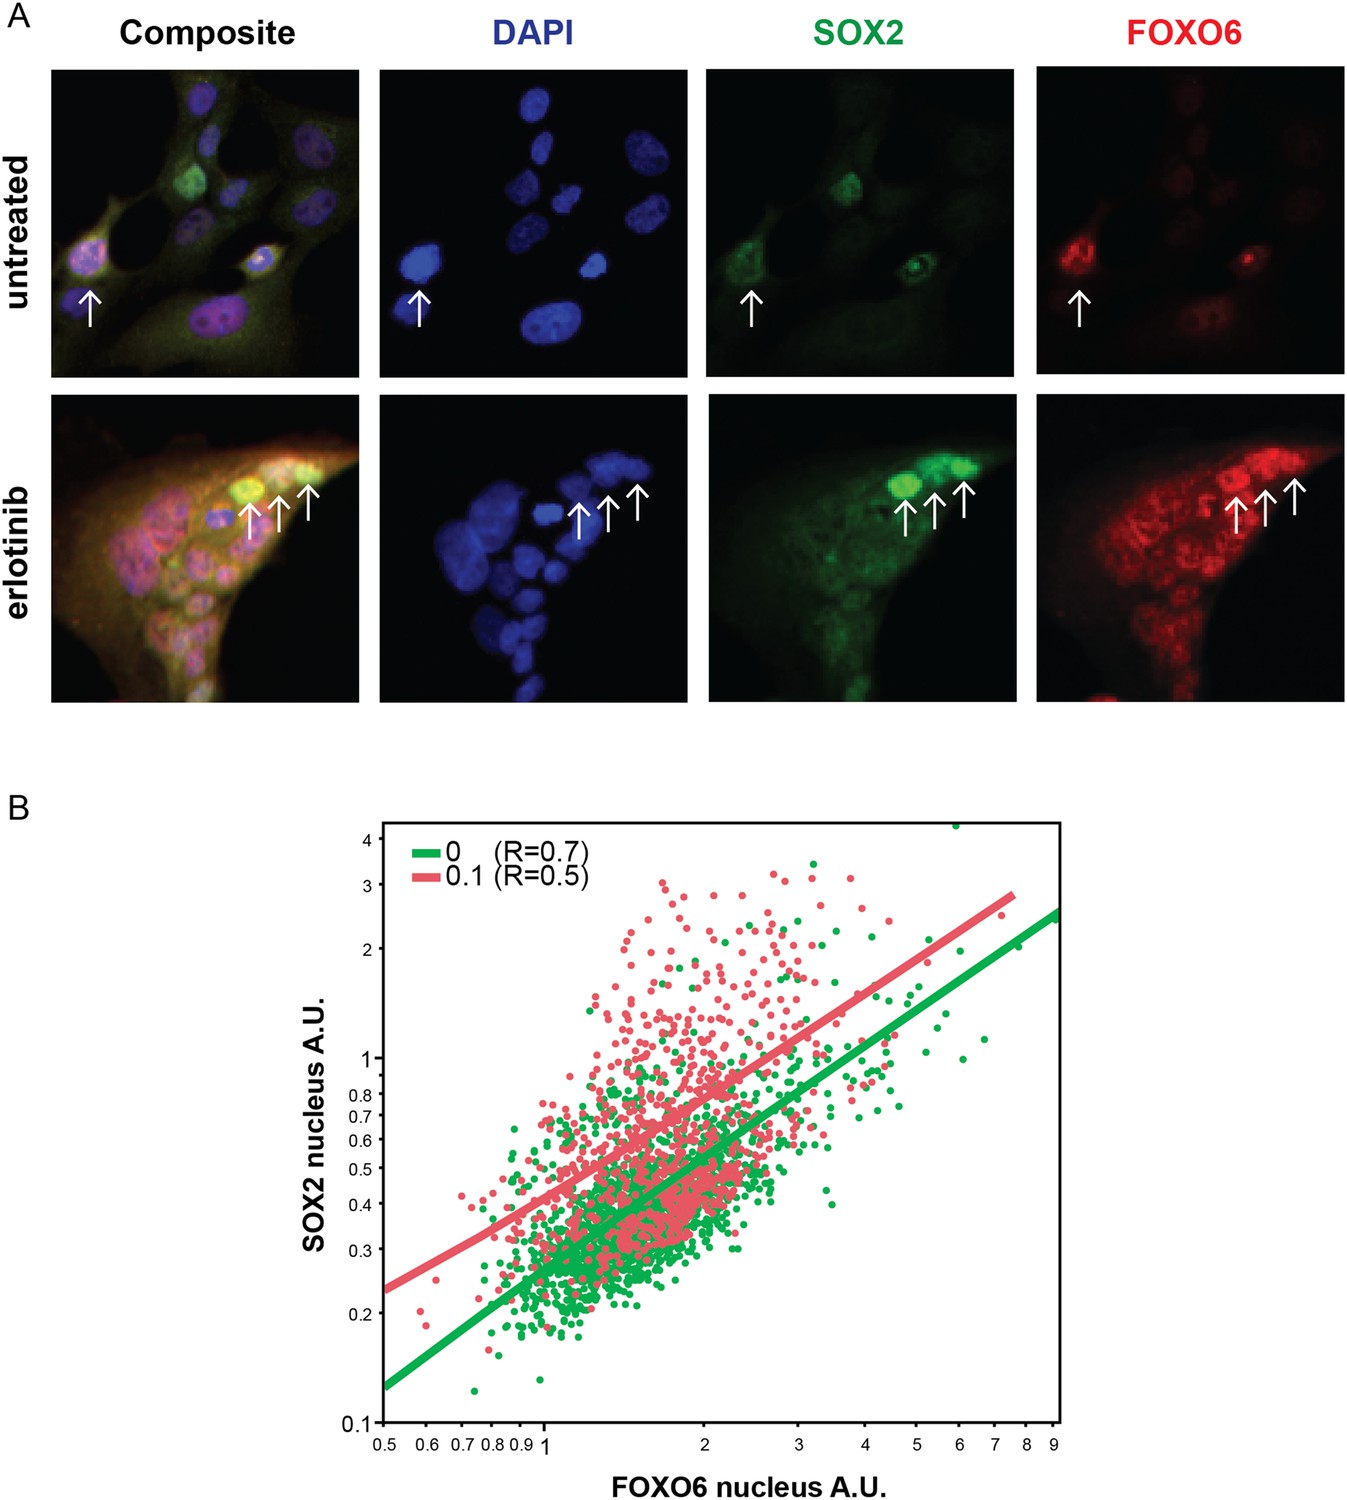
Distribution of FOXO6 vs SOX2 nuclear staining.
(A) HCC827 cells were left untreated or were treated with 0.1 µM erlotinib for 24 hr. Cells were stained with goat anti-SOX2 and rabbit anti-FOXO6 primary antibodies, followed by anti-goat-Alexa Fluor 488 (green) and anti-rabbit-Alexa Fluor 647 (red) secondary antibodies (and DAPI in blue). FOXO6 appears to colocalize (yellow in the leftmost panels) with SOX2 in cells with the highest expression of the latter, especially in erlotinib-treated cells (arrows). (B) Quantitative immunofluorescence analysis demonstrates a positive correlation between FOXO6 and SOX2 nuclear fluorescence in individual cells (Correlation coefficient R untreated/treated = 0.7/0.5, N = 1700/835 cells). Source data are included as Figure 7—source data 2.
Figure 7—figure supplement 4
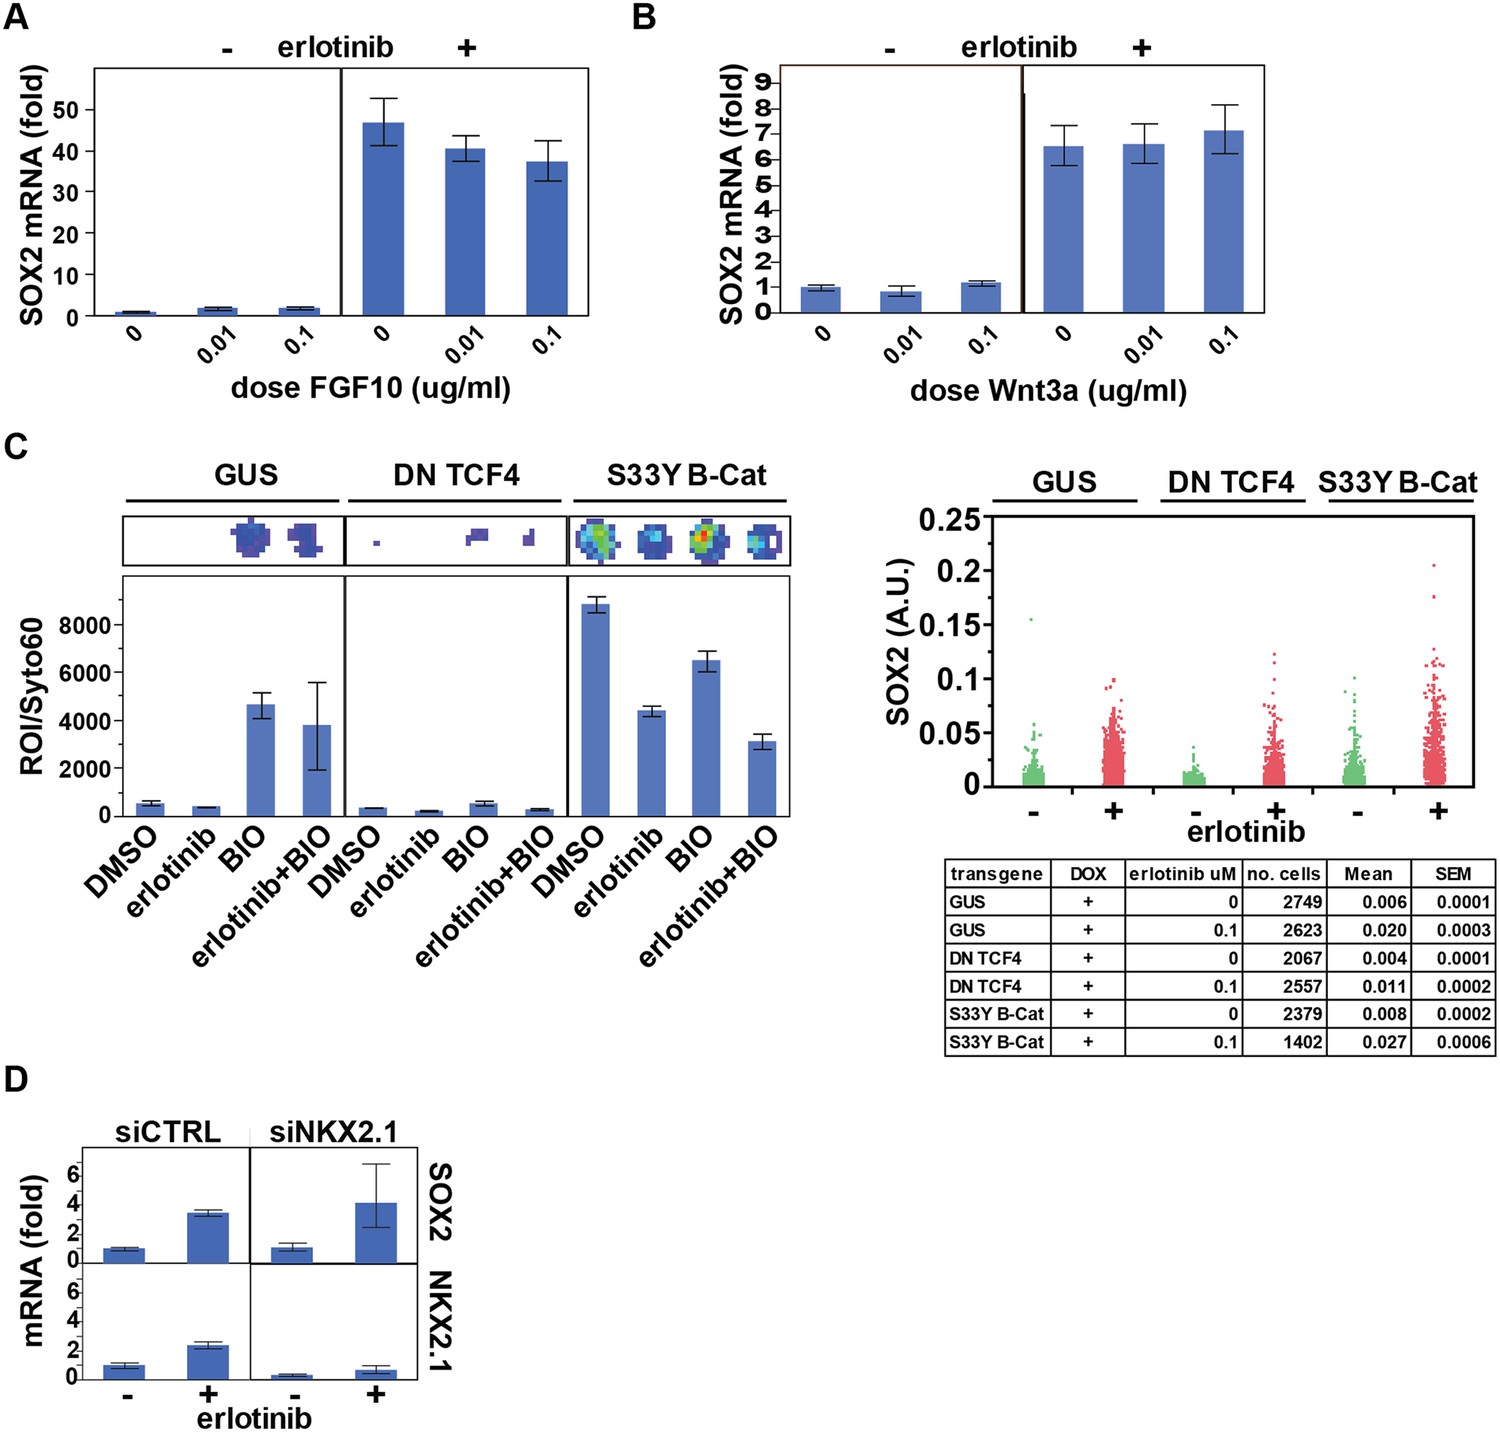
Assessing the role of previously identified regulators on erlotinib-induced expression of SOX2.
(A) Pre-treatment of PC9 cells with FGF10 has minimal effects on SOX2 induction by erlotinib. (B) The addition of exogenous Wnt3A has no effect on induction of SOX2 by erlotinib. (C) The beta-catenin pathway does not regulate SOX2 expression. HCC827 cells were stably transduced with inducible lentiviral constructs expressing a dominant negative TCF4 transgene (DN TCF4) or the constitutively activated S33Y variant of Beta-Catenin (S33Y B-Cat), and with a lentiviral TOP FLASH reporter. Left, the expected activity of each transgene was confirmed by TOP FLASH luciferase assay in the absence or presence of the GSK3 inhibitor/Beta-Catenin activator BIO (and −/+ erlotinib). Representative wells after luciferase imaging are shown above the graph. Right, the effect of each transgene on the levels of SOX2 induction by erlotinib compared to control (GUS) cells is minimal. (D) Knockdown of TTF1 (NKX2.1) with siRNA has minimal effects on the degree of SOX2 induction by erlotinib.
Figure 8
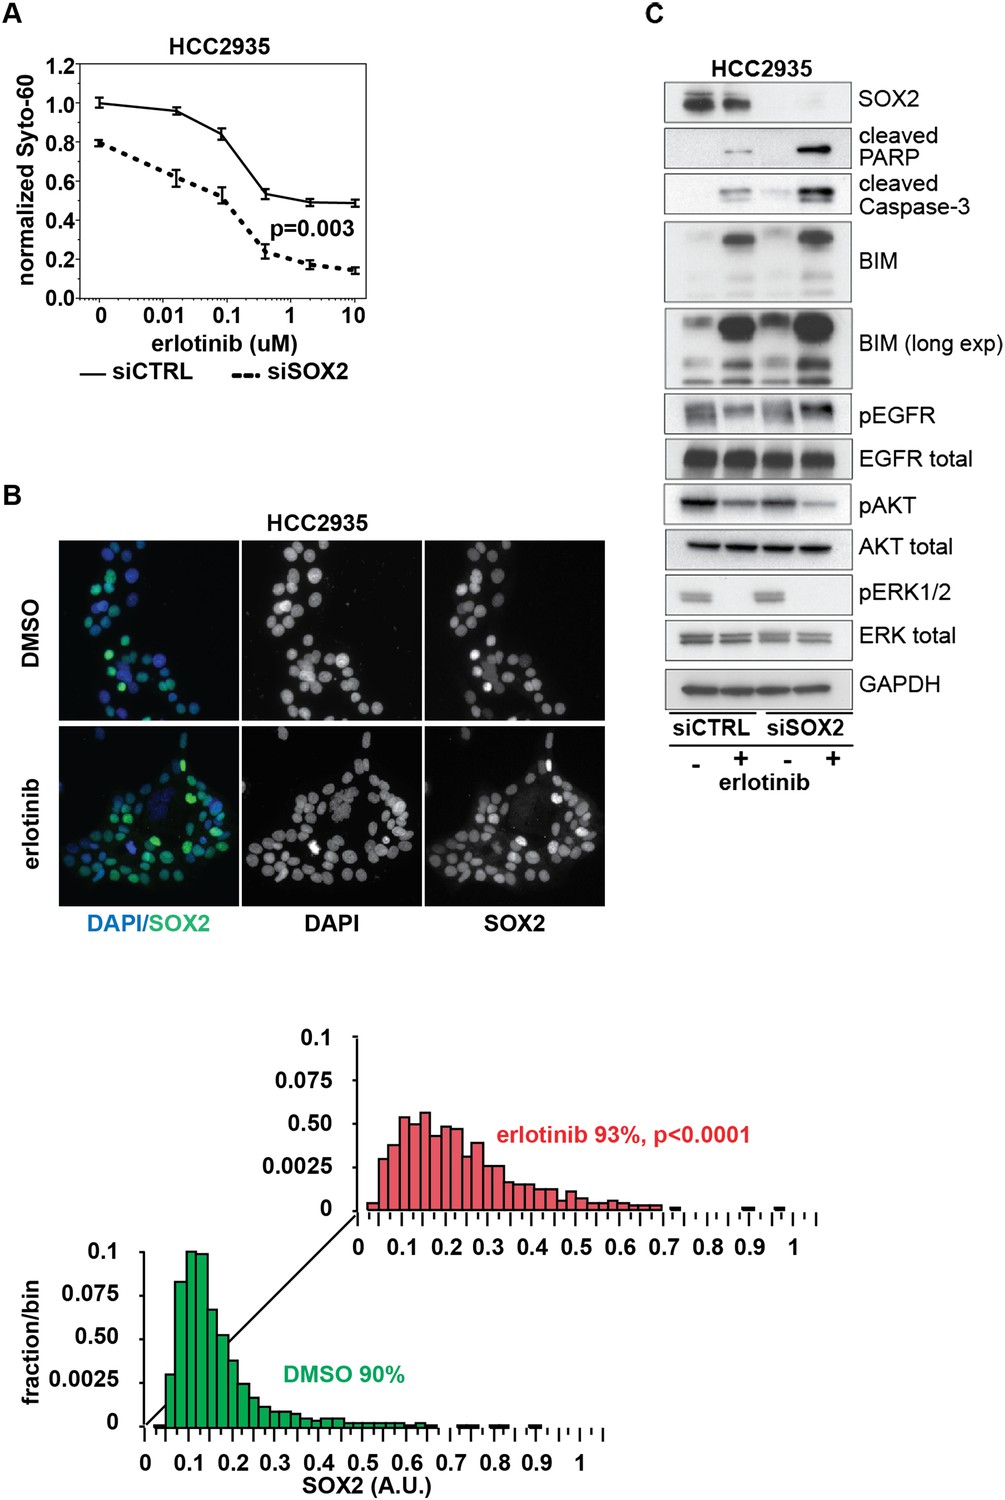
Knockdown of SOX2 sensitizes HCC2935 cells to erlotinib-induced apoptosis.
(A) HCC2935 cells were transfected with siCTRL or siSOX2 48 hr prior to erlotinib addition and assayed for cytoxicity 48 hr later with Syto-60. Data are displayed as the mean of 5 replicates −/+ SEM. The IC50 is 0.8 µM for siCTRL and 0.1 µM for siSOX2 cells (calculated by four parameter logistic sigmoidal fit). p = 0.003 for the comparison of mean IC50 for siCTRL vs siSOX2 (Student's t-test, unequal variances). (B) Upper panels, images of untreated and erlotinib-treated HCC2935 cells, demonstrating SOX2 expression in the majority of cells. Lower panels, the distribution of SOX2 in HCC2935 was determined by quantitative immunofluorescence microscopy. p < 0.0001 for the comparison of mean SOX2 fluorescence in untreated vs treated cells (Student's t-test, unequal variances, N = 3342/1181, means for SOX2 fluorescence are 0.17/0.24 for untreated/treated cells, % SOX2+ is shown). Source data is included as Figure 8—source data 1. (C) HCC2935 cells were transfected with control siRNA or siRNA targeting SOX2. 48 hr after transfection, DMSO or 1.0 µM erlotinib was added. The effect of SOX2 knockdown was assessed by immunoblot analysis of protein lysates with the indicated antibodies after overnight treatment.
-
Figure 8—source data 1
Raw immunofluorescence data for quantitation of SOX2 staining in HCC2935 cells in Figure 8B.
- https://doi.org/10.7554/eLife.06132.044
Figure 9

Model of SOX2 feedback signaling pathway.
In untreated cells, mutant EGFR drives cell survival by activating downstream signaling pathways, including PI3K and MAPK, which inhibit apoptosis through transcriptional and post-transcriptional effects on BH3-domain proteins, including pro-apoptotic BIM and BMF. In most cells (red lines), erlotinib treatment results in EGFR inhibition, inhibition of downstream signaling and increased pro-apoptotic proteins, leading to apoptosis. The high SOX2 induced by erlotinib through activation of FOXO6 in some cells (blue lines) counteracts the pro-apoptotic effects of EGFR inhibition, sufficiently decreasing the levels of BIM and BMF to delay the apoptotic response.
Additional files
-
Supplementary file 1
siRNA, primer, and probe sequences/sources used in the study.
- https://doi.org/10.7554/eLife.06132.046
Download links
A two-part list of links to download the article, or parts of the article, in various formats.
Downloads (link to download the article as PDF)
Open citations (links to open the citations from this article in various online reference manager services)
Cite this article (links to download the citations from this article in formats compatible with various reference manager tools)
Inhibition of mutant EGFR in lung cancer cells triggers SOX2-FOXO6-dependent survival pathways
eLife 4:e06132.
https://doi.org/10.7554/eLife.06132


