Reverse-correlation analysis of navigation dynamics in Drosophila larva using optogenetics
- Harvard University, United States
- Yale University, United States
Figures
Figure 1 with 1 supplement
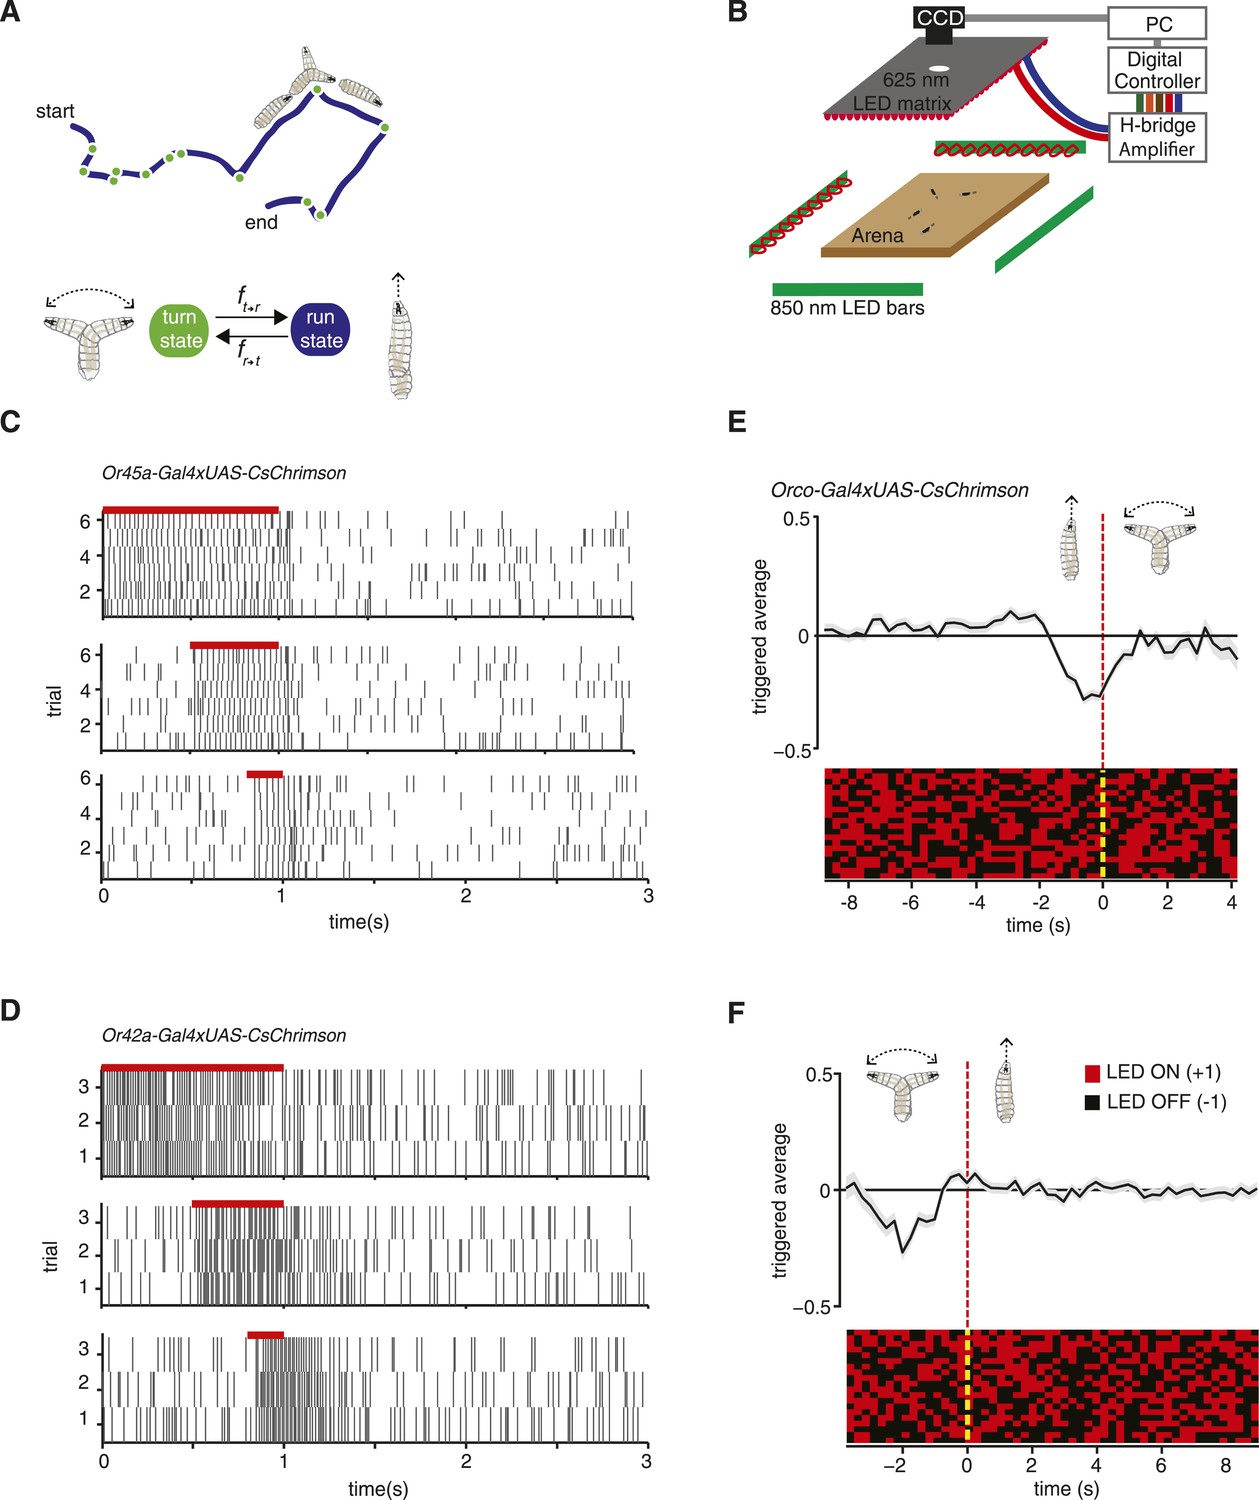
Experimental method for reverse-correlation analysis using optogenetics.
(A) Larvae navigate by alternating between two basic motor states: runs and turns. The navigation strategy of the animal can be characterized by finding the mathematical functions, fr → t and ft → r that represent the stimulus dependence of transition rates. (B) Schematic of experimental setup. Larvae crawl on a 22 × 22 cm agar plate. Dark-field illumination is provided by lateral infrared LED bars, and animal movements are recorded with a CCD camera equipped with an infrared long-pass filter. Optogenetic illumination is provided by a matrix of red 625-nm LEDs from above. (C) We made extracellular recordings in the olfactory organ of the Drosophila larvae. Here, we show the rasters of the spikes induced by CsChrimson activation of the Or45a-expressing olfactory receptor neuron (ORN). We used 3 different pulse widths: 0.2, 0.5, and 1 s, all of them with the same intensity used for behavior experiments (1.9 W/m2). The red bar in the top of each raster represents the period during which red lights were ON. Each vertical line in the raster represents one spike. (D) Analogous to figure (C), we measured induced spiking of Or42a. The red bar in the top of each raster represents the period during which red lights were ON. Each vertical line in the raster represents one spike. (E) Mean stimulus history before each run-to-turn transition and (F) turn-to-run transition exhibited by Orco>CsChrimson larvae subjected to random ON/OFF optogenetic stimulation. The stimulus history for each motor state transition is aligned (dotted line) and averaged by assigning +1 to the LED ON state and −1 to the LED OFF state. Data represent mean (black line) ± one SEM (gray shaded region) for 2018 transitions exhibited by 135 larvae. 20 event-triggered stimulus histories are shown in the raster to illustrate the random binary stimulus pattern used in our experiments.
Figure 1—figure supplement 1
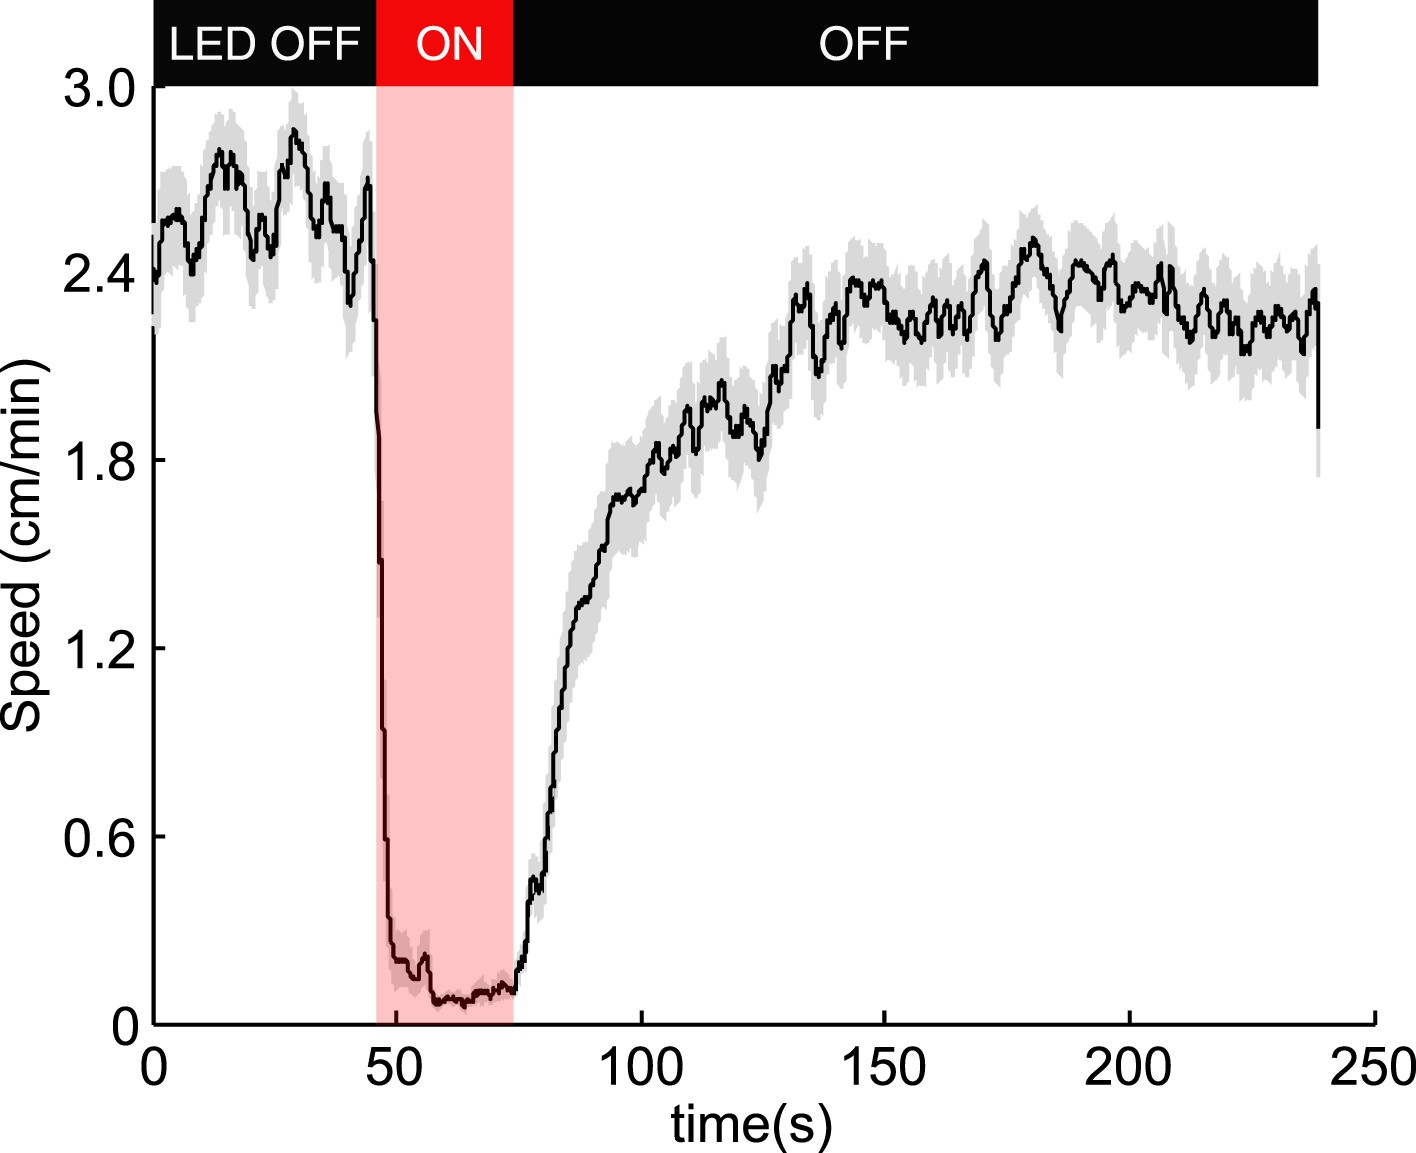
Optogenetic activation of OK6-Gal4 motor neurons.
To test if our experimental setup robustly activates CsChrimson, we expressed it in motor neurons using the OK6-Gal4 driver (Sanyal, 2009). Effective activation would result in most muscles of the larvae contracting simultaneously and not allowing larvae to crawl. Consistent with that, during illumination 100% of the 85 larvae tested stopped crawling during illumination and slowly recovered motility afterwards. The figure shows the mean speed (black line) ± SEM (grey shaded area).
Figure 2
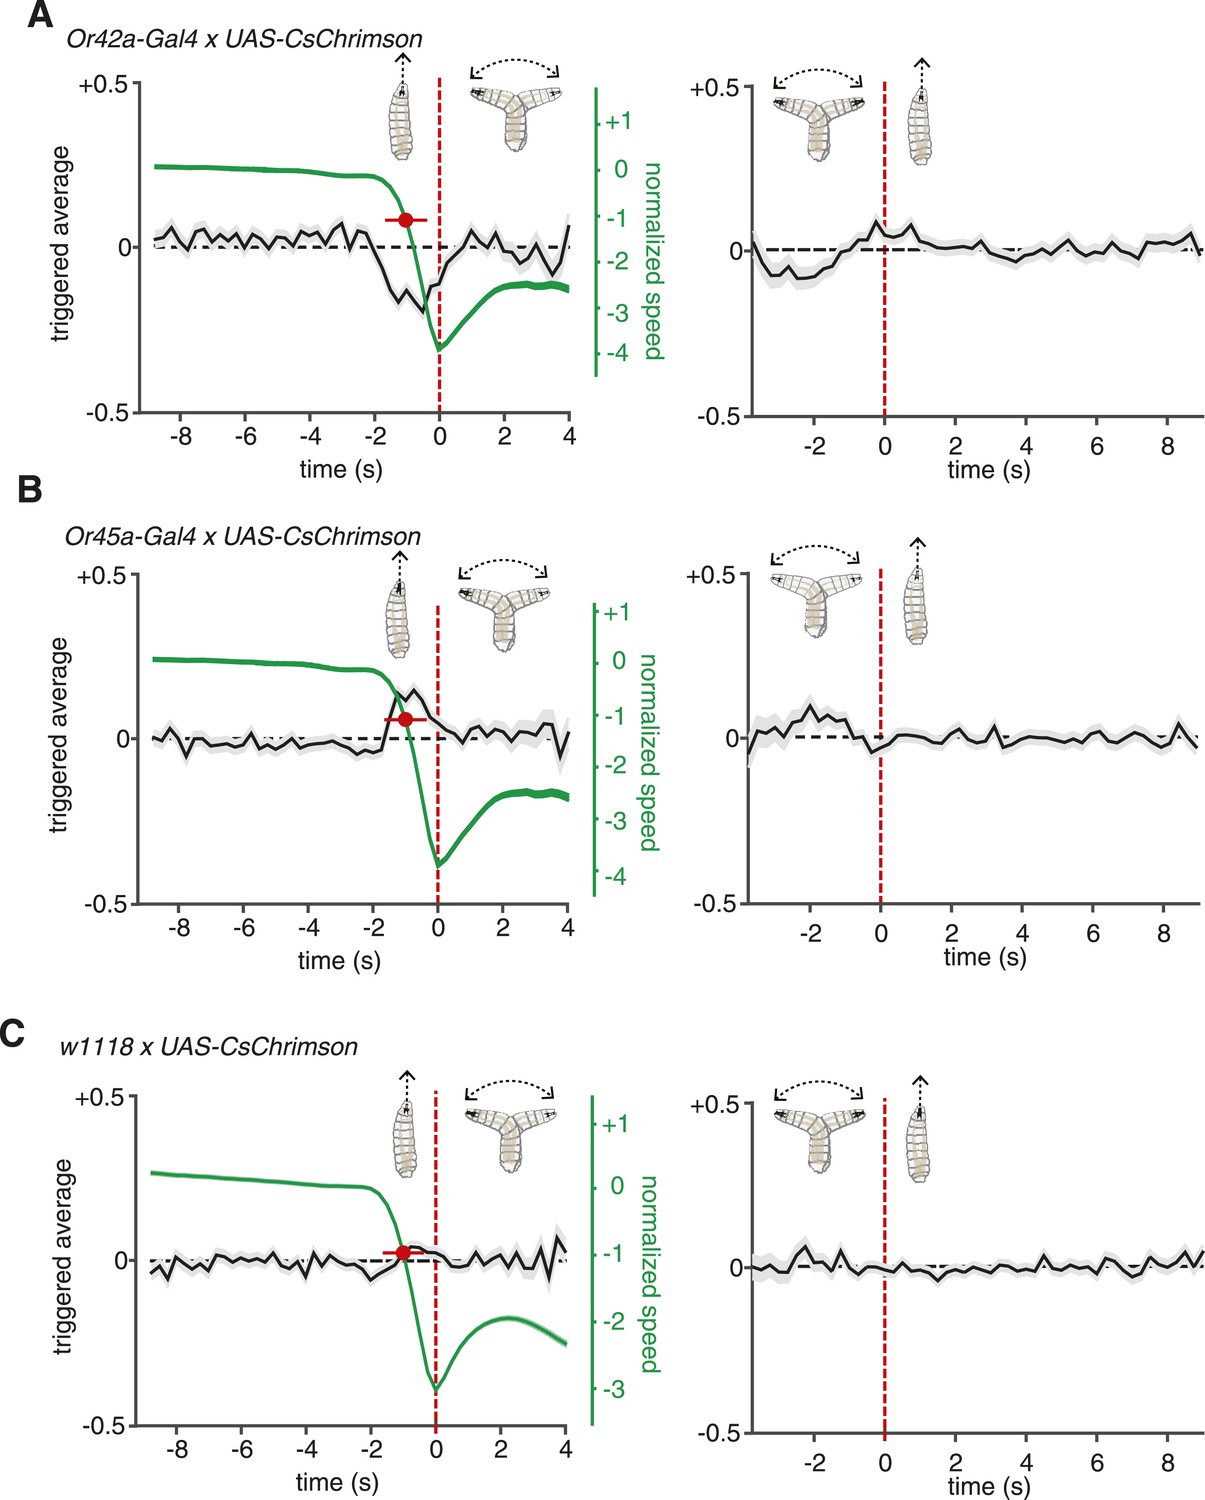
ORNs evoked navigation strategy.
(A) Event-triggered stimulus histories for run-to-turn (left panel) and turn-to-run (right panel) transitions exhibited by Or42a>CsChrimson larvae subjected to random optogenetic stimulation as described in Figure 1. Consistent with an attractive response, the likelihood of optogenetic activation falls before a run-to-turn transition and rises before a turn-to-run transition. In run-to-turn transitions, crawling speed begins to fall before the initiation of turning movements (green traces). The mean beginning of deceleration averaged over all animals is flagged by the red dot (± STD). The units of normalized speed are standard deviations away from the mean crawling speed during runs. Data represent mean (black line) ± one SEM (grey shaded region) for 2752 transitions exhibited by 124 larvae. (B) Event-triggered stimulus histories exhibited by Or45a>CsChrimson larvae. Consistent with a repulsive response, the likelihood of optogenetic activation increases before a run-to-turn transition and decreases before a turn-to-run transition. Data represent mean (black line) ± one SEM (gray shaded region) for 3313 transitions exhibited by 119 larvae. The mean beginning of deceleration averaged over all animals is flagged by the red dot (± STD). (C) Control larvae event-triggered averages. Event-triggered averages of control larvae were uncorrelated with red light illumination patterns. Data represent mean (black line) ± one SEM (gray shaded region) for 4677 transitions exhibited by 121 larvae. The mean beginning of deceleration averaged over all animals is flagged by the red dot (± STD).
Figure 3 with 2 supplements
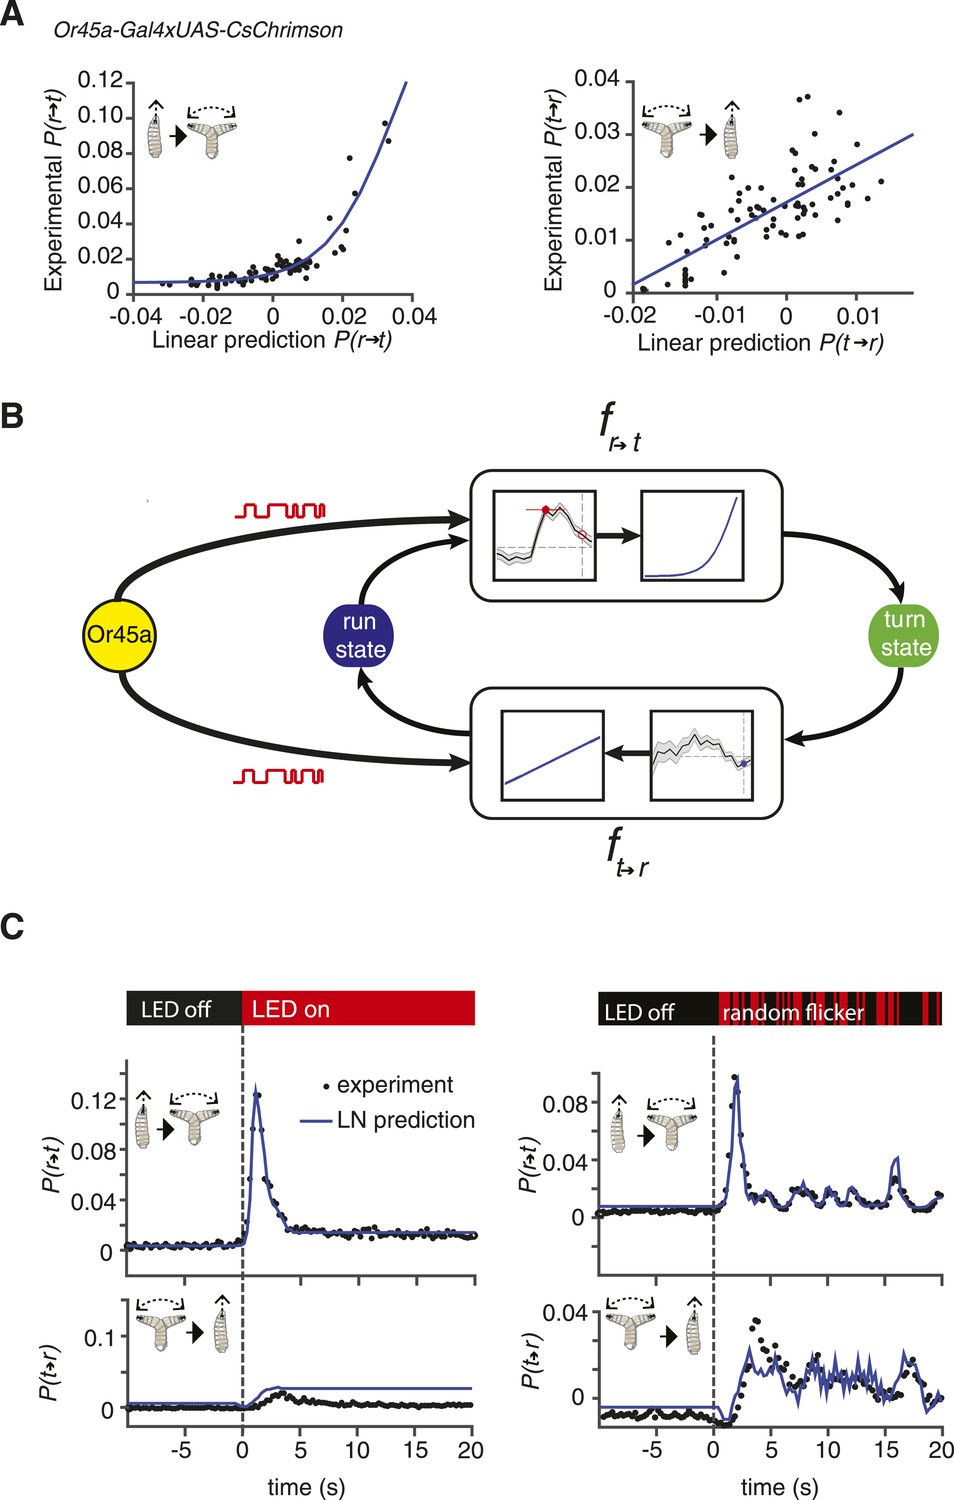
Linear-nonlinear (LN) models of behavior.
(A) Estimating the static nonlinear function for run-to-turn and turn-to-run transitions exhibited by Or45a>CsChrimson larvae. Linear prediction using the event-triggered stimulus histories from Figure 2B was compared with the experimental measurements that generated the stimulus histories. The static nonlinearity for the run-to-turn transition is fitted using least squares estimation of a sigmoidal function (R2 = 0.8792). The static nonlinearity for the turn-to-run transition is fitted with a line (R2 = 0.5041). (B) Schematic representation of the LN model of navigation. Linear filters are convolved with the input signal, and the result is scaled according to the static nonlinear function fitted to estimate the probability rates for switching from one motor state to the other. (See ‘Materials and methods’). (C) LN model predictions (blue lines) of behavioral responses to step changes in optogenetic illumination (left panels) and defined random flicker (right panels). Predictions are made using the linear filter measured in Figure 2B and the static nonlinearity measured in Figure 3A. Experimental measurements to compare with prediction (black dots) represent data from N = 120 for the step response prediction and N = 240 larvae for the flicker response prediction.
Figure 3—figure supplement 1
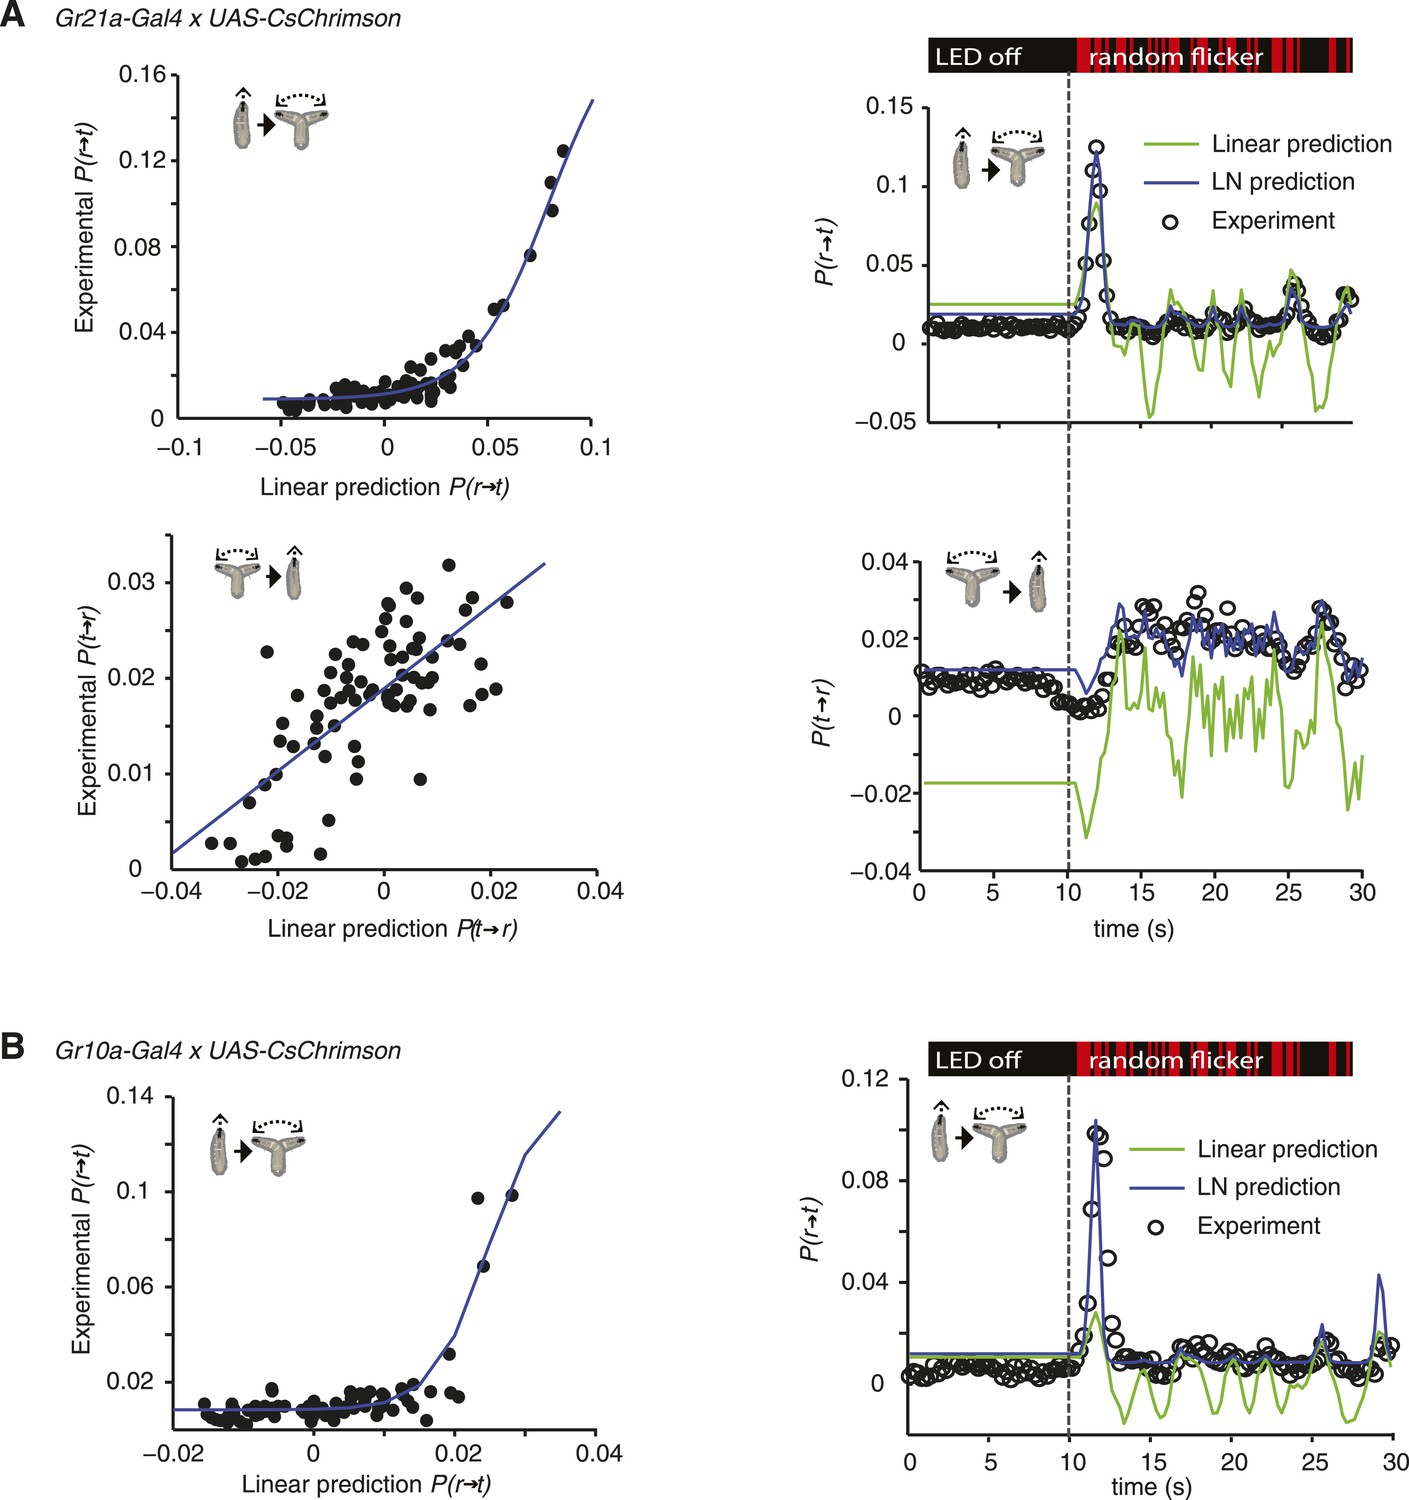
LN models of Gr21a and Gr10a.
(A) Estimating the static nonlinear function for run-to-turn and turn-to-run transitions exhibited by Gr21a>CsChrimson larvae (left panels). Linear prediction using the event-triggered stimulus histories from Figure 3A was compared with the experimental measurements that generated the stimulus histories. The static nonlinearity for the run-to-turn transition is fitted using least squares estimation of a sigmoidal function (R2 = 0.9494). The static nonlinearity for the turn-to-run transition is fitted with a line (R2 = 0.5082). LN model predictions (blue lines) and linear filter predictions (green lines) of behavioral responses to defined random flicker (right panels). Predictions are made using the linear filter measured in Figure 3A and the static nonlinearity showed in the left panel. Experimental measurements to compare with prediction (black dots) represent data from N = 156 larvae. (B) Estimating the static nonlinear function for run-to-turn transitions exhibited by Gr10a>CsChrimson larvae (left panel). Linear prediction using the event-triggered stimulus histories from Figure 5 was compared with the experimental measurements that generated the stimulus histories. The static nonlinearity for the run-to-turn transition is fitted using least squares estimation of a sigmoidal function with (R2 = 0.6221). At the resolution power employed in this study, the turn-to-run linear filter could not be distinguished from noise. LN model predictions (blue lines) and linear filter predictions (green lines) of behavioral responses to defined random flicker (right panels). Predictions are made using the linear filter measured in Figure 5 and the static nonlinearity showed in the left panel. Experimental measurements to compare with prediction (black dots) represent data from N = 183 larvae.
Figure 3—figure supplement 2
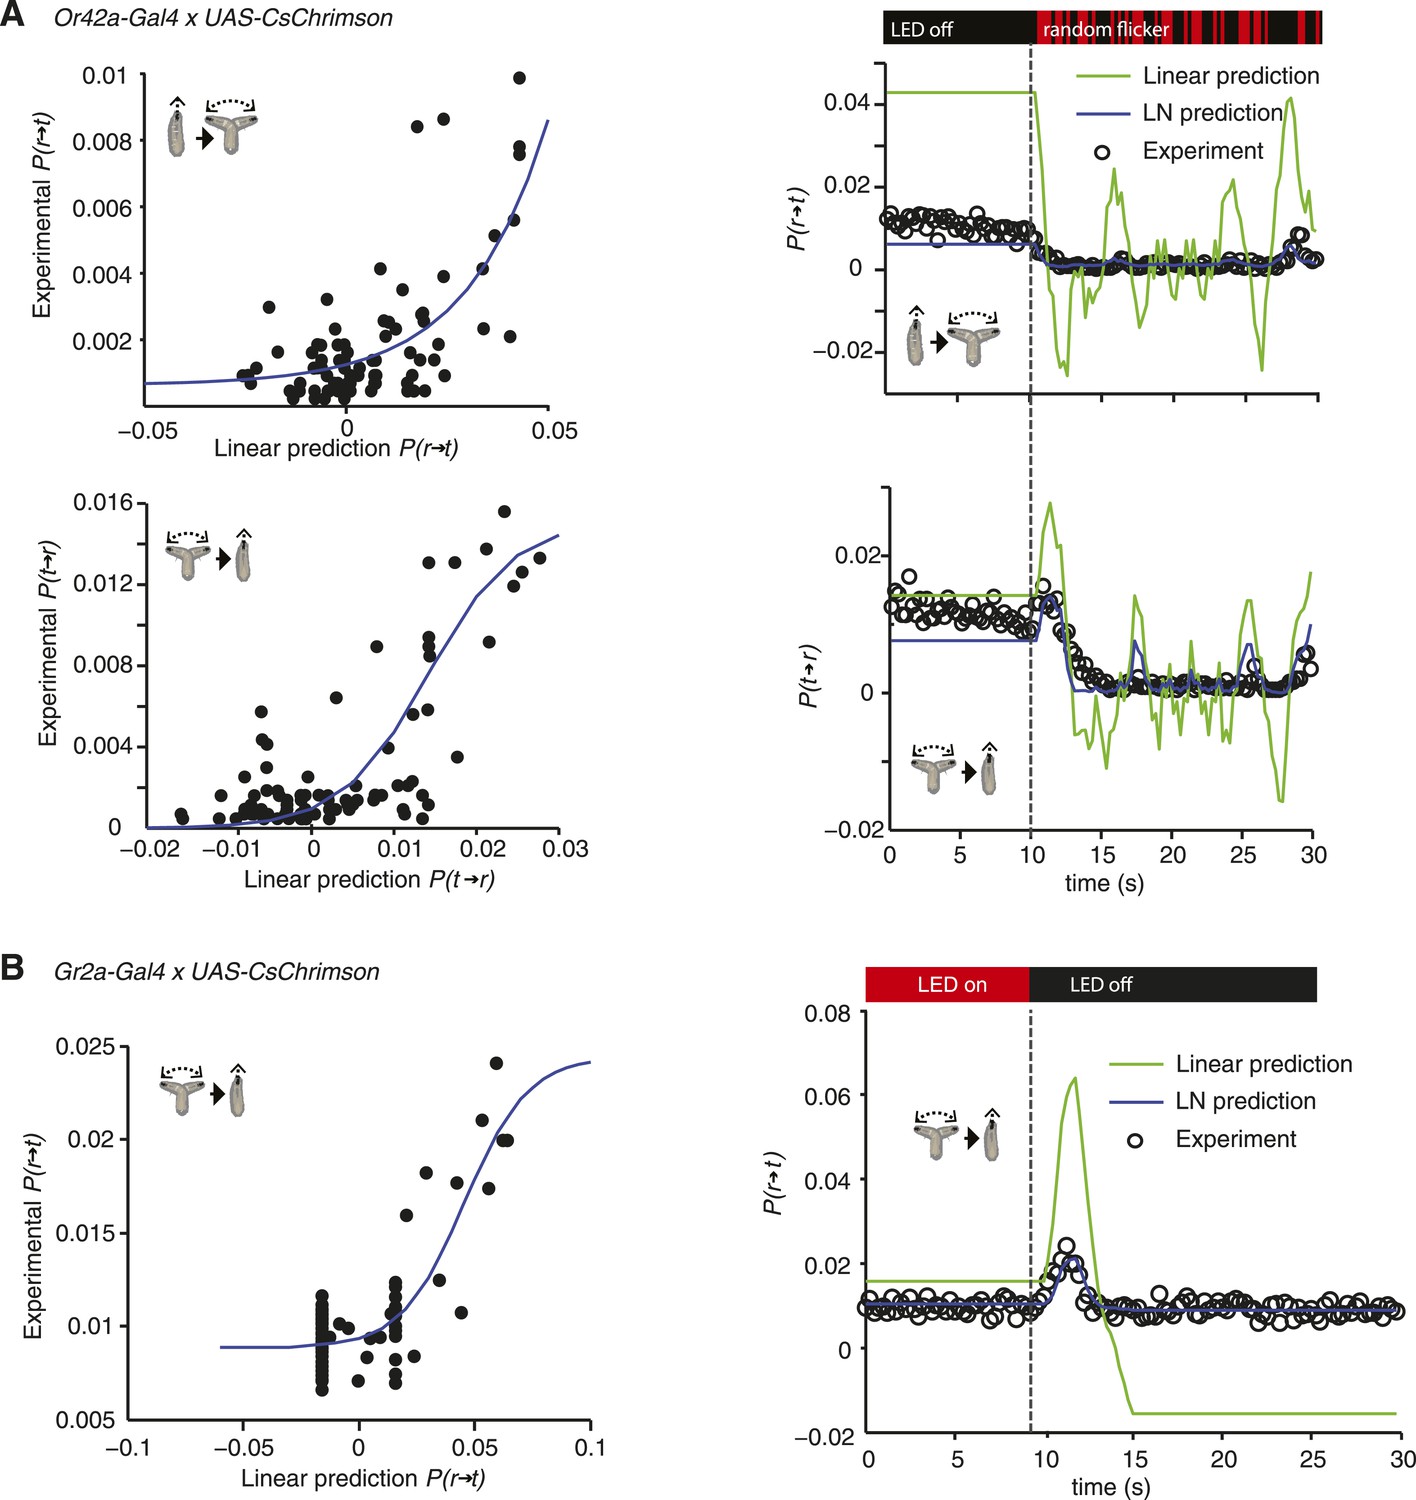
LN models of Or42a and Gr2a.
(A) Estimating the static nonlinear function for run-to-turn and turn-to-run transitions exhibited by Or42a>CsChrimson larvae (left panels). Linear prediction using the event-triggered stimulus histories from Figure 2A was compared with the experimental measurements that generated the stimulus histories. The static nonlinearity for the run-to-turn transition is fitted using least squares estimation of a sigmoidal function with (R2 = 0.7617). The static nonlinearity for the turn-to-run transition is fitted with a sigmoid with (R2 = 0.625). LN model predictions (blue lines) and linear filter predictions (green lines) of behavioral responses to defined random flicker (right panels). Predictions are made using the linear filter measured in Figure 2A and the static nonlinearity showed in the left panel. Experimental measurements to compare with prediction (black dots) represent data from N = 207 larvae. (B) Estimating the static nonlinear function for run-to-turn transitions exhibited by Gr2a>CsChrimson larvae (left panel). Linear prediction using the event-triggered stimulus histories from Figure 4C was compared with the experimental measurements that generated the stimulus histories. The static nonlinearity for the run-to-turn transition is fitted using least squares estimation of a sigmoidal function with (R2 = 0.6752). LN model predictions (blue lines) and linear filter predictions (green lines) of behavioral responses to a step decrease (right panels). Predictions are made using the linear filter measured in Figure 4C and the static nonlinearity showed in the left panel. Experimental measurements to compare with prediction (black dots) represent data from N = 195 larvae.
Figure 4 with 1 supplement

Distinct navigation dynamics.
(A) Event-triggered stimulus histories exhibited by Gr21a>CsChrimson larvae. Linear filters of Gr21a neurons. Consistent with a repulsive response, the likelihood of optogenetic activation increases before a run-to-turn transition and decreases before a turn-to-run transition. Data represent mean (black line) ± one SEM (gray shaded region) for 4680 transitions exhibited by 90 larvae. The mean beginning of deceleration averaged over all animals is flagged by the red dot (± STD). (B) LN prediction and experimental measurements of different repellant responses to step changes in optogenetic illumination. Faster adaptation to baseline is observed in the case of the Gr21a-expressing neurons than Or45a. Step responses were measured with 115 Gr21>CsChrimson larvae and 120 Or45a>CsChrimson larvae; each larva was subjected to 30 steps of optogenetic activation. (z-test substantiate significant difference in the dynamics of the cyan and black curves see Figure 4—figure supplement 1A). (C) Event-triggered stimulus histories exhibited by Gr2a>CsChrimson larvae. Consistent with an attractive response, the likelihood of optogenetic activation decays before a run-to-turn transition and raises before a turn-to-run transition. Data represent mean (black line) ± one SEM (gray shaded region) for 3672 transitions exhibited by 128 larvae. The mean beginning of deceleration averaged over all animals is flagged by the red dot (± STD). (D) Linear prediction and experimental measurements of different attractant responses to step changes in optogenetic illumination. Faster responses and adaptation to baseline are observed in the case of the Gr2a than Or42a. Step responses were measured with 195 Gr2a>CsChrimson larvae and 117 Or42a>CsChrimson larvae; each larva was subjected to 30 steps of optogenetic activation. (z-test substantiate significant difference in the dynamics of the cyan and black curves see Figure 4—figure supplement 1B).
Figure 4—figure supplement 1
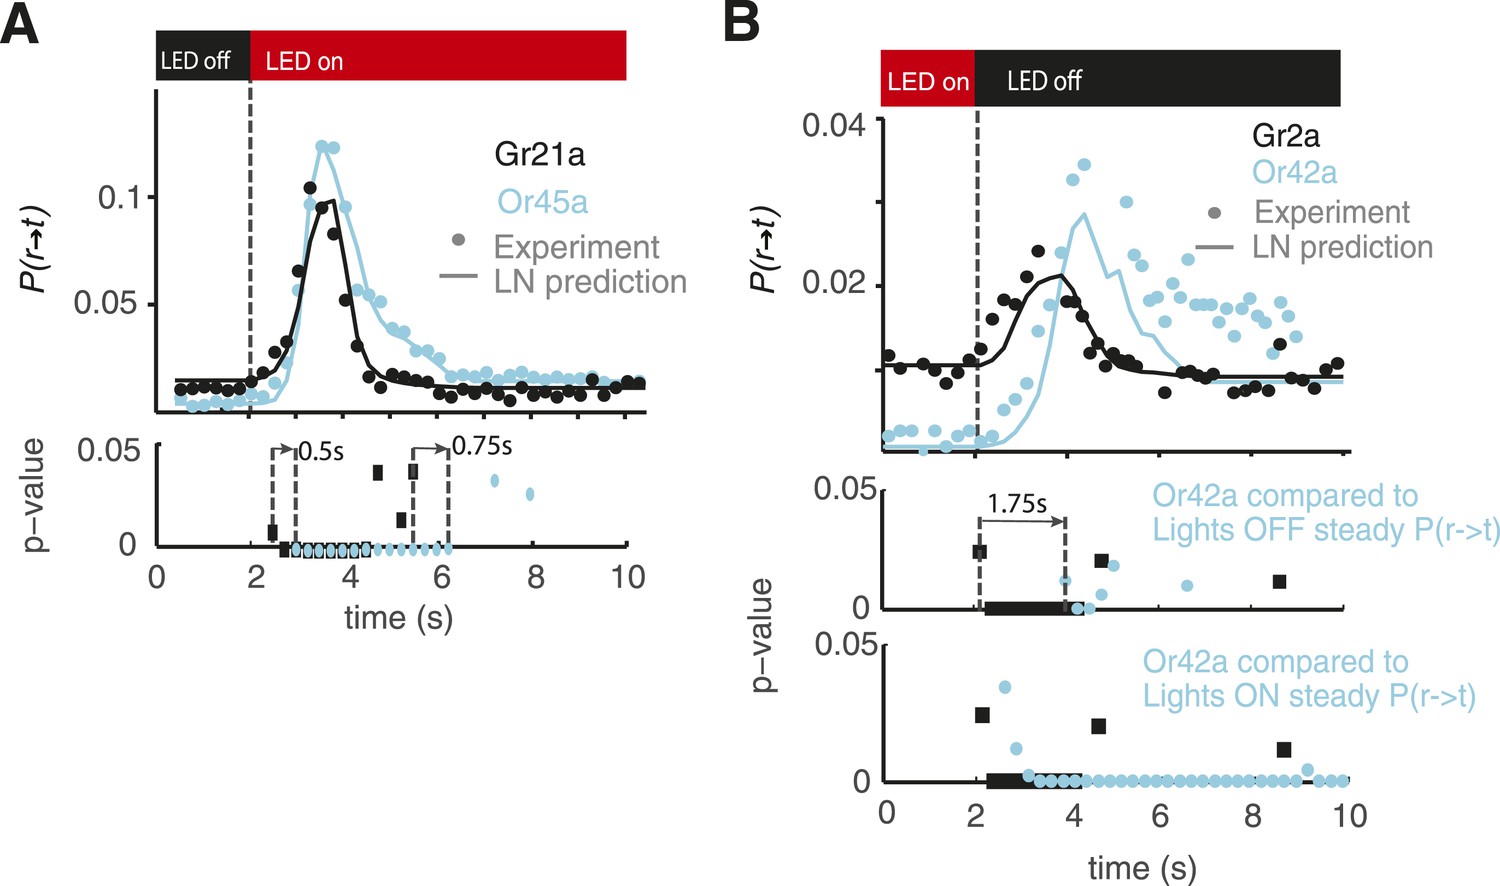
Statistical analysis of behavioral dynamics.
Each dot shown in Figure 4B, D is a probability but is also the mean of the distribution of larvae undergoing a run-to-turn transition if we consider each larvae undergoing this transition as 1 and larvae not undergoing this transition as 0. Then, we have a distribution for each point in the cyan and black curves shown; each of those distributions can be compared with the distribution before the light stimulus is presented. Since we have sufficient data such that np >= 5 and n(1 − p) >= 5 in all cases (n is the number of samples, and p is the probability of undergoing a transition), we conducted a z-test to compare the distribution at each time point after opotgenetic stimulation with the baseline distribution. We show the p-values for each point in the case of Gr21a and Or45a in (A). All the p-values lower than 0.05 are shown; we note that Gr21a larvae become significantly different than their baseline behavior 0.5 s before than Or45a larvae, in addition, Or45a larvae stay at values different from their baseline behavior for at least 0.75 s longer than Gr21a larvae. In the case of Or42a and Gr2a, we conducted the same analysis (B middle) and obtained that Gr2a behavior becomes significantly different than baseline at least 1.75 s before Or42a. However, in the case of Or42a, adaptation is only partial: Or42a larvae reach steady-state values of P(r → t) at different levels when red lights are ON or when red lights are OFF because of that we also computed the z-test between Or42a after lights are turn OFF as compared to the distribution at the steady-state condition with lights ON. With this consideration, we obtained a very small difference between Gr2a and Or42a rising time (B bottom). As observed, the distribution of Or42a larvae stayed at values significantly higher than the value of P(r → t) with lights ON.
Figure 5 with 2 supplements
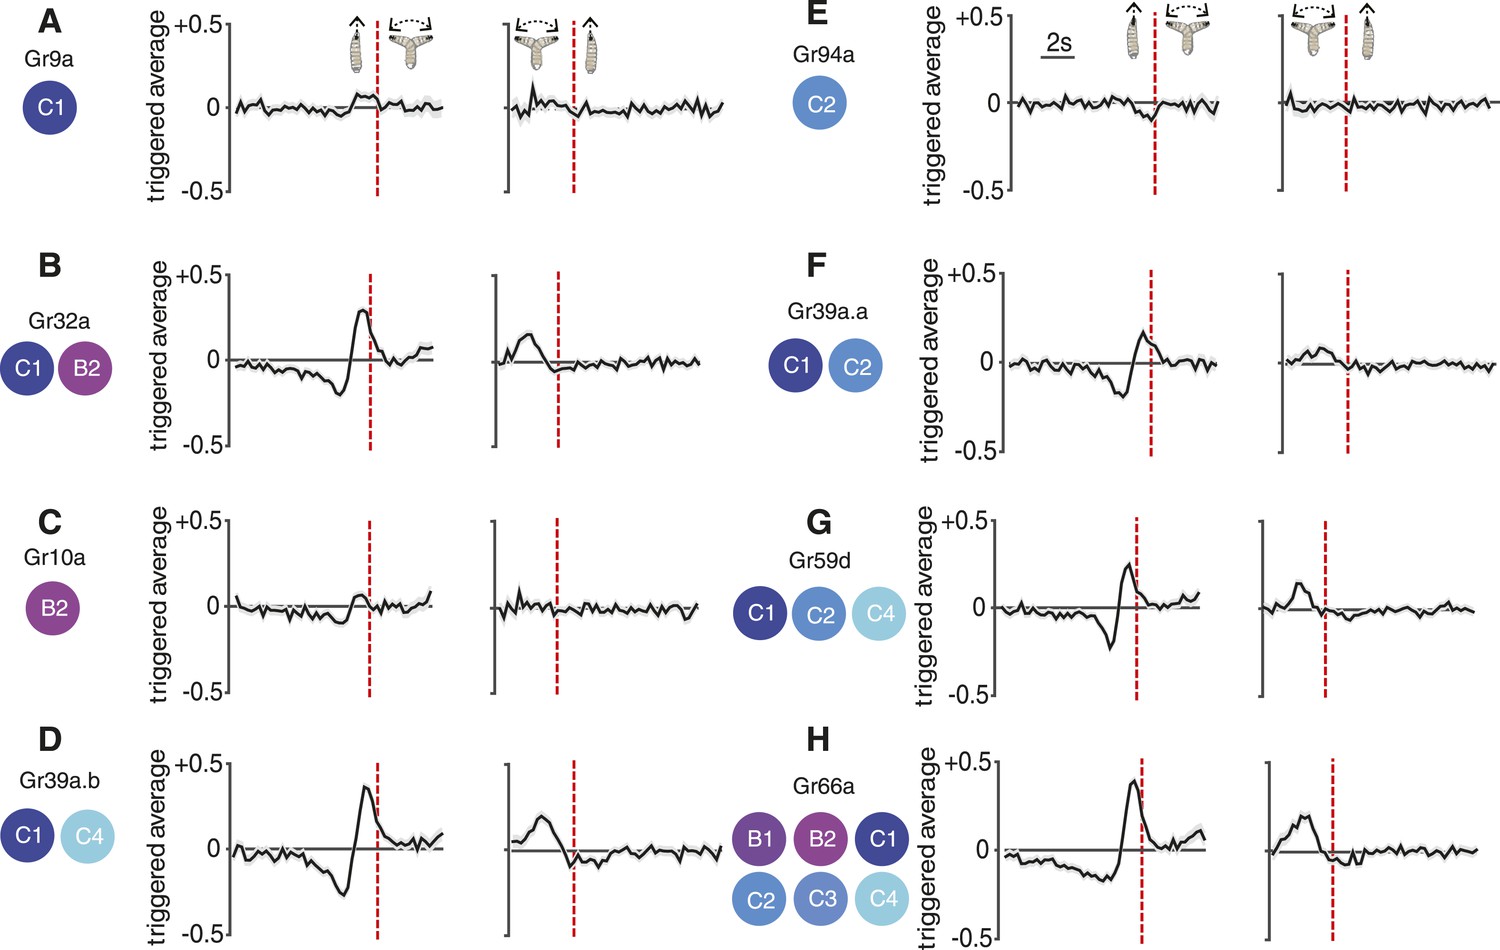
Reverse-correlation analysis of bitter-sensing gustatory receptor neurons (GRNs).
Event-triggered stimulus histories exhibited by GrX>CsChrimson larvae using a set of GAL4 drivers that express in different subsets of GRNs. The cellular identities describing each expression pattern are taken from Kwon et al. (2011). Each measurement represents 3270 to 4016 transitions taken from 87 to 134 larvae. Curves represent mean (black line) ± one SEM (gray shaded region).
Figure 5—figure supplement 1
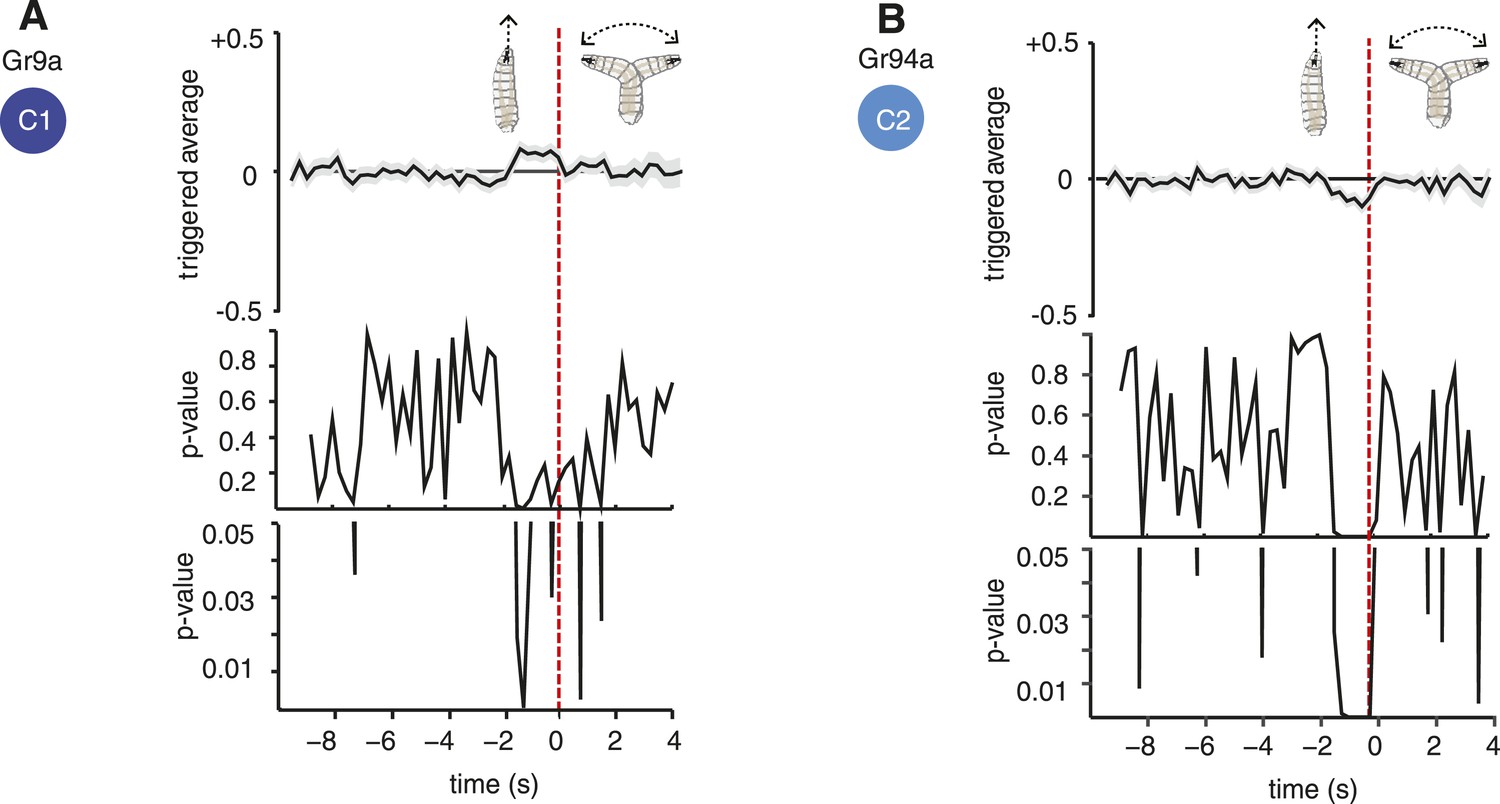
Statistical analysis of Gr9a and Gr94a triggered average.
The triggered averages of Gr9a and Gr94a showed very weak response. Because of this, we tested whether their observed behavior is significantly different than the control. Each point of the triggered averages is a distribution, thus, we compared the distributions of each point with the corresponding one in the control with a t-test. In the case of Gr9a, it was only significantly different than the control for 0.75 s of the 2 s prior to the transition (panel A, bottom; the bottommost plot is a zoomed version of the middle plot). We obtained that Gr94a is significantly different than the control with p < 0.05 1.75 s before the transition (panel B, bottom).
Figure 5—figure supplement 2

Normalized speed of Gr lines.
The normalized speed of each Gr line is shown. Normalized speed is computed using standard score. In all cases, the slowdown initiation happens 1 s prior to the transition (t-test p < 0.01). Red dots flag the slowdown initiation mean location (average of when the individual tracks start slowing down changing the derivative of speed to negative), and the red bar is 2 standard deviations. The grey shaded regions near the normalized speed value represent the SEM, in some cases, it is difficult to see because of the large number of samples used: each measurement represents 3270 to 4016 transitions taken from 87 to 134 larvae.
Download links
A two-part list of links to download the article, or parts of the article, in various formats.
Downloads (link to download the article as PDF)
Open citations (links to open the citations from this article in various online reference manager services)
Cite this article (links to download the citations from this article in formats compatible with various reference manager tools)
Reverse-correlation analysis of navigation dynamics in Drosophila larva using optogenetics
eLife 4:e06225.
https://doi.org/10.7554/eLife.06225


