A gene-expression-based neural code for food abundance that modulates lifespan
- King's College London, United Kingdom
- Georgia Institute of Technology, United States
Figures
Figure 1 with 2 supplements

Two neuronal genes, daf-7 and tph-1, shape a complex, multiphasic relationship between lifespan and food availability.
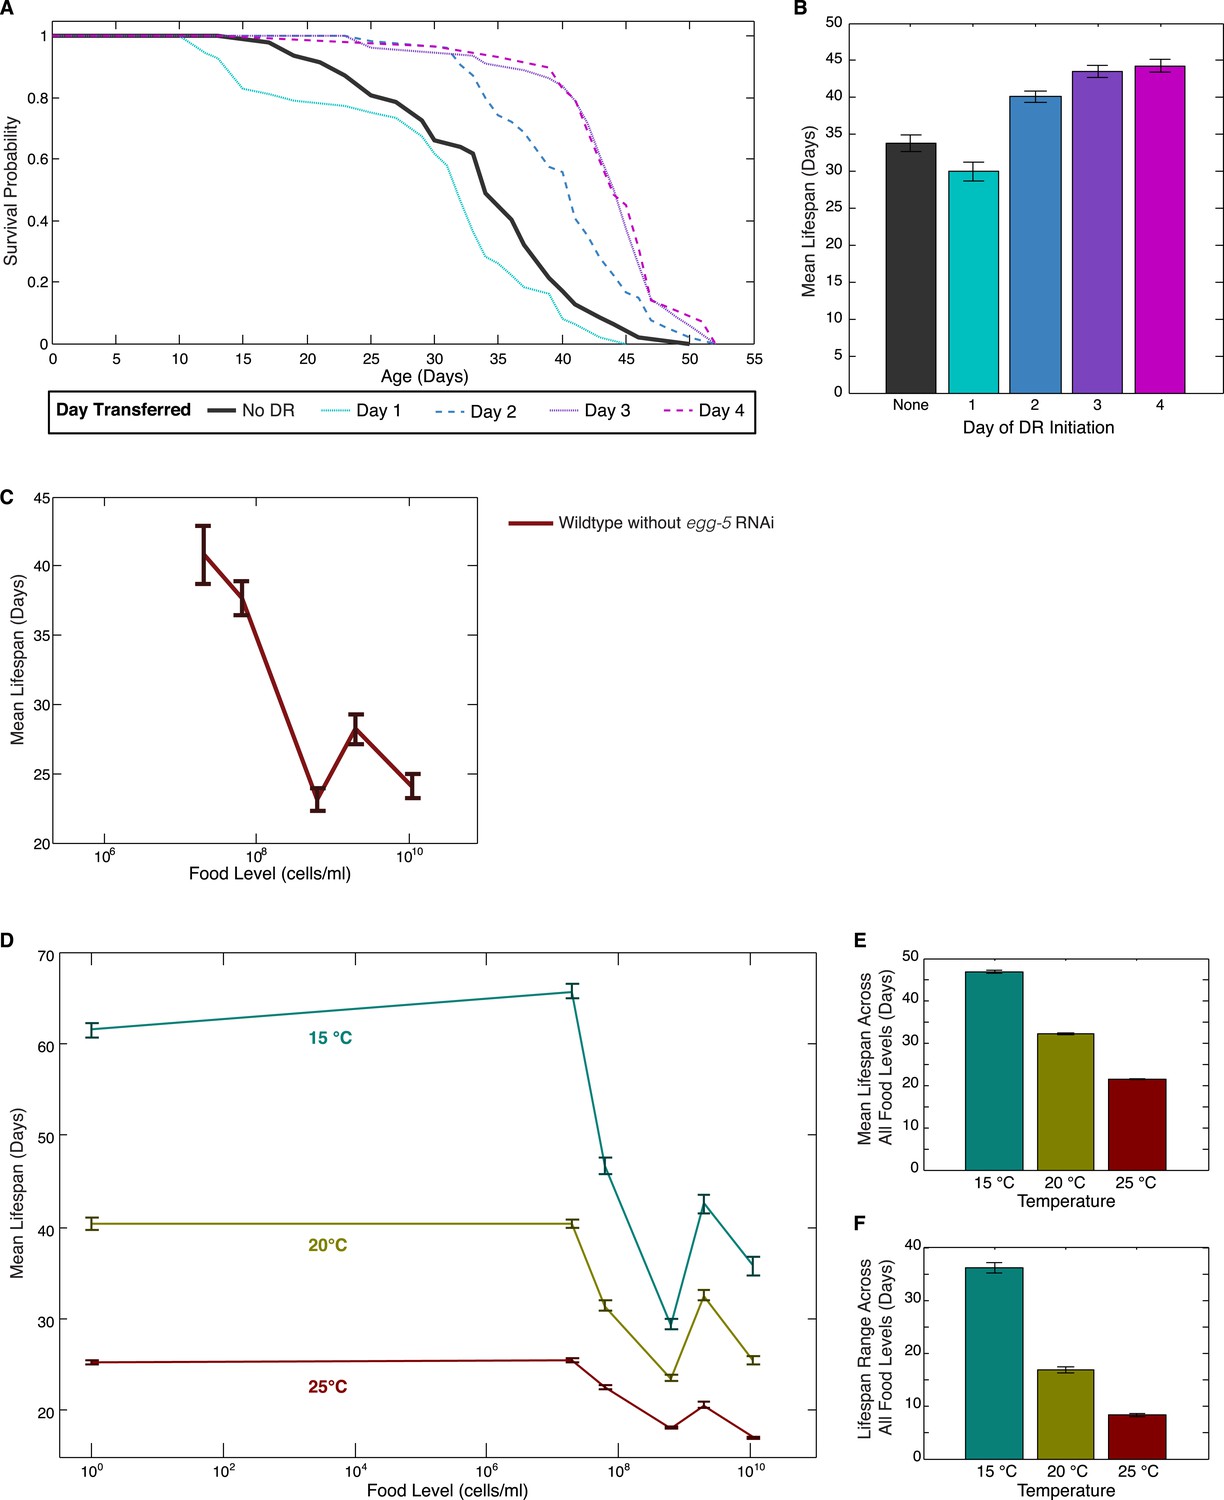
(A) Protocol for maintaining animals at different food levels for lifespan and imaging experiments. Effects of initiating different dietary restriction (DR) on different days are shown in Figure 1—figure supplement 1A,B. (B) Mean lifespan of wildtype worms subjected to 19 food levels ranging from 0–3.5 × 10¹⁰ bacterial cells/ml at 20°C. Points denoting key features in the food response and used as food conditions in subsequent experiments are highlighted. Figure 1—figure supplement 1D shows that these lifespan responses have similar shapes across different temperatures. The lifespan data are shown in Figure 1—source data 1. (C) Mean lifespans of wildtype and mutant animals across the six food levels indicated in (B) show that loss of tph-1 and daf-7 preserves the pattern but attenuates the range of the lifespan response. Genotypes are indicated by the legends below (E) and (F). The lifespan data are shown in Figure 1—source data 2, and statistical comparisons between the different genotypes and food levels are shown in Figure 1—source data 3. (D) tph-1 and daf-7 modulation of lifespan is bidirectional and their epistatic relationship is food-specific. The epistatic interaction between the two genes in the tph-1(−); daf-7(−) double mutant differs depending on food level. The double mutant resembled the tph-1(−) single mutant in the absence of a bacterial food source and resembled the daf-7(−) single mutant at a high bacterial food concentration. (E) Range of food-induced lifespan modulation for each genotype. Range is defined by the difference between the highest and lowest mean lifespan response across the six food levels. (F) Average of the mean lifespan responses across all food levels for each genotype reveals a consistent, food-independent baseline lifespan response. The schedule for transferring animals to different conditions in these lifespans are shown in Figure 1—figure supplement 2.
-
Figure 1—source data 1
Summary of wild type lifespan outputs under the full range of food levels tested.
- https://doi.org/10.7554/eLife.06259.004
-
Figure 1—source data 2
Summary of wild type and mutant lifespan outputs under six selected food levels.
- https://doi.org/10.7554/eLife.06259.005
-
Figure 1—source data 3
Statistical significance of lifespan modulation across food levels and genetic backgrounds.
- https://doi.org/10.7554/eLife.06259.006
Figure 1—figure supplement 1
Effects of DR initiation time, temperature and egg-5(RNAi) on the lifespan response.
(A) Survival curves for worms transferred from the baseline, abundant level of food (2 × 10⁹ cells/ml) to a more limited food condition (2 × 10⁵ cells/ml) at different days of adulthood. Different days of DR initiation result in substantial differences in survival trajectories. (B) The mean lifespan response of these worms shows lifespan extension for animals transferred on day 2 or later but a negative effect on lifespan for animals subjected to DR from day 1 of adulthood, possibly due to developmental effects. (C) Wildtype worms show a similar lifespan response to exposed different food levels in the absence of egg-5(RNAi). (D) The pattern of lifespan modulation by food abundance is maintained across the range of standard C. elegans culture temperatures. (E) Increased temperature consistently lowers mean lifespans across all food levels. (F) Increased temperature also consistently lowers the range of lifespan modulation achieved by alterations in food.
Figure 1—figure supplement 2

Schedule of transfers for lifespans at different temperatures.
https://doi.org/10.7554/eLife.06259.008
Figure 2
Neuron-specific rescue of lifespan phenotypes.
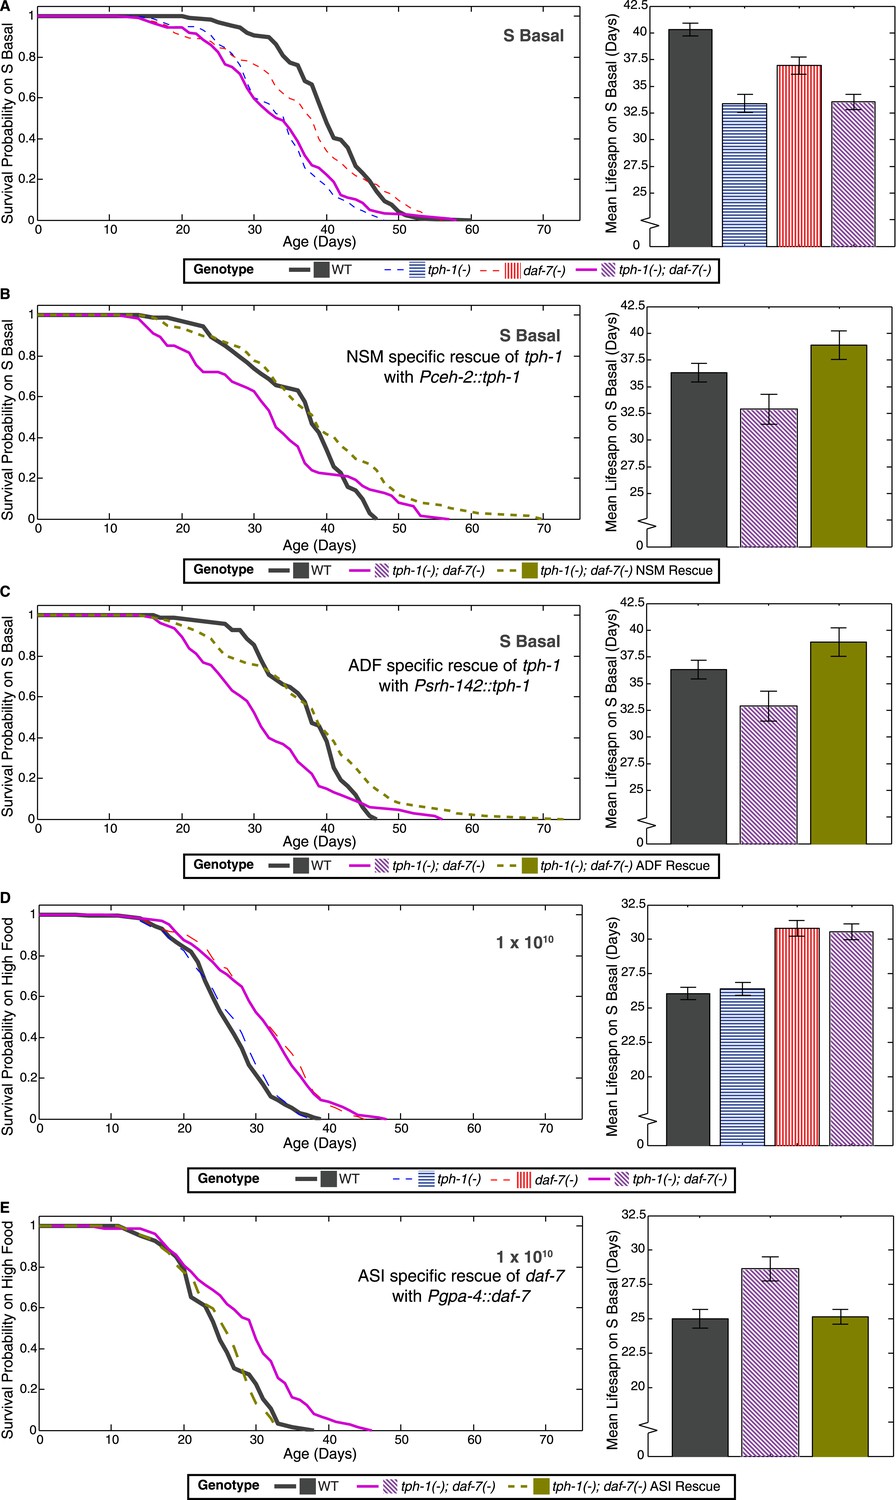
(A) Lifespan outcomes of wildtype, tph-1(−) and daf-7(−) single mutants and the tph-1(−); daf-7(−) double mutant indicates that the double mutant closely resembles the tph-1(−) mutant in the absence of a bacterial food source. (B) In the absence of bacterial food, restoration of tph-1 activity in the NSM neurons via the expression of a tph-1 cDNA driven by the ceh-2 promoter rescues the lifespan reduction observed in the tph-1(−); daf-7(−) double mutants. (C) Restoration of tph-1 expression in the ADF neurons via the srh-142 promoter also shows reversal of the lifespan reduction. (D) Lifespan outcomes of wildtype, tph-1(−) and daf-7(−) single mutants and the tph-1(−); daf-7(−) double mutant indicates that the double mutant closely resembles the daf-7(−) mutant at a high concentration of the bacterial food source. (E) At high food level, restoration of daf-7 expression in the ASI neurons via the expression of daf-7 under the gpa-4 promoter reverses the lifespan extension observed in the tph-1(−); daf-7(−) double mutants. All comparisons are drawn against non-transgenic siblings of animals bearing the extrachromosomal array of interest.
Figure 3 with 1 supplement
High-throughput quantitative imaging of tph-1 and daf-7 fluorescent reporters reveals neuron-specific, graded expression responses to food level.
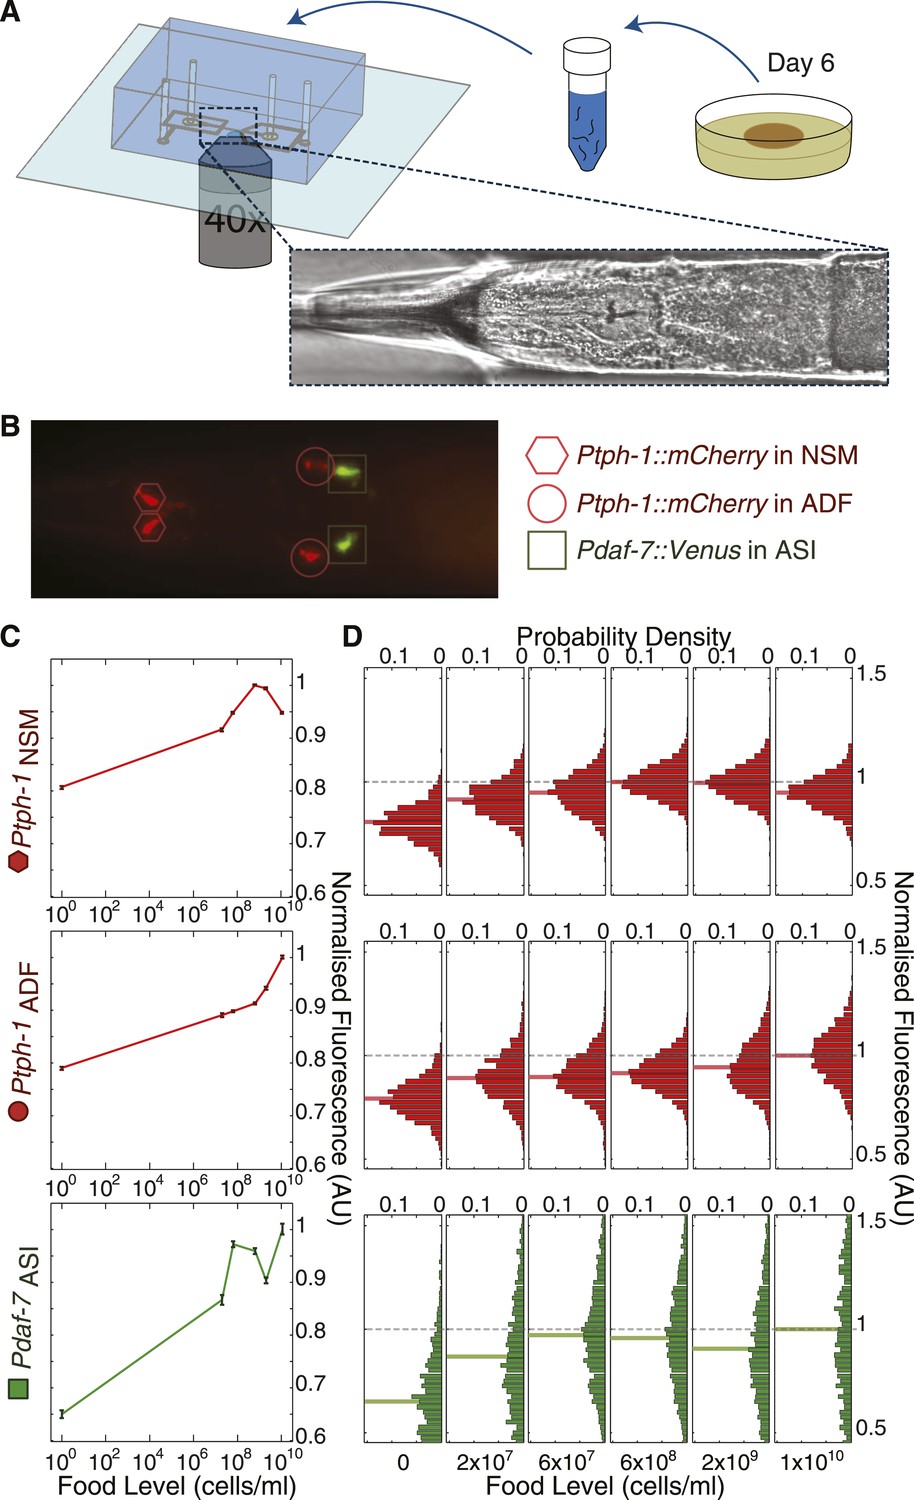
(A) Microfluidic system enabling high-throughput, neuron-specific quantitative imaging of gene expression in a large number of individual animals. Animals are transferred from culture plates to a liquid suspension at day 6 of adulthood and then loaded into the device for imaging. Figure 3—figure supplement 1 shows an overview of this imaging system. (B) Representative merged fluorescent image of transgenic worm with red and green fluorescent reporters for tph-1 and daf-7 transcriptional activity. Shapes indicate locations and identities of specific neurons. (C) Mean expression profiles of tph-1 in NSM (Ptph-1NSM) and ADF (Ptph-1ADF), and daf-7 in ASI (Pdaf-7ASI) across six different food levels are neuron-specific and largely non-monotonic. Measurements are normalized to the highest mean expression response observed in each respective neuron; error bars are SEM. (D) Distribution of the expression responses of tph-1 in NSM and ADF and daf-7 in ASI at different food levels. Means are indicated by the solid lighter-shade lines behind the distributions. Dashed line denotes the highest mean expression for each neuron, which was used for normalization.
Figure 3—figure supplement 1
Overview of the high-throughput quantitative imaging system for single-cell fluorescent intensity measurements in C. elegans.
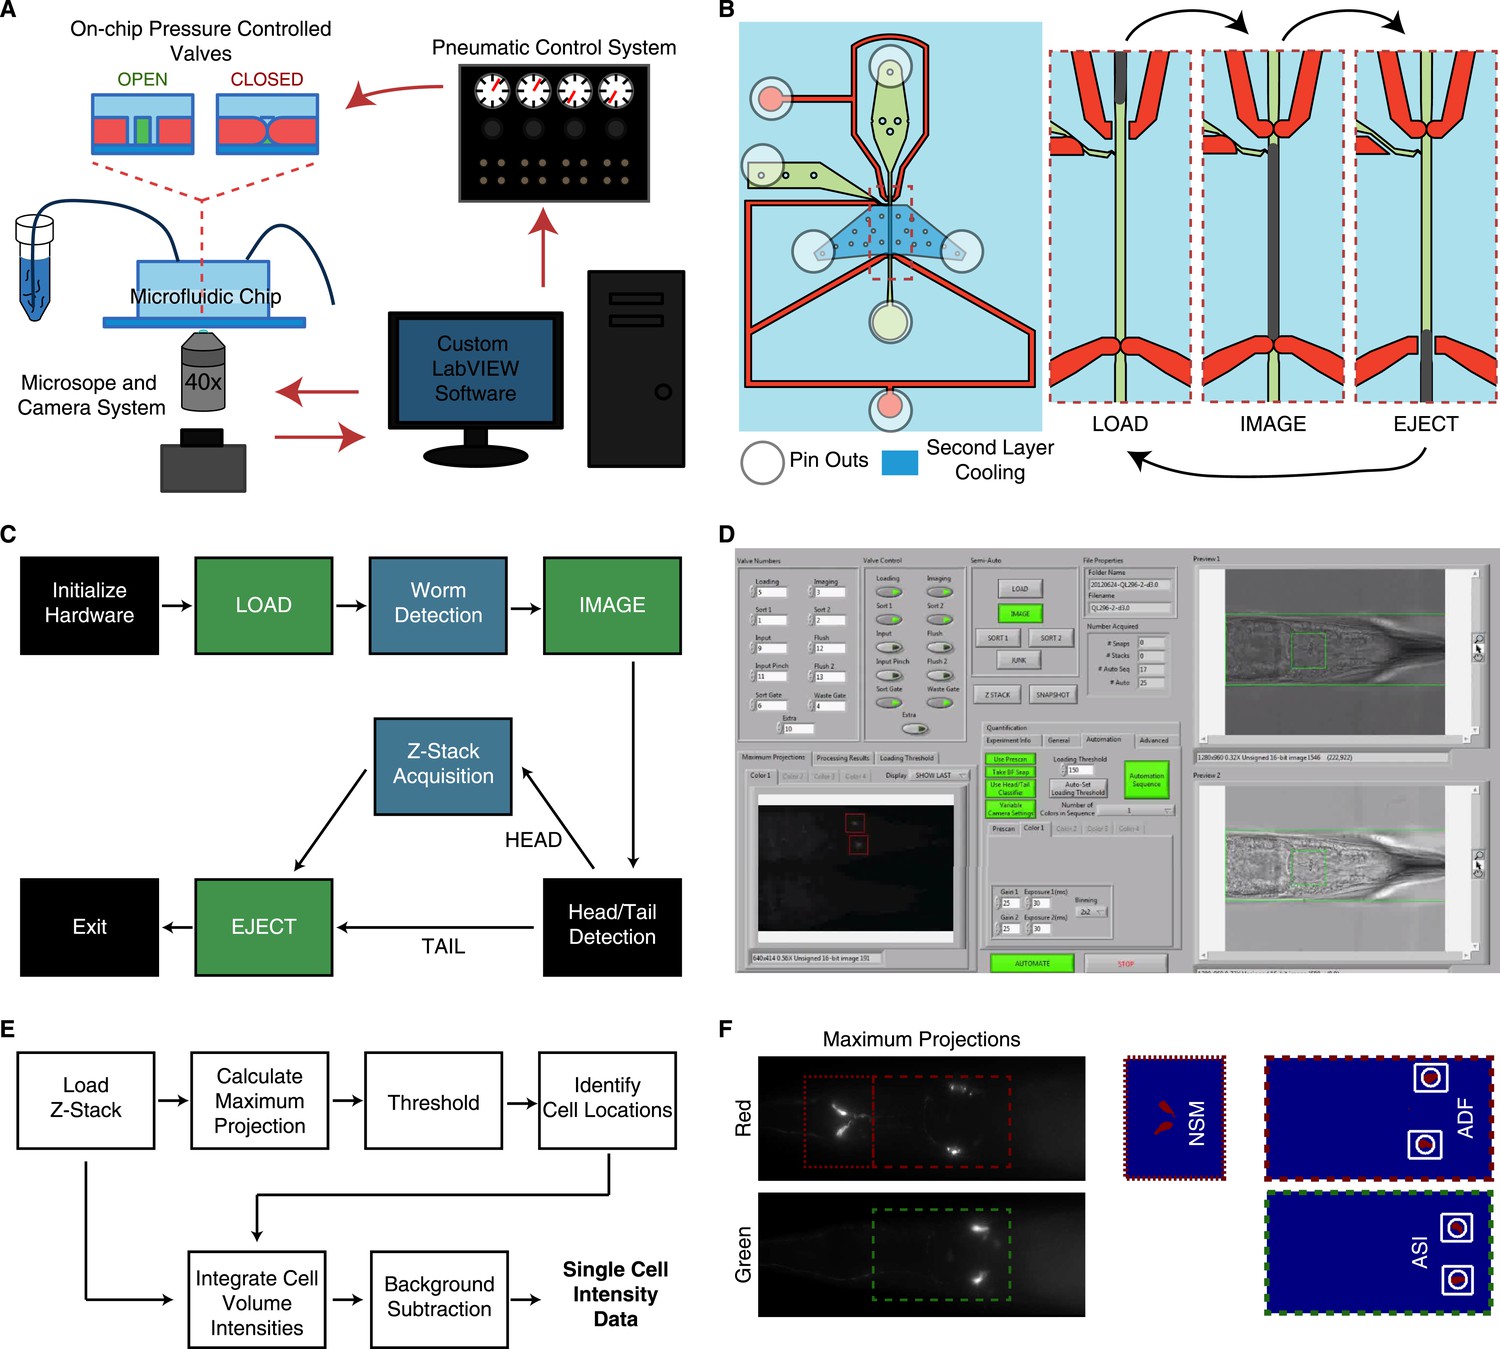
(A) The system incorporates a microfluidic chip with pressure controlled valves for worm handling, a custom-built pneumatic control system to control on-chip valves, a standard wide-field epifluorescent microscope and camera system and custom LabVIEW software for integration and control. (B) The microfluidic chip consists of worm and fluid inlets and outlets, two control channels for valve activation and a second layer cooling channel for immobilization. Sequential activation of the valves, worm and fluid inlets permit sequential loading of individual worms for imaging. (C) The LabVIEW software interacts with the pneumatic valve control system (green blocks) and camera (blue blocks) to automate the imaging process by sequential loading and imaging. (D) Image of the LabVIEW user interface. (E) Block diagram of steps used to calculate single-cell fluorescent intensities from raw z-stacks. Cell identifications and locations are calculated from 2-D maximum projections. Locations are then mapped onto the z-stacks for 3-D volume integration. (F) Maximum projections and binary images from a thresholding procedure are used to ascertain cellular locations.
Figure 4
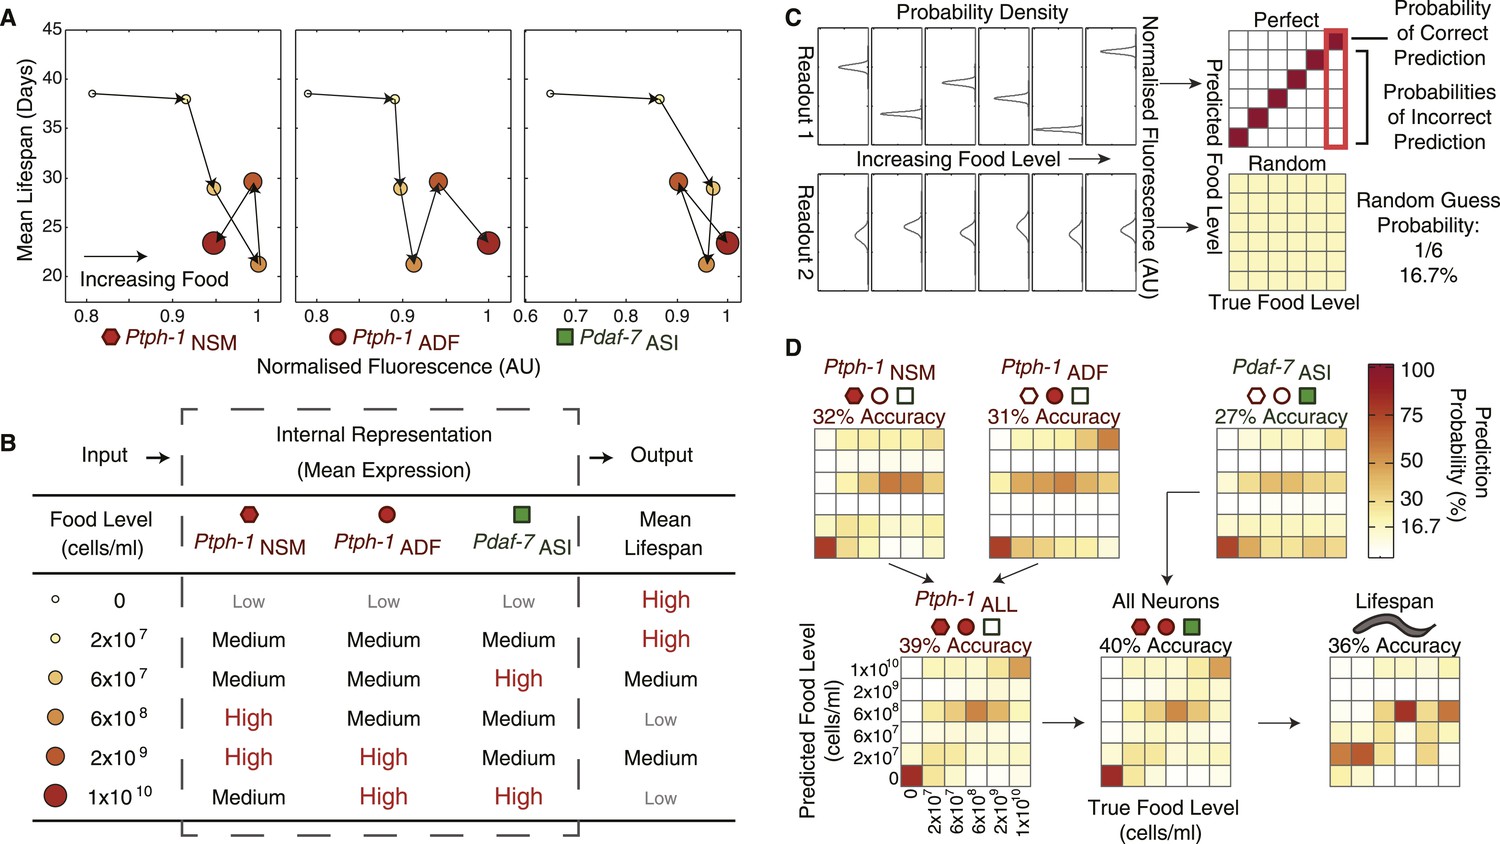
The combination of all neuronal gene-expression readouts generates a unique internal representation of food levels.
(A) Relationship between individual gene-expression profiles and the lifespan responses across the six food levels indicates that the individual readouts are insufficient to uniquely specify lifespan responses. (B) The combination of tph-1 in NSM (Ptph-1NSM) and ADF (Ptph-1ADF) and daf-7 in ASI (Pdaf-7ASI) create a non-monotonic multivariate encoding scheme capable of both uniquely representing food inputs and potentially specifying lifespan outputs. (C) The ability of expression and lifespan readouts to respond to and represent (encode) food conditions can be estimated by using the readouts of interest to infer the true food conditions. The results can be visually represented by matrices where the squares in each column indicate the frequency with which particular inferences are made for a given true food level. Distinct, non-overlapping readouts result in high discriminatory power, represented by a highly diagonalized matrix (top). Indistinct, overlapping response profiles result in low (random) discriminatory power, represented by a uniform matrix (bottom). (D) Matrices indicating the representational capability of tph-1 and daf-7 readouts individually or in combination exhibit similar total encoding fidelity to that of lifespan outputs in wildtype animals.
Figure 5 with 1 supplement
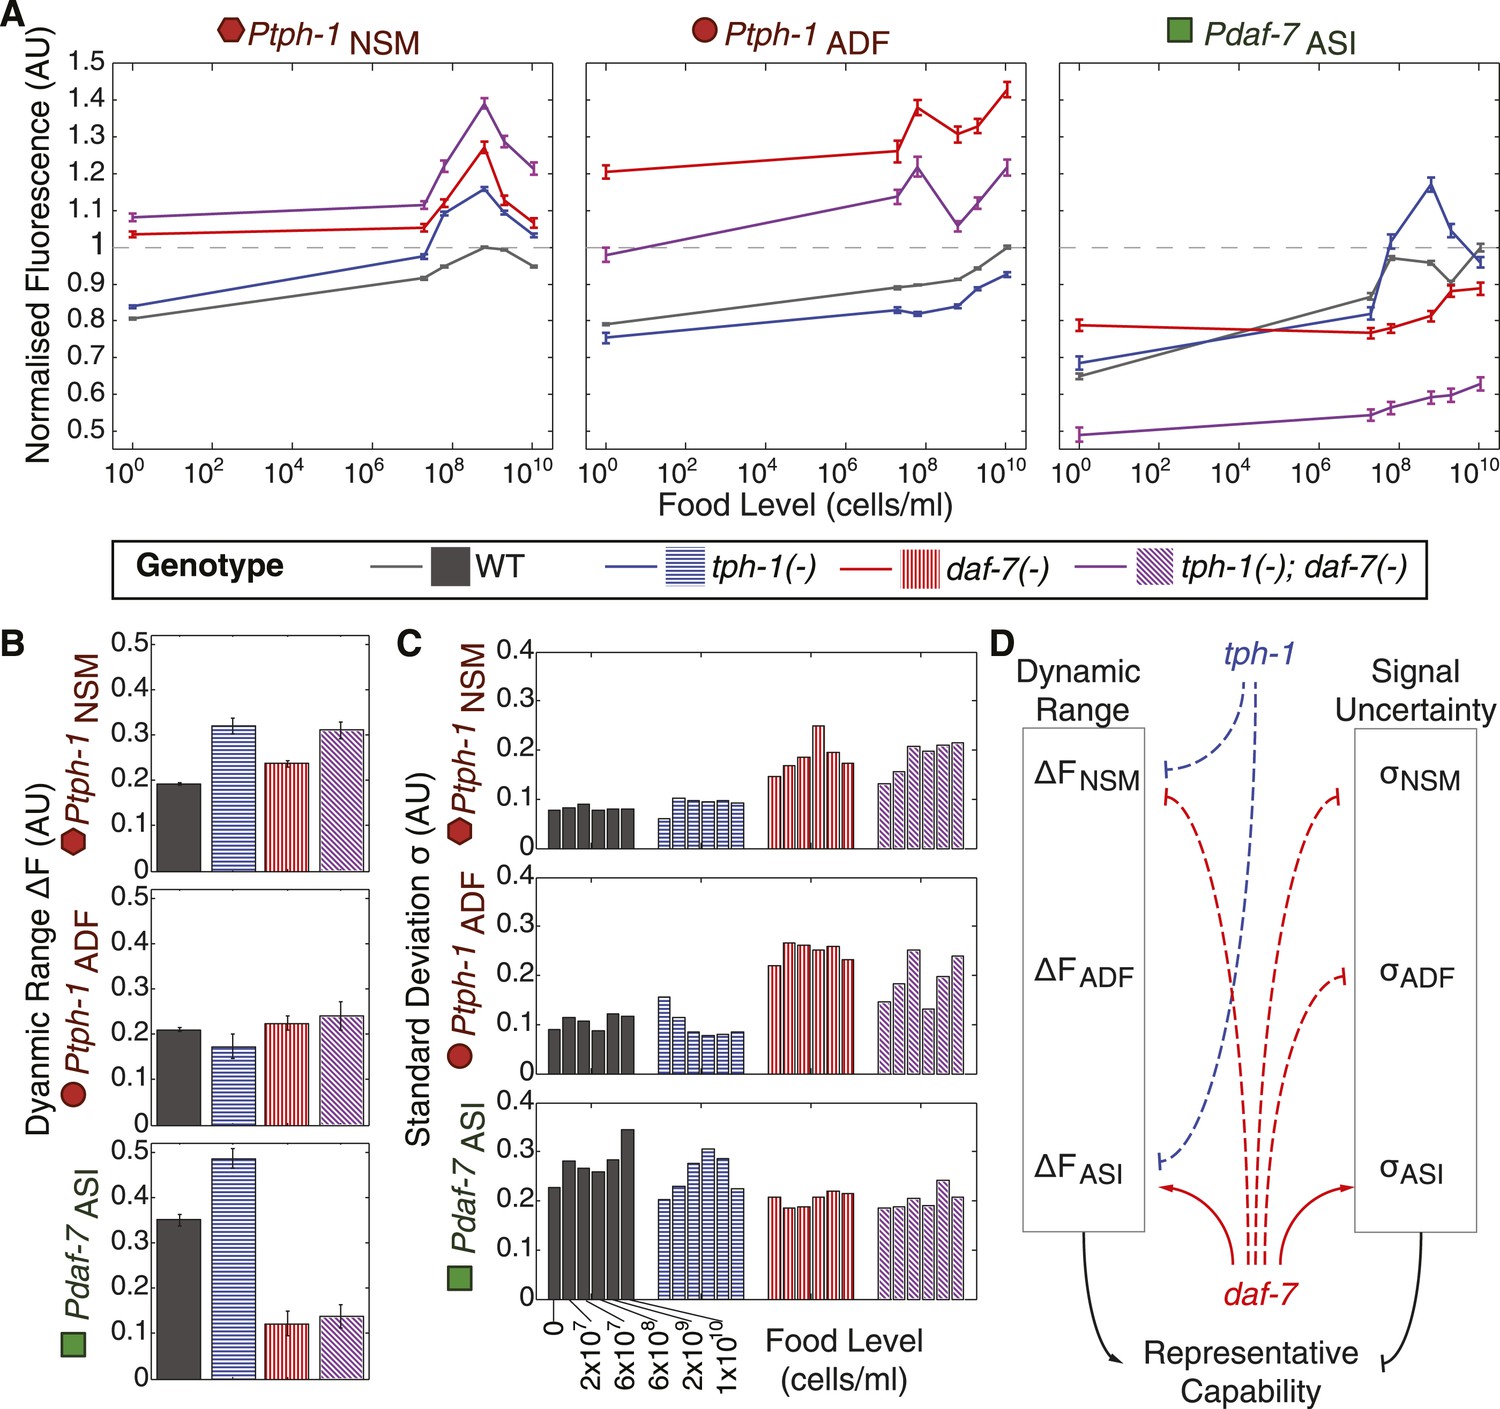
Crosstalk and self-regulation of tph-1 and daf-7 are important in shaping the pattern, range and variability of food-induced gene-expression responses.
(A) Food-responsive expression profiles of tph-1 in NSM (Ptph-1NSM) and ADF (Ptph-1ADF), and daf-7 in in ASI (Pdaf-7ASI) for different genetic backgrounds, as indicated in the legend. As in Figure 3, all values are normalized to the highest wildtype mean expression response observed in the respective neuron (dotted line). (B) Effects of tph-1 and daf-7 signalling on the dynamic range of food-induced expression modulation for tph-1 in NSM and ADF and daf-7 in ASI. The dynamic range (ΔF) is defined by the difference between the highest and lowest mean expression responses across the six food levels for each genotype. (C) Effects of tph-1 and daf-7 signalling on the inter-individual variability of expression responses as measured by the standard deviation of gene-expression distributions in each neuron. (D) Schematic of the total regulatory effects of tph-1 and daf-7 on both the dynamic range (ΔF) and variability and uncertainty (σ) of expression readouts to induce opposing effects on representational capability. Figure 5—figure supplement 1 shows the distributions of gene expression for Ptph-1NSM, Ptph-1ADF, and Pdaf-7ASI across all genotypes tested.
Figure 5—figure supplement 1
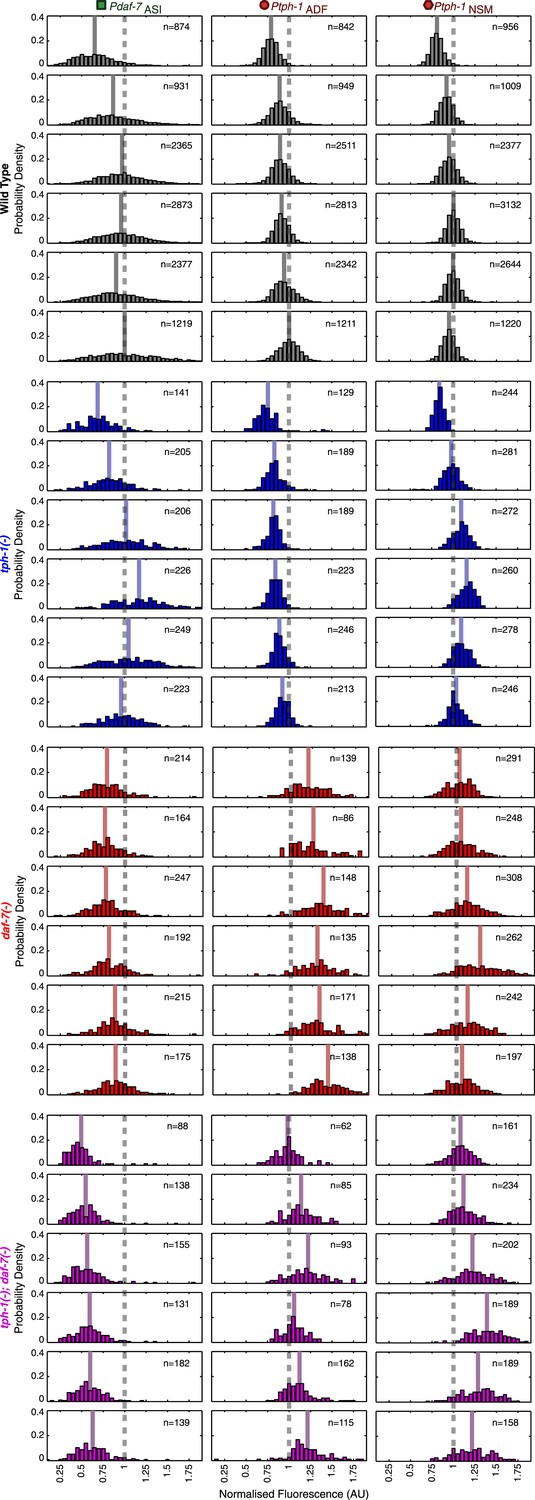
Neuron-specific expression distributions in wild type and mutants.
Distributions of NSM, ADF and ASI expression intensities in wild type, tph-1(−) mutants, daf-7(−) mutants and tph-1(−); daf-7(−) double mutants. Values represent the sum of the expression intensities in both cells of the neuron-pair.
Figure 6 with 1 supplement
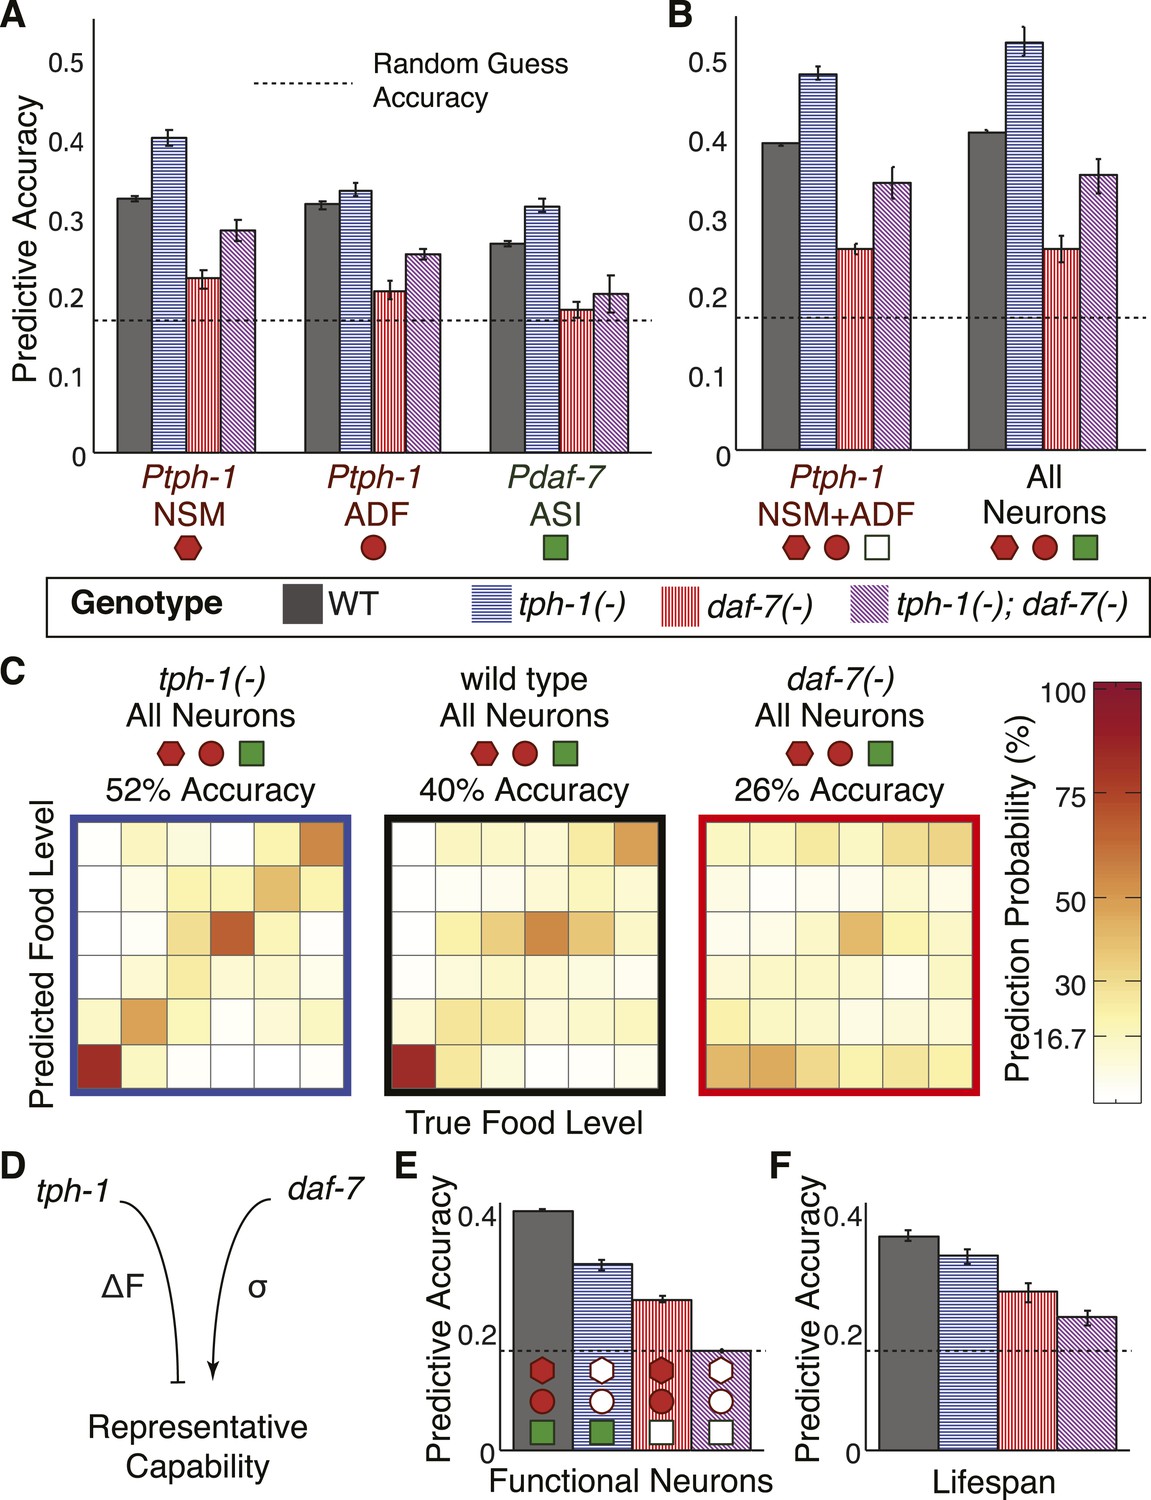
Cross- and self-regulation of tph-1 and daf-7 control the accuracy of internal representation of food levels.
(A) Encoding accuracy of individual neuron-specific expression readouts in wildtype and mutant populations, as indicated by the legend. Dotted line indicates the lower bound for encoding accuracy due to chance. (B) Functional combinations of the neuron-specific expression readouts increase encoding accuracy in both wildtype and mutant populations. (C) Matrices indicating the full encoding accuracy of the combination of all gene-expression readouts in wildtype and mutant animals reveal a surprising increase in accuracy with the loss of tph-1. (D) Schematic indicating the distinct mechanisms by which tph-1 and daf-7 control the representational capabilities of the system. tph-1 and daf-7 exert their effects largely via modulating dynamic range or variability in gene expression, respectively. (E) Mutant animals show diminished encoding accuracy relative to wildtype when only functional expression readouts (filled symbols) are considered. For example, only daf-7 expression in ASI (Pdaf-7ASI) is a functional readout in the tph-1(−) mutant. (F) Encoding accuracy of lifespan responses in the mutants exhibit decreases that are consistent with the loss of representational capability in (E). Figure 6—figure supplement 1 shows the decoding analysis for all neuron combinations across all genotypes using both maximum likelihood-based and probability-based decoders.
Figure 6—figure supplement 1
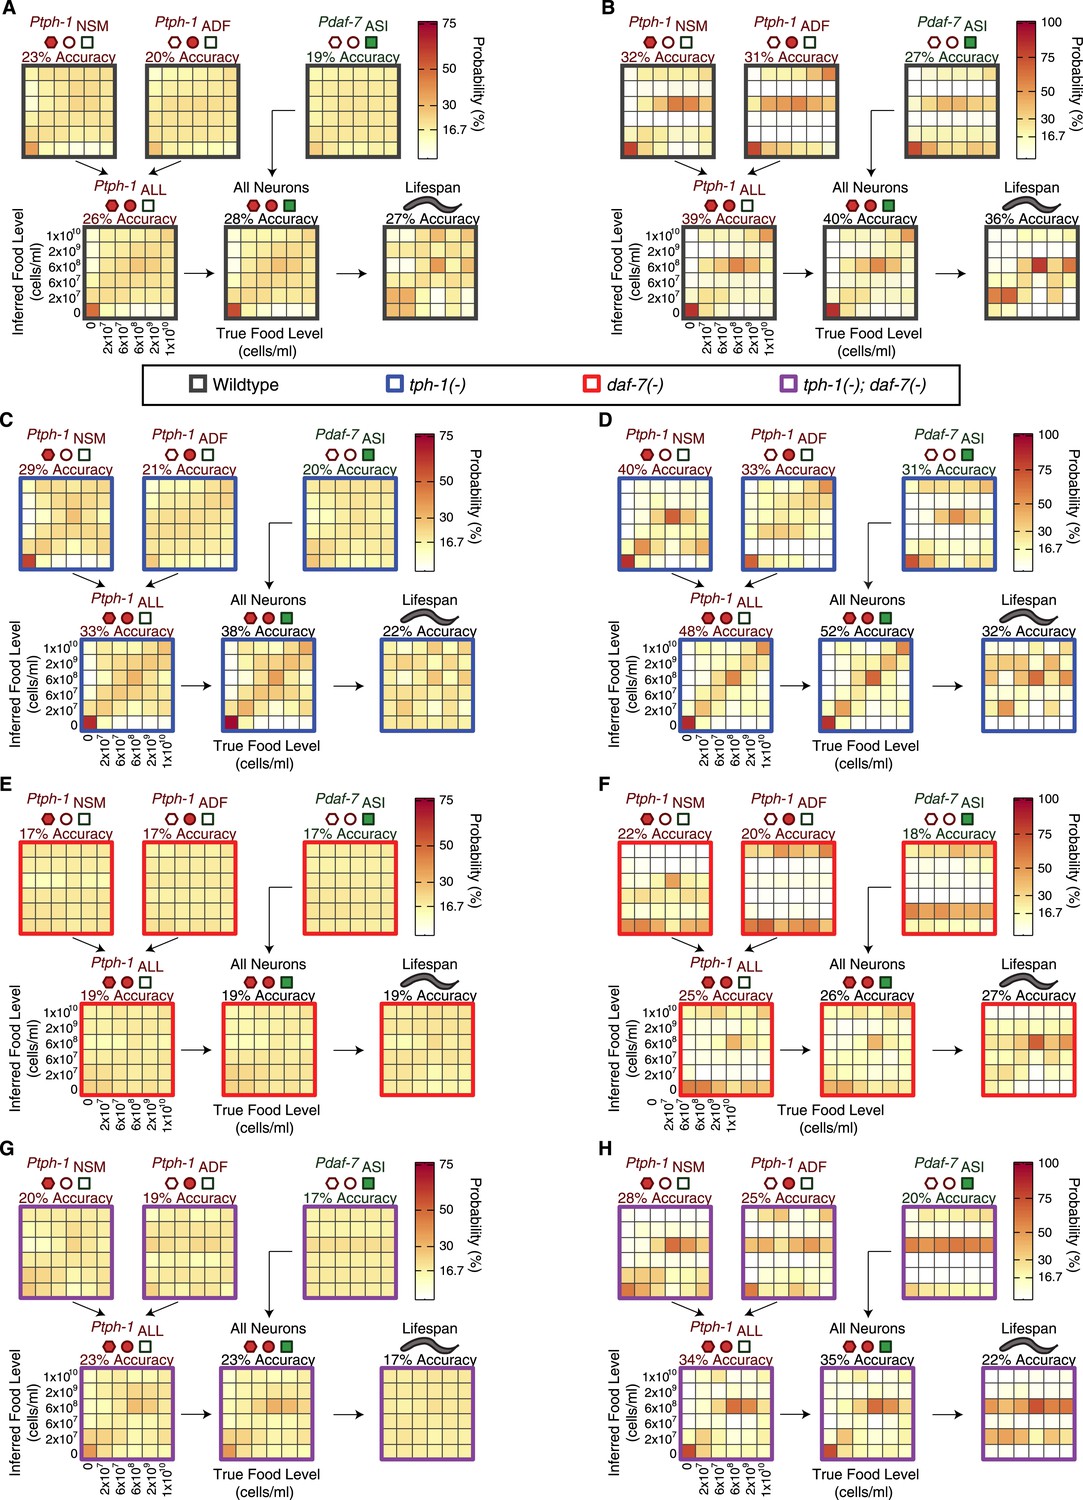
Food encoding accuracy of all neuron combinations and lifespan outputs for wildtype and mutant animals.
(A, C, E, G) Matrices of probability-based food encoding fidelity for single and combined neuronal outputs and lifespan outputs in the wildtype and mutant animals. These results are based on distributing the calculated raw probabilities of animals being from each food condition before assigning animals to particular food levels based on maximum likelihood. (B, D, F, H) Matrices of maximum likelihood-based food encoding fidelity for single and combined neuronal outputs and lifespan outputs in the wild type and mutant animals. Genotype is denoted by the colored borders around the matrices and indicated in the legend below (A and B).
Download links
A two-part list of links to download the article, or parts of the article, in various formats.
Downloads (link to download the article as PDF)
Open citations (links to open the citations from this article in various online reference manager services)
Cite this article (links to download the citations from this article in formats compatible with various reference manager tools)
A gene-expression-based neural code for food abundance that modulates lifespan
eLife 4:e06259.
https://doi.org/10.7554/eLife.06259


