Dendritic sodium spikes are required for long-term potentiation at distal synapses on hippocampal pyramidal neurons
- Janelia Research Campus, Howard Hughes Medical Institute, United States
- Northwestern University, United States
Figures
Figure 1 with 1 supplement
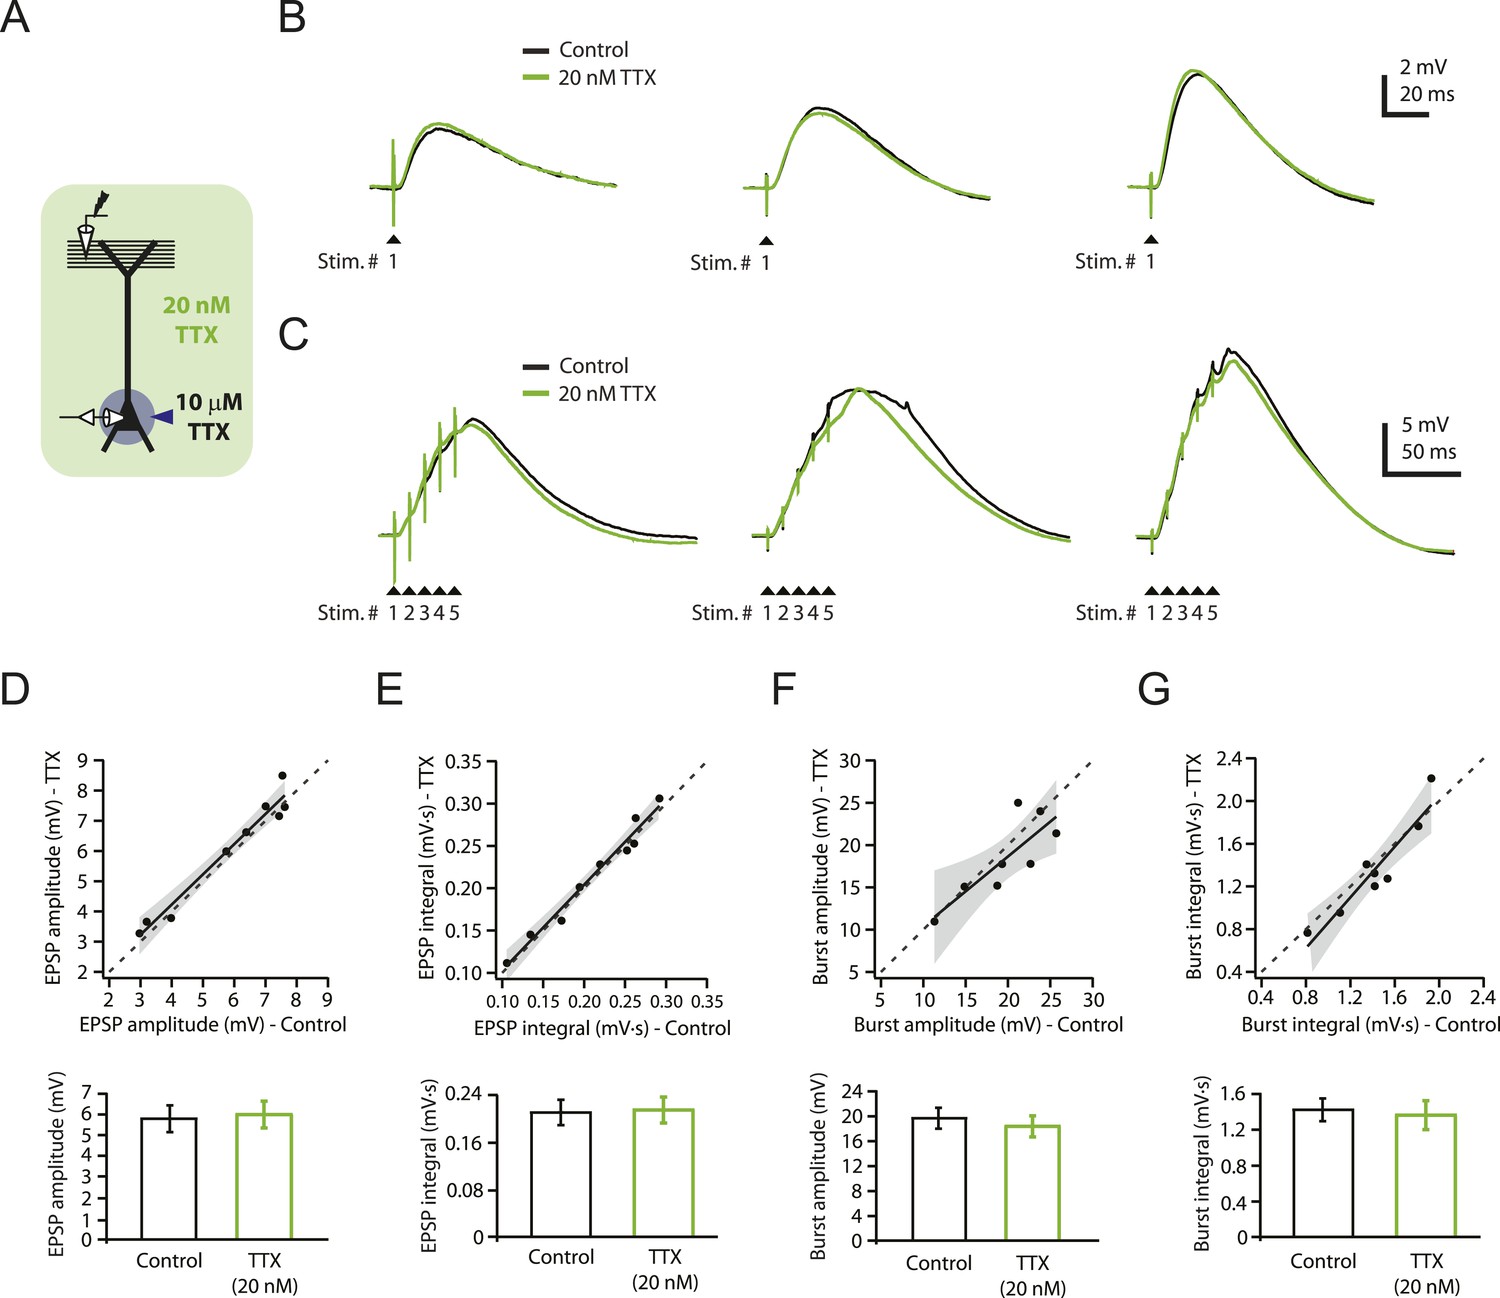
Reducing Nav channel availability with 20 nM TTX does not affect synaptic transmission at PP → CA1tuft synapses.
(A) Experimental configuration showing somatic whole-cell recording with presynaptic stimulation of the perforant pathway (PP), 10 µM TTX locally applied to the soma, and bath application of 20 nM TTX. (B, C) Representative traces of somatically recorded voltage in response to single-shock stimulation (B) or high-frequency burst stimulation (5 stimuli at 100 Hz; C) in control and 20 nM TTX. Traces are from three different cells. (D–G) Summary of effects of 20 nM TTX on EPSP amplitude and integral (D, E, single-shock, n = 9; F, G, burst, n = 8). Top. Scatter plots of the amplitude or integral of responses in 20 nM TTX vs control. Each point represents data from one cell. Solid lines represent a linear fit to data points, with shaded areas representing the 95% confidence band of the fit. Dashed lines are the unity line. Bottom. Bar graphs of the amplitude or integral of responses in control and 20 nM TTX.
-
Figure 1—source data 1
Source data for Figure 1.
- https://doi.org/10.7554/eLife.06414.004
-
Figure 1—source data 2
Source data for Figure 1—figure supplement 1.
- https://doi.org/10.7554/eLife.06414.005
Figure 1—figure supplement 1
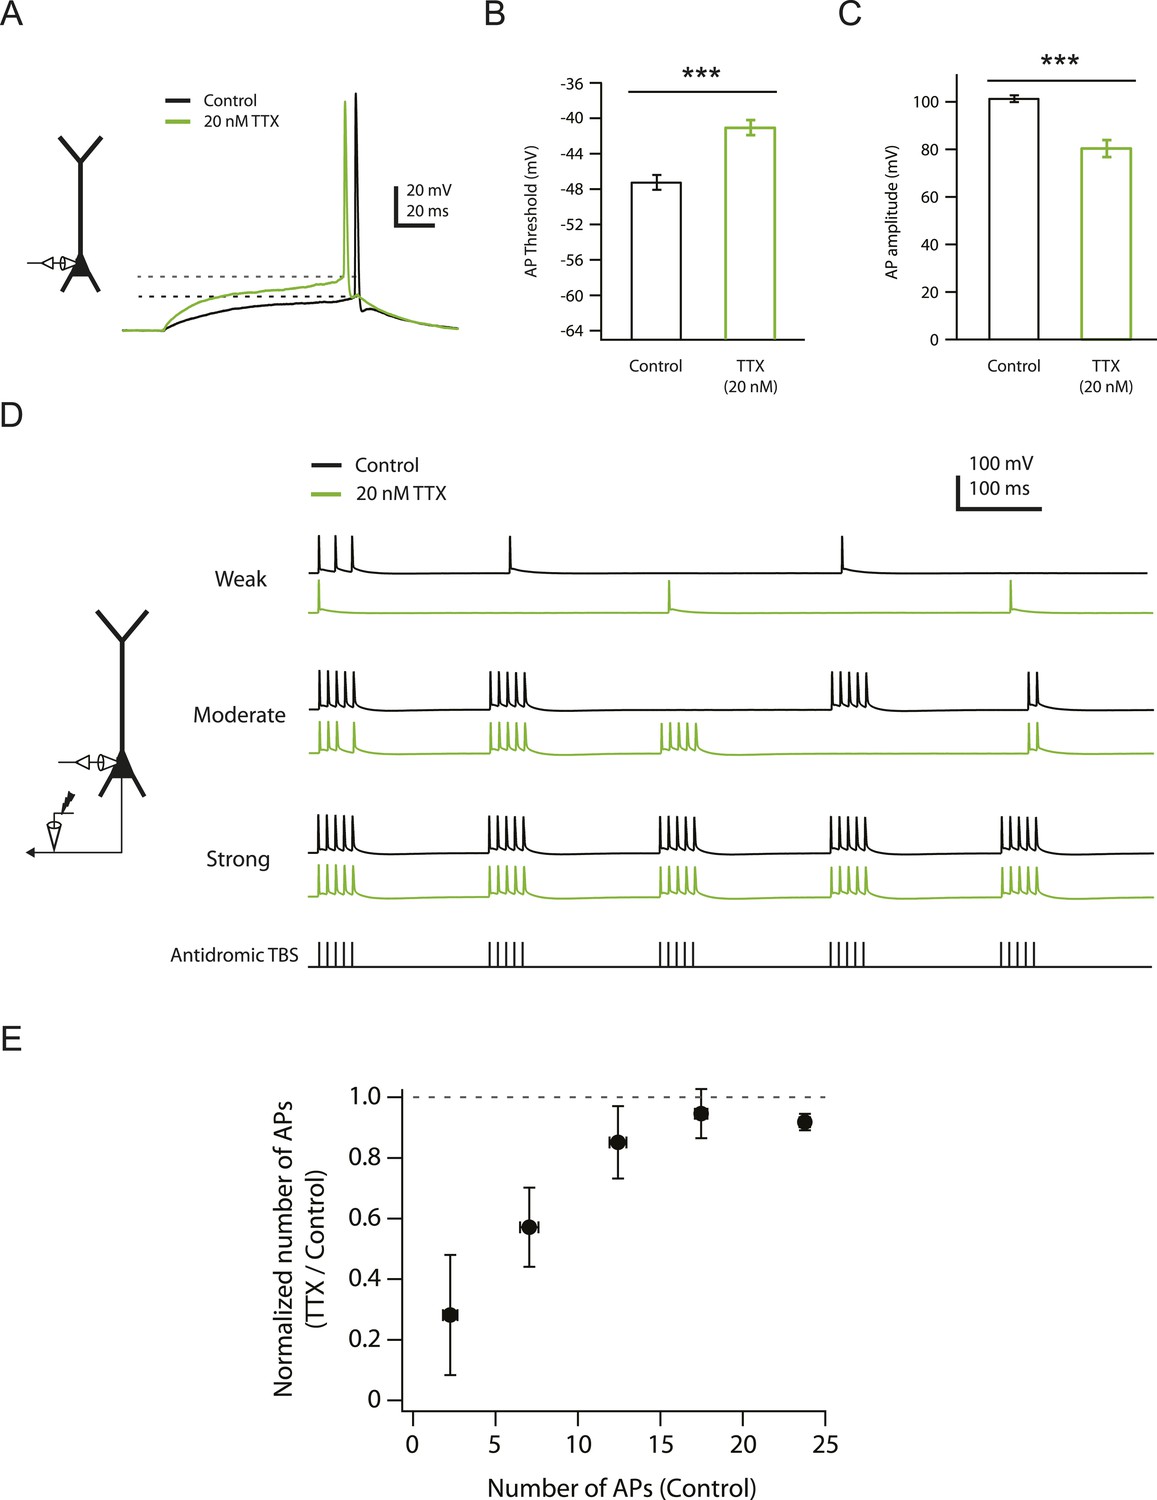
Effects of reducing Nav channel availability with 20 nM TTX on somatic action potentials.
(A) Left, experimental configuration showing somatic whole-cell recording. Right, representative traces of somatically recorded voltage in response to a current step (100 ms) at the level of action potential (AP) threshold (rheobase) injected at the soma in control and 20 nM TTX. Dashed lines indicate the apparent voltage threshold of the APs. (B, C) Summary of effects of 20 nM TTX on somatic action potentials (n = 8). ***p < 0.001 by Student's paired t-test. (D) Left, experimental configuration showing somatic whole-cell recording with antidromic stimulation of CA1 axons. Right, representative traces of somatically recorded voltage in response to antidromic TBS (the same temporal pattern as used for LTP induction; see ‘Materials and methods’) at different stimulus intensities in control and 20 nM TTX. (E) Summary of effects of 20 nM TTX on antidromic action potentials (n = 7).
Figure 2 with 4 supplements
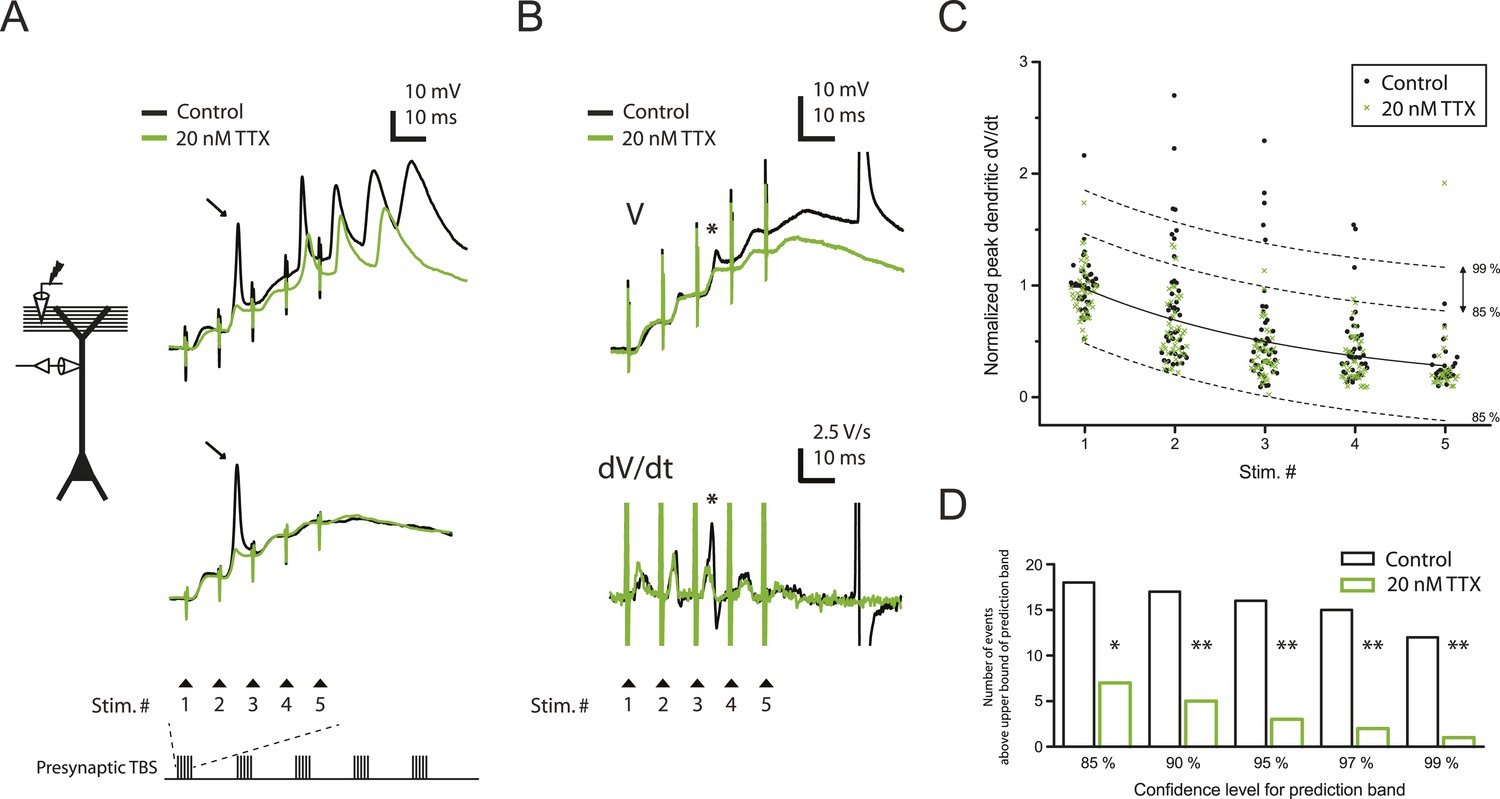
Reducing Nav channel availability with 20 nM TTX inhibits postsynaptic dSpikes evoked by presynaptic TBS of PP → CA1tuft synapses.
(A) Left, experimental configuration showing dendritic whole-cell recording with presynaptic stimulation of the PP. Right, traces of dendritically recorded voltage in response to a single burst of presynaptic theta-burst stimulation (TBS) from two different neurons with large dSpikes in control (arrows; see Figure 2—figure supplement 2) and the corresponding responses in 20 nM TTX. In the top traces, the large-amplitude dendritic events following the fourth and fifth stimulus in the burst are likely to be bAPs (‘Materials and methods’). Recordings were performed at 280 and 320 µm from the soma for the top and the bottom traces, respectively. (B) Representative traces of dendritically recorded voltage (V; top) and the first temporal derivative of voltage (dV/dt; bottom) in response to a single burst of presynaptic TBS from a neuron with a small dSpike (spikelet; asterisk) in control and the corresponding responses in 20 nM TTX. Experimental configuration is as shown in the inset in A. Recording was performed at 290 µm from the soma (note: a large-amplitude dendritic event following the fifth stimulus in the burst is truncated. It is likely to be a bAP; see ‘Materials and methods’). (C) Summary of the dendritic recordings, showing peak first temporal derivative of dendritically recorded voltage (dV/dt), normalized to the median value for Stim. # 1 of the five bursts (in control) from the given cell, plotted as a function of Stim. # in each burst in control and 20 nM TTX (n = 9 cells; positions with a large-amplitude dendritic event in the control condition were excluded; see ‘Materials and methods’). The solid line represents an exponential fit to the whole data set (control and 20 nM TTX), and the dashed lines represent the prediction band at the 85% confidence level and the upper bound at the 99% confidence level. (D) Summary of effects of 20 nM TTX on small dSpikes (spikelets), showing the number of events above the upper bound of prediction band at different confidence levels (i.e., small dSpikes; see ‘Materials and methods’) in control and 20 nM TTX. **p < 0.01, *p < 0.05 by binomial test.
-
Figure 2—source data 1
Source data of Figure 2.
- https://doi.org/10.7554/eLife.06414.008
-
Figure 2—source data 2
Source data of Figure 2—figure supplement 1–4.
- https://doi.org/10.7554/eLife.06414.009
Figure 2—figure supplement 1
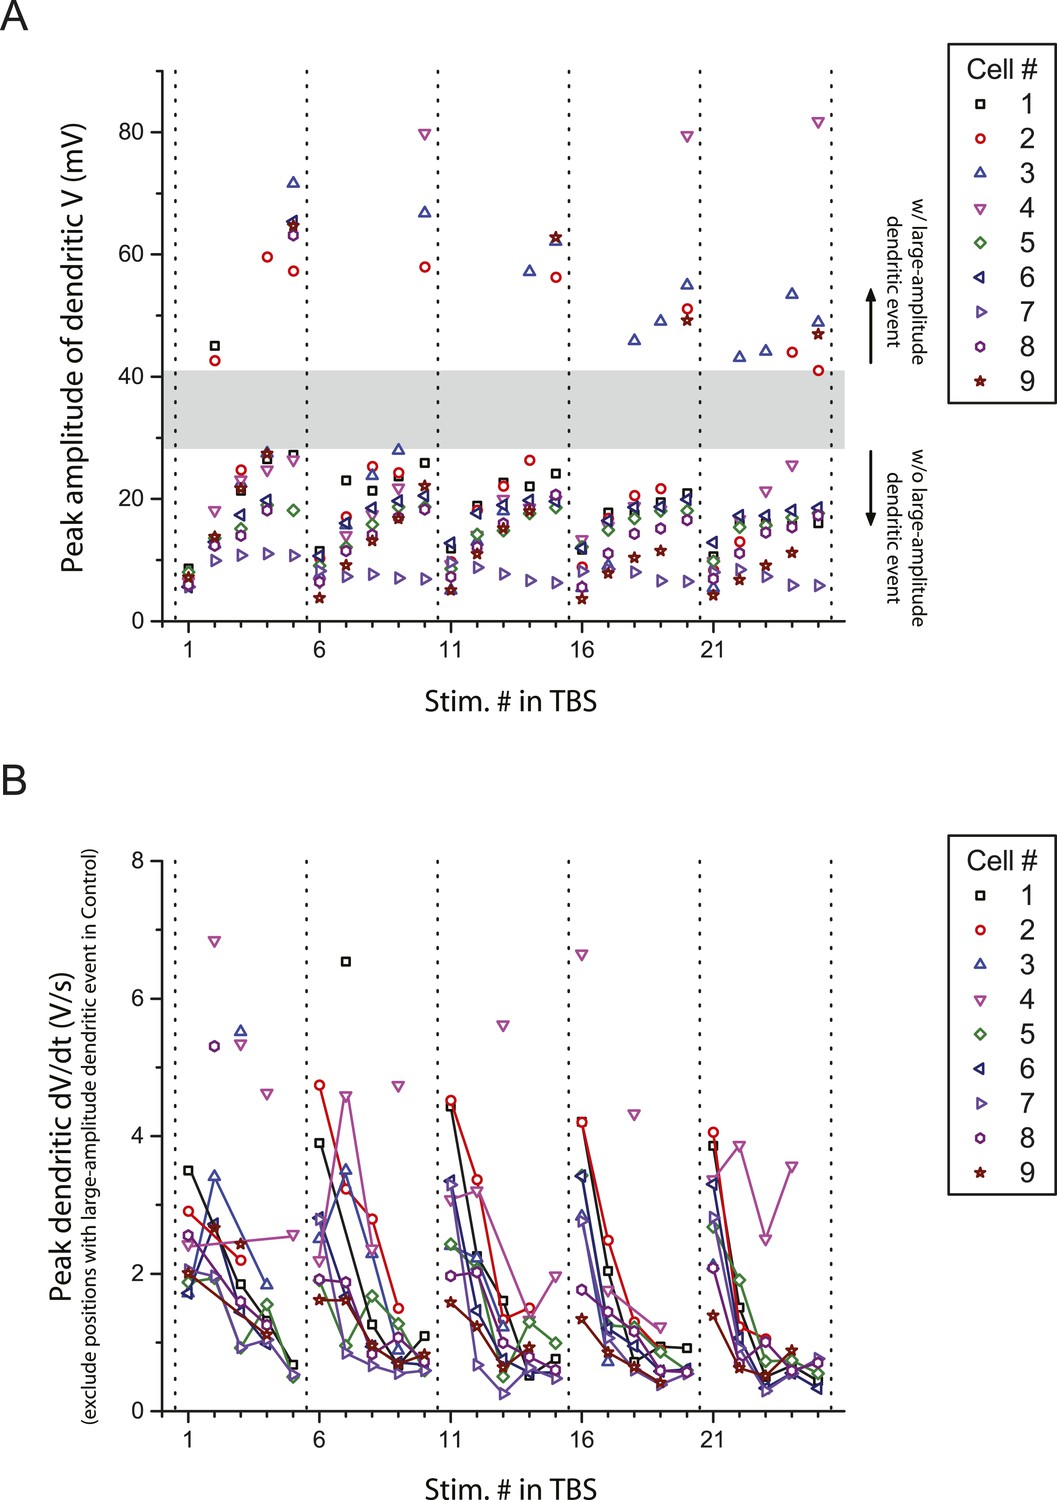
Peak amplitude and the first temporal derivative of dendritically recorded voltage in response to TBS plotted as a function of stimulus position in TBS.
(A) Additional analysis of the experiments in Figure 2A, showing peak amplitude of dendritically recorded voltage (V) in response to presynaptic TBS plotted as a function of stimulus position (Stim. #) in TBS. Gray area illustrates a gap in the distribution, dividing it into groups with (w/) and without (w/o) large-amplitude dendritic events (presumed to consist of both bAPs and large dSpikes; see ‘Materials and methods’). (B) Additional analysis of the experiments in Figure 2B, showing peak first temporal derivative of dendritically recorded voltage (dV/dt) in response to presynaptic TBS plotted as a function of Stim. # in TBS (positions with a large-amplitude dendritic event in the control condition were excluded). Solid lines connect the data points from the same burst. Unconnected data points correspond to the events above the upper bound of the 99% prediction band in Figure 2C (‘Materials and methods’); these traces are shown in Figure 2—figure supplement 3.
Figure 2—figure supplement 2
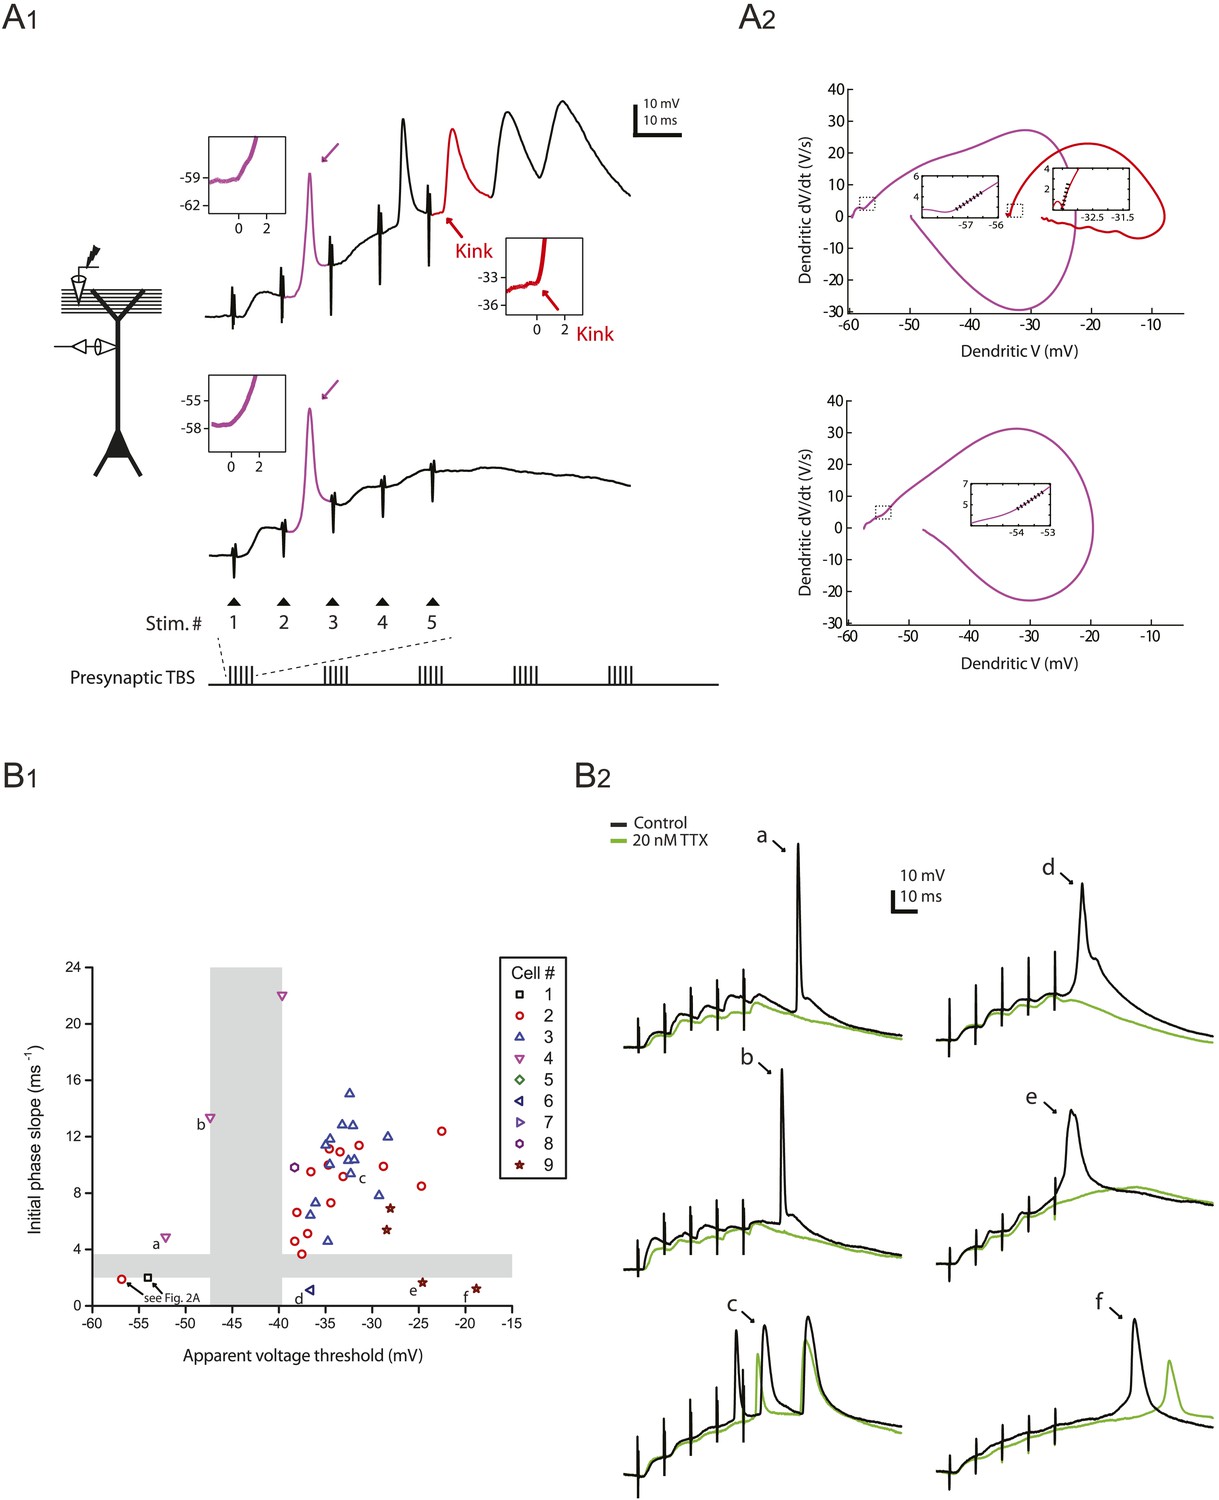
Distinguishing between bAPs and large dSpikes in dendritic recordings.
(A) Analysis of the onset kinetics of large-amplitude dendritic events. A1. Left, experimental configuration showing dendritic whole-cell recording with presynaptic stimulation of the PP. Right, traces of dendritically recorded voltage in response to a single burst of presynaptic TBS from two different neurons with large dSpikes in control (same as the traces in Figure 2A, black). Purple arrows indicate a large dSpike in the early phase of each burst response (purple), which had a more gradual onset (insets, purple trace) and a lower apparent voltage threshold. In contrast, a bAP in the late phase of the burst response (red) had a sharp kink at its onset (inset, red arrow and trace) and a higher apparent voltage threshold. A2. Phase plots (dV/dt vs V) of the events color-coded in A1. Insets show a linear fit (dotted line) to the initial phase of the large dSpikes (purple) and the bAP (red); ‘initial phase slope’ was measured as the slope of the fit. This measure represents the apparent voltage sensitivity of membrane current at the onset of the spike (see ‘Materials and methods’). (B) Distinguishing between bAPs and large dSpikes on the basis of apparent voltage threshold and initial phase slope. B1. Scatter plot of initial phase slope vs apparent voltage threshold of large-amplitude dendritic events. Gray areas illustrate gaps in the distribution of both measures. The events in the bottom-left quadrant (the red circle and the black square, same as the ones indicated by the purple arrows in the top and the bottom traces in A1, respectively; see also Figure 2A) were identified as large dSpikes. The events in the top-right quadrant (such as the one indicated by ‘c’) were identified as bAPs. The events in the other two quadrants (indicated by ‘a’, ‘b’, ‘d’, ‘e’, and ‘f’) are ambiguous cases: those in the top-left quadrant (‘a’ and ‘b’) are most likely bAPs, because they have a large initial phase slope and are initiated in the falling phase of the dendritically recorded EPSPs; those in the bottom-right quadrant (‘d’, ‘e’, and ‘f’) are likely large dSpikes, because they have a small initial phase slope, and their broad width suggests a larger contribution from Cav and/or NMDAR channels. B2. Traces of the events indicated by letters in B1, shown together with the corresponding responses in 20 nM TTX.
Figure 2—figure supplement 3
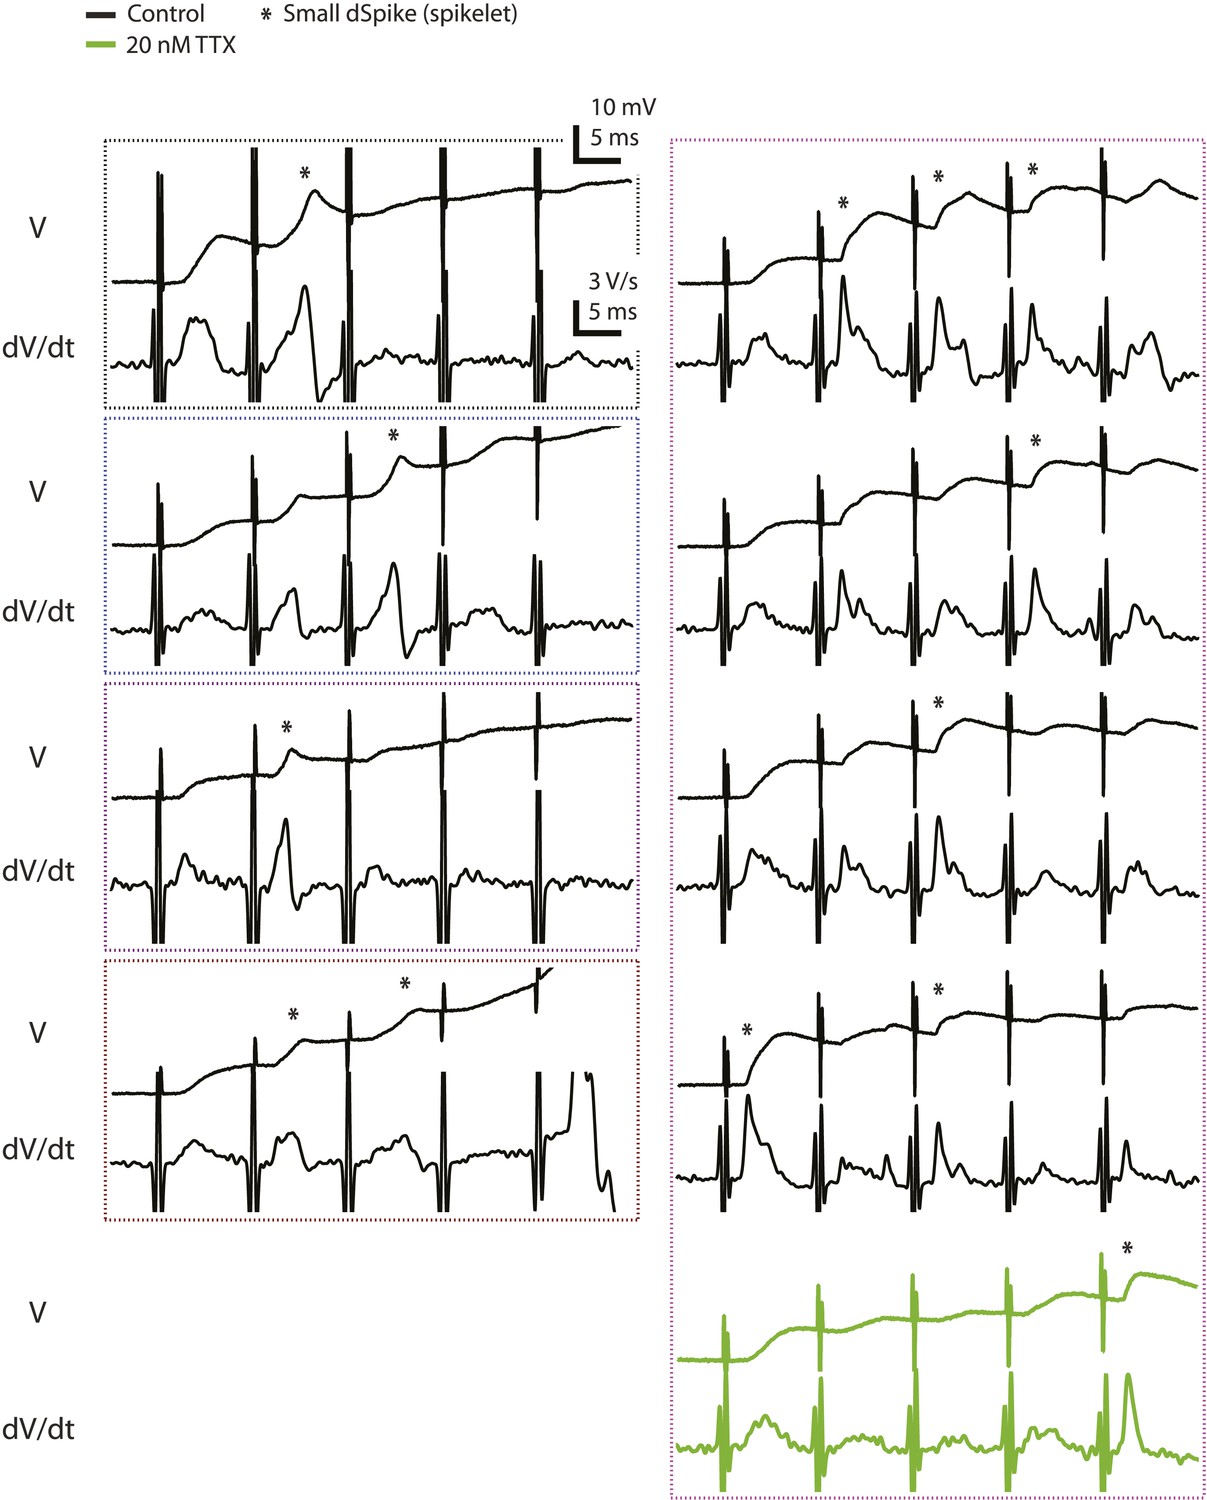
Voltage and the first temporal derivative of voltage of the clearest small dSpikes (spikelets).
Traces of dendritically recorded voltage (V) and the first temporal derivative of voltage (dV/dt) in response to a single presynaptic burst of the PP for the events above the upper bound of the 99% prediction band shown in Figure 2C (asterisk; i.e., the small dSpikes identified by the most stringent criterion; see ‘Materials and methods’). These are the same events as the data points disconnected from the solid lines in Figure 2—figure supplement 1B (except for the green traces). Dotted boxes group data from the same cell, with color codes consistent to that used in Figure 2—figure supplement 1.
Figure 2—figure supplement 4
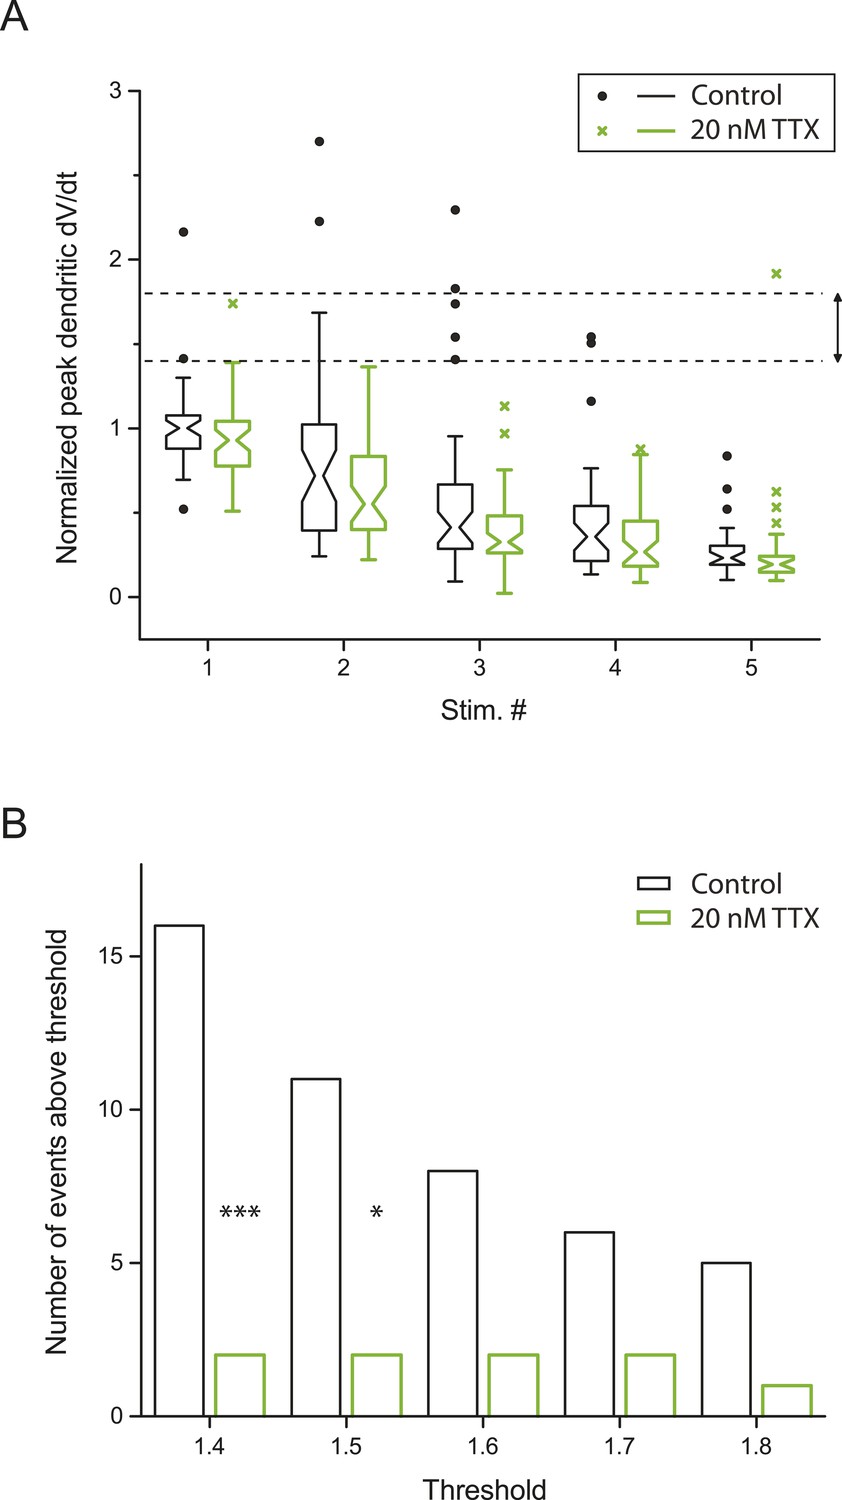
Small dSpikes (spikelets) identified by a second method.
(A) Alternative analysis of the experiments in Figure 2B, showing notched box plots of peak first temporal derivative of dendritically recorded voltage (dV/dt), normalized to the median value for Stim. # 1 of the five bursts (in control) from the given cell, plotted as a function of Stim. # in each burst in control and 20 nM TTX (n = 9 cells; positions with a large-amplitude dendritic event in the control condition were excluded). The edges of notch were defined by the 95% confidence intervals of the median, the end points of whiskers as the largest and smallest data values that are within the range of (the 75th percentile + 1.5 × interquartile range) and (the 25th percentile − 1.5 × interquartile range), and individual data points are those outside this range. The upper and lower dashed lines represent normalized peak dV/dt of 1.8 and 1.4, respectively. (B) Summary of effects of 20 nM TTX on small dSpikes (spikelets), showing the number of events above different thresholds (i.e., small dSpikes; see ‘Materials and methods’) in control and 20 nM TTX. ***p < 0.001, *p < 0.05 by binomial test.
Figure 3

TBS-induced PP → CA1tuft LTP is blocked by reducing Nav channel availability with 20 nM TTX.
(A) Left, experimental configuration showing somatic whole-cell recording with presynaptic stimulation of the PP. Right, representative trace of somatically recorded voltage in response to presynaptic TBS paired with somatic current injections at 50 Hz. A TBS consisted of five high-frequency bursts repeated at 5 Hz, with each consisting of 5 stimuli at 100 Hz. Each TBS was delivered three times, at 30-s intervals. (B, C) Representative time course of EPSP amplitude before and after TBS was delivered three times, paired with somatic current injections (TBSx3+Current; arrows) in control (B) and 20 nM TTX (C; 20 nM TTX was applied via the bath during the entire experiment). Top, representative traces (single trials) of EPSP before (1) and 25 min after (2) TBSx3+Current were delivered. The scale bar in B applies to all panels. (D) Summary of the LTP experiments in control and 20 nM TTX. EPSP amplitude is normalized to the average EPSP amplitude before LTP induction. Solid lines and shaded areas represent mean and S.E.M., respectively. (E) Potentiation ratio in different experimental conditions: TBSx3+Current, TBS paired with somatic current injections; TBSx3+SomaticVC, TBS delivered with the soma voltage-clamped (VC) at ∼−70 mV to prevent action potential firing (TBSx3+Current, n = 9; TBSx3+SomaticVC, n = 9; TBSx3+Current in 20 nM TTX, n = 8; TBSx3+SomaticVC in 20 nM TTX, n = 8). ##p < 0.01 for the effect of time on EPSP amplitude by one-way repeated measures ANOVA. **p < 0.01 (TBSx3+Current, control vs 20 nM TTX), *p < 0.05 (TBSx3+SomaticVC, control vs 20 nM TTX) by one-way ANOVA with post-hoc means comparison using Tukey's test.
-
Figure 3—source data 1
Source data of Figure 3.
- https://doi.org/10.7554/eLife.06414.015
Figure 4 with 1 supplement
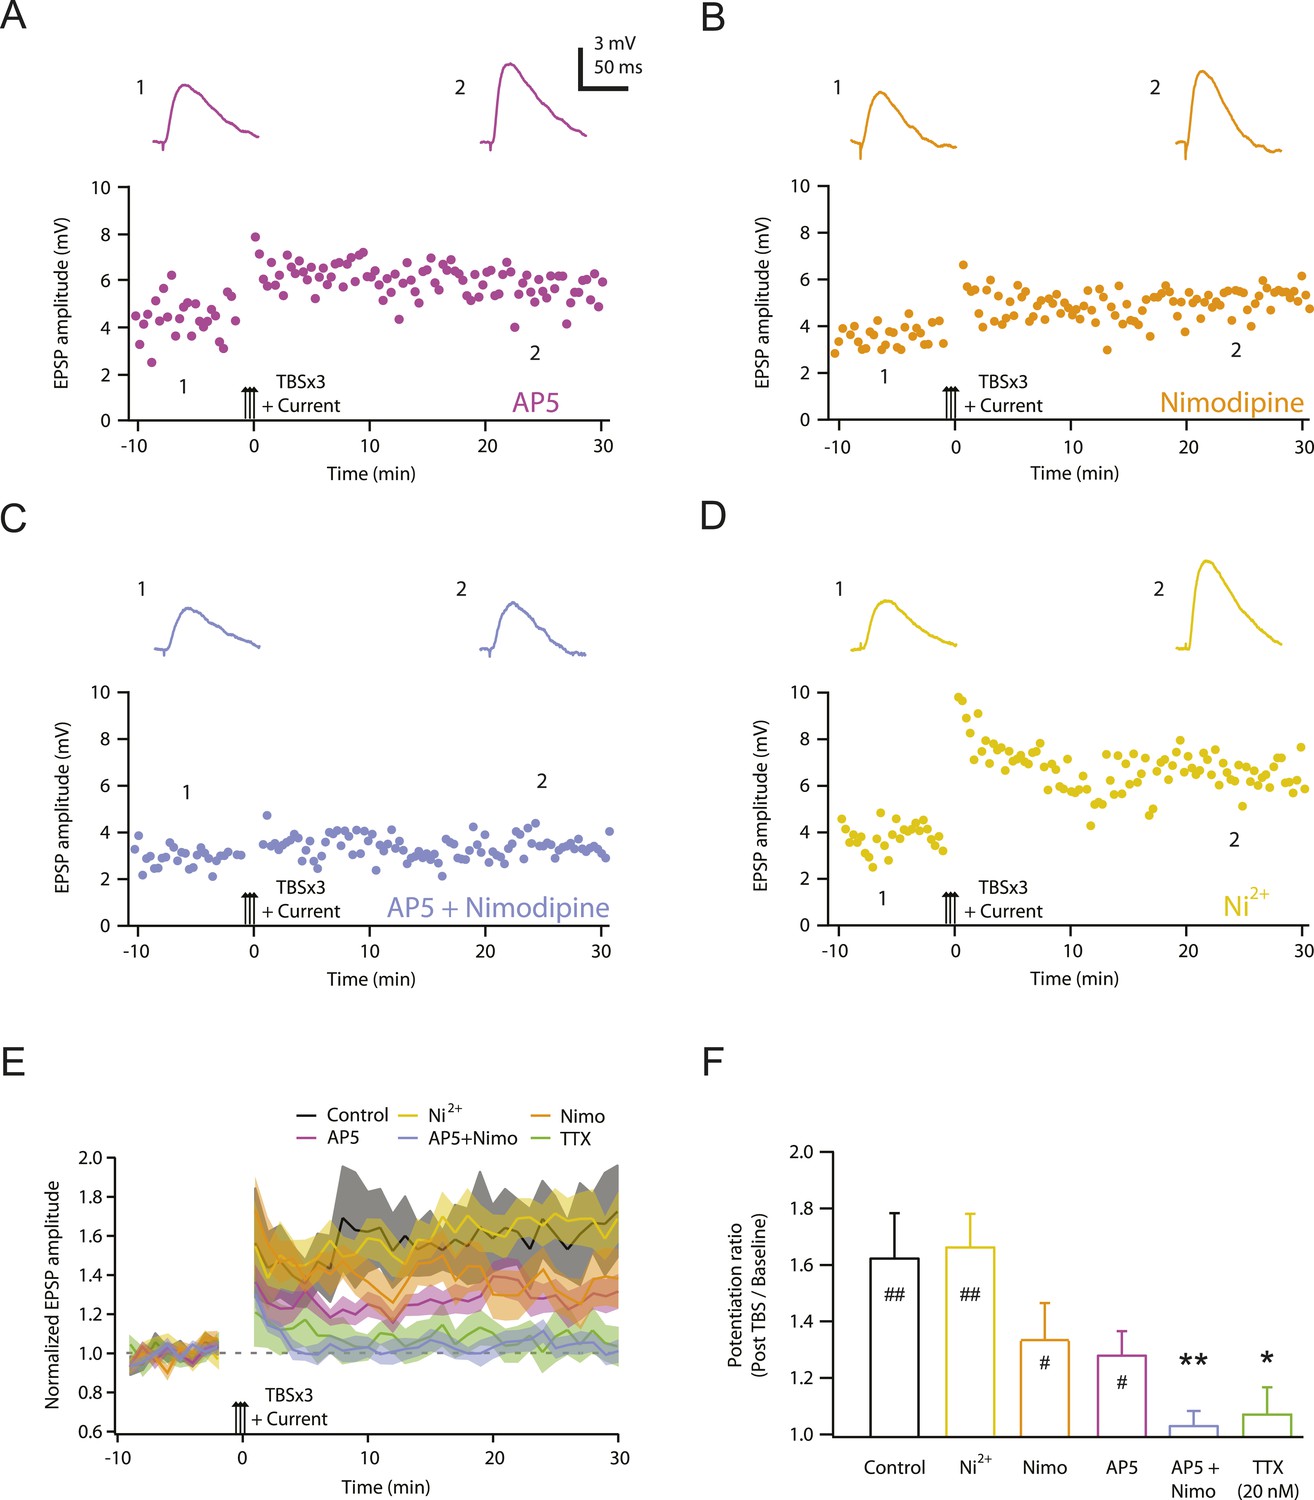
NMDAR and L-Cav channels mediate TBS-induced LTP at PP → CA1tuft synapses.
(A–D) Representative time course of EPSP amplitude before and after TBSx3+Current was delivered (arrows) in 50 µM AP5 (A), 10 µM nimodipine (B), 50 µM AP5 and 10 µM nimodipine (C), or 50 µM Ni2+ (D). Drugs were applied via the bath during the entire experiment. Top, representative traces (single trials) of EPSP before (1) and 25 min after (2) TBSx3+Current was delivered. The scale bar in A applies to all panels. (E) Summary of the LTP experiments in AP5, nimodipine (Nimo), AP5 and nimodipine (AP5+Nimo), and Ni2+, shown along with the data in control and 20 nM TTX (Figure 3) for comparison. EPSP amplitude is normalized to the average EPSP amplitude before LTP induction. Solid lines and shaded areas represent mean and S.E.M., respectively. (F) Potentiation ratio in different experimental conditions (Control, n = 9; AP5, n = 11; Nimo, n = 9; AP5+Nimo, n = 11; Ni2+, n = 9; 20 nM TTX, n = 8). ##p < 0.01, #p < 0.05 for the effect of time on EPSP amplitude by one-way repeated measures ANOVA. **p < 0.01, *p < 0.05 (all compared to control) by one-way ANOVA with post-hoc means comparison using Tukey's test.
-
Figure 4—source data 1
Source data of Figure 4.
- https://doi.org/10.7554/eLife.06414.017
-
Figure 4—source data 2
Source data of Figure 4—figure supplement 1.
- https://doi.org/10.7554/eLife.06414.018
Figure 4—figure supplement 1
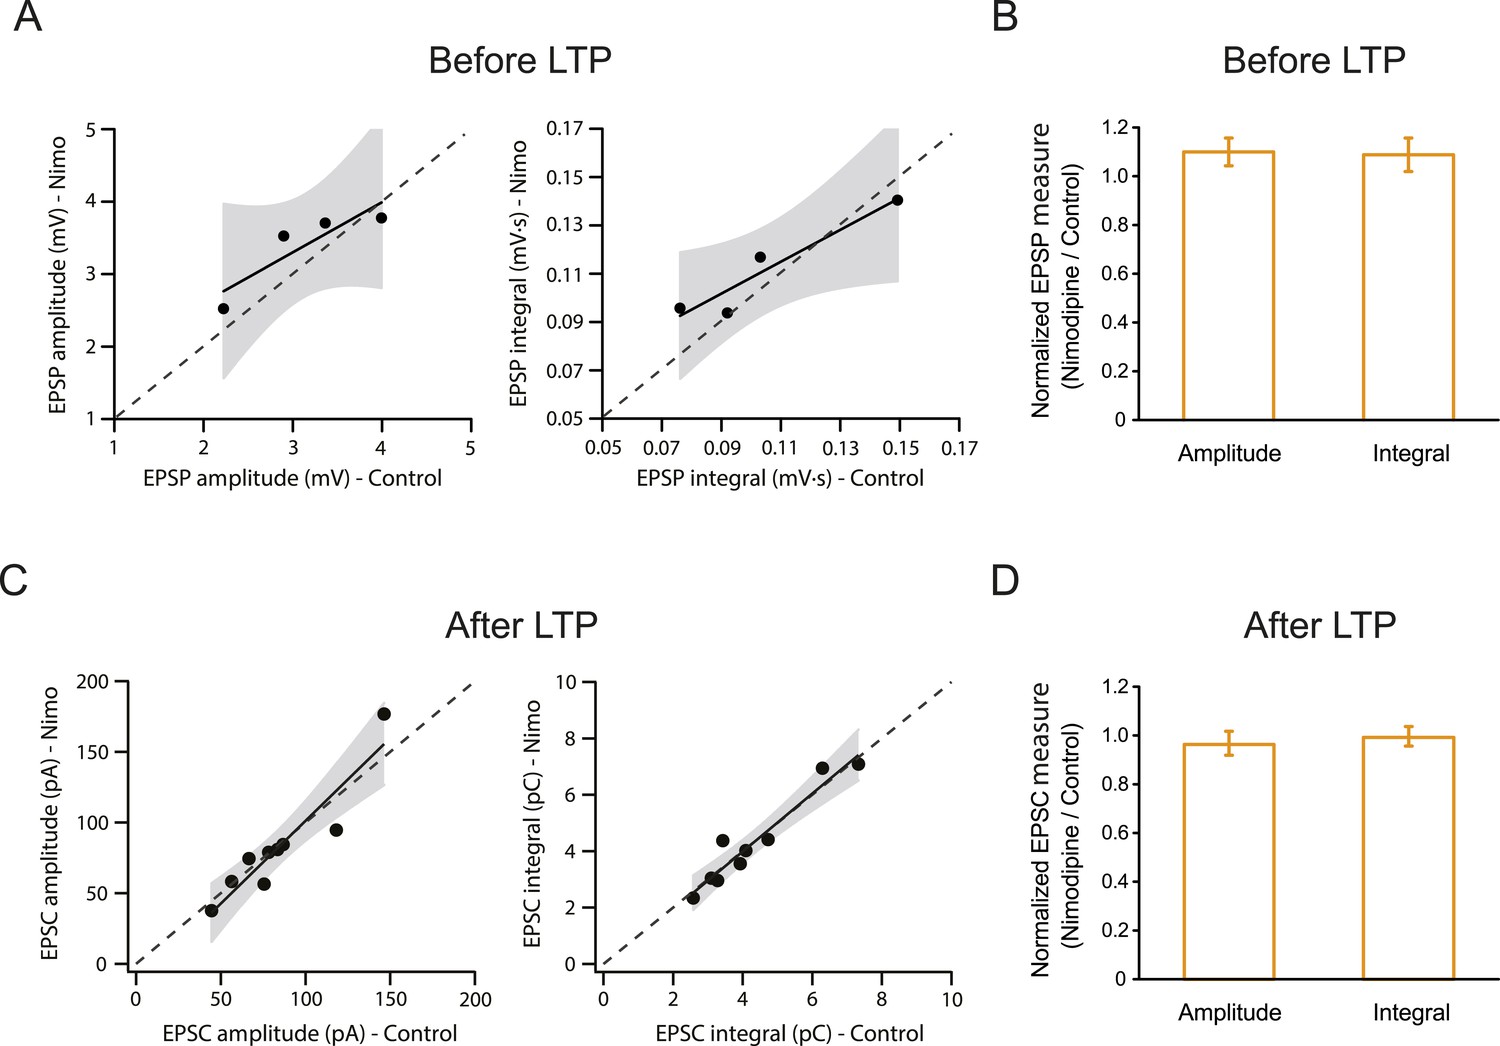
L-Cav channels are not required for synaptic transmission before or after the induction of PP → CA1tuft LTP.
Summary of effects of 10 µM nimodipine (Nimo) on somatically recorded voltage or current in response to single-shock stimulation of the PP before (A, B) or after (C, D) the induction of PP → CA1tuft LTP. (A, B) Scatter plots (nimodipine vs control) and bar graphs (normalized to control) of the amplitude or integral of voltage before LTP induction. (C, D) Scatter plots (nimodipine vs control) and bar graphs (normalized to control) of the amplitude or integral of current after LTP induction. Each point represents data from one cell. Solid lines represent a linear fit to data points, with shaded areas representing the 95% confidence band of the fit. Dashed lines are the unity line.
Figure 5
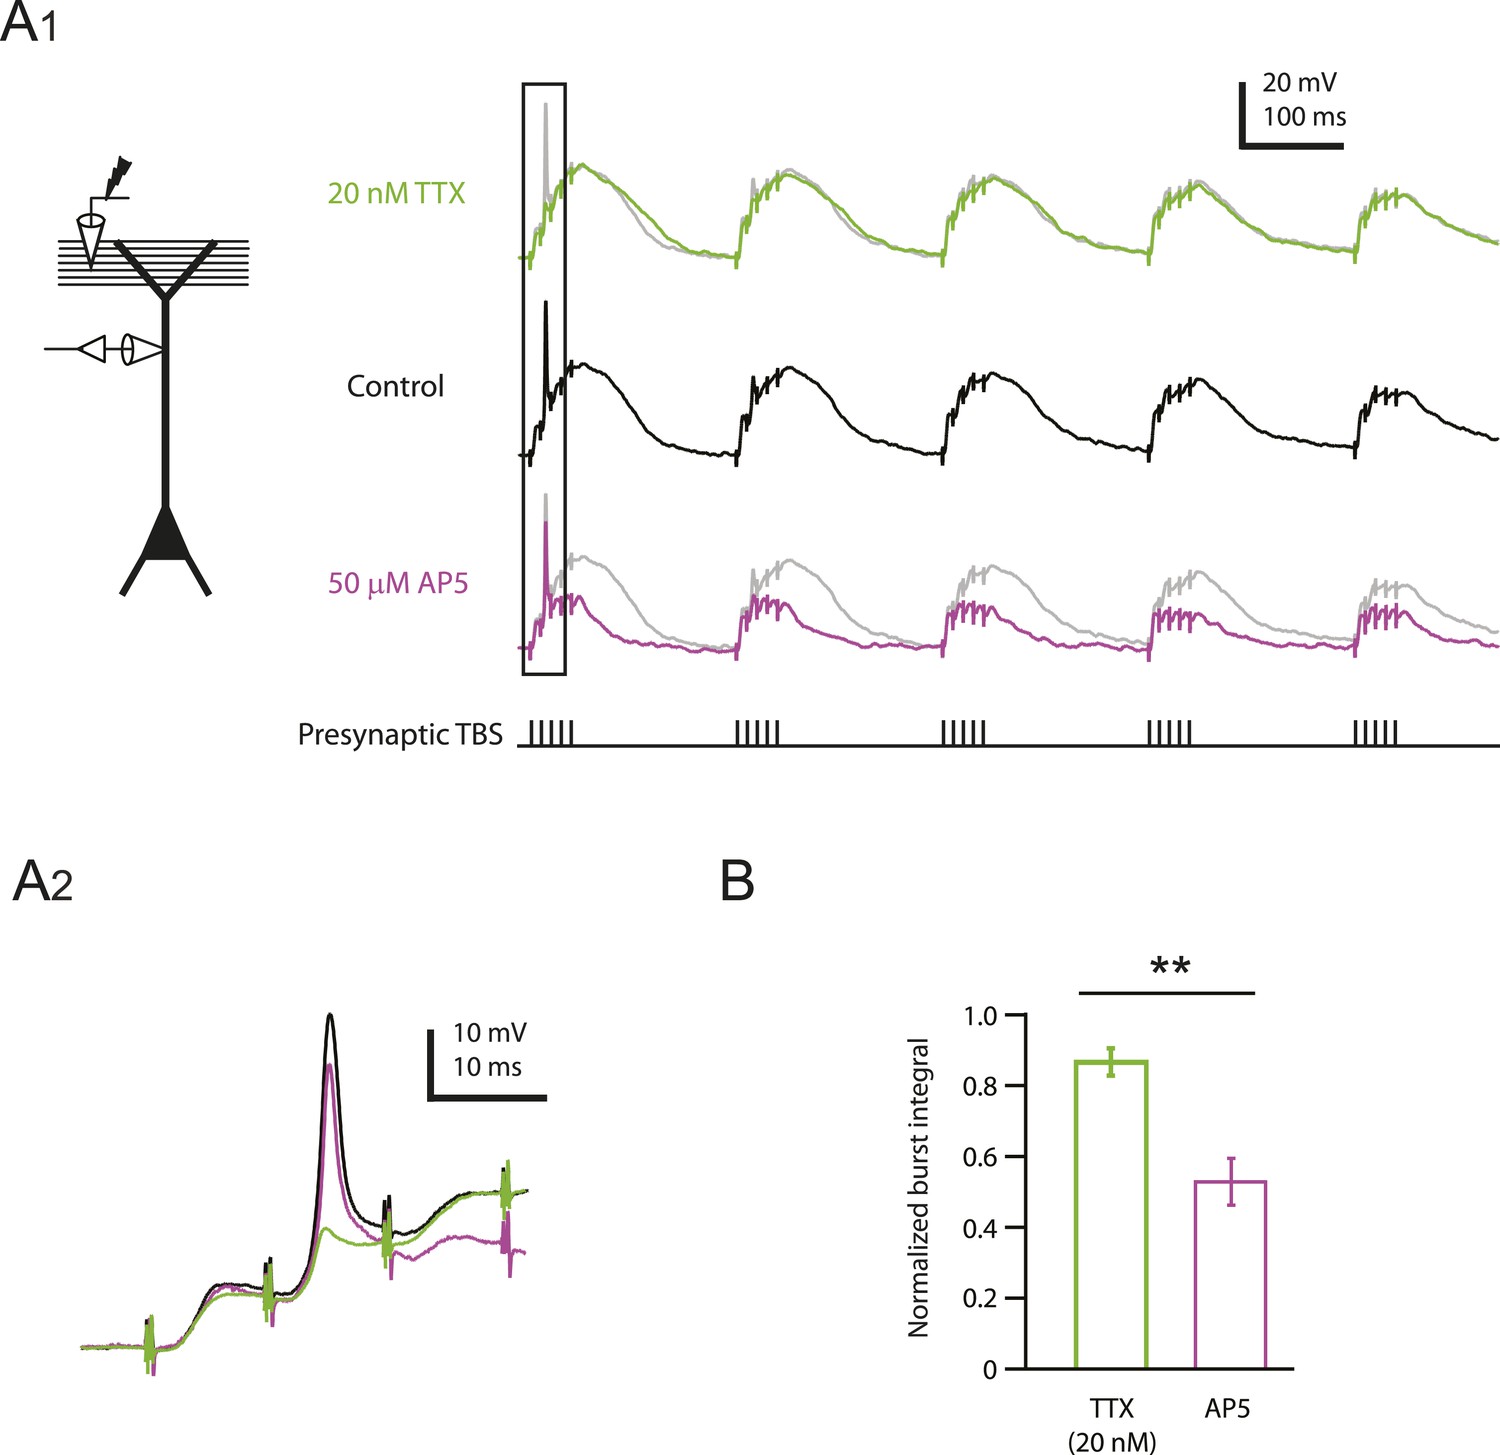
Reducing Nav channel availability reduces the slow synaptic depolarization in distal apical trunk in response to TBS significantly less than blocking NMDAR channels.
(A) Differential effects of 20 nM TTX and 50 µM AP5 on dendritically recorded voltage in response to presynaptic TBS. A1, Left, experimental configuration showing dendritic whole-cell recording with presynaptic stimulation of the PP. Right, example traces of dendritically recorded voltage in response to presynaptic TBS from a neuron with a large dSpike in control (the same cell as the bottom case shown in Figure 2A) and the corresponding responses in 20 nM TTX or 50 µM AP5 (TTX was washed out before subsequent application of AP5). A2. Traces corresponding to the box in A1. Note that the large dSpike was blocked by 20 nM TTX, but not 50 µM AP5. (B) Summary of effects of TTX (n = 9) and AP5 (n = 4) on burst responses (normalized to control). Measured integrals include contributions from large-amplitude dendritic events, which were observed in some cells. **p < 0.01 by Student's t-test.
-
Figure 5—source data 1
Source data of Figure 5.
- https://doi.org/10.7554/eLife.06414.021
Figure 6
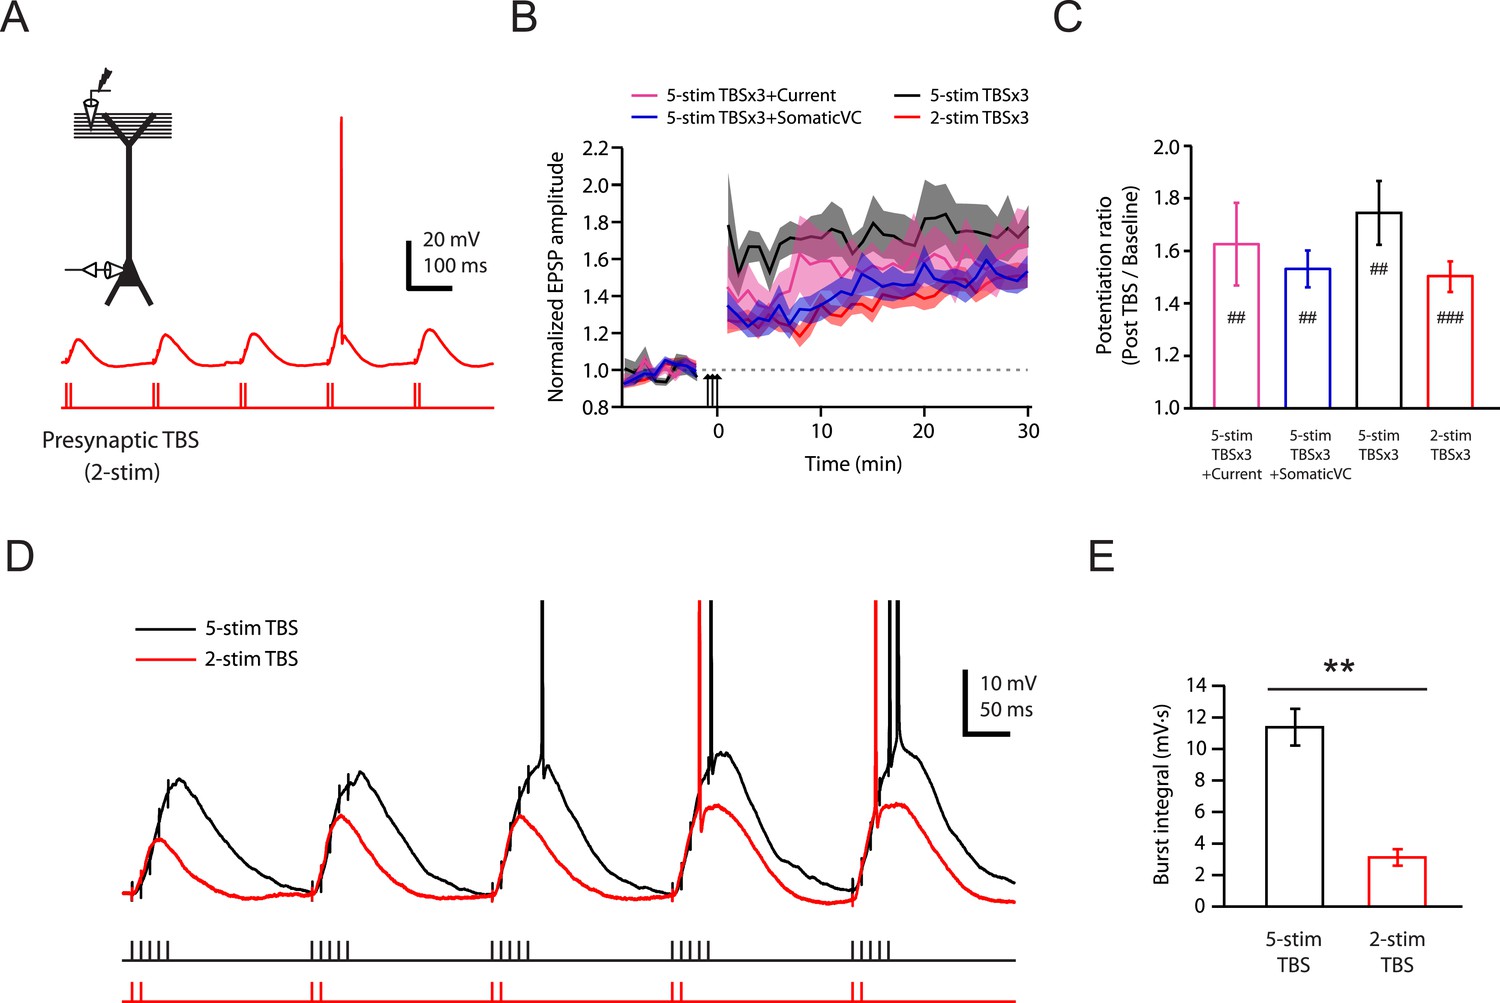
Brief synaptic stimuli are sufficient for the induction of PP → CA1tuft LTP.
(A) Top left, experimental configuration showing somatic whole-cell recording with presynaptic stimulation of the PP. Bottom right, representative trace of somatically recorded voltage in response to a modified TBS pattern, consisting of only 2 (2-stim TBS) instead of 5 (5-stim TBS) synaptic stimuli in each burst. (B) Summary of the time courses of normalized EPSP amplitude before and after 2-stim TBS or 5-stim TBS was delivered three times (2-stim TBSx3 or 5-stim TBSx3; arrows), shown along with the data with TBSx3+Current or TBSx3+SomaticVC (Figure 3) for comparison. EPSP amplitude is normalized to the average EPSP amplitude before LTP induction. Solid lines and shaded areas represent mean and S.E.M., respectively. (C) Potentiation ratio in different experimental conditions (5-stim TBSx3+Current, n = 9; 5-stim TBSx3+SomaticVC, n = 9; 5-stim TBSx3, n = 5; 2-stim TBSx3, n = 13). ###p < 0.001, ##p < 0.01 for the effect of time on EPSP amplitude by one-way repeated measures ANOVA. No statistically significant differences by one-way ANOVA (p = 0.45). (D) Representative traces of somatically recorded voltage in response to 5-stim or 2-stim TBS. The action potentials are truncated. (E) Summary of the integral of responses to the first repeat of 5-stim (n = 5) or 2-stim (n = 13) TBS. **p < 0.01 by Student's t-test.
-
Figure 6—source data 1
Source data of Figure 6.
- https://doi.org/10.7554/eLife.06414.023
Figure 7 with 1 supplement
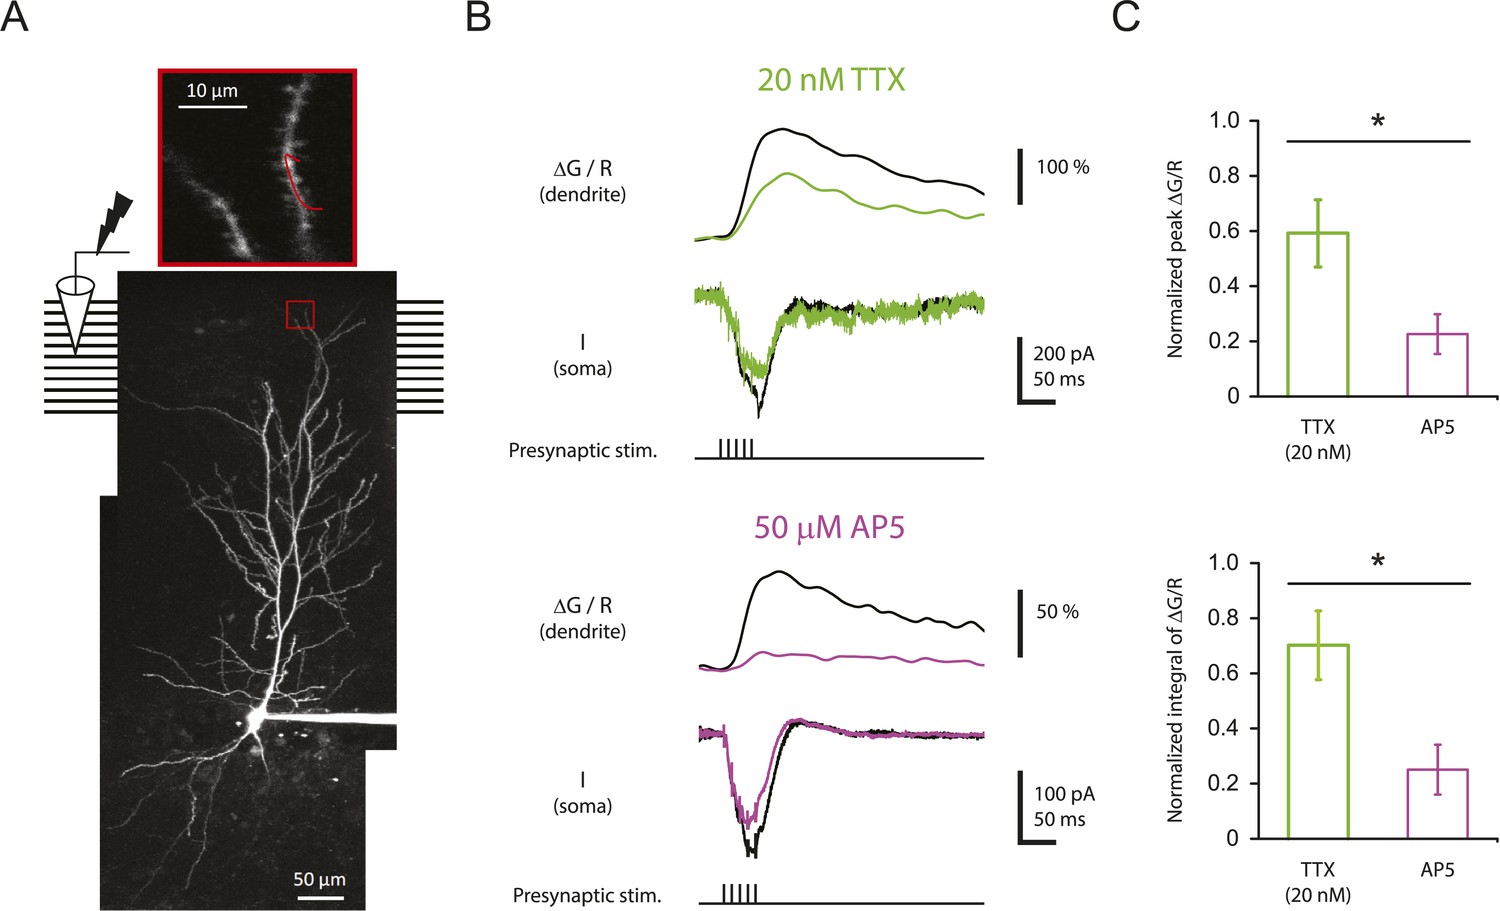
Reducing Nav channel availability reduces the calcium influx in distal apical tuft dendrites in response to high-frequency burst stimulation significantly less than blocking NMDAR channels.
(A) Bottom, experimental configuration showing somatic whole-cell recording with presynaptic stimulation of the PP, with a representative Z-stack image of a neuron (filled with 50 µM AF-594) on which the imaging experiments were performed. The box indicates the field of view used during high-resolution line scan. Top, a single-scan image corresponding to the box in the image below. The red line represents a line profile used for line scan, which went through a short stretch of the dendritic shaft and crossed a neighboring spine (not shown). Analysis was restricted to the data from dendritic shafts only. (B) Representative traces of ∆G/R (100 µM OGB-1) from dendritic shaft and current (‘I’) from somatic voltage-clamp recording in response to a single burst stimulation in control and 20 nM TTX or 50 µM AP5 (at least 15 min after drug application). Note that a spikelet was blocked by 20 nM TTX. (C) Summary of effects of TTX (n = 7) and AP5 (n = 5) on ∆G/R (normalized to control). *p < 0.05 by Student's t-test.
-
Figure 7—source data 1
Source data of Figure 7.
- https://doi.org/10.7554/eLife.06414.025
-
Figure 7—source data 2
Source data of Figure 7—figure supplement 1.
- https://doi.org/10.7554/eLife.06414.026
Figure 7—figure supplement 1
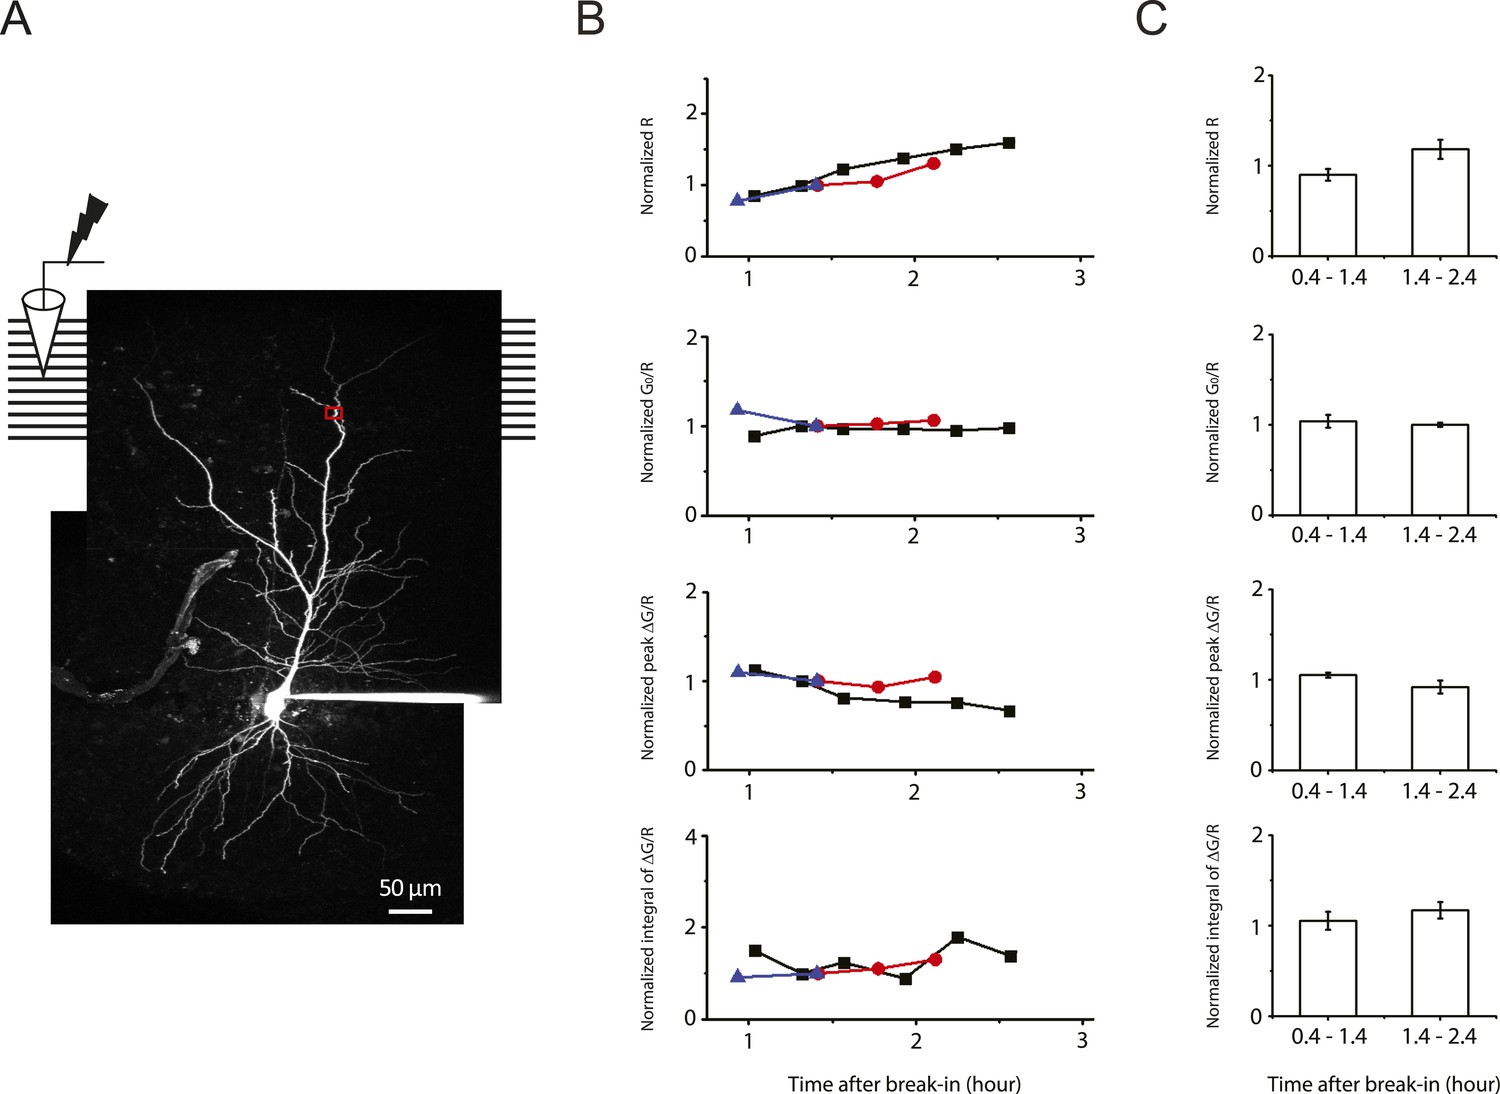
Stability of two-photon calcium imaging over long recording durations.
(A) Experimental configuration showing somatic whole-cell recording with presynaptic stimulation of the PP, with a representative Z-stack image of a neuron (filled with 50 µM AF-594). The box indicates the field of view used during high-resolution line scan. Analysis was restricted to the data from dendritic shafts only. (B) Time courses of basal fluorescence of AF-594 (‘R’), ratio of the basal fluorescence of OGB-1 (100 µM) to that of AF-594 (‘G0/R’), and peak and integral of ∆G/R from dendritic shaft in response to a single high-frequency burst stimulation. Different symbols and colors denote data from different cells. For comparison, data were normalized with respect to the time point shared by all the cells. These control experiments were performed with somatic voltage-clamp or current-clamp recording, and control ACSF was ‘washed in’ and ‘washed out’ (i.e., solution switched with no drugs) in the same manner as the pharmacological experiments (Figure 7 and Figure 8–figure supplement 1). As the AF-594 fluorescence (R) increased with dialysis of the indicators into the cells, the ratio G0/R (as a readout of basal calcium concentration) remained stable. Note that the integral of ∆G/R was more stable than peak ∆G/R. (C) Summary of stability of the two-photon calcium imaging and brain slice conditions (n = 3).
Figure 8 with 1 supplement
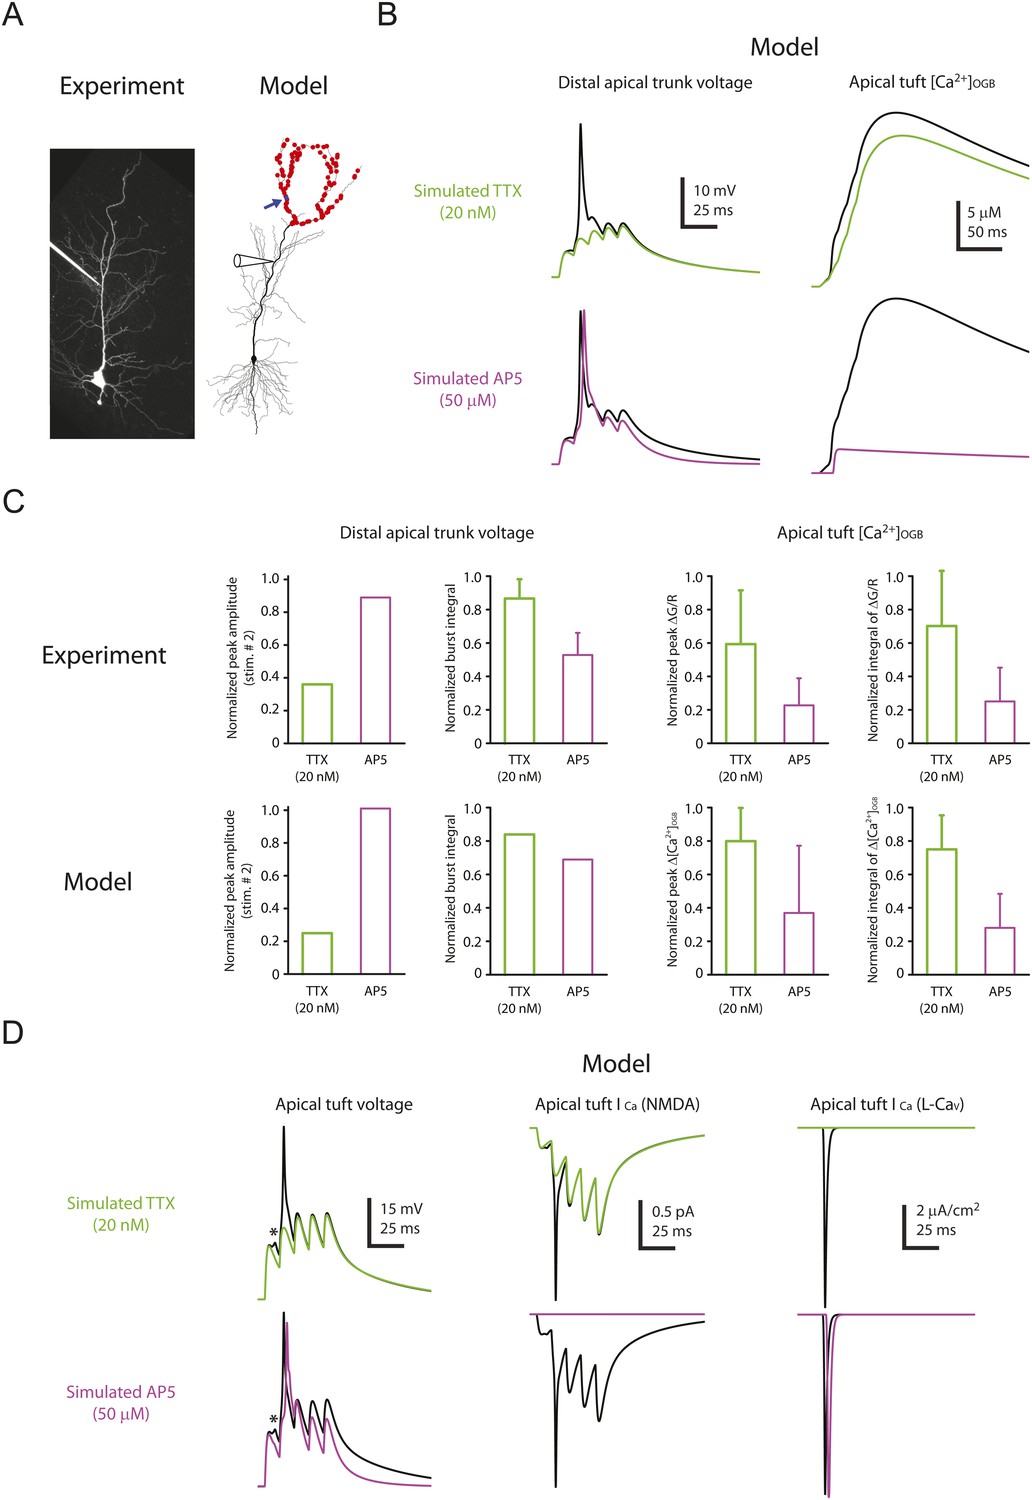
Computational modeling reveals a large, rapid, Na-dSpike-mediated calcium current through NMDAR and L-Cav channels.
(A) Left, Z-stack image of a neuron (filled with 50 µM AF-594). Right, morphology of the model neuron. Red dots indicate the locations of simulated synapses. Arrow indicates the imaged compartment with a simulated synapse (blue dot) for the example shown in B and D. (B) Representative traces of simulated voltage recorded from the distal apical trunk and concentration of calcium-bound OGB-1 ([Ca2+]OGB) recorded from a compartment with a simulated synapse on the distal apical tuft (as indicated in A) in response to a single burst stimulation in control and simulated 20 nM TTX or 50 µM AP5. (C) Summary of the simulations and a comparison with the experiments in Figures 5, 7. The bar graphs show mean ± S.D. (normalized to control; S.D. was used to emphasize the distribution and variability of the drug effects across different imaging locations). For normalized peak amplitude, only the cell with a dSpike initiated presumably the closest to and actively propagating to the recording electrode in our dendritic recordings (Figure 5A) is illustrated for comparison. For normalized peak ∆[Ca2+]OGB and normalized integral of ∆[Ca2+]OGB, data were pooled from all the compartments on the distal apical tuft (the number of compartments = 440), to mimic the experimental condition in which the imaging locations were arbitrarily selected. (D) Representative traces of simulated voltage and instantaneous fractional calcium current through NMDAR channels (ICa, NMDA) and L-Cav channels (ICa, L-Cav). Modeled voltages and currents are from a compartment with a simulated synapse on the distal apical tuft (as indicated in A) in response to a single burst stimulation in control and simulated 20 nM TTX or 50 µM AP5. Note the presence of a spikelet (asterisk), which was due to a Na-dSpike initiated in a neighboring dendritic branch and failing to propagate reliably to the recorded branch.
-
Figure 8—source data 1
Source data of Figure 8.
- https://doi.org/10.7554/eLife.06414.029
-
Figure 8—source data 2
Source data of Figure 8—figure supplement 1.
- https://doi.org/10.7554/eLife.06414.030
Figure 8—figure supplement 1
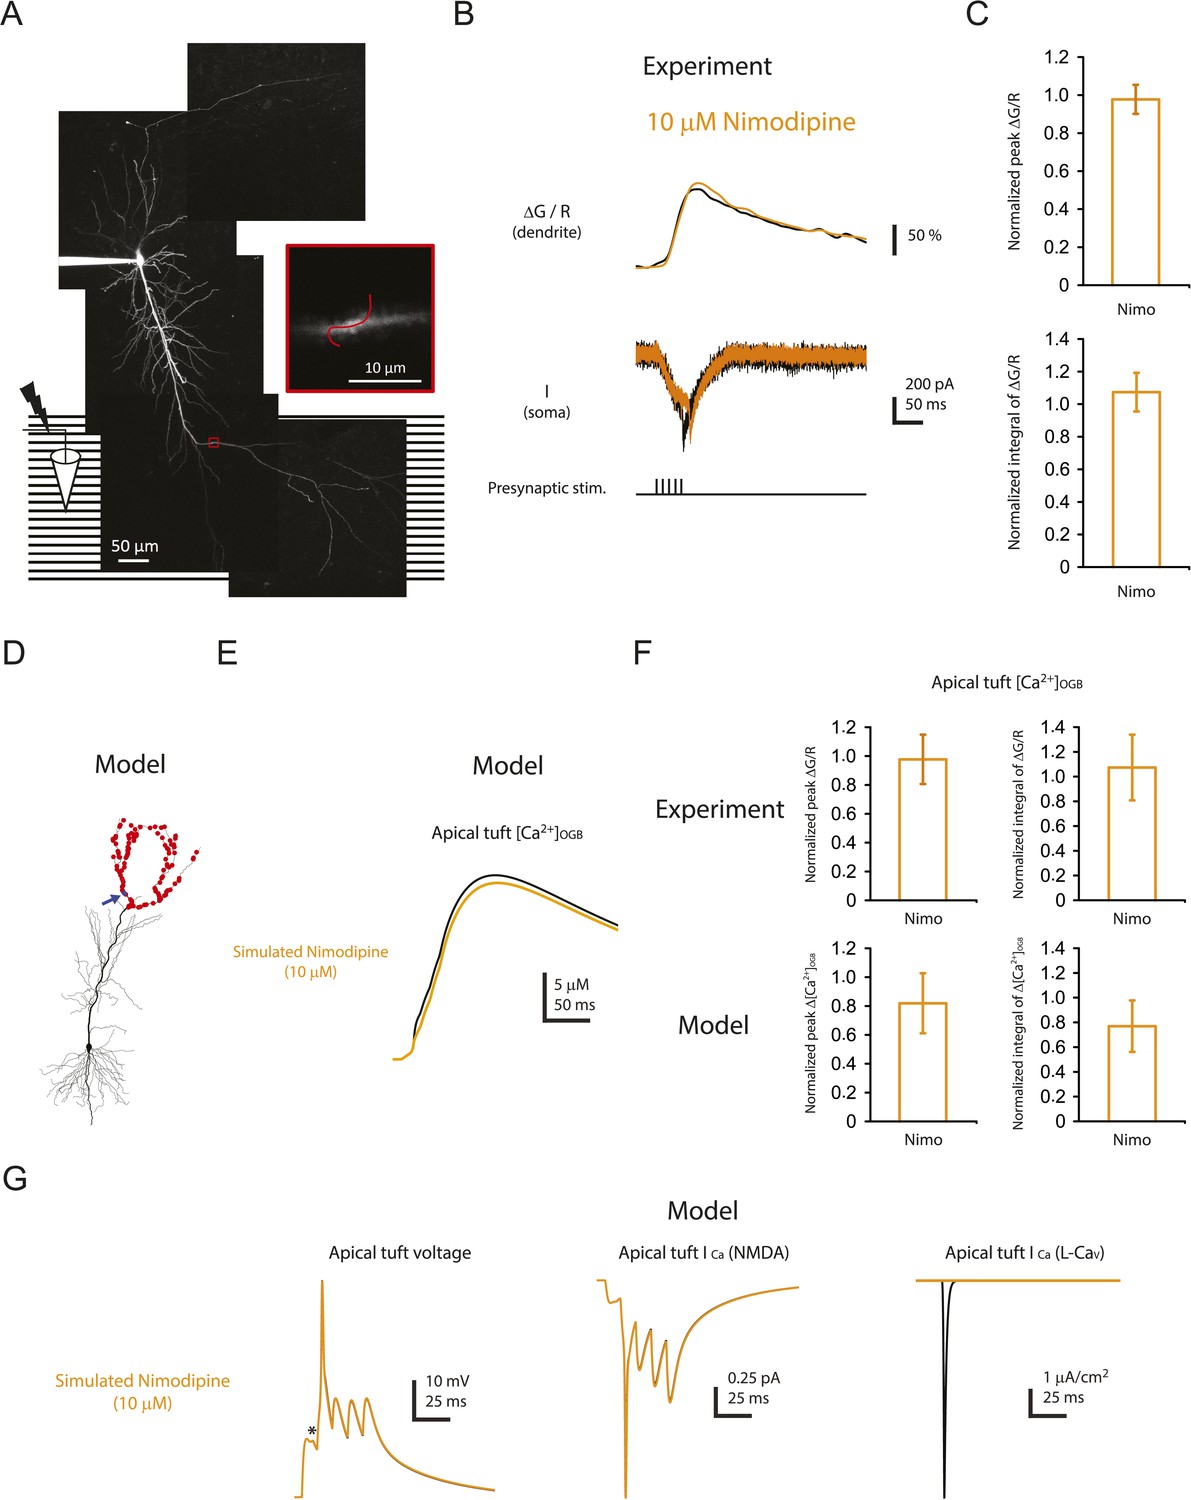
Minimal effect of blocking L-Cav channels on the calcium influx in distal apical tuft dendrites is consistent with the prediction of the model.
(A) Left, experimental configuration showing somatic whole-cell recording with presynaptic stimulation of the PP, with a representative Z-stack image of a neuron (filled with 50 µM AF-594) on which the imaging experiments were performed. The box indicates the field of view used during high-resolution line scan. Right, a single-scan image corresponding to the box in the image on the left. The red line represents a line profile used for line scan. Analysis was restricted to the data from dendritic shafts only. (B) Representative traces of ∆G/R (100 µM OGB-1) from dendritic shaft and current (‘I’) from somatic voltage-clamp recording in response to a single high-frequency burst stimulation in control and 10 µM nimodipine (at least 15 min after drug application). Note the presence of a spikelet both in control and in 10 µM nimodipine. (C) Summary of effects of nimodipine (Nimo, n = 5) on ∆G/R (normalized to control). (D) Morphology of the model neuron. Red dots indicate the locations of simulated synapses. Arrow indicates the imaged compartment with a simulated synapse (blue dot) for the example shown in E and G. (E) Representative traces of simulated concentration of calcium-bound OGB-1 ([Ca2+]OGB) recorded from a compartment with a simulated synapse on the distal apical tuft (as indicated in D) in response to a single burst stimulation in control and simulated 10 µM nimodipine. (F) Summary of the simulations and a comparison with the experiments in A–C. The bar graphs show mean ± S.D. (normalized to control; S.D. was used to emphasize the distribution and variability of the drug effects across different imaging locations). For normalized peak ∆[Ca2+]OGB and normalized integral of ∆[Ca2+]OGB, data were pooled from all the compartments on the distal apical tuft (the number of compartments = 440), to mimic the experimental condition in which the imaging locations were arbitrarily selected. (G) Representative traces of simulated voltage and instantaneous fractional calcium current through NMDAR channels (ICa, NMDA) and L-Cav channels (ICa, L-Cav). Modeled voltages and currents are from a compartment with a simulated synapse on the distal apical tuft (as indicated in D) in response to a single burst stimulation in control and simulated 10 µM nimodipine. Note the presence of a spikelet (asterisk), which was due to a Na-dSpike initiated in a neighboring dendritic branch and failing to propagate reliably to the recorded branch.
Figure 9
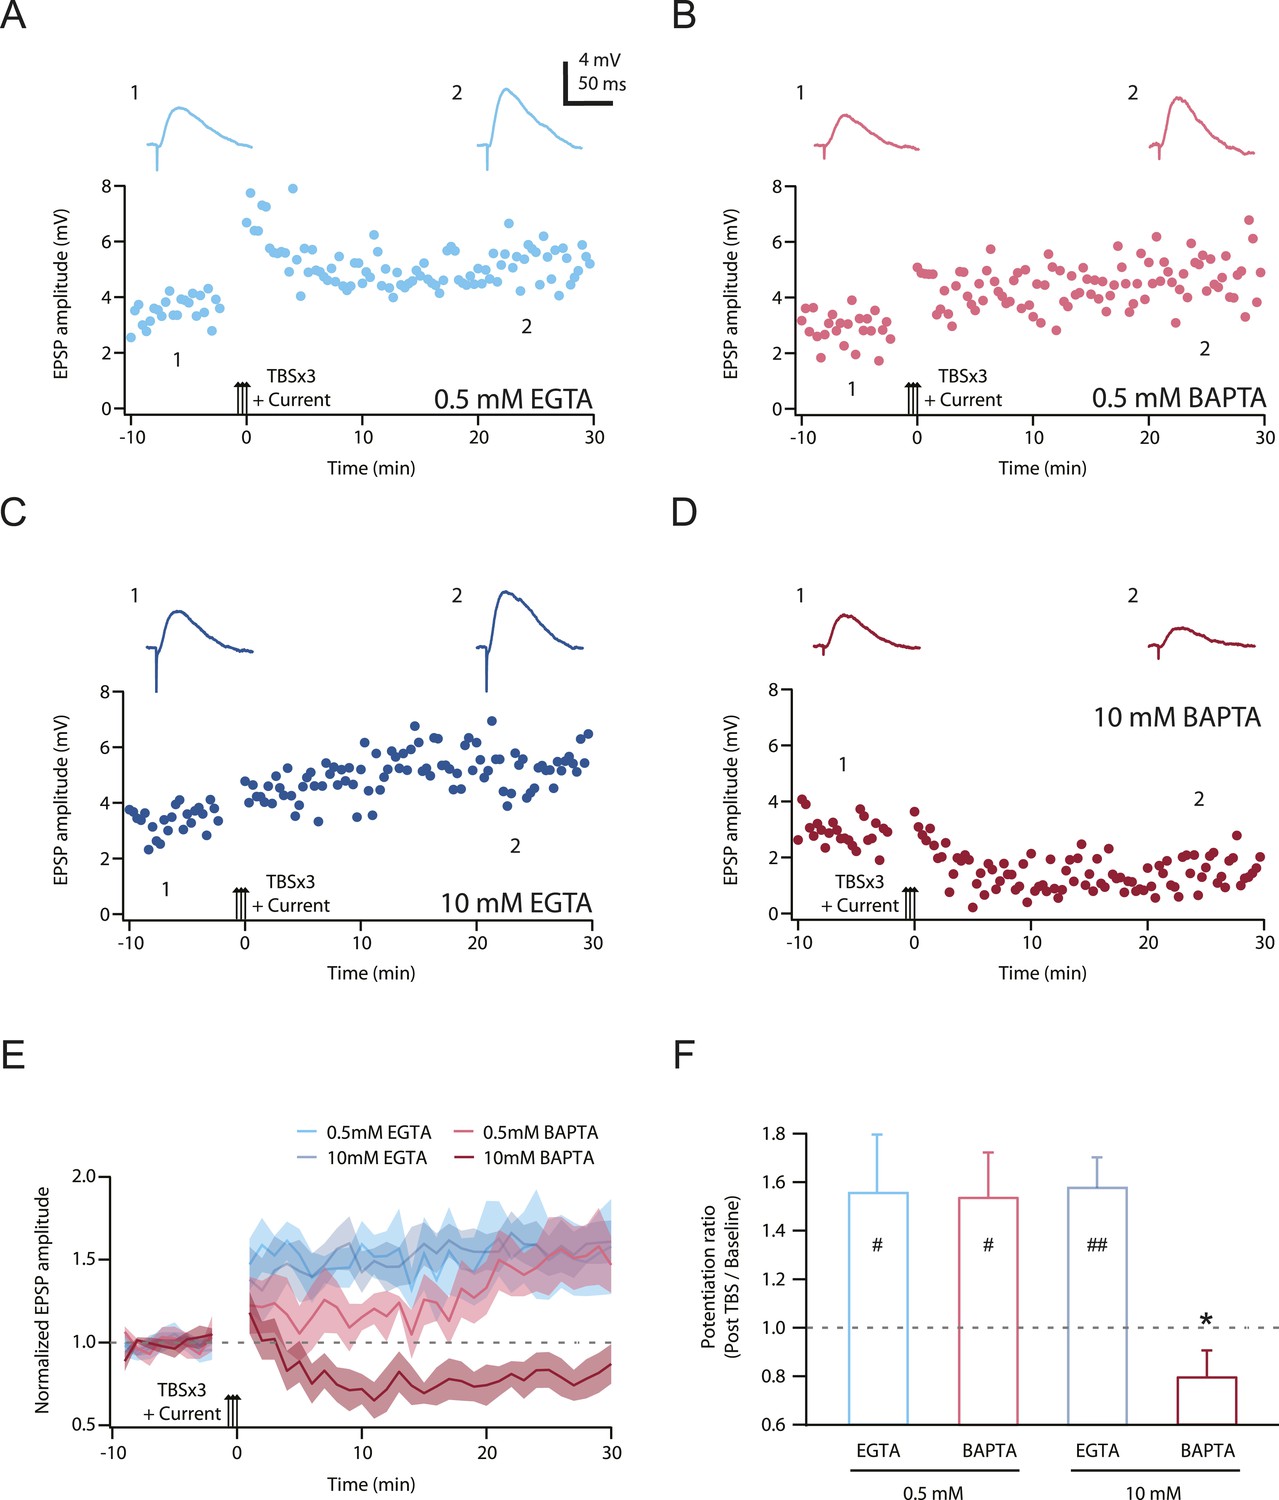
TBS-induced PP → CA1tuft LTP is blocked by intracellular calcium buffering with a high concentration of BAPTA, but not a low concentration of BAPTA or low or high EGTA.
(A–D) Representative time course of EPSP amplitude before and after TBSx3+Current was delivered (arrows) from cells buffered with 0.5 mM EGTA (A), 0.5 mM BAPTA (B), 10 mM EGTA (C), or 10 mM BAPTA (D). CaCl2 was added to maintain basal calcium level (∼50 nM; see ‘Materials and methods’). Calcium buffer was included in the intracellular solution. Top, representative traces (single trials) of EPSP before (1) and 25 min after (2) TBSx3+Current was delivered. The scale bar in A applies to all panels. (E) Summary of the LTP experiments with different calcium buffering. EPSP amplitude is normalized to the average EPSP amplitude before LTP induction. Solid lines and shaded areas represent mean and S.E.M., respectively. (F) Potentiation ratio in different experimental conditions (0.5 mM EGTA, n = 8; 0.5 mM BAPTA, n = 5; 10 mM EGTA, n = 5; 10 mM BAPTA, n = 8). ##p < 0.01, #p < 0.05 for the effect of time on EPSP amplitude by one-way repeated measures ANOVA. *p < 0.05 (compared to 10 mM EGTA) by one-way ANOVA with post hoc means comparison using Tukey's test.
-
Figure 9—source data 1
Source data of Figure 9.
- https://doi.org/10.7554/eLife.06414.033
Figure 10

Proposed model for the critical role of Na-dSpikes in the induction of PP → CA1tuft LTP.
(A) Synaptic membrane potential and calcium currents in response to a high-frequency burst activation of glutamatergic synapses (re-plotted from Figure 8D). (1) AMPA-/NMDA-EPSP, (2) Na-dSpike, (3) ICa through NMDAR channels, (4) ICa through L-Cav channels. Note also the presence of a spikelet (asterisk). (B) Schematic illustration of the events leading to the induction of PP → CA1tuft LTP. Strong activation of PP → CA1tuft synapses results in EPSPs (1) and, on some trials, subsequently leads to initiation of Na-dSpikes (2). The locally generated Na-dSpike mediates the largest ICa through both NMDAR channels (3) and L-Cav channels (4), thus resulting in a high, localized calcium concentration near the mouth of the channels (dark red), which activates a series of biochemical events necessary for the induction of LTP. This intracellular calcium diffuses away, contributing only modestly to the ‘bulk’ calcium concentration throughout the dendritic spine and shaft (pink), which is eventually removed from the cytoplasm by pumps in the plasma membrane and in organelles such as the endoplasmic reticulum. In contrast, the smaller, longer-lasting ICa through NMDAR channels generated during the slow synaptic depolarization produces a lower localized calcium concentration near the channel pore, but contributes more to the bulk calcium concentration.
Author response image 1

Dye saturation does not occur under our experimental conditions. Top. Summary of peak ∆G/R from dendritic shaft in response to different stimulation patterns. Only the experiments in which TBS of the PP paired with somatic current injection to evoke bAPs are shown here to demonstrate that the largest peak ΔG/R achievable by physiological activities in our settings was above the largest ΔG/R in response to single high‐frequency burst stimulation in the dataset (Figure 7 and Figure 8–figure supplement 1). A total of 15 different stimulation conditions (i.e., combinations of different calcium concentrations in the ACSF, synaptic stimuli and somatic current injections) were tested. Bottom. Representative traces of ∆G/R from dendritic shaft and voltage from somatic current-clamp recording in response to TBS paired or not paired with somatic current injection. Also note that the dye was not saturated by a single burst in general because ΔG/R was able to facilitate upon delivery of additional bursts in TBS with the ratio ΔG/R(Max):ΔG/R(1st burst) = 1.52 ± 0.31 (n = 4 cells, in 2 mM Ca2+).
Author response image 2

Relationship between dendritic calcium responses in control condition and normalized drug effects on the responses. Summary of effects of different pharmacological agents on ∆G/R (normalized to control) from dendritic shaft in response to high‐frequency burst stimulation plotted as a function of the ∆G/R in control condition. The lack of correlation between the magnitude of the drug effect and the initial response in control suggests that dye saturation does not affect our conclusions with respect to the drug effects.
Download links
A two-part list of links to download the article, or parts of the article, in various formats.
Downloads (link to download the article as PDF)
Open citations (links to open the citations from this article in various online reference manager services)
Cite this article (links to download the citations from this article in formats compatible with various reference manager tools)
Dendritic sodium spikes are required for long-term potentiation at distal synapses on hippocampal pyramidal neurons
eLife 4:e06414.
https://doi.org/10.7554/eLife.06414


