Functional subregions of the human entorhinal cortex
- Otto-von-Guericke University Magdeburg, Germany
- German Center for Neurodegenerative Diseases, Germany
- University of California at Davis, United States
- University College London, United Kingdom
- Center for Behavioral and Brain Sciences, Germany
Figures
Figure 1 with 1 supplement
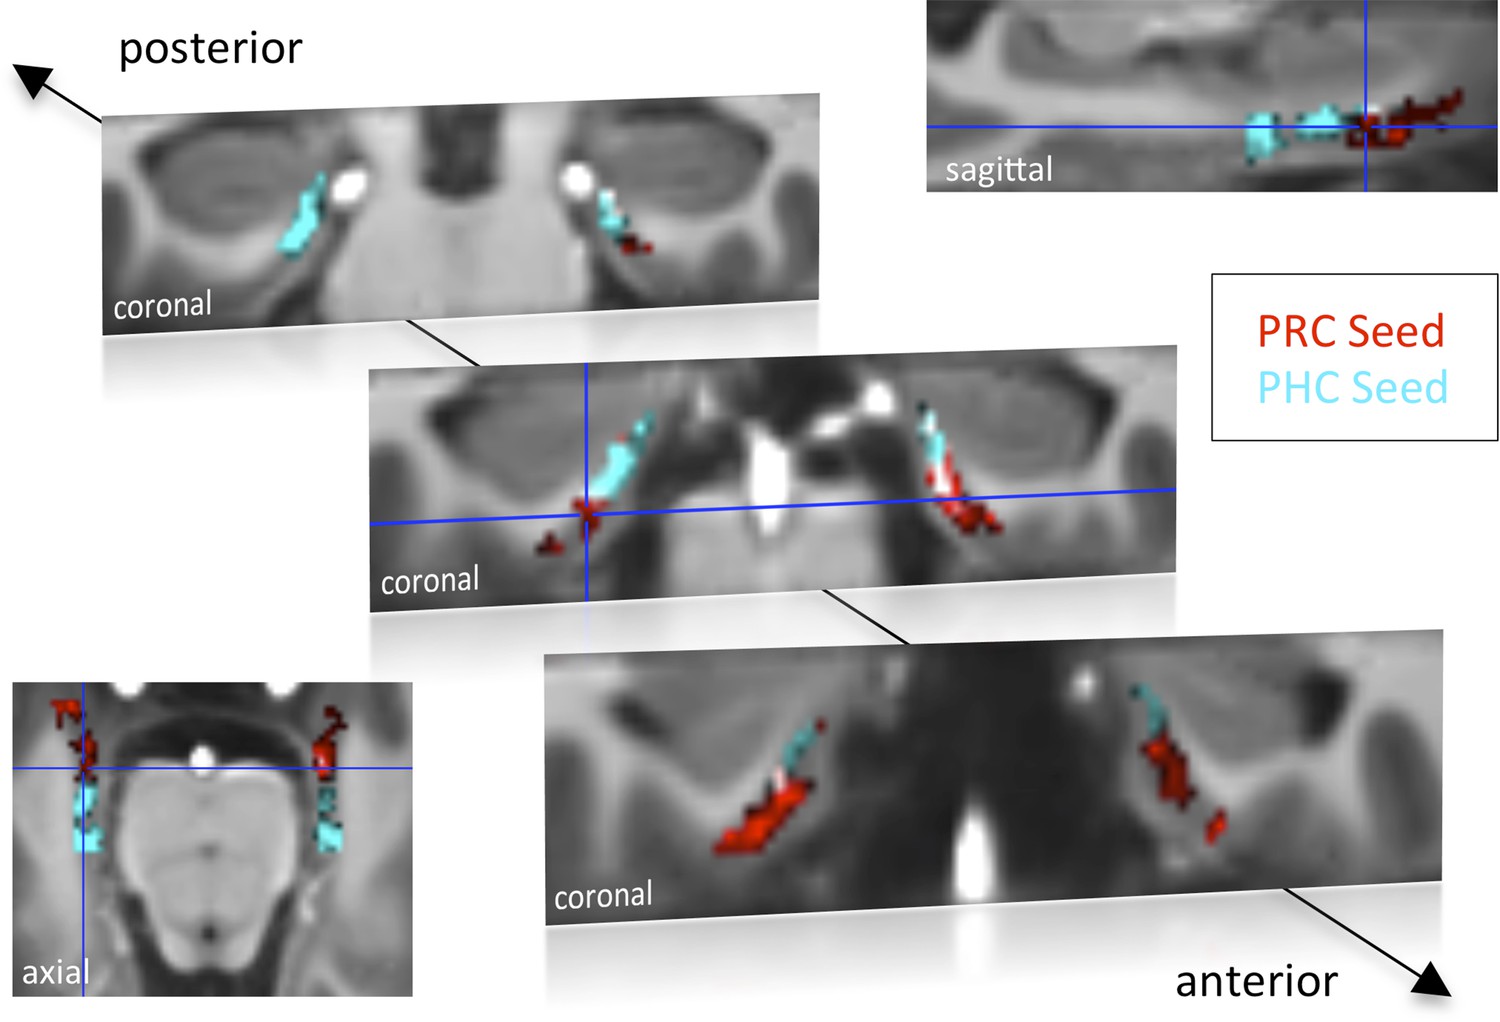
Functional connectivity profiles of parahippocampal cortex (PHC) and perirhinal cortex (PRC) seeds with the EC in Experiment 1.
Group results for seed-to-voxel connectivity of bilateral PRC and PHC seeds with the EC shown for Experiment 1 (one-sample t-test; Z > 2.3, pcluster < 0.05, NExp. 1 = 15). Bright regions denote overlapping connectivity with PRC/PHC. Single-subject beta maps were normalized on the group-specific T1-template by ROI-based alignment with ANTS and masked with a manually defined EC ROI. The T1-template has the same resolution (and alignment) as the high-resolution functional EPI volumes (0.8 mm × 0.8 mm × 0.8 mm). See also Figure 1—figure supplement 1 for results of Exp. 2. ROI: region of interest.
Figure 1—figure supplement 1
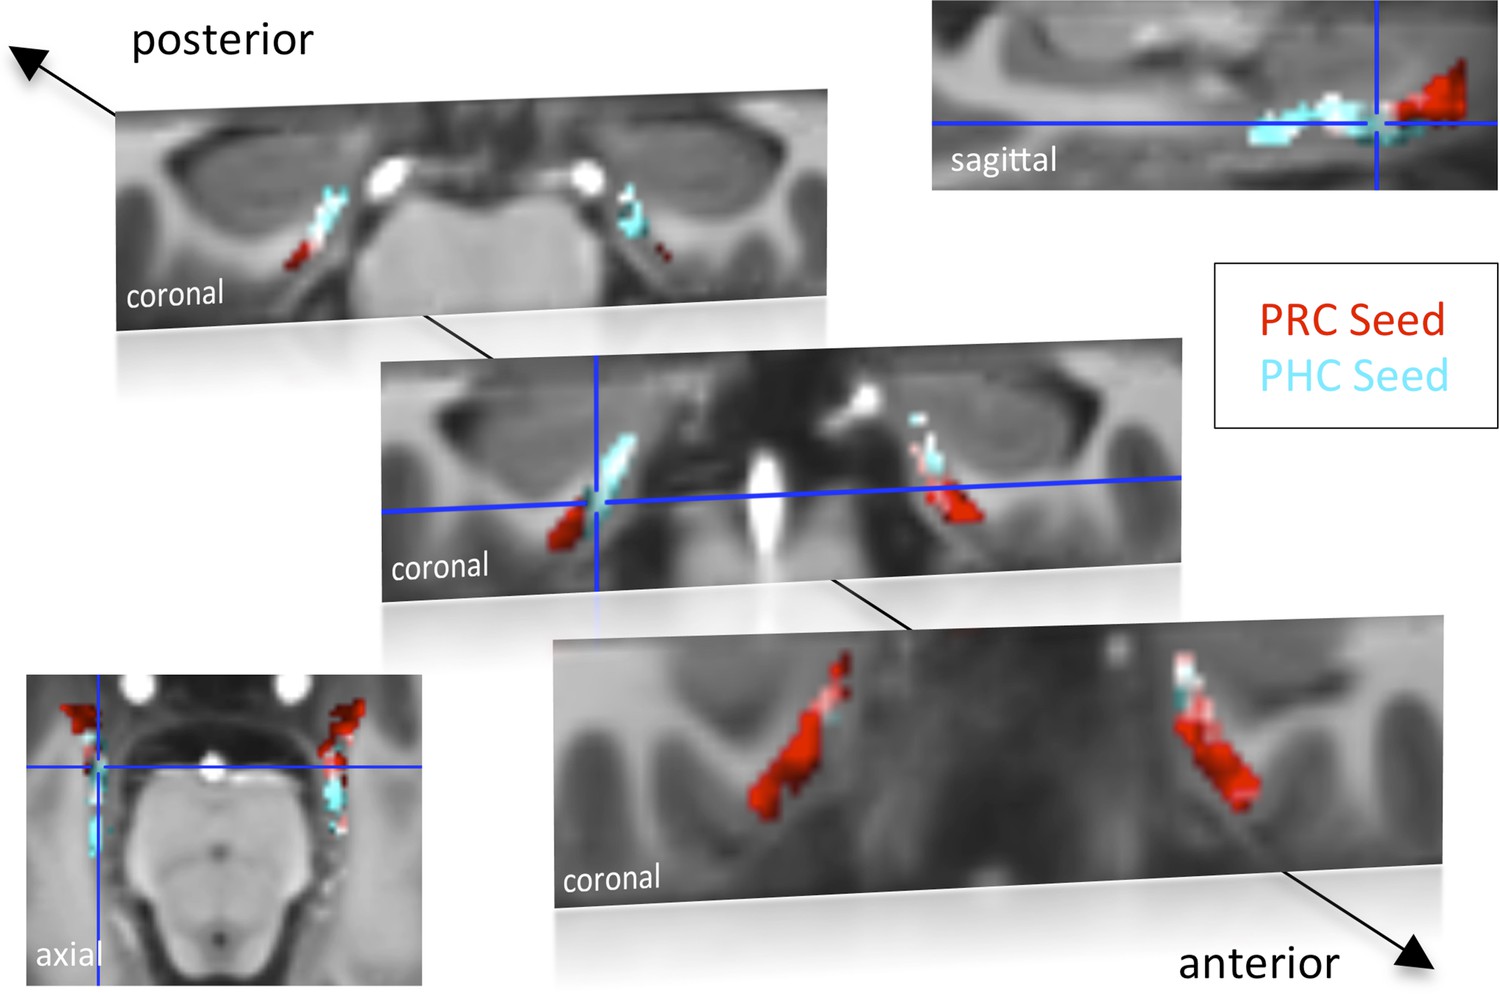
Functional connectivity profiles of PHC and PRC seeds with the EC for Experiment 2.
https://doi.org/10.7554/eLife.06426.004
Figure 2 with 1 supplement

Differential connectivity topography of PRC vs PHC seeds with the EC for Experiment 1.
(A) To assess differential connectivity of PRC vs PHC with the EC, voxelwise paired-sample t-tests were performed on the normalized single-subject beta maps (resulting from seed-to-voxel connectivity analyses). Significant clusters for Exp. 1 are shown for two coronal sample slices (Z > 2.3. pcluster < 0.05, NExp. 1 = 15) at the level of the anterior (1) and posterior (2) hippocampal head. (B) To visualize the 3-dimensional geometry of connectivity, the connectivity preference with PRC vs PHC of each EC voxel was plotted along the x-, y-, and z-axis (red: TPRC > PHC > 0, blue: TPHC > PRC > 0). Axes terminology is relative to the long-axis of the hippocampus. (C) Classification of PRC vs PHC connectivity preference was tested across subjects based on the x-y-z coordinate of an EC voxel. Multivariate classification (support vector machine; leave-one-subject-out cross-validation) was significant across both data sets (p < 0.001; accuracies: Exp. 1: left: 62%, right: 60%, Exp. 2: left: 67%, right: 57%), which confirms a spatial dissociation of entorhinal connectivity with PRC vs PHC. Predicted clusters are color-coded in red vs. blue, bright regions denote high consistency of the classifier (accuracy for each voxel across subjects). Results are shown for Exp. 1. See also Figure 2—figure supplement 1 for 3D plots of Exp. 2 and for unilateral seeds of Exp. 1.
Figure 2—figure supplement 1
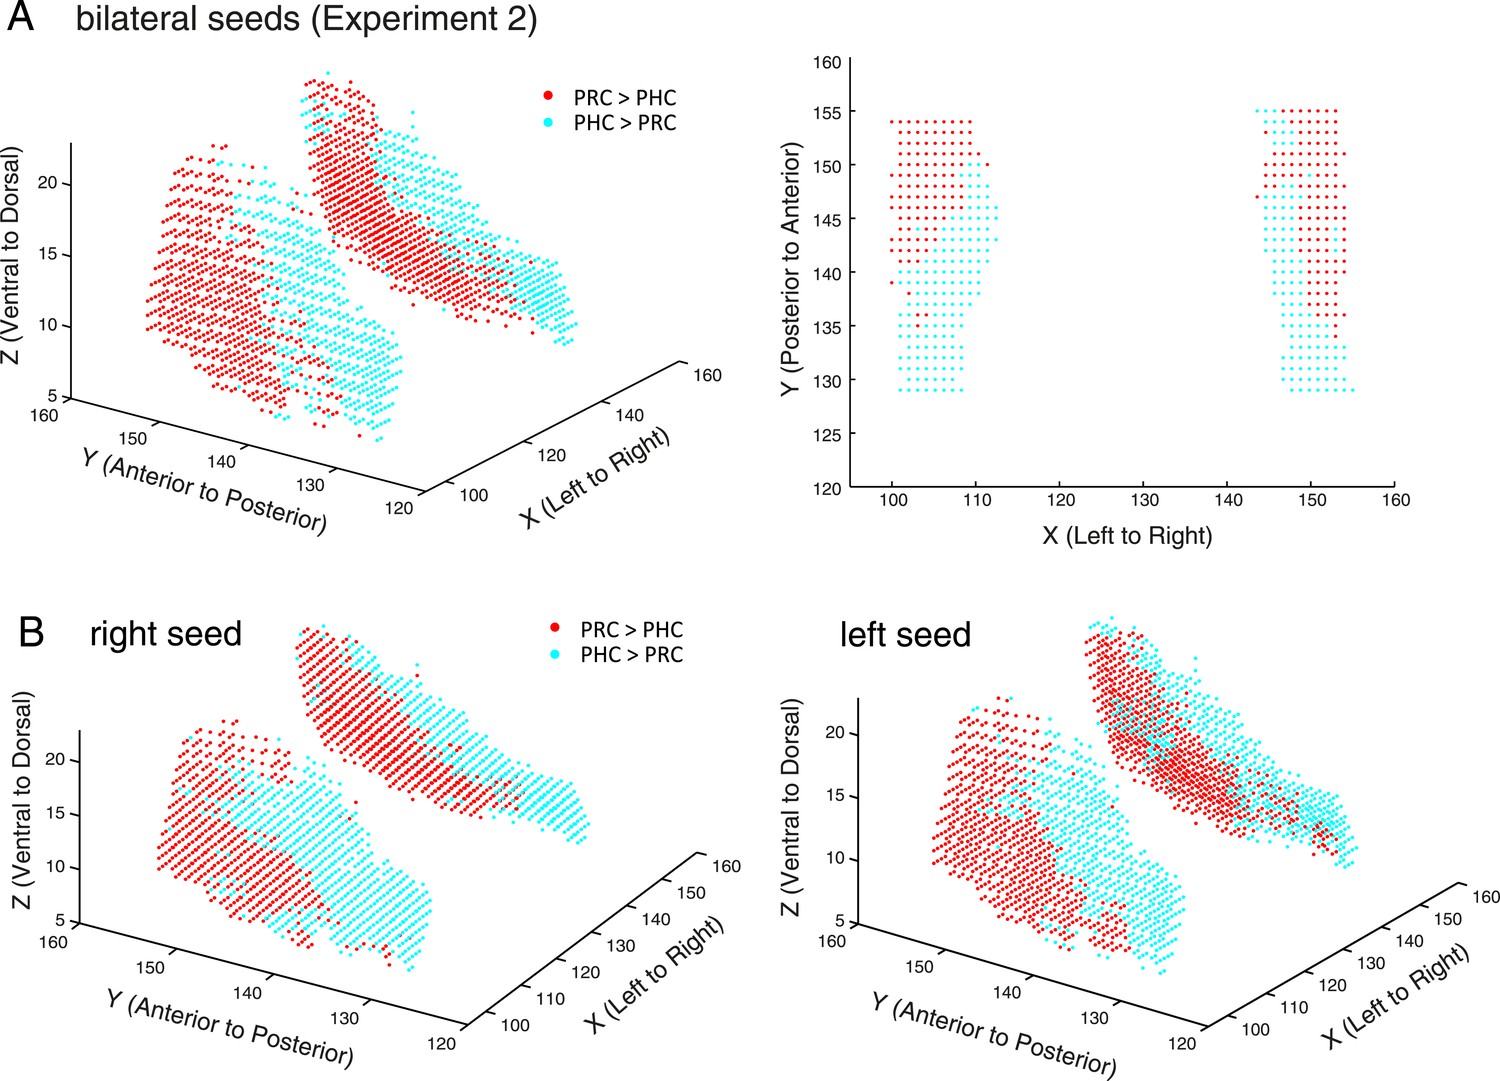
Differential connectivity topography of bilateral (A) and unilateral (B) PRC vs PHC seeds with the EC for Experiment 2 (A) and Experiment 1 (B).
https://doi.org/10.7554/eLife.06426.007
Figure 3
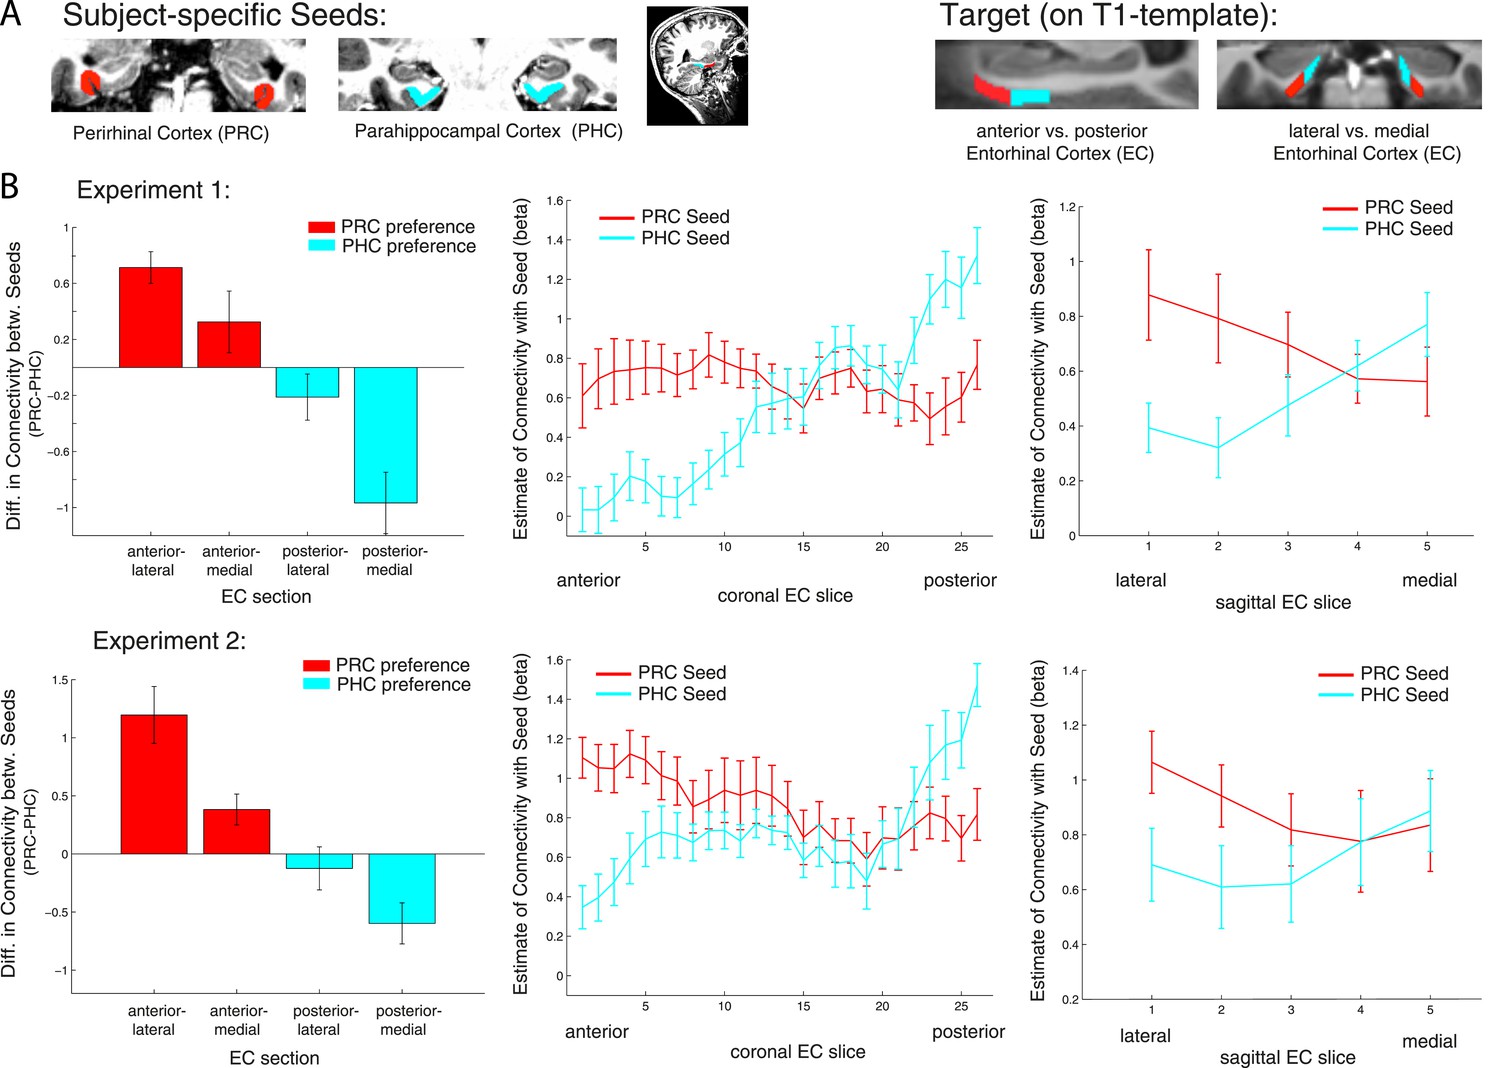
Anterior-posterior and lateral-medial gradients of entorhinal connectivity with PRC vs PHC seeds.
(A) To test for an anterior-posterior or lateral-medial dissociation of EC connectivity with PRC vs PHC seeds (upper panel, left), we divided the EC template mask into four equal portions (upper panel, right) and extracted mean parameter estimates (betas) from each subsection. (B) Repeated-measures ANOVAs revealed significant seed (PRC vs PHC) × anterior-posterior EC section and seed × lateral-medial EC section interactions (p < 0.001 for both data sets; NExp1 = 15, NExp2 = 14). Slice-by-slice plots of connectivity estimates along the longitudinal and transverse EC axis confirmed an anterior-to-posterior and lateral-to-medial dissociation with decreasing PRC-connectivity and increasing PHC-connectivity. As the number of sagittal EC slices differed from anterior to posterior, we divided each coronal EC slice into 5 equal portions (with 1 being most lateral and 5 most medial EC) and calculated mean betas for each portion.
Figure 4 with 1 supplement
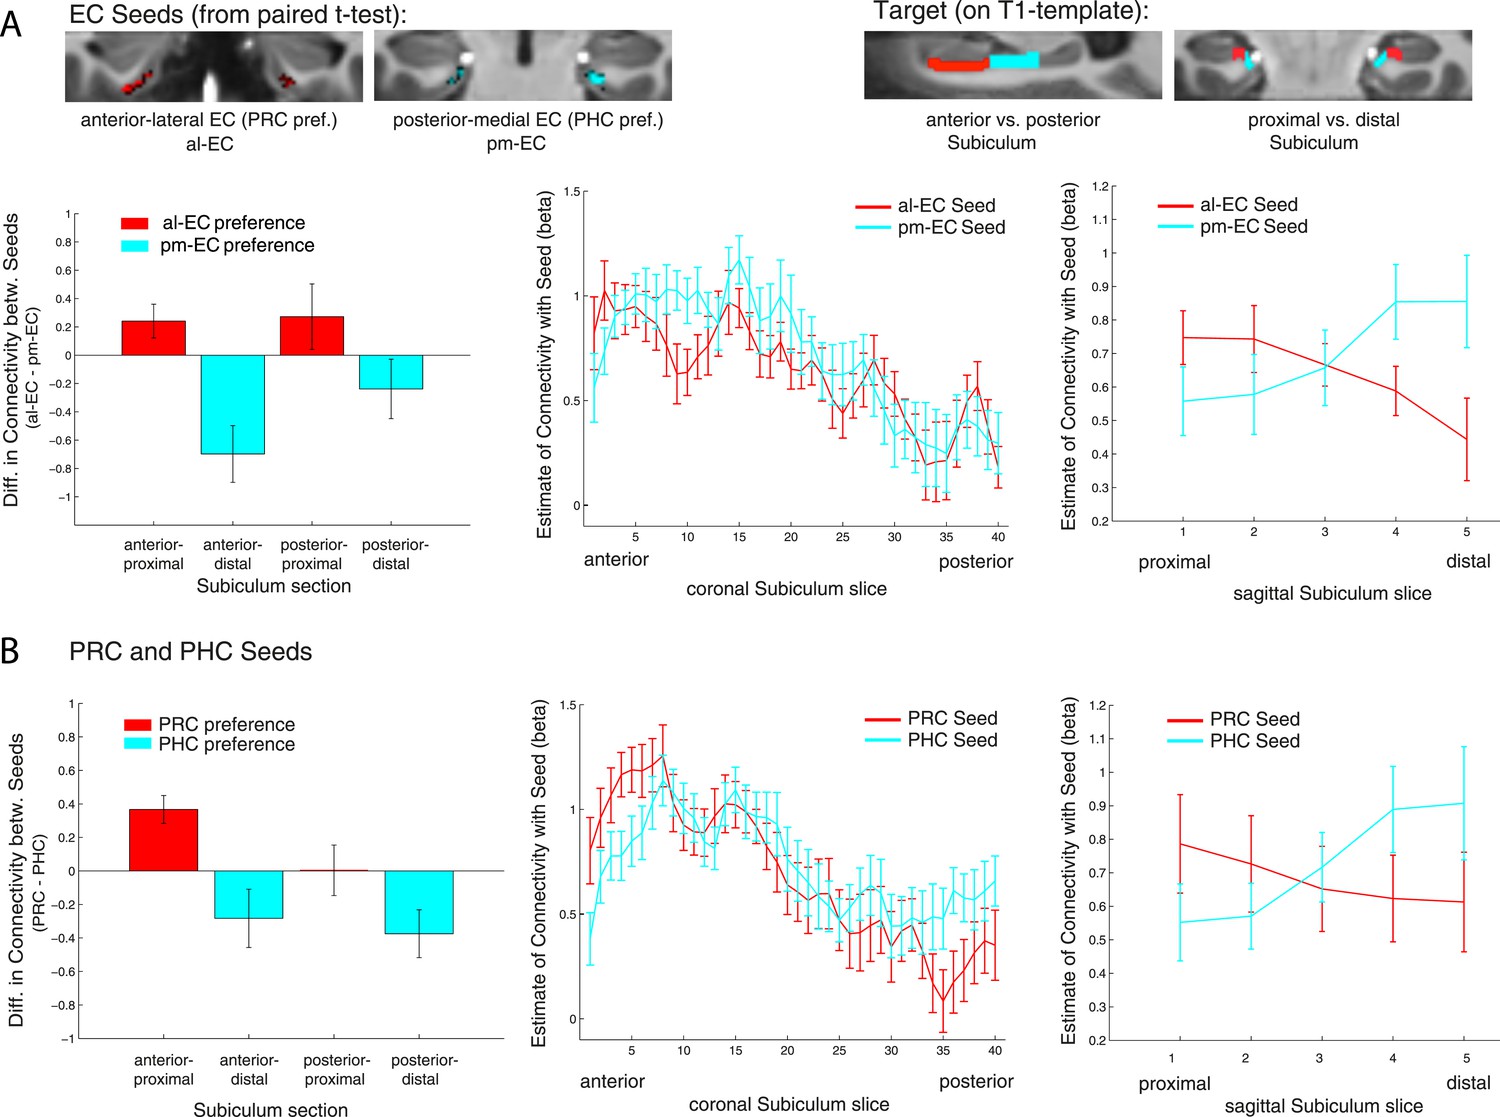
Functional connectivity gradients in the subiculum related to EC subregions and PRC/PHC seeds.
(A) To test for differential connectivity of EC functional subdivisions with the subiculum, anterior-lateral EC (al-EC) and posterior-medial EC (pm-EC) regions that exhibited preferential connectivity with PRC vs PHC, respectively (see paired t-tests in Figure 2A) were used as seed regions. The subiculum ROI was equally divided into four portions along the longitudinal (anterior vs posterior) and transverse (proximal vs distal) axis and mean betas of functional connectivity with EC seeds extracted for each subsection. Repeated-measures ANOVAs revealed a significant seed (al-EC vs pm-EC) × proximal-distal subiculum interaction in both datasets (p < 0.001; NExp1 = 15, NExp2 = 14; results shown for Exp. 1). Slice-by-slice plots of connectivity estimates demonstrated decreasing al-EC-connectivity and increasing pm-EC connectivity from proximal to distal subiculum but no anterior-posterior dissociation. (B) Similarly, connectivity for PRC vs PHC seeds with the subiculum along the longitudinal and transverse axis was evaluated. Seed (PRC vs PHC) × proximal-distal subiculum section interactions were significant across both datasets (p < 0.01) with preferential connectivity of PRC with proximal and PHC with distal subiculum, respectively. Slice-by-slice plots of connectivity estimates along the hippocampal long axis revealed stronger PRC connectivity with the most anterior and stronger PHC connectivity with the most posterior subiculum (= 8 slices), respectively (Exp. 1). See also Figure 4—figure supplement 1 for data of Exp. 2.
Figure 4—figure supplement 1
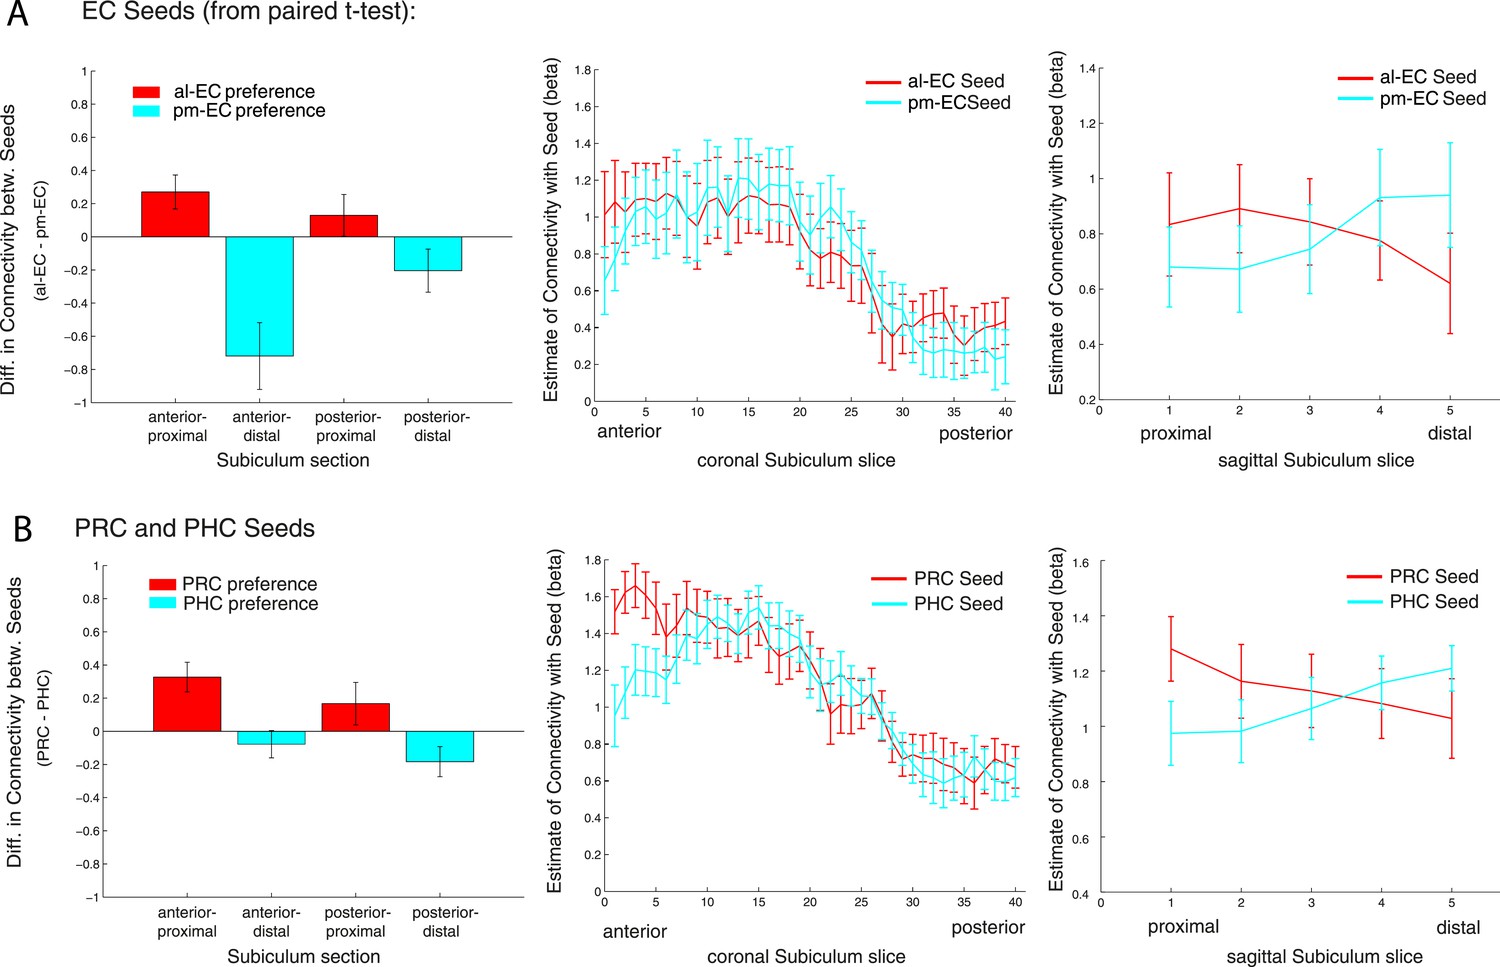
Functional connectivity gradients in the subiculum related to EC subregions (A) and PRC/PHC seeds (B) for Experiment 2.
https://doi.org/10.7554/eLife.06426.010
Figure 5
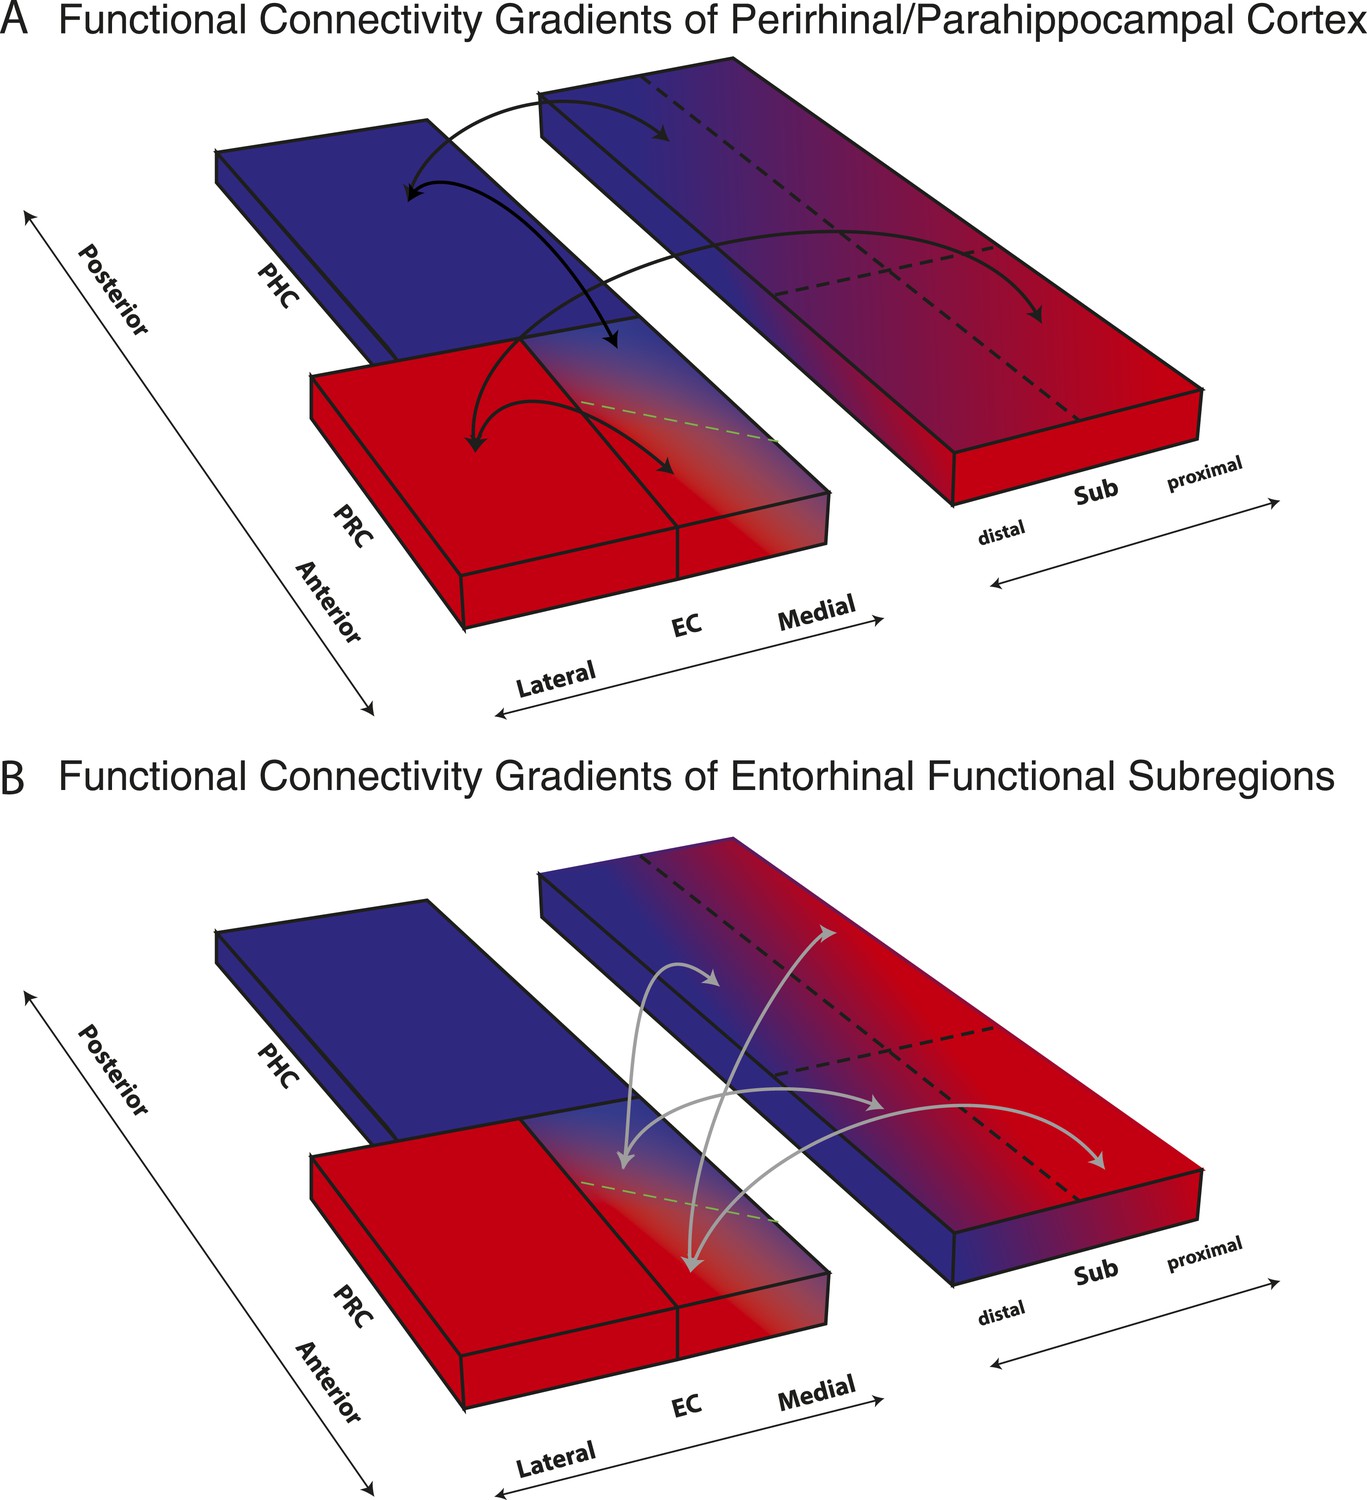
Schematic summary of functional connectivity gradients in the subiculum related to PRC/PHC seeds and EC subdivisions.
(A) Functional connectivity analyses revealed preferential connectivity of PRC (red) with the anterior-lateral EC and PHC (blue) with the posterior-medial EC. Regarding the subiculum, PRC showed strongest connectivity with most anterior and proximal parts, whereas PHC showed strongest connectivity with most posterior and distal parts of the subiculum. (B) Anterior-lateral (red) and posterior-medial (blue) EC exhibited a similar dissociation in connectivity with the subiculum along its transverse (proximal-distal) axis but there was no trend for a dissociation of entorhinal connectivity along the longitudinal axis of the subiculum.
Author response image 1
Videos
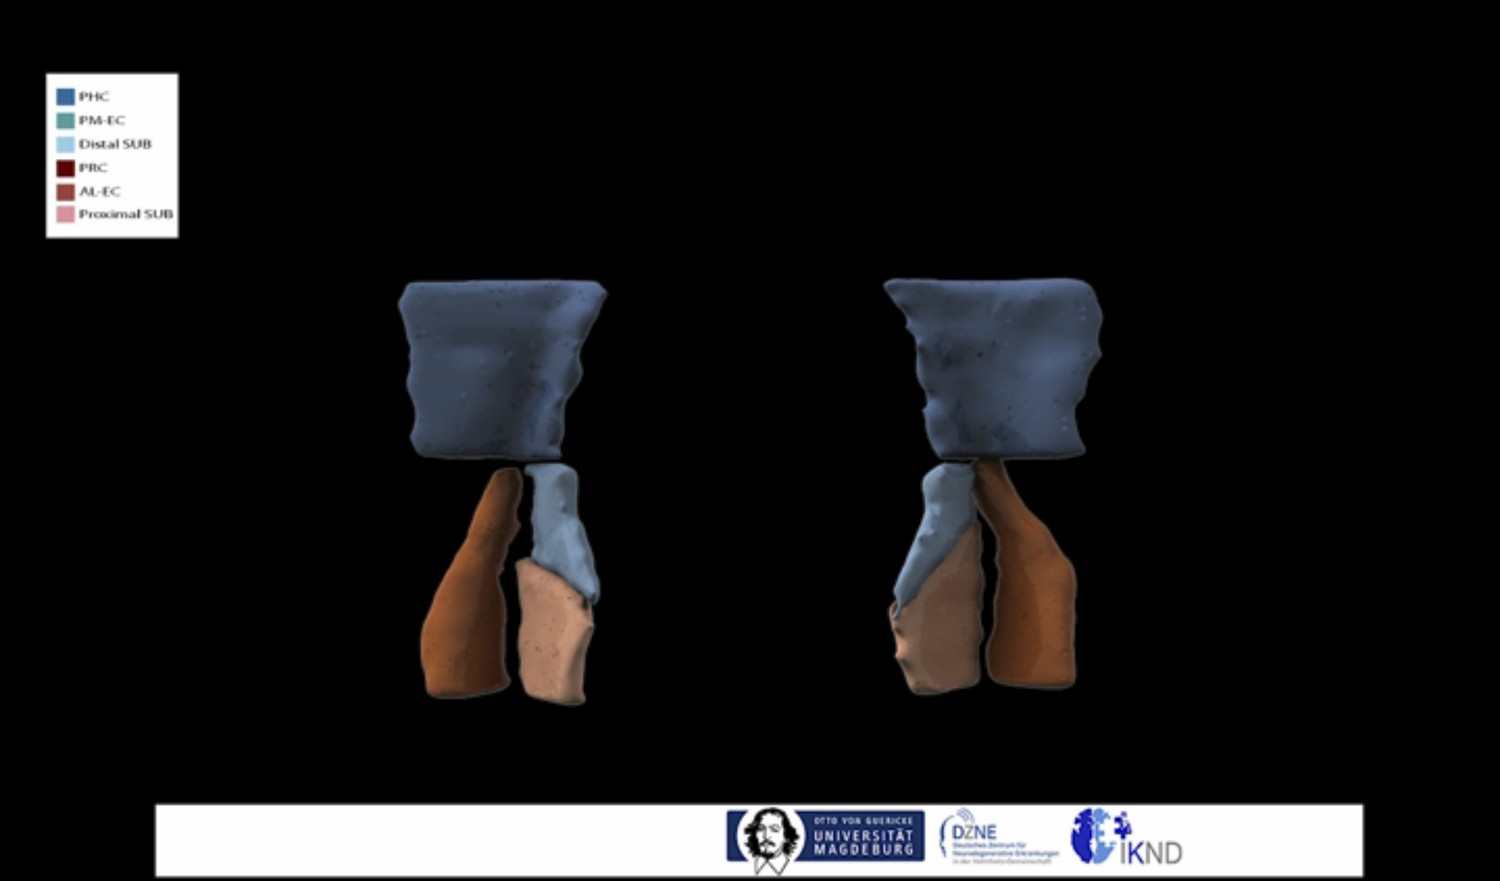
Video 1
3D animation of entorhinal, subicular and parahippocampal subregions.
https://doi.org/10.7554/eLife.06426.012Tables
Table 1
Univariate group-results for seed-to-voxel connectivity of PRC and PHC seeds with the EC
| Cluster | Cluster | Cluster | Peak | Peak coordinate (template) | Side | |||
|---|---|---|---|---|---|---|---|---|
| PFWE-corr | PFDR-corr | Size | Z-score | x | y | z | ||
| Experiment 1 | ||||||||
| PRC seed | <0.001 | <0.001 | 517 | 5.05 | 153 | 149 | 8 | R |
| <0.001 | <0.001 | 273 | 4.82 | 108 | 146 | 12 | L | |
| PHC seed | <0.001 | <0.001 | 380 | 5.29 | 150 | 129 | 9 | R |
| <0.001 | <0.001 | 510 | 5.05 | 106 | 138 | 12 | L | |
| PRC > PHC | 0.038 | 0.022 | 42 | 4.31 | 151 | 150 | 8 | R |
| 0.001 | 0.001 | 91 | 4.04 | 101 | 146 | 9 | L | |
| PHC > PRC | 0.008 | 0.005 | 61 | 4.15 | 150 | 131 | 10 | R |
| 0.001 | 0.002 | 87 | 3.53 | 108 | 136 | 11 | L | |
| Experiment 2 | ||||||||
| PRC seed | <0.001 | <0.001 | 777 | 4.82 | 109 | 152 | 20 | L |
| <0.001 | <0.001 | 849 | 4.73 | 149 | 145 | 10 | R | |
| PHC seed | <0.001 | <0.001 | 669 | 5.31 | 147 | 137 | 13 | R |
| <0.001 | <0.001 | 637 | 4.91 | 107 | 139 | 14 | L | |
| PRC > PHC | <0.001 | <0.001 | 167 | 4.70 | 105 | 153 | 15 | L |
| PHC > PRC | 0.022 | 0.024 | 66 | 4.09 | 153 | 130 | 9 | R |
| 0.047 | 0.026 | 53 | 3.74 | 108 | 136 | 18 | L | |
-
Entorhinal subregions showing significant functional connectivity (one-sample t-test) or differential connectivity (paired t-test) with bilateral PRC or PHC seeds (Z > 2.3, pcluster <0.05, NExp. 1 = 15, NExp. 2 = 14). Single-subject beta maps were normalized on the group-specific T1-template and masked with a manually defined EC ROI. The EC covered 26 coronal slices on the template (y = 154: most anterior slice, y = 129: most posterior slice), with coronal slices being oriented orthogonal to the hippocampal long-axis. See also Figure 1 and Figure 1—figure supplement 1.
Additional files
-
Source code 1
Al-EC and pm-EC masks in template space and the corresponding high-resolution T1-weighted group template (0.6 mm isotropic resolution, whole brain, AC-PC aligned). Masks are predicted clusters derived by multivariate classification of PRC and PHC connectivity preference across both data sets.
- https://doi.org/10.7554/eLife.06426.013
-
Source code 2
Al-EC and pm-EC mask in MNI space and the normalized T1-weighted group template (2 mm isotropic resolution).
- https://doi.org/10.7554/eLife.06426.014
Download links
A two-part list of links to download the article, or parts of the article, in various formats.
Downloads (link to download the article as PDF)
Open citations (links to open the citations from this article in various online reference manager services)
Cite this article (links to download the citations from this article in formats compatible with various reference manager tools)
Functional subregions of the human entorhinal cortex
eLife 4:e06426.
https://doi.org/10.7554/eLife.06426


