Tarantula toxins use common surfaces for interacting with Kv and ASIC ion channels
- National Institutes of Health, United States
- Gwangju Institute of Science and Technology, Republic of Korea
- University of Missouri, United States
- University of California, Davis, United States
Figures
Figure 1

Structural comparison between tarantula toxins targeting ASIC and Kv channels.
(A) Crystal structure of PcTx1 bound to the ASIC1a channel (left, PDB 4FZ0) and of the Kv1.2-Kv2.1 paddle chimera channel (right, PDB 2R9R) viewed from within the membrane. Voltage-sensor paddles and pore domain of the Kv1.2-Kv2.1 paddle chimera was colored purple and gray, respectively. (B, C) NMR structures of PcTx1 (B, PDB 2KNI) and GxTx-1E (C, PDB 2WH9) oriented by superimposing the toxin backbones. NT denotes N terminus. (D, E) Surface profiles of PcTx1 (D) and GxTx-1E (E) colored using the Hessa-Heijne hydrophobicity scale in kcal mol−1 (Hessa et al., 2005). The orientation of PcTx1 is identical to those shown in B, G and H, whereas the structure of GxTx-1E was rotated 90° about the indicated axis to better illustrate its amphipathic character. (F) Sequence alignment of PcTx1 and GxTx-1E. Conserved residues are highlighted yellow. (G) Structure of PcTx1 bound to helix-5 of ASIC1a (PDB 4FZ0). (H) NMR Structures of PcTx1 and GxTx-1E superimposed based on their backbone folds. Side chains of conserved residues are shown as sticks.
Figure 2
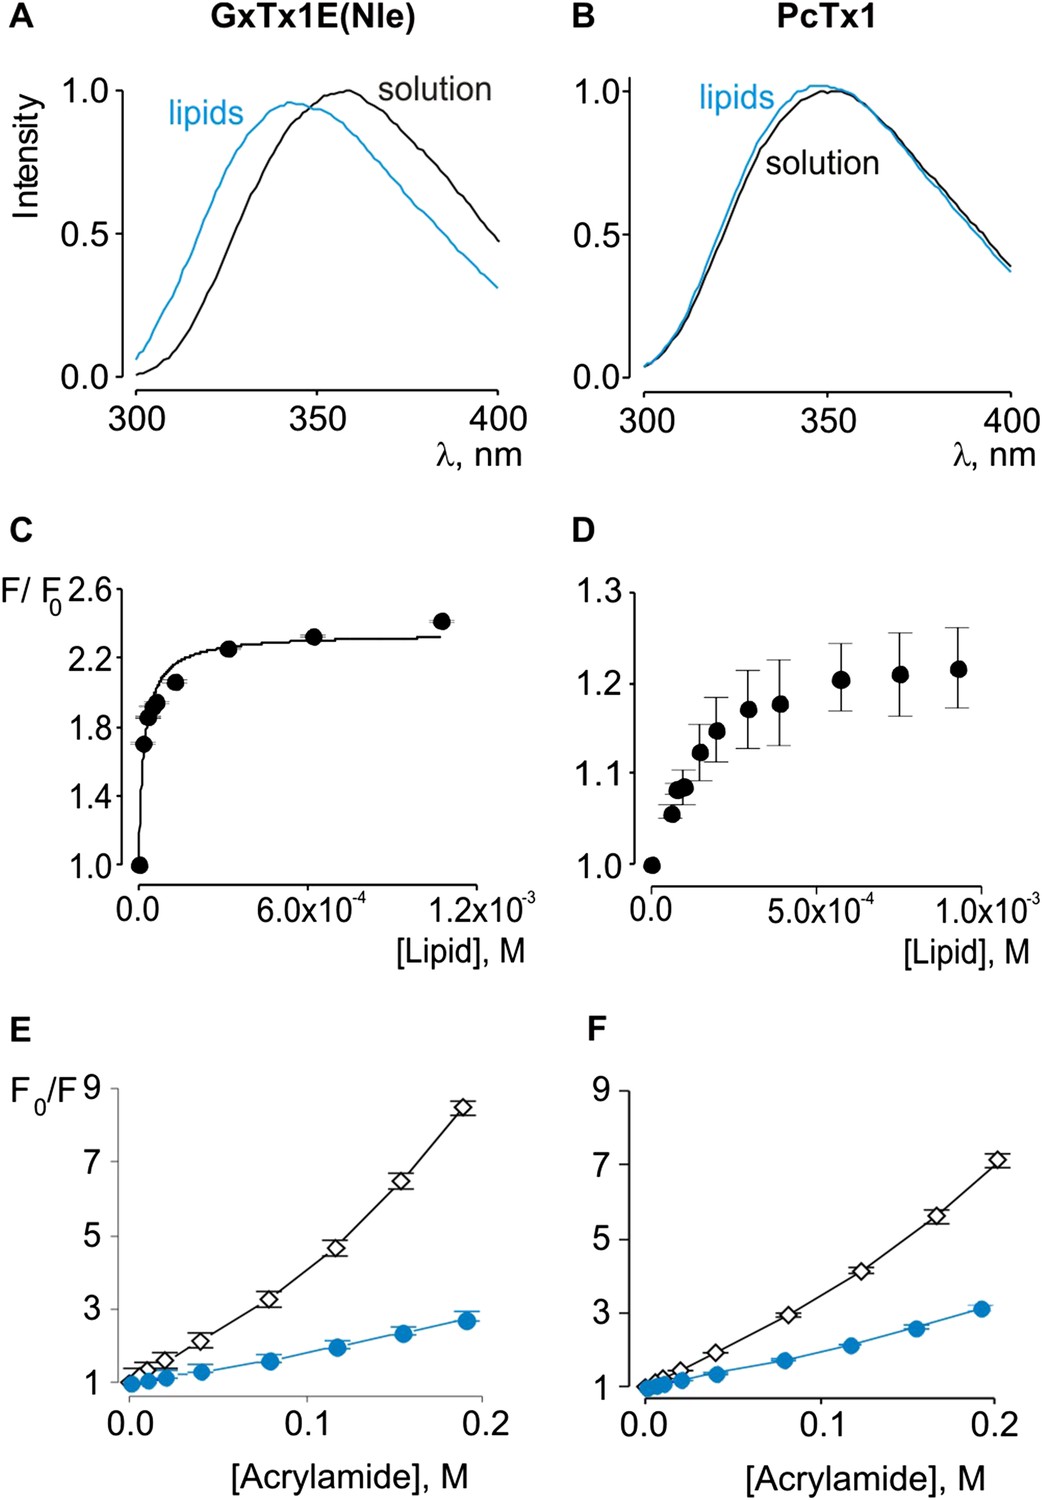
Interaction of GxTx-1E(Nle) and PcTx1 with lipid vesicles detected with intrinsic Trp fluorescence.
(A, B) Fluorescence emission spectra of GxTx-1E(Nle) and PcTx1 in the absence (black) or presence of lipid vesicles composed of a 1:1 mix of POPC:POPG (blue). Lipid concentration was 1.0 mM. (C, D) Fluorescence intensity at 320 nm plotted as a function of available lipid concentration for GxTx-1E(Nle) or PcTx1. Smooth curve corresponds to a partition function with Kx = (4.6 ± 0.8) × 106 and F/F0max = 2.3 ± 0.05 for GxTx-1E(Nle). (E, F) Stern-Volmer plots for acrylamide quenching of GxTx-1E(Nle) and PcTx1 in solution (∼2 µM, black diamonds) and in the presence of lipid vesicles (1.0 mM, blue circles). In all cases data points are the mean ± SEM (n = 3).
Figure 3
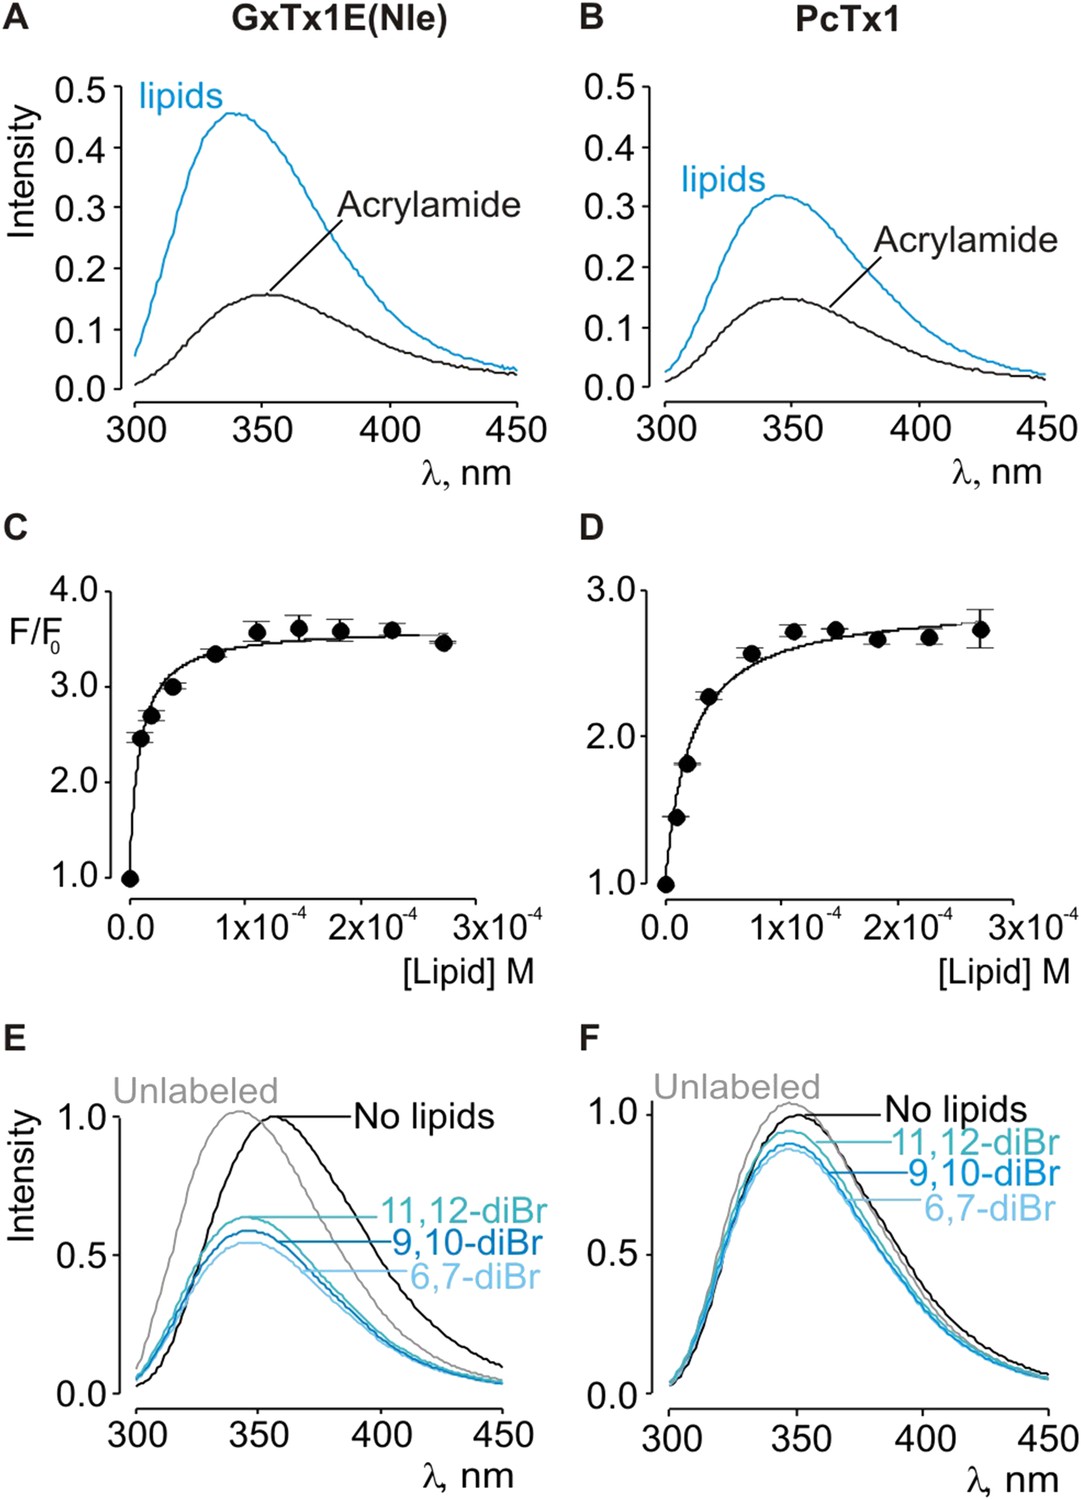
Interaction of GxTx-1E(Nle) and PcTx1 with lipid vesicles using acrylamide dequenching and quenching with brominated lipids.
(A, B) Fluorescence emission spectra of GxTx-1E(Nle) and PcTx1 in the absence (black) or presence of lipid vesicles composed of 1:1 mix of POPC:POPG (blue) in a solution containing 0.2 M acrylamide. Lipid concentration was 1.0 mM. Fluorescence intensity was normalized to that measured for the toxin in control solution in the absence of quencher. (C, D) Maximum fluorescence intensity plotted as a function of available lipid concentration for GxTx-1E(Nle) and PcTx1. Smooth curves correspond to dequenching functions with Kdx = (1.1 ± 0.2) × 107 and F/F0max = 3.5 ± 0.02 for GxTx-1E(Nle) and Kdx = (4.3 ± 0.6) × 106 and F/F0max = 2.7 ± 0.08 for PcTx1 (D). (E, F) Depth-dependent quenching of tryptophan fluorescence by brominated (diBr) phosphatidylcholines labeled at different positions on the acyl chain of POPC. Fluorescence emission spectra of GxTx1E(Nle) and PcTx1 in the absence (black) or presence of vesicles comprised of unlabeled (gray) or brominated lipids (blue) present at a concentration of 1.2 mM. Vesicles comprised of either unlabeled or brominated lipids contained a 1:1 mix of POPC:POPG, and the brominated lipid was POPC. In all cases data points are the mean ± SEM (n = 3).
Figure 4 with 1 supplement
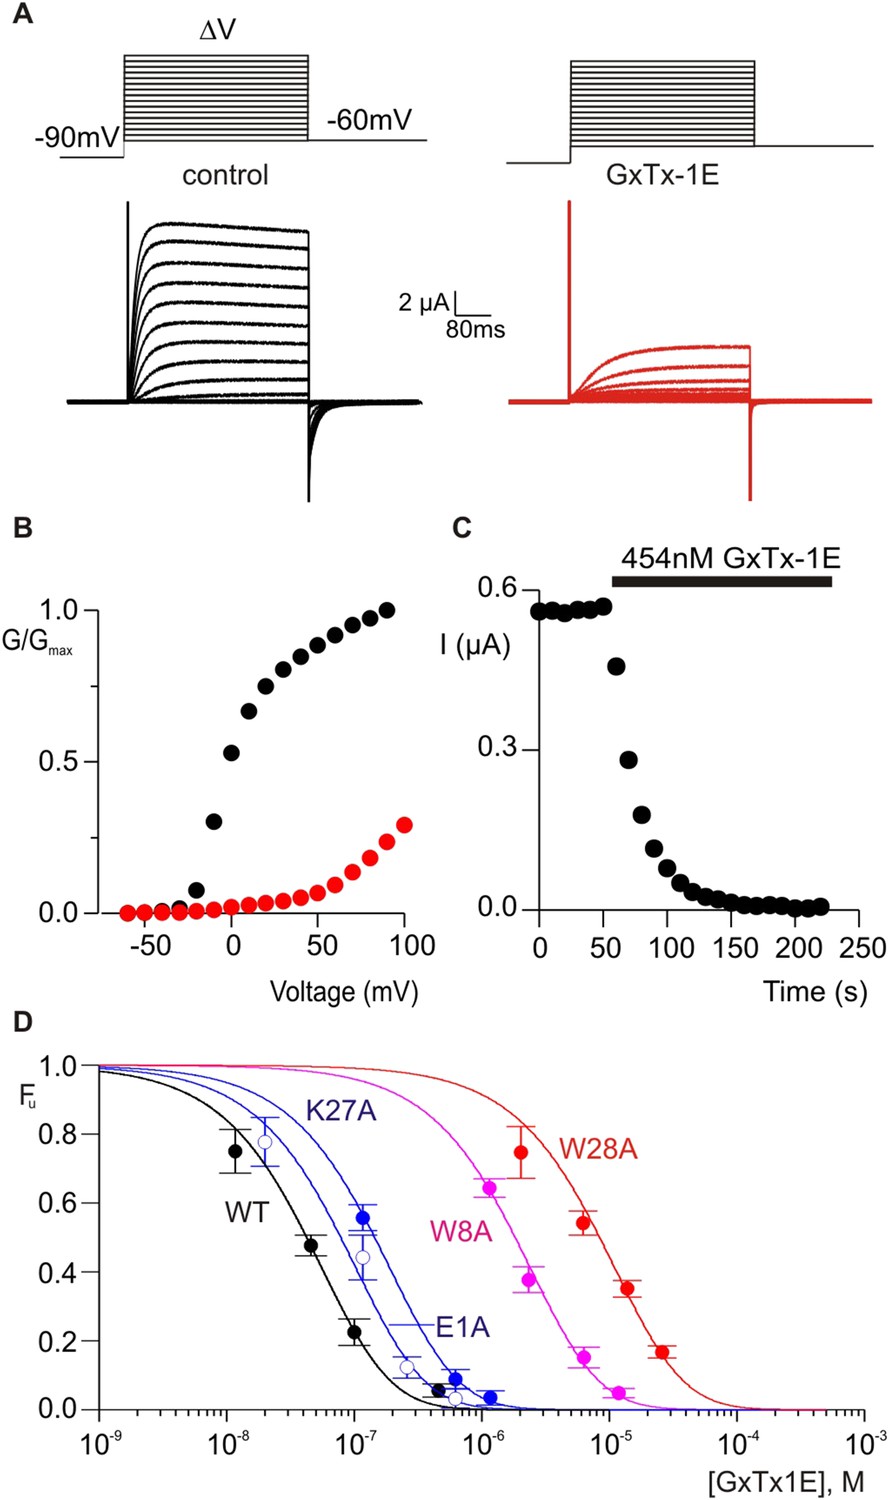
Determination of apparent affinity for mutants of GxTx-1E.
(A) Families of macroscopic ionic currents elicited by test depolarizations before (black) and after (red) addition of 454 nM GxTx-1E(Nle) for an oocyte expressing the Kv2.1 channel. (B) G-V relations obtained from tail current amplitudes before and after addition of toxin. (C) Time course of inhibition of the Kv2.1 channel by 454 nM GxTx-1E(Nle). Steady-state currents were measured at the end of test depolarizations to −10 mV, elicited every 10 s. Holding voltage was −100 mV. (D) Concentration-dependence for inhibition of the Kv2.1 channel by GxTx-1E(Nle) and representative toxin mutants. Fraction unbound (Fu) was measured using steady state current values before and after addition of toxin from time course of toxin inhibition as illustrated in C using weak depolarizations (−20 mV to +10 mV). Data points are mean + SEM for 3 to 13 cells at each concentration. E1A and K10A are examples of mutants that produce weak perturbations in Kd (∆∆G < 1 kcal mol−1), while W8A and W28A are examples of mutants that have larger perturbations (∆∆G > 2 kcal mol−1). See Table 1 for all Kd and ∆∆G values.
Figure 4—figure supplement 1
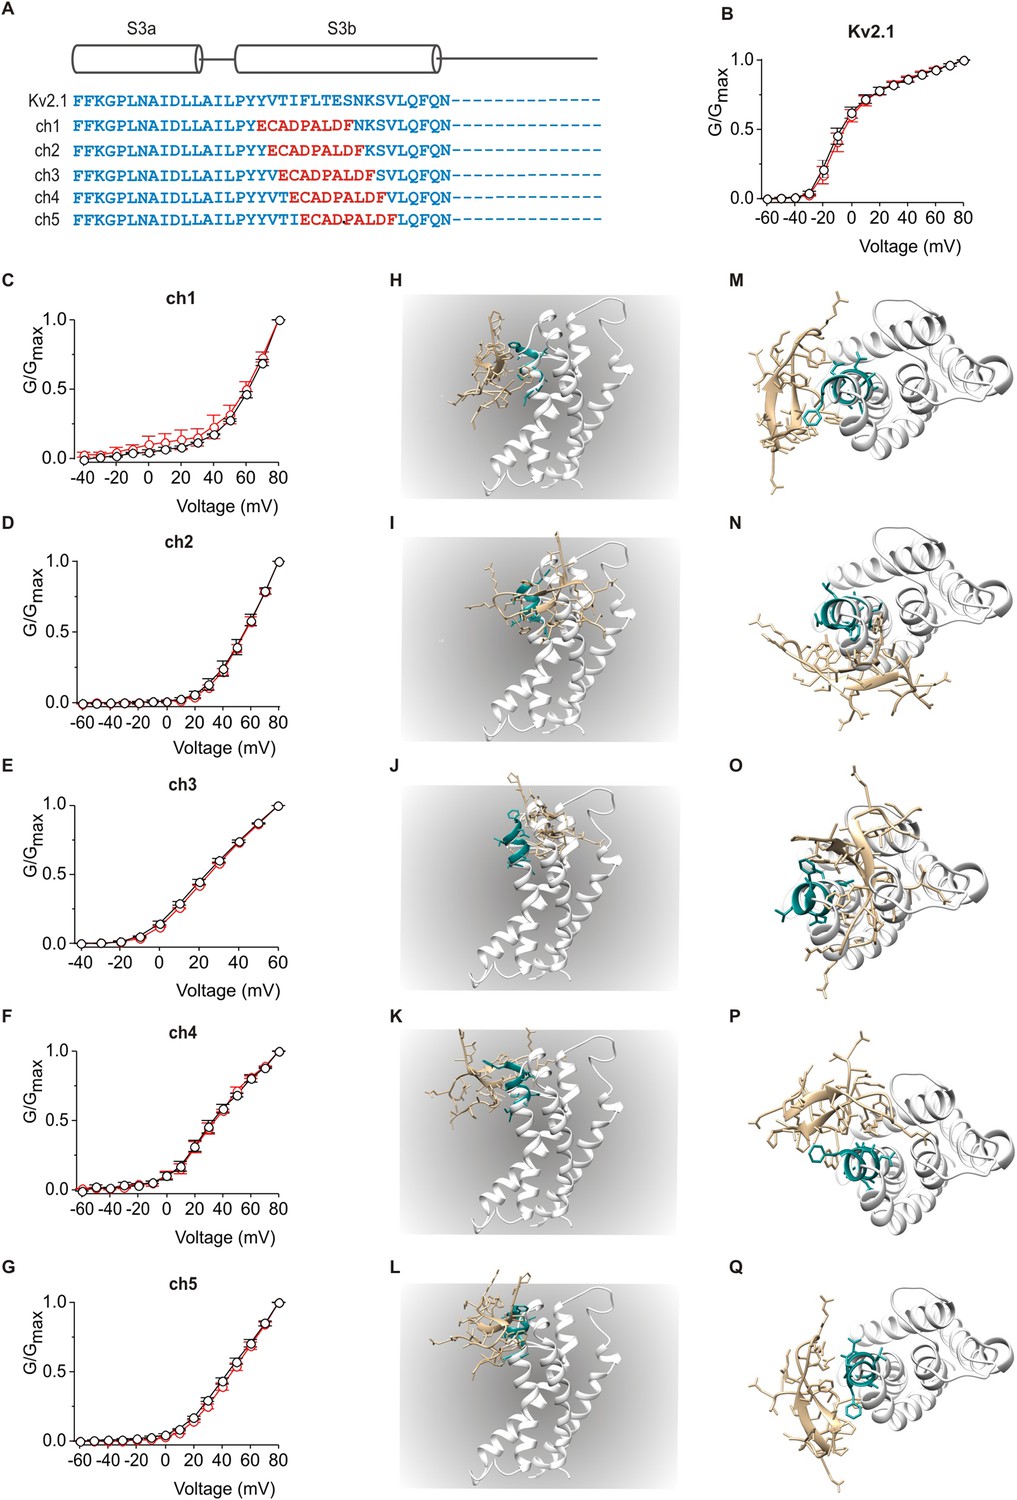
Influence of PcTx1 on chimeras between Kv2.1 and ASIC1a.
(A) Sequence alignment of S3 helices in Kv2.1 (blue) replaced with helix-5 from ASIC1a (red) in the chimeric constructs. (B–G) Normalized G-V relations in the absence (black circles) or presence (red circles) of 5 µM PcTx1. Conductance was measured using tail currents. In all cases data points are the mean ± SEM (n = 3). (H–Q) Models of PcTx1 bound to Kv2.1-ASIC1a chimeras viewed from a transmembrane (left; H–L) or extracellular (right; M–Q) perspective.
Figure 5 with 3 supplements
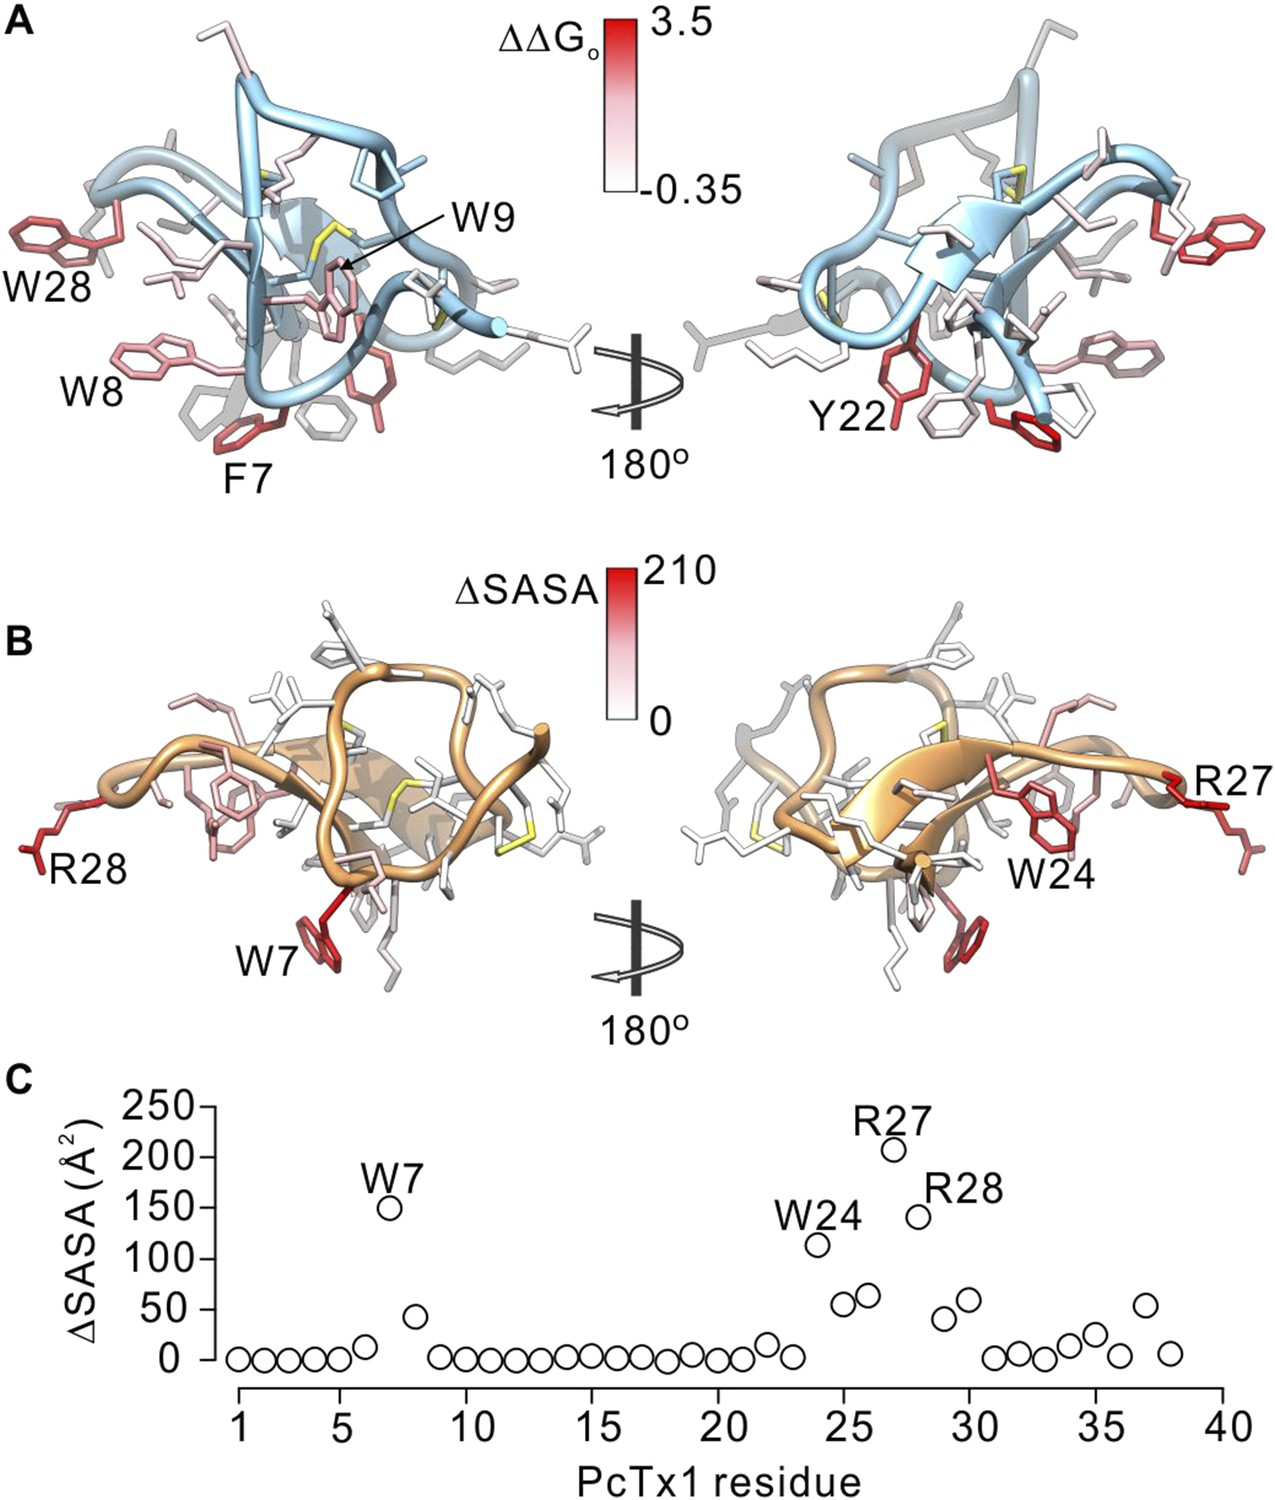
Comparison of residues on PcTx1 and GxTx-1E involved in receptor binding.
(A) GxTx-1E residues colored by perturbation in apparent affinity (ΔΔGo in kcal mol−1). Several side-chains with the largest perturbation energies are labeled. P16 was not colored since its mutation to Ala likely perturbs the structure of the toxin. (B) PcTx1 residues colored by changes in solvent accessible surface area (ΔSASA in Å2) of the toxin upon binding to ASIC1a. SASA was calculated using UCSF-Chimera with a 1.4 Å sphere for the structure of PcTx1 alone or in complex with ASIC 1a (PDB 4FZ0). Residues with the largest ΔSASA (W7, W24, R27 and R28) are labeled. (C) ΔSASA plotted against PcTx1 residue number.
Figure 5—figure supplement 1
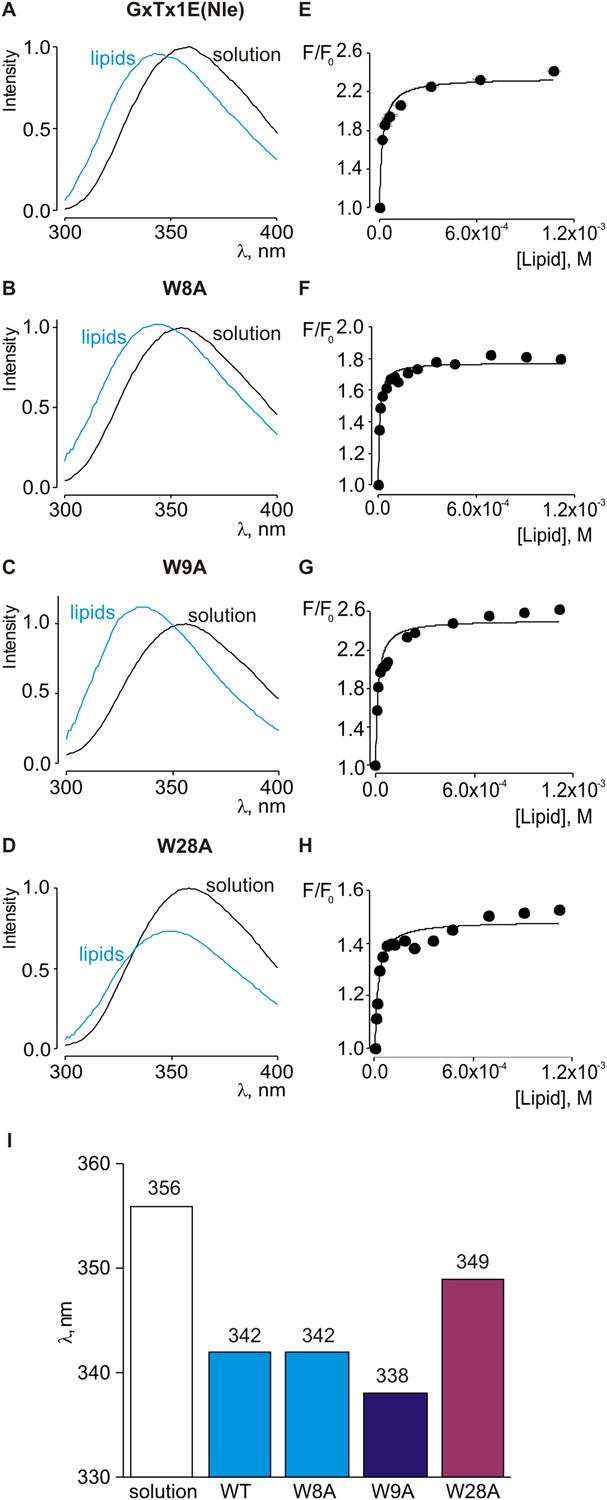
Interaction of tryptophan mutants of GxTx-1E(Nle) with lipid vesicles detected with intrinsic Trp fluorescence.
(A–D) Fluorescence emission spectra of GxTx-1E(Nle), W8A, W9A and W28A in the absence (black) or presence of lipid vesicles composed of a 1:1 mix of POPC:POPG (blue). The lipid concentration was 1.0 mM. (E–H) Fluorescence intensity at 320 nm plotted as a function of available lipid concentration for GxTx-1E(Nle), W8A, W9A and W28A. Smooth curves correspond to partition functions with Kx and F/F0max value of (4.6 ± 0.8) × 106 and 2.3 ± 0.05 for GxTx-1E(Nle), (1.3 ± 0.2) × 106 and 1.8 ± 0.01 for W8A, (7.6 ± 1.5) × 106 and 2.5 ± 0.05 for W9A and (5.5 ± 0.9) × 106 and 1.5 ± 0.01 for W28A, respectively. (I) λmax values for Trp fluorescence of GxTx-1E(Nle) and three Trp mutants in control solution (white bar) or in the presence of lipid vesicles at a concentration of 1 mM.
Figure 5—figure supplement 2
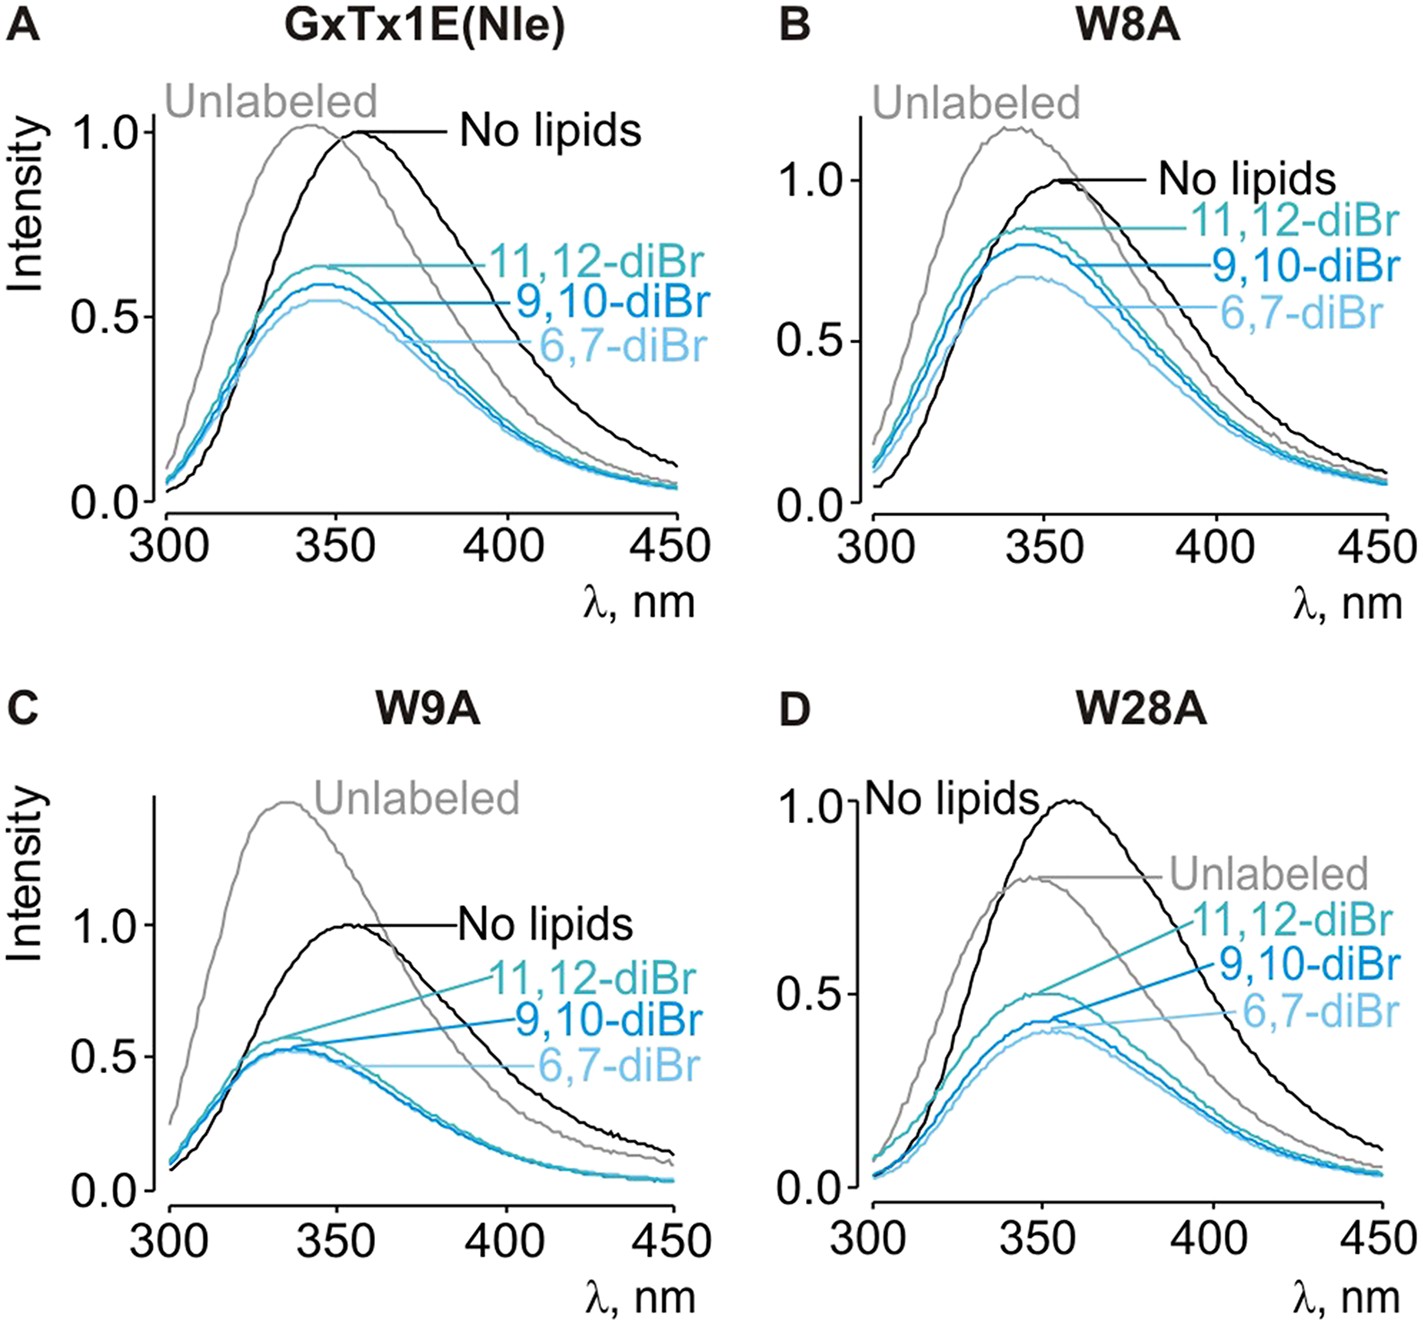
Depth-dependent quenching of tryptophan fluorescence by brominated (diBr) phosphatidylcholines.
(A–D) Fluorescence emission spectra of GxTx-1E(Nle) W8A, W9A and W28A in the absence (black) or presence of unlabeled (gray) or brominated (blue) lipids present at a concentration of 1.2 mM.
Figure 5—figure supplement 3
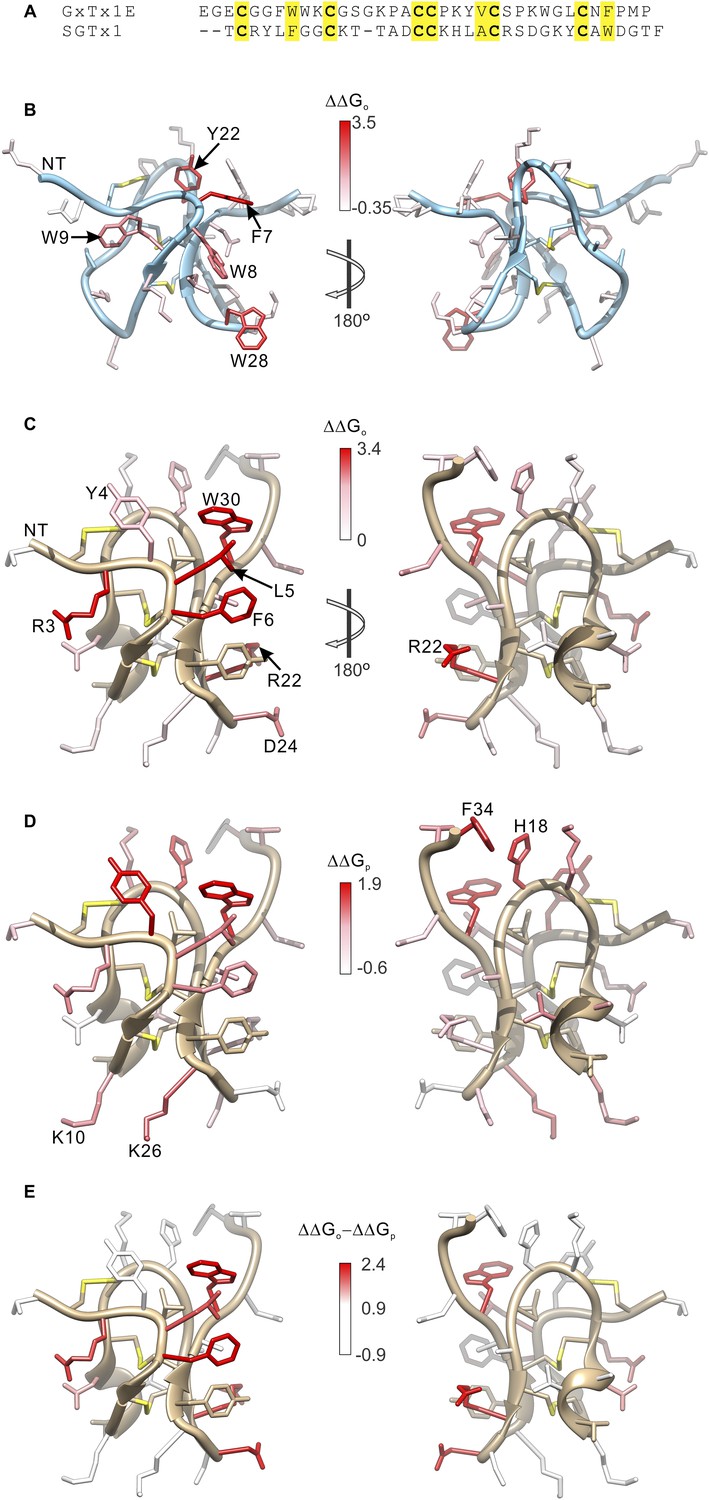
Comparison of the effects of GxTx-1E and SGTx1 mutation on apparent affinity and membrane partitioning.
(A) Sequence alignment between GxTx-1E and SGTx1. Conserved residues are highlighted in yellow. (B) GxTx-1E residues colored by perturbation in apparent affinity (ΔΔGo). (C and D) SGTx1 residues colored by perturbation in apparent affinity (ΔΔGo; C) and membrane partitioning (ΔΔGp; D). Apparent affinity values and membrane partitioning values are from Wang et al. (2004) and Milescu et al. (2007), respectively. (E) SGTx1 residues colored by ΔΔGo − ΔΔGp values to highlight positions where mutations have much larger effects on apparent affinity compared to membrane partitioning. In all right panels structures were rotated 180° about the indicated axes in B and C. GxTx-1E and SGTx1 structures were oriented by superimposing backbone folds of the two toxins.
Figure 6 with 2 supplements
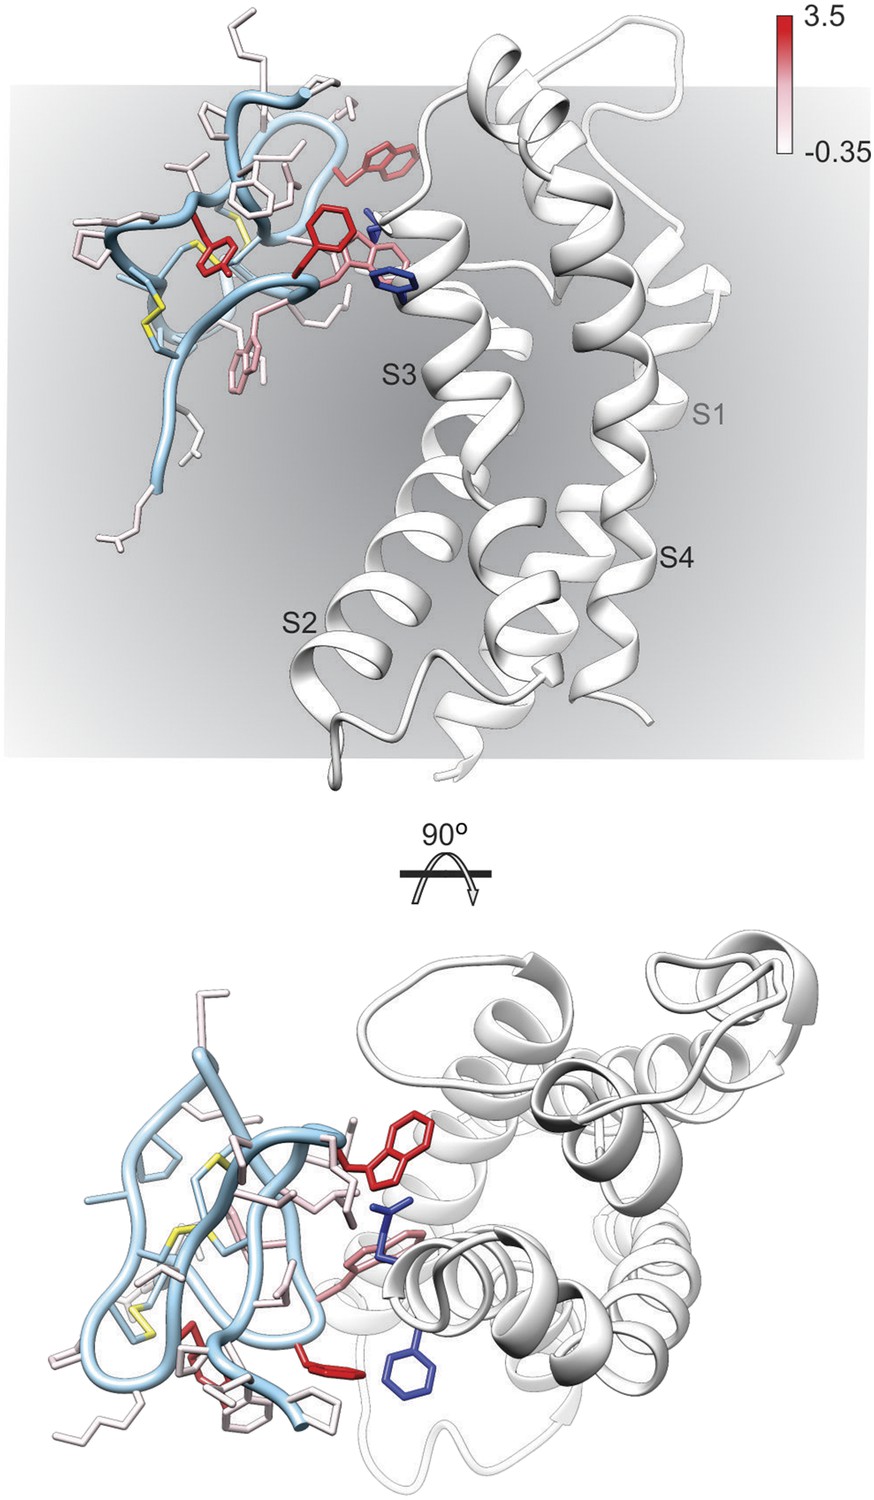
Model of GxTx-1E bound to the S3b helix of the Kv1.2/2.1 paddle chimera.
The preferred model of GxTx-1E bound to the X-ray structure of the voltage-sensing domain of the Kv1.2/2.1 paddle chimera generated as described in ‘Materials and methods’. The model maintains a relatively superficial position for the toxin relative to the membrane (see Figure 6—figure supplements 1, 2). The complex is viewed from a transmembrane perspective (top) and from the extracellular perspective (bottom). GxTx-1E side-chains are colored by free energy perturbation scale (ΔΔGo in kcal mol−1). F271 and E274 of the channel, where in Kv2.1, mutation to alanine decreases apparent Kd values for GxTx-1E (Milescu et al., 2009), are represented by blue colored side-chains.
Figure 6—figure supplement 1
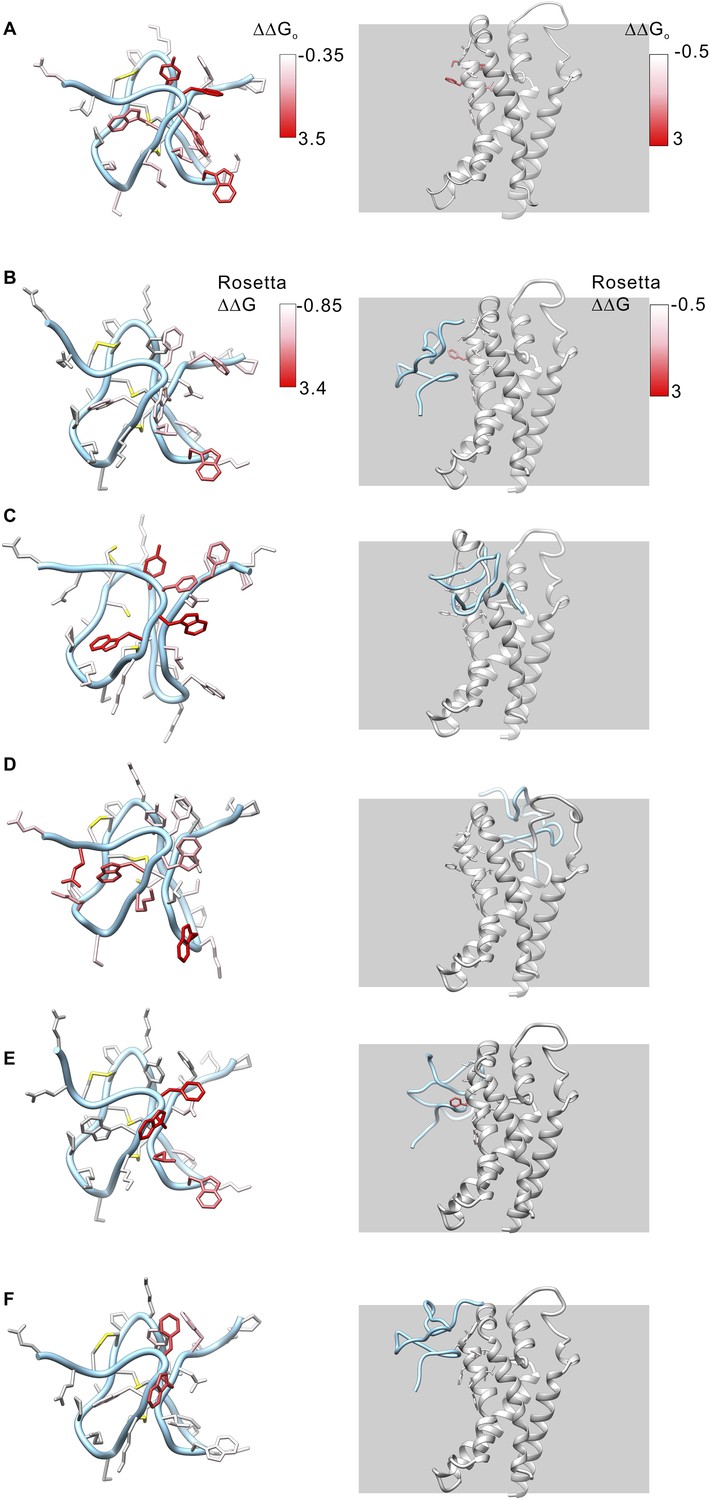
Model structures of GxTx-1E bound to the voltage-sensing domain of a Kv channel.
(A) Side chains of GxTx-1E (left; PDB 2WH9) and the voltage-sensing domain of the Kv1.2/Kv2.1 paddle chimera (right; PDB 2R9R) were colored by free energy perturbation values obtained by alanine scanning mutagenesis of the toxin (Table 1) or channel (Milescu et al., 2009). (B–E) Models of GxTx-1E bound to the paddle chimera using Rosetta. Side chains are colored by Rosetta binding energy calculated from in slico alanine scans for GxTx-1E (left) and voltage-sensing domain (right). Models were generated as described in ‘Materials and methods’. The five models shown are for five registers for placement of the toxin relative to the S3b helix and each differ in register by one residue (100° rotation of the toxin relative to the helical axis and a 5.4 Å translation). The model in B is the deepest positioning of the toxin and the model in F is the most superficial. All models are viewed from a transmembrane perspective. Residues beyond a distance threshold of 12 Å from any binding partner are colored gray. Steric clashes between the toxin and channel occur in the models in C and D. The model in E corresponds to that shown in Figure 6.
Figure 6—figure supplement 2
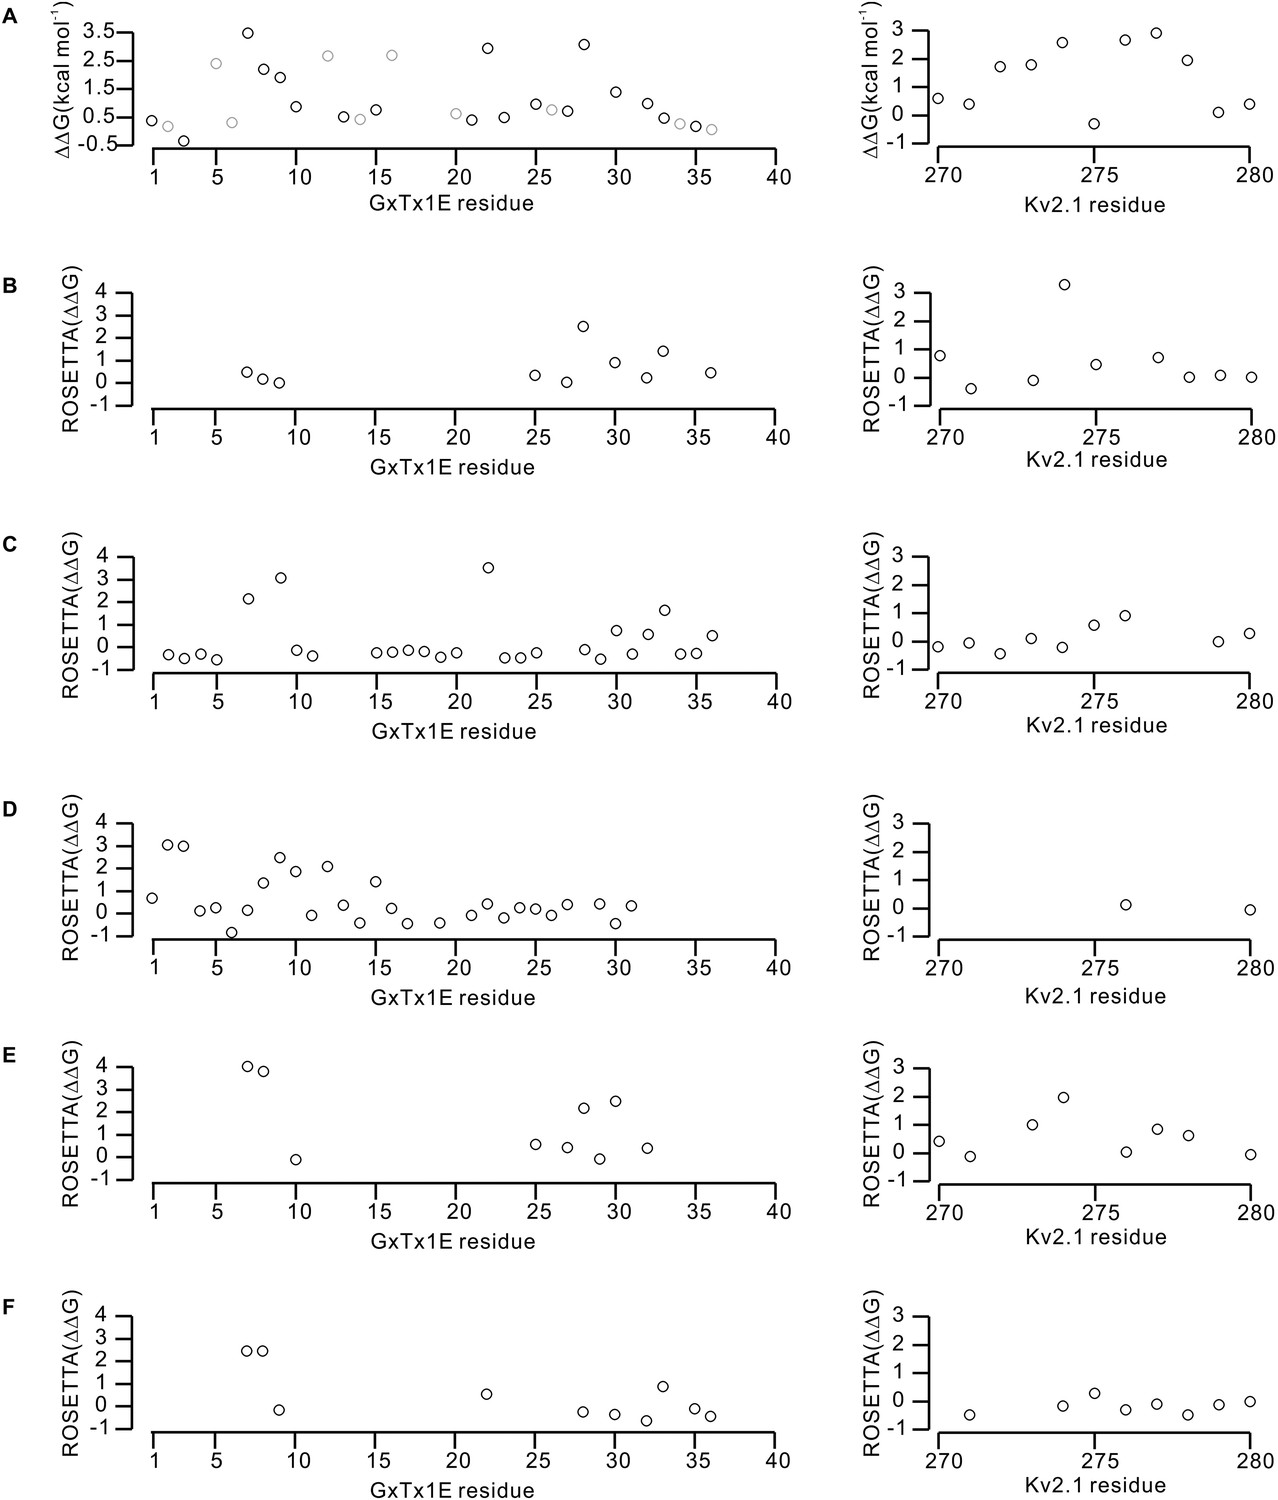
Effects of GxTx-1E and Kv2.1 mutations on the energetics of toxin-channel interactions.
(A) Perturbations in the free energy of GxTx-1E interactions with the Kv2.1 channel assessed from alanine scans of the toxin (Table 1) and channel (Milescu et al., 2009). Gray circles in the results of the alanine scan of GxTx-1E represent mutation of either Proline or Glycine, which likely influence the local structure of the toxin. (B–F) Calculated perturbations in ROSETTA binding energy between GxTx-1E and Kv2.1 resulting from alanine scans of the toxin and S3b helix of the S1–S4 domain for the five models illustrated in Figure 6—figure supplement 1. Energies were not calculated for residues beyond a distance threshold of 12 Å from any binding partner.
Tables
Table 1
Affinities and perturbation energies for mutants of GxTx-1E
| Toxin | Kd (nM) | Kdmut/Kdwt | ∆∆G (kcal mol−1) |
|---|---|---|---|
| Gxtx-1E(Nle) | 224 ± 25 | 1.0 | – |
| E1A | 414 ± 38 | 1.8 | 0.36 |
| G2A | 297 ± 50 | 1.3 | 0.17 |
| E3A | 125 ± 62 | 0.6 | −0.35 |
| G5A | 13,652 ± 320 | 60.9 | 2.44 |
| G6A | 379 ± 51 | 1.7 | 0.31 |
| F7A | 89,033 ± 9413 | 397.4 | 3.55 |
| W8A | 9641 ± 504 | 43.0 | 2.23 |
| W9A | 5837 ± 1850 | 26.1 | 1.93 |
| K10A | 984 ± 90 | 4.4 | 0.88 |
| G12A | 21,755 ± 1086 | 97.1 | 2.71 |
| S13A | 545 ± 56 | 2.4 | 0.53 |
| G14A | 461 ± 89 | 2.1 | 0.43 |
| K15A | 823 ± 127 | 3.7 | 0.77 |
| P16A | 22,967 ± 2812 | 102.5 | 2.75 |
| P20A | 652 ± 73 | 2.9 | 0.63 |
| K21A | 440 ± 82 | 2.0 | 0.40 |
| Y22A | 35,337 ± 7464 | 157.7 | 3.00 |
| V23A | 516 ± 60 | 2.3 | 0.50 |
| S25A | 1169 ± 64 | 5.2 | 0.98 |
| P26A | 813 ± 99 | 3.6 | 0.76 |
| K27A | 763 ± 49 | 3.4 | 0.73 |
| W28A | 44,298 ± 2471 | 197.7 | 3.14 |
| L30A | 2474 ± 278 | 11.0 | 1.42 |
| N32A | 1228 ± 166 | 5.5 | 1.01 |
| F33A | 491 ± 18 | 2.2 | 0.47 |
| P34A | 348 ± 60 | 1.6 | 0.26 |
| Nle35A | 306 ± 19.8 | 1.4 | 0.19 |
| P36A | 250 ± 22 | 1.1 | 0.07 |
Download links
A two-part list of links to download the article, or parts of the article, in various formats.
Downloads (link to download the article as PDF)
Open citations (links to open the citations from this article in various online reference manager services)
Cite this article (links to download the citations from this article in formats compatible with various reference manager tools)
Tarantula toxins use common surfaces for interacting with Kv and ASIC ion channels
eLife 4:e06774.
https://doi.org/10.7554/eLife.06774


