A high affinity RIM-binding protein/Aplip1 interaction prevents the formation of ectopic axonal active zones
- Freie Universität Berlin, Germany
- Charité-Universitätsmedizin Berlin, Germany
- Max Planck Institute of Colloids and Interfaces, Germany
- Max Planck Institute for Biophysical Chemistry, Germany
- University of Michigan, United States
Figures
Figure 1
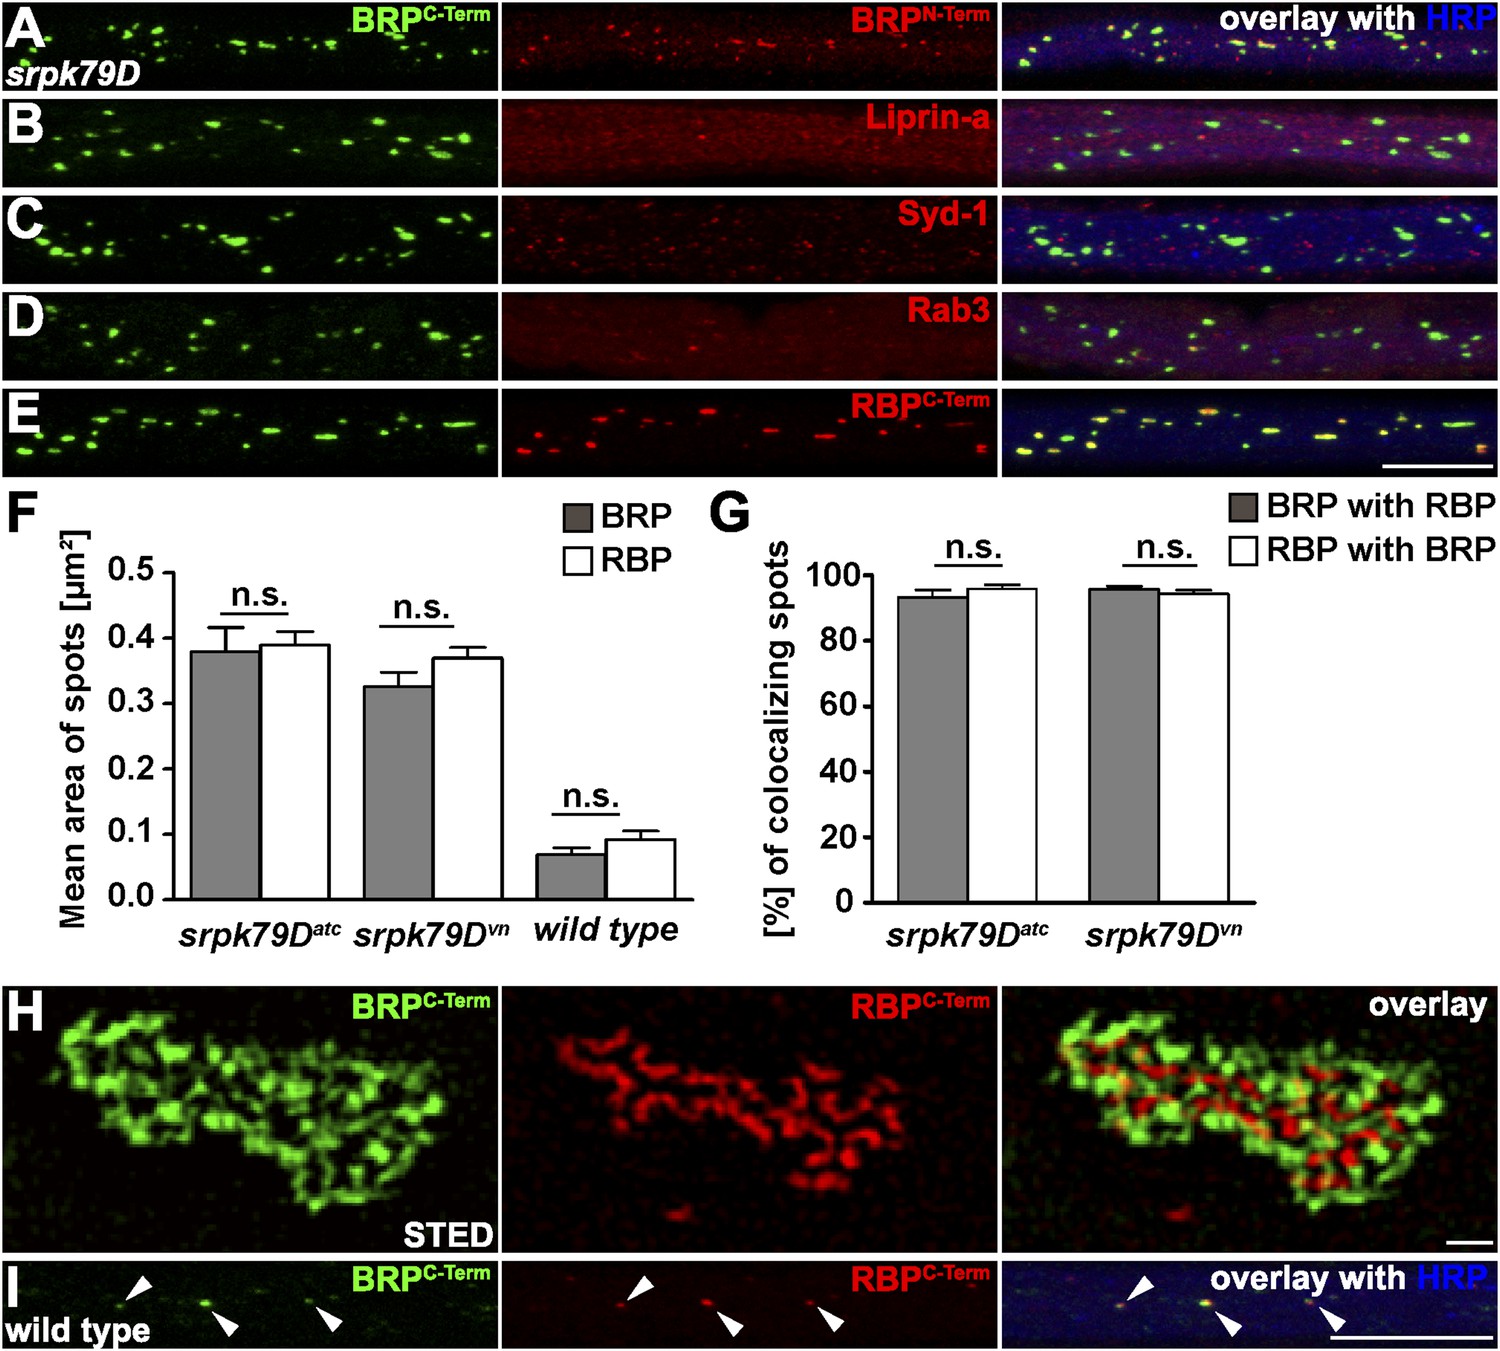
Co-accumulation of Bruchpilot (BRP) and RIM-binding protein (RBP) in srpk79D axonal aggregates.
(A–E, I) Nerve bundles of segments A1–A3 from third instar larvae of the genotypes indicated labeled with the antibodies (Abs) indicated. (A–E, H) BRP accumulated in axonal aggregates of srpk79D mutants. (B–D) Liprin-α (B), Syd-1 (C), and Rab3 (D), did not co-localize with axonal BRP spots. (E) By contrast, RBP invariably co-localized with BRP in these axonal aggregates. (F) Quantification of mean area of axonal BRP and RBP spots in wild type (WT) and srpk79D mutants. BRPC-term spots: 0.3797 ± 0.03694 µm2 in srpk79DATC, 0.3259 ± 0.02212 µm2 in srpk79Dvn, 0.06895 ± 0.01 µm2 in WT; RBPC-term spots: 0.3892 ± 0.02097 µm2 in srpk79DATC, 0.3696 ± 0.01645 µm2 in srpk79Dvn, 0.09184 ± 0.0133 in WT; n = 8 nerves each; all panels show mean values and errors bars representing SEM; ns, not significant, p > 0.05, Mann–Whitney U test. (G) Quantification for BRP co-localization with RBP and vice versa in srpk79D mutants. BRPC-term co-localizing with RBPC-term: 93.26% ± 2.172 in srpk79DATC, 95.85% ± 1.302 in srpk79Dvn; RBPC-term co-localizing with BRPC-term: 95.7% ± 0.9713 in srpk79DATC, 94.24% ± 1.162 in srpk79Dvn; n = 8 nerves each; all panels show mean values and errors bars representing SEM; ns, not significant, p > 0.05, Mann–Whitney U test. (H) Two-colour stimulated emission depletion (STED) images of axonal aggregates in srpk79D mutants revealed that RBPC-Term label localized to the inside of the axonal aggregates and was surrounded by BRPC-Term label. (I) BRP and RBP also co-localized in axonal spots of WT animals (arrow heads show co-localization of BRP and RBP in the axon). Scale bars: (A–E, I) 10 µm; (H) 200 nm.
Figure 2
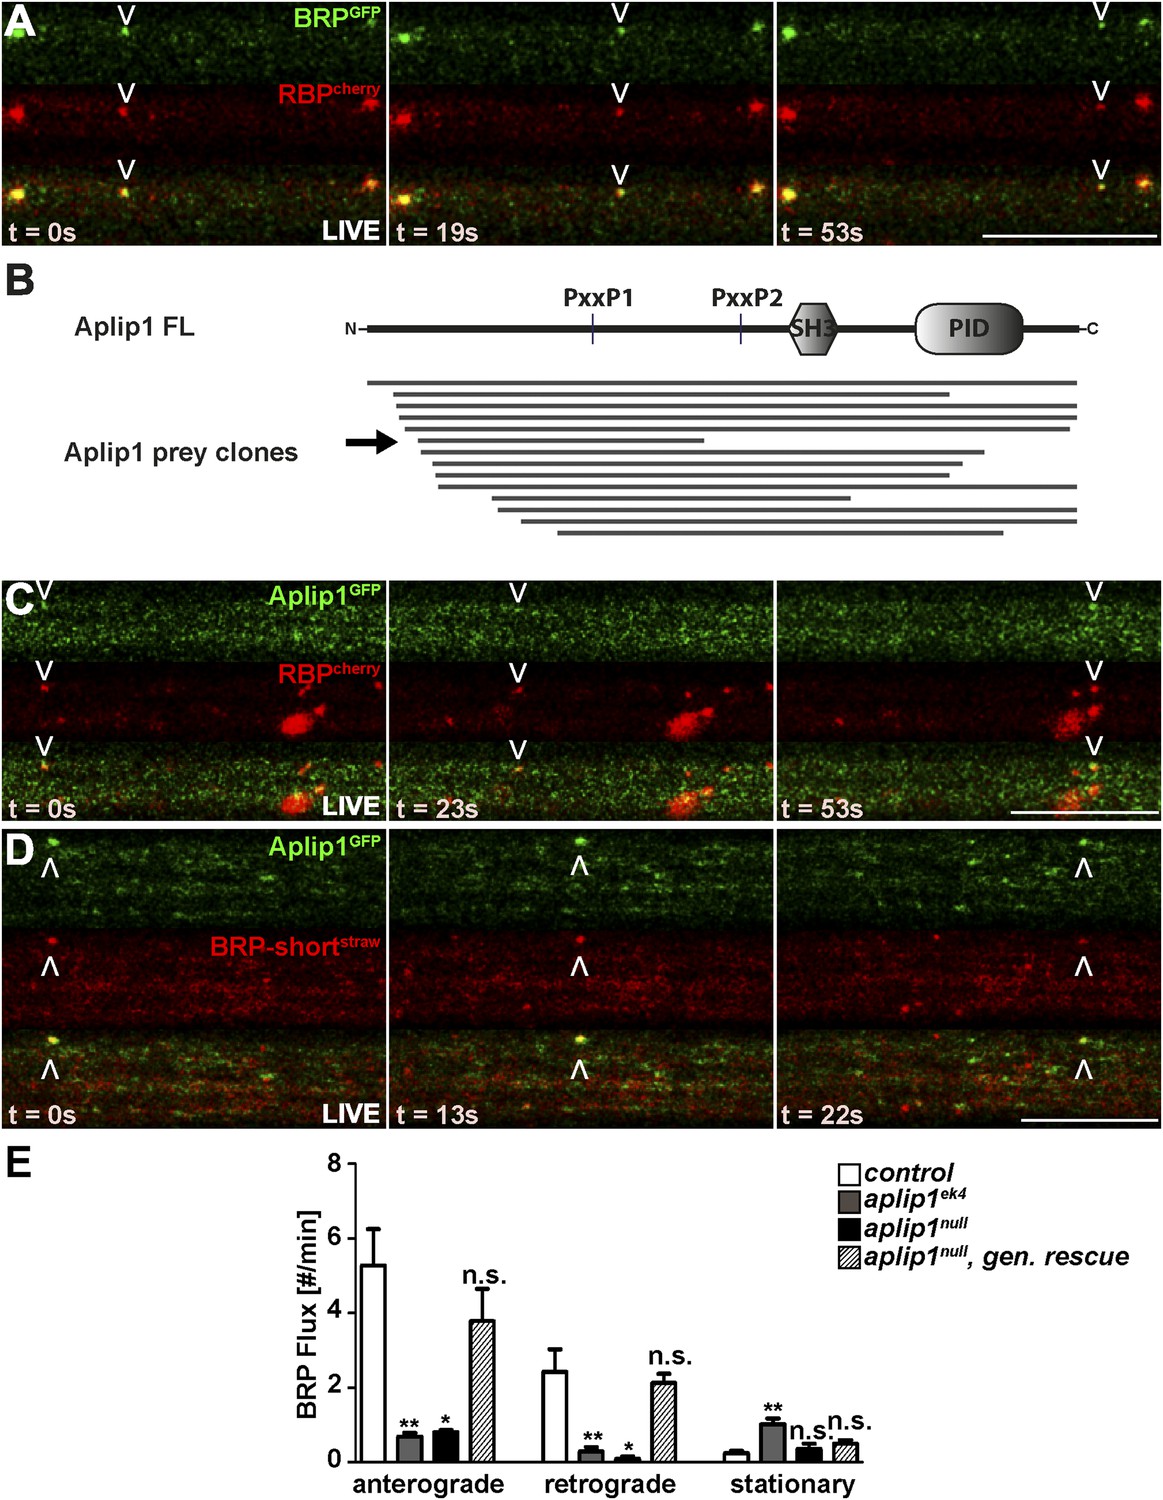
Live imaging of anterograde co-transport between BRP, RBP and APP-like protein interacting protein 1 (Aplip1).
(A) Live imaging in intact third instar larvae showed anterograde co-transport of BRPGFP and RBPcherry. See also, Video 1. (B) Schematic representation of Aplip1 domain structure containing two PxxP motifs, one Src-homology 3 (SH3) domain and one C-terminal phosphotyrosine interaction domain (PID) (FL = full-length). Lines represent Aplip1 prey fragments recovered in RBP SH3-II+III bait yeast-two-hybrid (Y2H) screen. Arrow indicates one single clone that contained only the first of the two Aplip1-PxxP motifs. (C, D) Live imaging in intact third instar larvae showed anterograde co-transport of Aplip1GFP and RBPcherry (C), as well as Aplip1GFP and BRP-shortstraw (D). Scale bars: (A, C, D) 10 µm. See also, Videos 2, 3. (E) Quantification of live imaging of BRP-shortstraw flux (spots passing through an axonal cross-section per minute) within the genetic backgrounds indicated. Anterograde and retrograde BRP-shortstraw flux was severely impaired in aplip1ek4 and aplip1null mutant background, which was rescued when a genomic rescue construct for Aplip1 was introduced into the aplip1null mutant background. BRP-shortstraw flux per min, control (n = 14 nerves): anterograde: 5.267 ± 0.975, retrograde: 2.423 ± 0.604, stationary: 0.241 ± 0.071; aplip1ek4 (n = 28 nerves): anterograde: 0.687 ± 0.098, retrograde: 0.284 ± 0.125, stationary: 1.023 ± 0.145; aplip1null (n = 11 nerves): anterograde: 0.808 ± 0.051, retrograde: 0.085 ± 0.064, stationary: 0.354 ± 0.148; aplip1null, gen rescue (n = 26 nerves): anterograde: 3.783 ± 0.861, retrograde: 2.123 ± 0.239, stationary: 0.505 ± 0.084. All panels show mean values and errors bars representing SEM. *p ≤ 0.05; **p ≤ 0.01; ***p ≤ 0.001; ns, not significant, p > 0.05, Mann–Whitney U test.
Figure 3 with 5 supplements
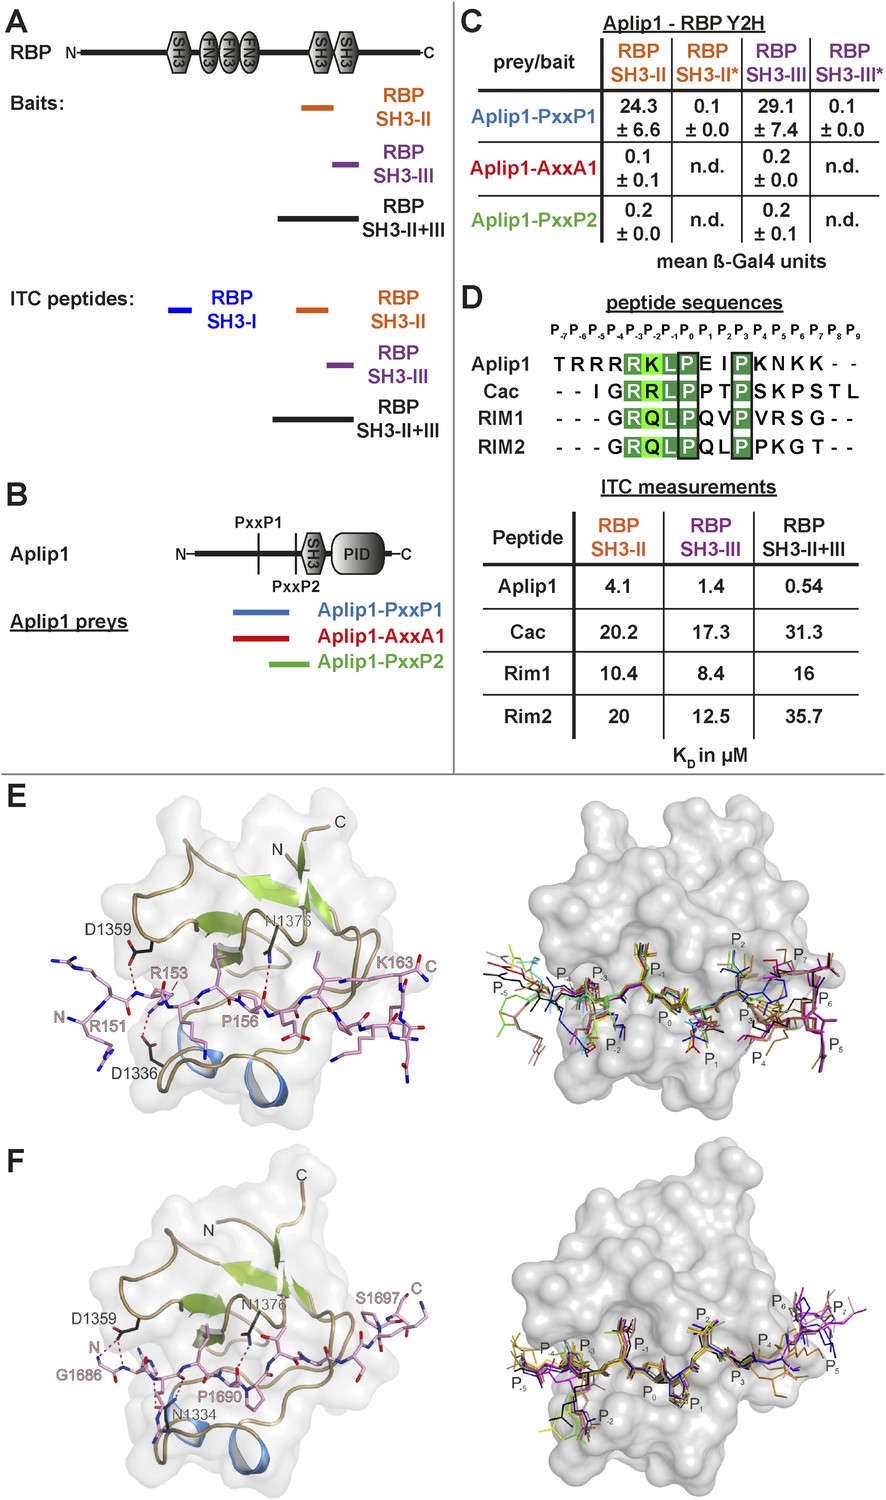
Aplip1 binds RBP using a high-affinity PxxP1-SH3 interaction.
(A) Schematic representation of RBP domain structure containing three SH3 domains (I–III from the N-terminus) and three Fibronectin 3 (FN3) domains. The corresponding fragments used in the large scale Y2H screen (SH3-II+III) and used as bait (SH3-II and SH3-III) in the Y2H assay (C) against different Aplip1 prey constructs (B) are indicated. Different isothermal titration calorimetry (ITC) peptides (SH3-I, SH3-II, SH3-III and SH3-II+III) used for ITC measurements (D) are also shown. (B) Schematic representation of Aplip1 domain structure entailing two PxxP motifs, one SH3 and one C-terminal PID. Different preys (Aplip1-PxxP1, -AxxA1 and -PxxP2) used in Y2H assay (C) are indicated. (C) Liquid Y2H assay of individual Aplip1 prey fragments against different RBP baits. Aplip1-PxxP1 interacted with both the single SH3-II and -III domains of RBP. Mutating this first PxxP motif (Aplip1-AxxA1) construct abolished the binding. Aplip1-PxxP2 showed no interaction to RBP SH3 domains. Constructs with point-mutated RBP SH3 domains (SH3-II*, SH3-III*) abolished the binding to Aplip1-PxxP1. (D) Peptide sequences used for ITC measurements. Aplip1 showed the strongest interaction with RBP compared with Cacophony (Cac), RIM1 and RIM2, with the strongest affinity (lowest KD) between Aplip1 and the RBP SH3-II+III domain. (E, F) Crystal structure of Aplip1-peptide (E; see also, 3D for peptide sequence) and of Cac-peptide (F; see also, Figure 3D for peptide sequence) bound to RBP SH3-II. The SH3 domain is shown in gray surface representation with (left) and without (right) the respective protein in cartoon representation. The bound peptides are drawn in stick representation. Hydrogen bonds ≤3.3 Å are indicated by red dashes. In the right panel, several peptide SH3-II complexes as observed in the asymmetric unit are superimposed and shown in different colors. See also, Tables 1–4.
Figure 3—figure supplement 1

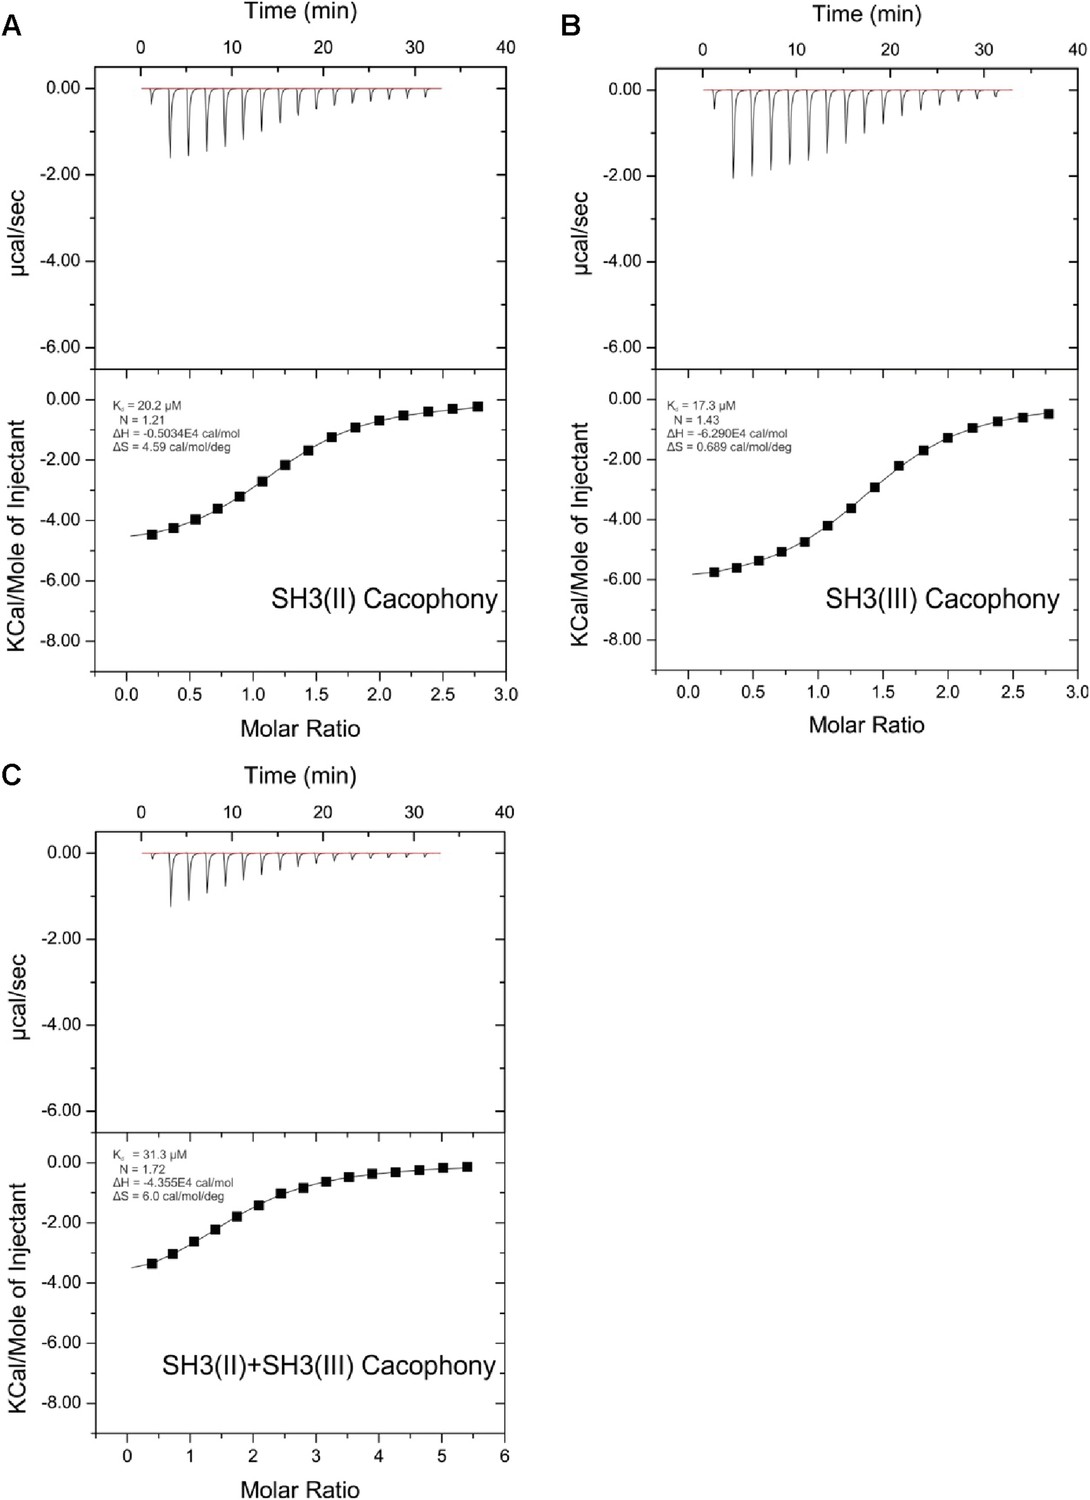
ITC measurements for Aplip1 and RBP SH3 domains.
Quantification of protein-peptide interactions by ITC. Both the raw data and the data integrated are shown. Data were fitted based on the ‘One Set of Sites’ model. (A) Titration of RBP-BP SH3-II and the Aplip1 peptide. (B) Titration of RBP-BP SH3-III and the Aplip1 peptide. (C) Titration of RBP-BP SH3-II+SH3-III and the Aplip1 peptide.
Figure 3—figure supplement 2
ITC measurements for Cac and RBP SH3 domains.
Quantification of protein-peptide interactions by ITC. Both the raw data and the data integrated are shown. Data were fitted based on the ‘One Set of Sites’ model. (A) Titration of RBP-BP SH3-II and the Cac peptide. (B) Titration of RBP-BP SH3-III and the Cac peptide. (C) Titration of RBP-BP SH3-II+SH3-III and the Cac peptide.
Figure 3—figure supplement 3
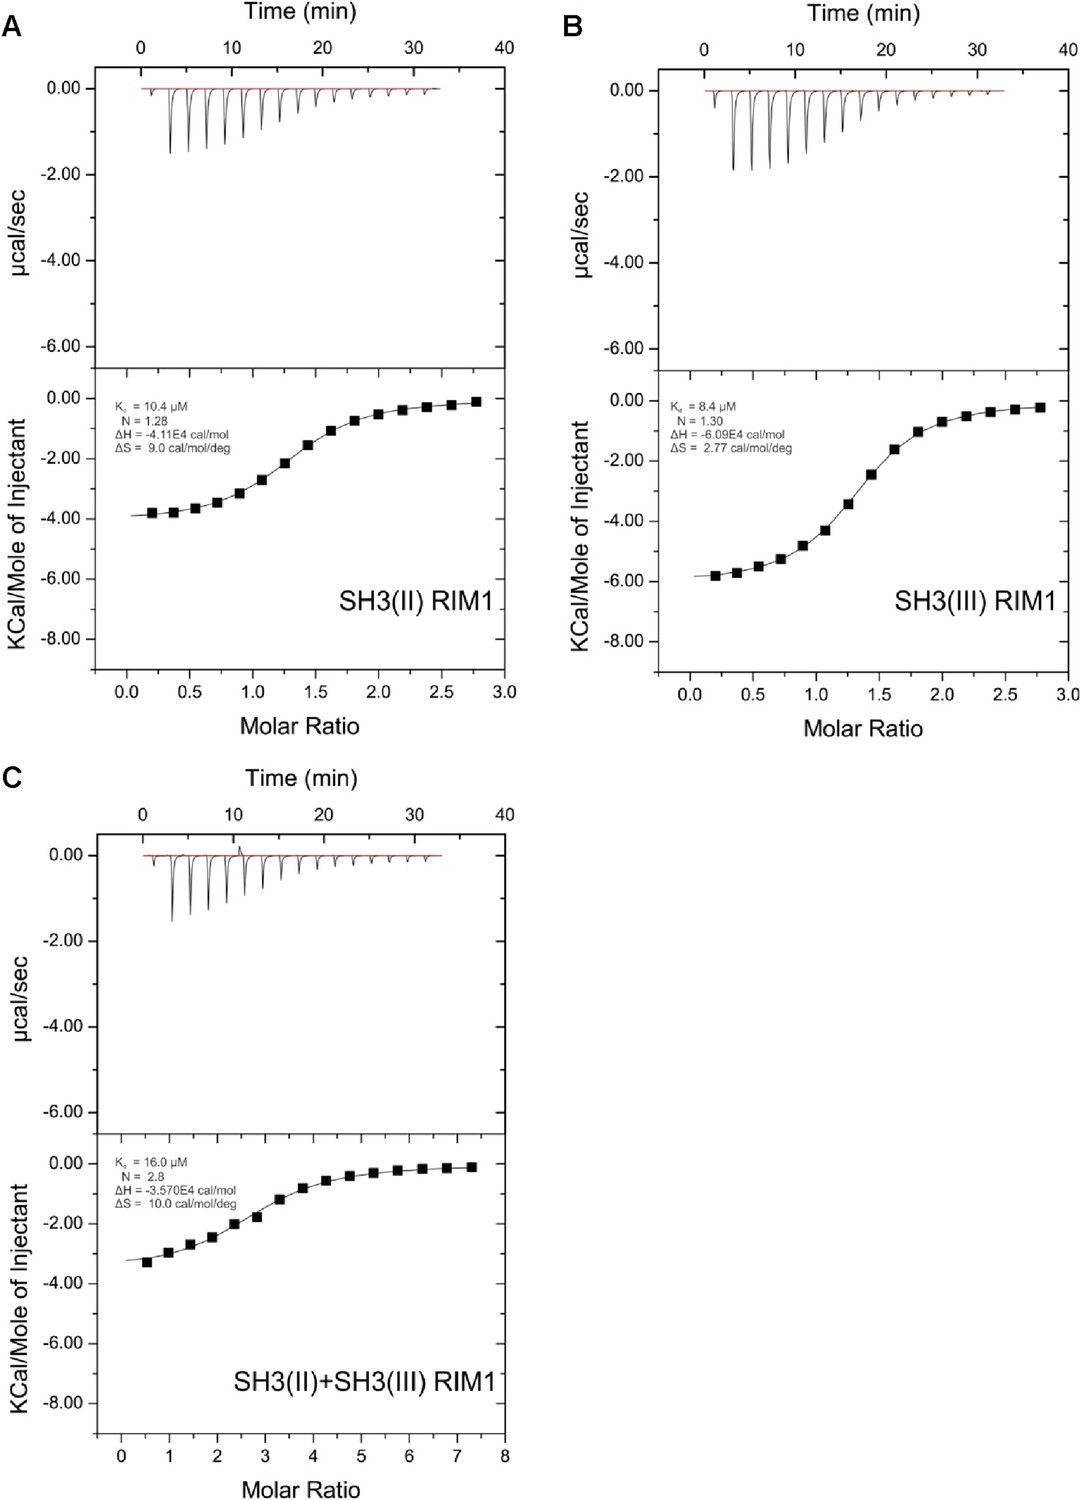
ITC measurements for RIM1 and RBP SH3 domains.
Quantification of protein-peptide interactions by ITC. Both the raw data and the data integrated are shown. Data were fitted based on the ‘One Set of Sites’ model. (A) Titration of RBP-BP SH3-II and the RIM1 peptide. (B) Titration of RBP-BP SH3-III and the RIM1 peptide. (C) Titration of RBP-BP SH3-II+SH3-III and the RIM1.
Figure 3—figure supplement 4
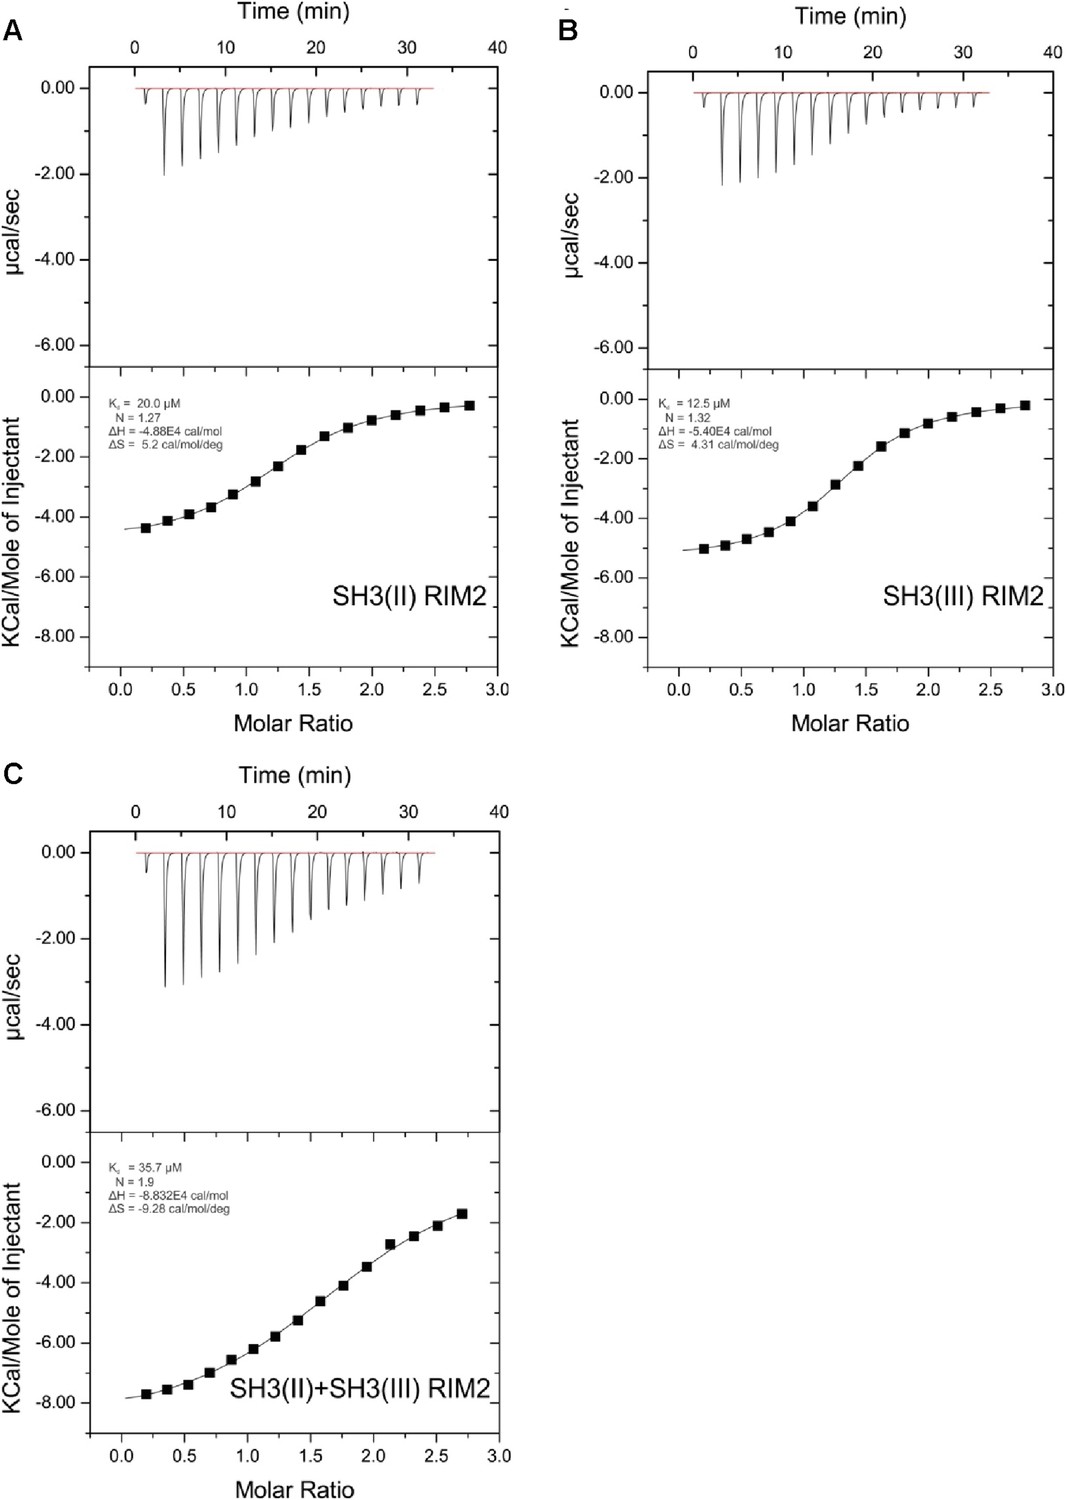
ITC measurements for RIM2 and RBP SH3 domains.
Quantification of protein-peptide interactions by ITC. Both the raw data and the data integrated are shown. Data were fitted based on the ‘One Set of Sites’ model. (A) Titration of RBP-BP SH3-II and the RIM2 peptide. (B) Titration of RBP-BP SH3-III and the RIM2 peptide. (C) Titration of RBP-BP SH3-II+SH3-III and the RIM2.
Figure 3—figure supplement 5
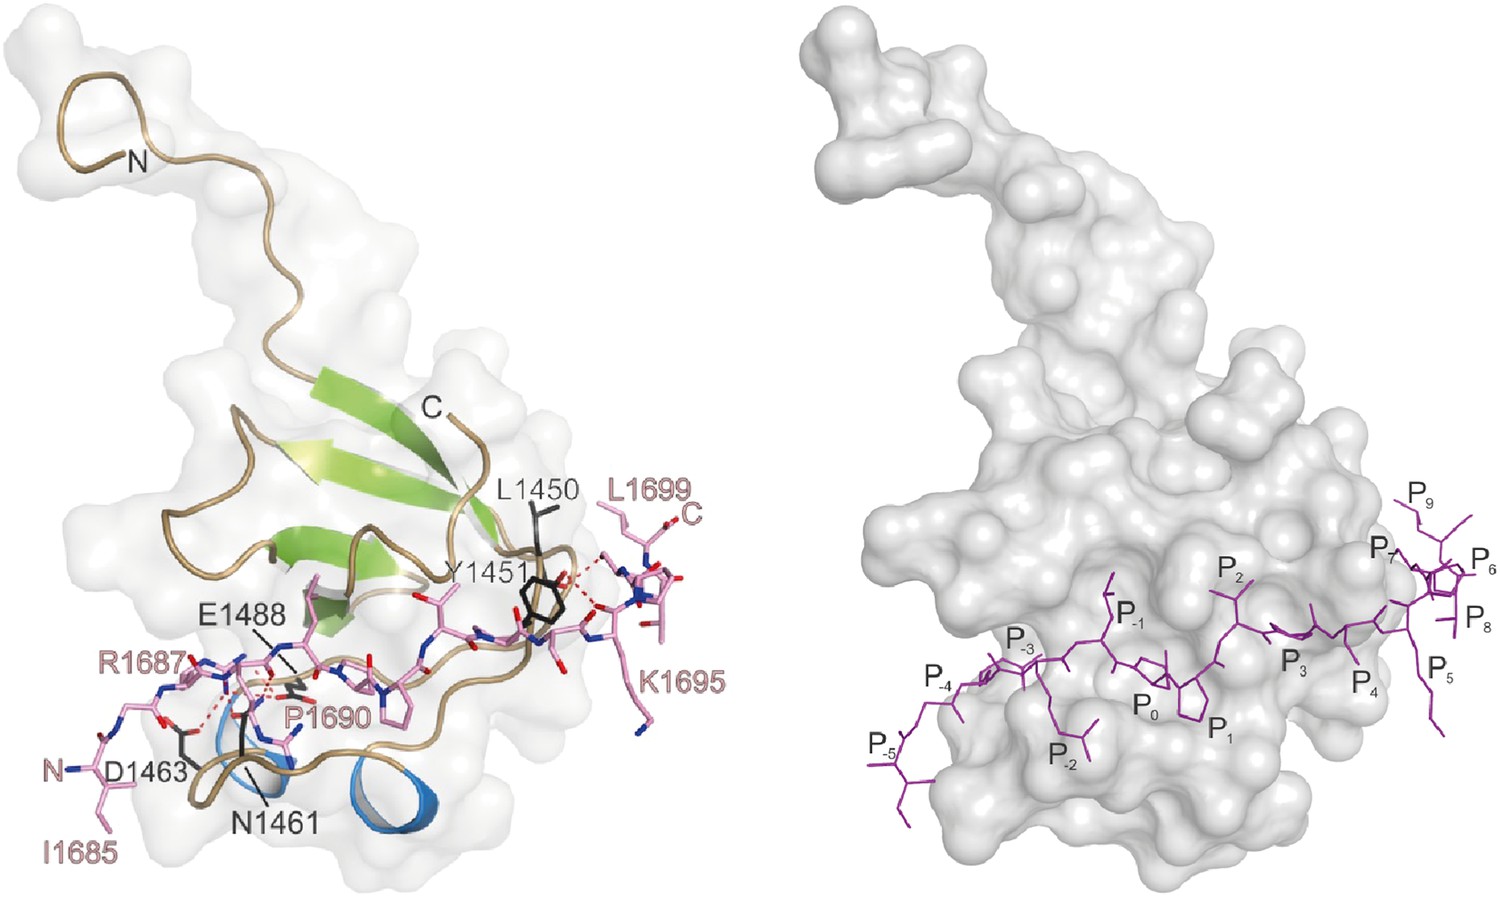
Crystal structure of Cac-peptide bound to RBP SH3-III domain.
The SH3 domain is shown in gray surface representation, with (left) and without (right) the respective protein in cartoon representation. The bound peptides are drawn in stick representation. Hydrogen bonds ≤3.3 Å are indicated by red dashes.
Figure 4
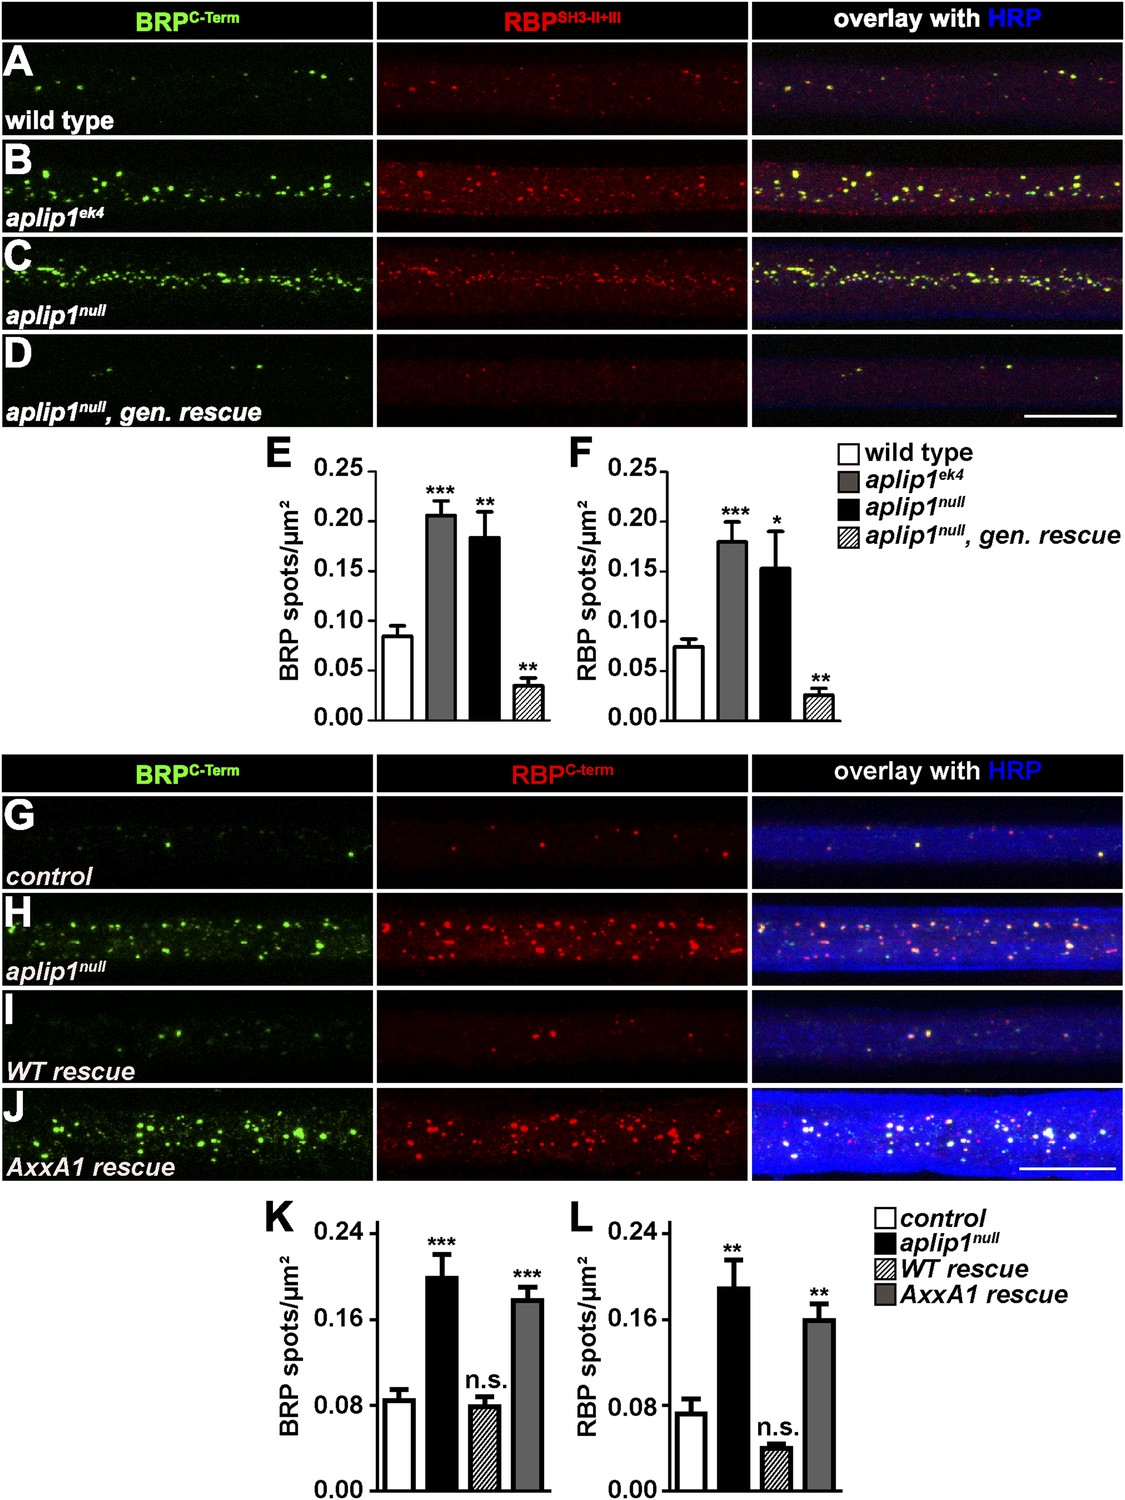
Aplip1-PXXP1 motif is needed for its function as RBP/BRP transport adaptor.
(A–D) Nerve bundles of segments A1–A3 from third instar larvae of the genotypes indicated labeled with the Abs indicated. (E, F) Quantification of BRP/RBP spot numbers. BRP spots per µm2: WT (n = 8 nerves): 0.084 ± 0.010; aplip1ek4 (n = 9 nerves): 0.205 ± 0.025; aplip1null (n = 8 nerves): 0.183 ± 0.025; aplip1null, gen. rescue (n = 8 nerves): 0.034 ± 0.007; RBP spots per µm2, WT (n = 8 nerves): 0.074 ± 0.007; aplip1ek4 (n = 9 nerves): 0.180 ± 0.019; aplip1null (n = 8 nerves): 0.153 ± 0.037; aplip1null, gen. rescue (n = 8 nerves): 0.025 ± 0.006. All panels show mean values and errors bars representing SEM. *p ≤ 0.05; **p ≤ 0.01; ***p ≤ 0.001; ns, not significant, p > 0.05, Mann–Whitney U test. (G–J) Nerve bundles of segment A1–A3 from third instar larvae of the genotypes indicated labeled with the Abs indicated. BRP and RBP co-localized in control animals and accumulated in a co-localizing fashion in axons of aplip1null mutant animals. Re-expression of an Aplip1-WT cDNA construct in the aplip1null background rescued the phenotype, while re-expression of an AxxA1 construct did not. (K, L) Quantification of the number of BRP/RBP spots per µm2 axon. BRP spots per µm2, control (n = 12 nerves): 0.084 ± 0.010; aplip1null (n = 16 nerves): 0.198 ± 0.022; WT rescue (n = 14 nerves): 0.078 ± 0.009; AxxA1 rescue (n = 14 nerves): 0.177 ± 0.012; RBP spots per µm2, control (n = 12 nerves): 0.071 ± 0.013; aplip1null (n = 16 nerves): 0.188 ± 0.026; WT rescue (n = 14 nerves): 0.039 ± 0.004; AxxA1 rescue (n = 14 nerves): 0.158 ± 0.015. All panels show mean values and errors bars representing SEM. *p ≤ 0.05; **p ≤ 0.01; ***p ≤ 0.001; ns, not significant, p > 0.05, Mann–Whitney U test. Scale bar: (A–D, G–J) 10 µm.
Figure 5 with 2 supplements

Aplip1 promotes BRP transport in absence of RBP.
(A–E) Nerve bundles of segments A1–A3 from third instar larvae of the genotypes indicated labeled with the Abs indicated. (A) Removing one copy of BRP in aplip1ek4 mutants had no apparent effect on axonal RBP accumulation. (B) RBP still accumulates in brpnull;aplip1ek4 double mutants. (C, D) Driver control and removing one copy of RBP in motoneuronal driven Aplip1-RNAi had no apparent effect on axonal BRP accumulation. (E) BRP still accumulates in rbpnull,aplip1 double mutants Scale bar: (A–E) 10 µm. (F) Immunoprecipitation (IP) of Aplip1GFP with anti-GFP Ab from Drosophila active zone (AZ) protein-enriched fraction was followed by Western blot (WB) analysis using anti-BRPLast200 and anti-RBPSH3-II+III. Both BRP and RBP could be detected in Aplip1GFP IPs, but are absent in controls (plain beads; GFP trapped beads). (For whole WBs, see Figure 5—figure supplement 2).
Figure 5—figure supplement 1
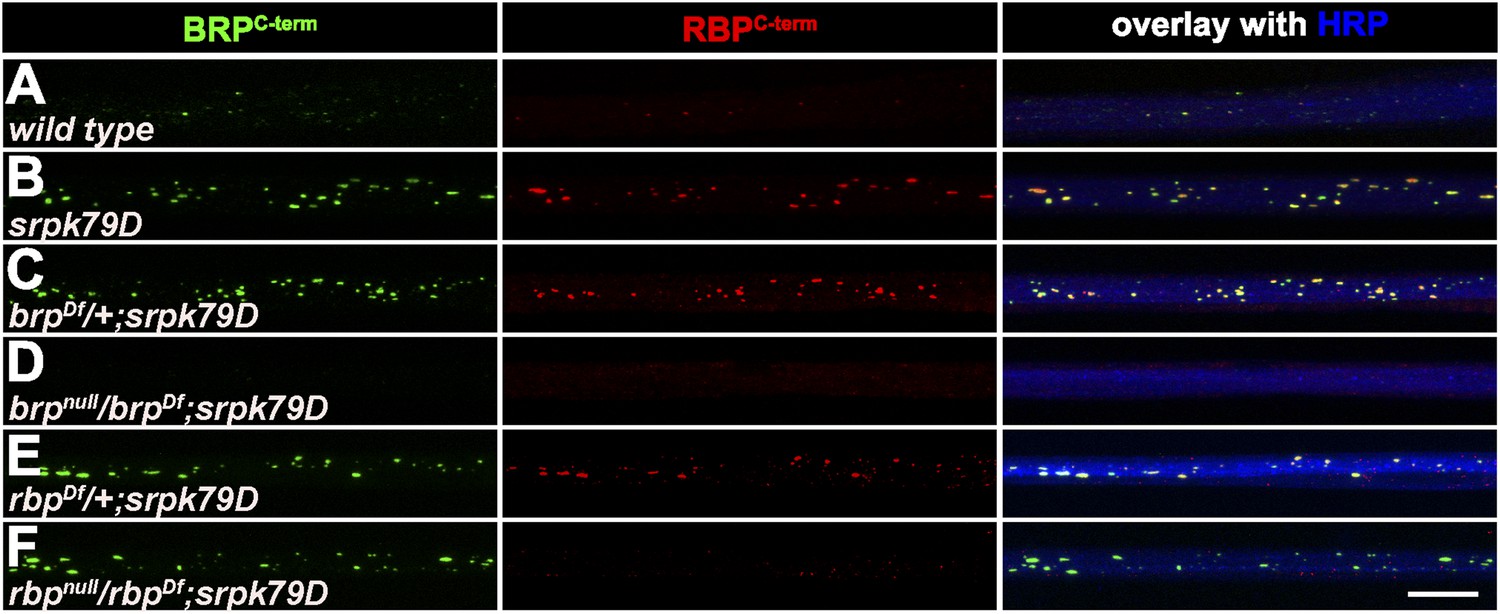
Accumulation of BRP in srpk79D mutant axons is unaffected by removing RBP.
(A–F) Nerves of segments A1–A3 from third instar larvae of the genotypes indicated labeled with the Abs indicated. Removing BRP in srpk79D mutants (D) also abolished axonal RBP spots, while removing RBP in srpk79D mutants did not affect BRP accumulations (F).
Figure 5—figure supplement 2

IP of Aplip1GFP with anti-GFP (Full blot).
Full blot IP of Aplip1GFP with anti-GFP from Drosophila AZ protein-enriched fraction was followed by WB analysis using anti-BRPLast200 and anti-RBPSH3-II+III Abs.
Figure 6
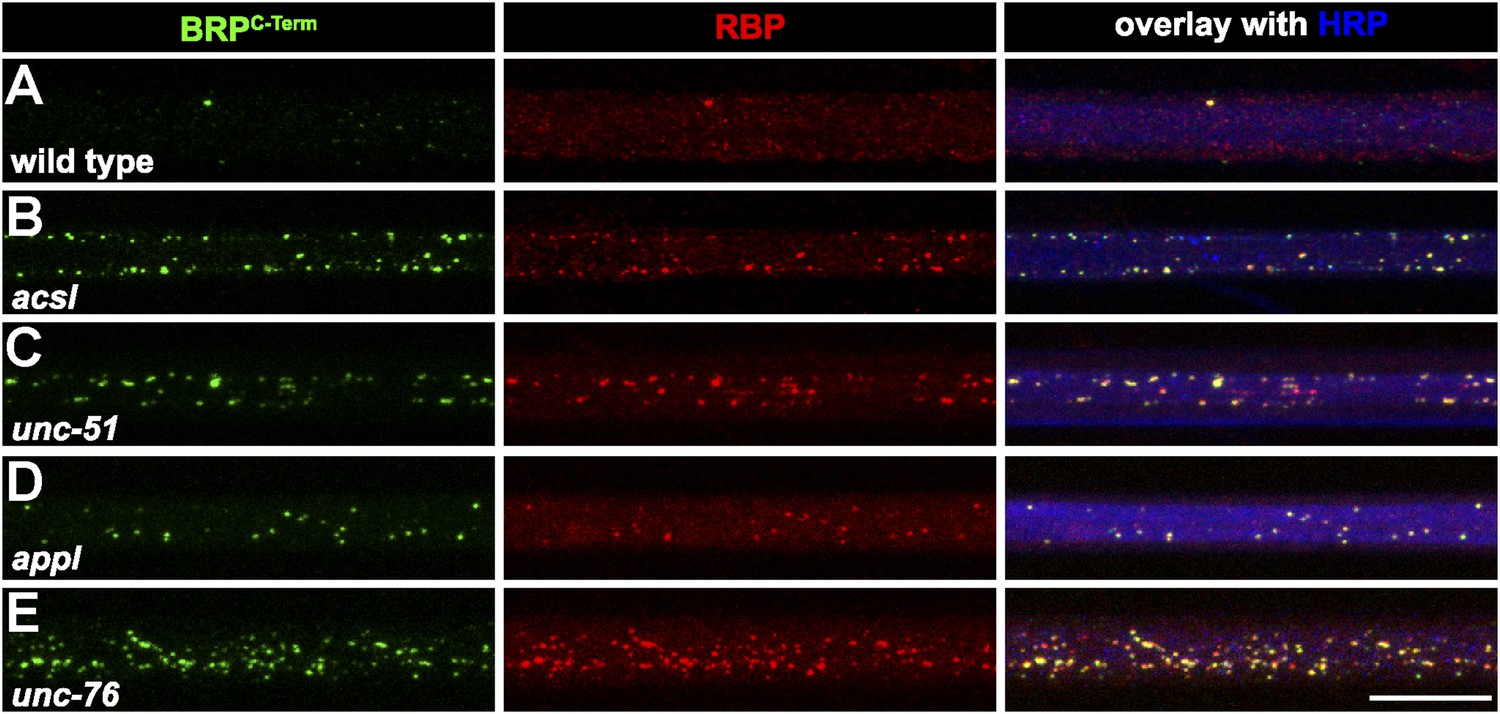
Several known transport adaptor mutants showed axonal BRP and RBP co-accumulations.
(A–E) Nerve bundles of segment A1–A3 from third instar larvae of the genotypes indicated labeled with the Abs indicated. BRP and RBP accumulated in a co-localizing manner in axons of WT (A), acsl (B), unc-51 (atg-1; C), appl (D) and unc-76 (E). Scale bar: 10 µm.
Figure 7 with 1 supplement
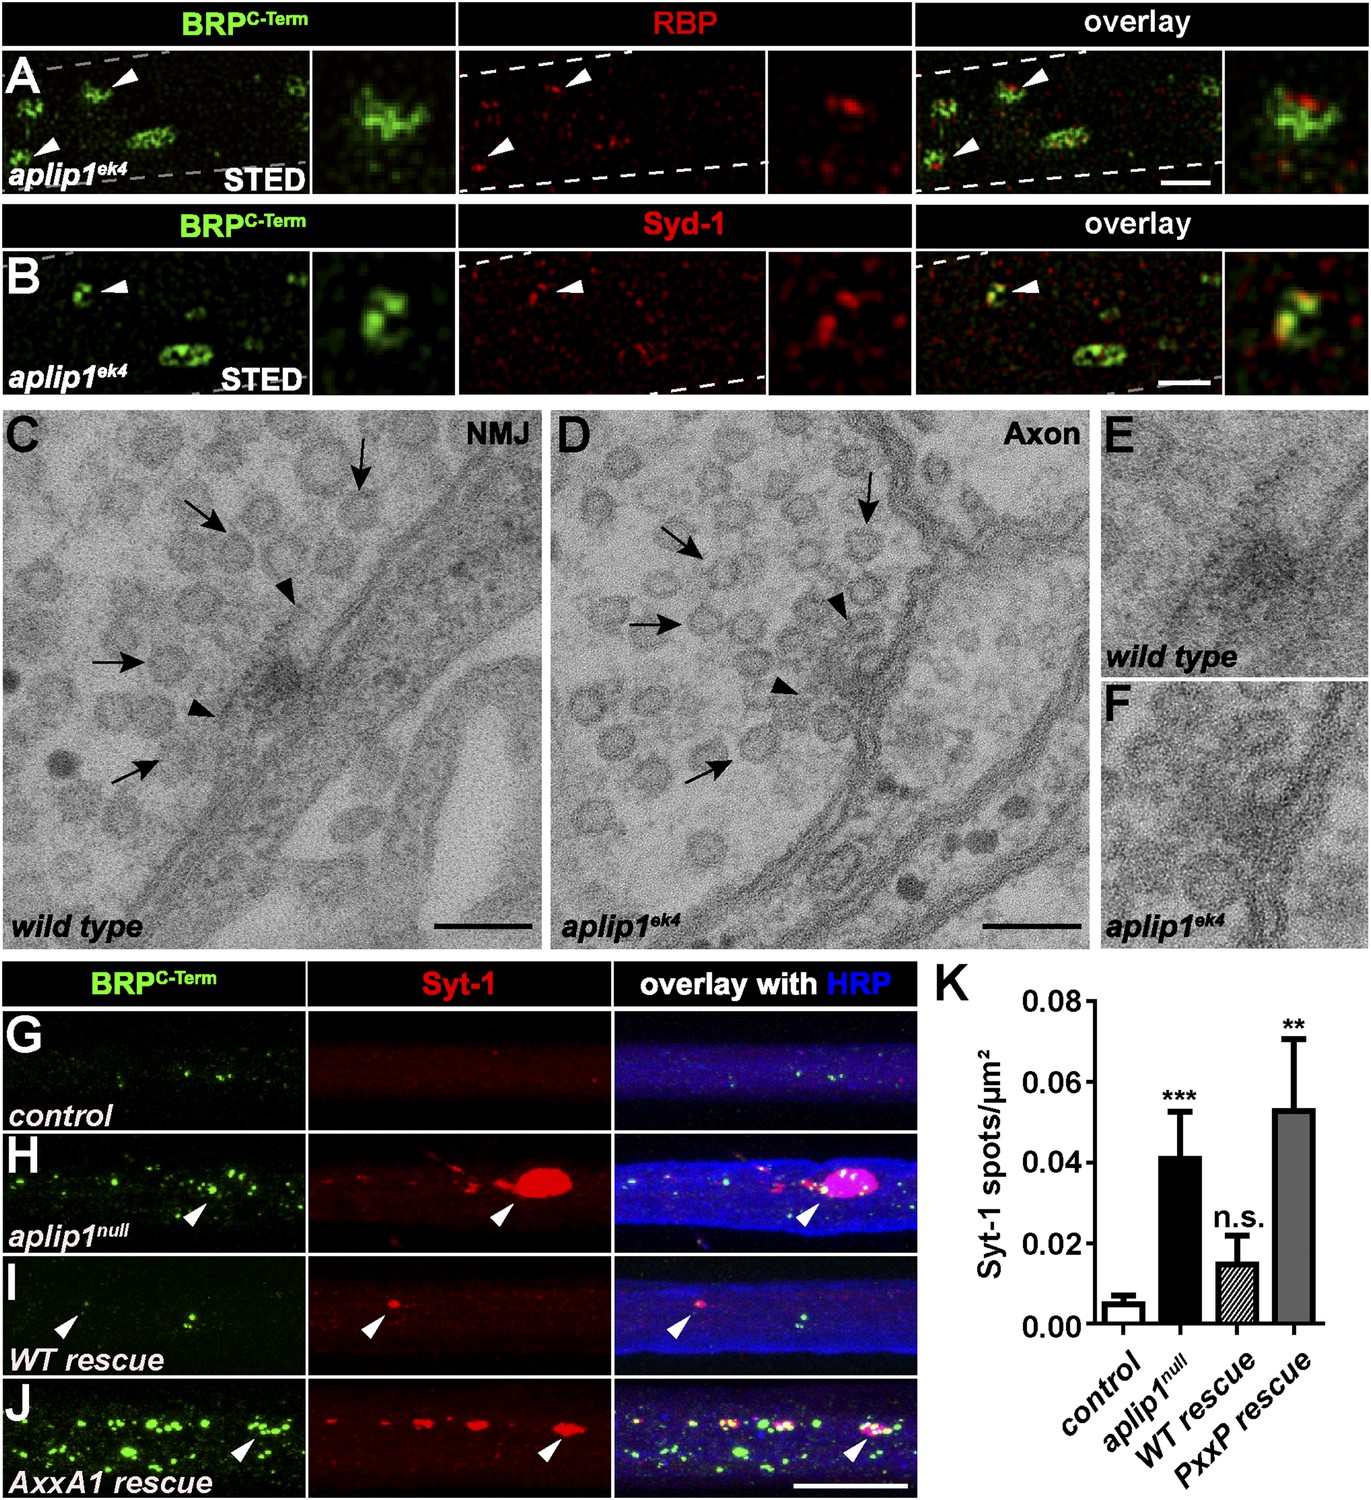
Ectopic AZ scaffold and synaptic vesicle (SV) accumulation in aplip1 mutant axons.
(A) Two-colour STED images of axonal aggregates in aplip1ek4 mutants revealed that the structures observed (arrow heads) have identical BRP and RBP arrangement, as recently observed at presynaptic AZs (Liu et al., 2011a). Right panels display magnifications of single axonal AZ. Dashed lines indicate axonal plasma membrane. (B) Two-colour STED images of axonal aggregates in aplip1ek4 mutants revealed that the structures observed (arrow head) have identical BRP and Syd-1 arrangement as observed at immature presynaptic AZs (Owald et al., 2010). Right panels display magnifications of single axonal AZ. Dashed lines indicate axonal plasma membrane. (C) Terminal T-bar (arrow heads) surrounded by SVs (arrows) taken from electron micrographs of WT third instar larvae after conventional embedding. (D) Ectopic axonal T-bar (arrow heads) taken from electron micrographs from aplip1ek4 mutant third instar larvae after conventional embedding. SVs accumulate around the ectopic T-bar (arrows). (E) Magnification of (C). (F) Magnification of (D). (G–J) Nerve bundles of segment A1–A3 from third instar larvae of the genotypes indicated labeled with the Abs indicated. Syt-1 accumulates at a subset of axonal BRP aggregations in aplip1null and AxxA1 rescue (H, J) larvae, but not in control and WT rescue larvae (G, I). (K) Quantification of the number of Syt-1 spots per µm2 axon. control (n = 12 nerves): 0.004 ± 0.002; aplip1null (n = 16 nerves): 0.040 ± 0.011; WT rescue (n = 13 nerves): 0.014 ± 0.007; AxxA1 rescue (n = 13 nerves): 0.052 ± 0.017. All panels show mean values and errors bars representing SEM. *p ≤ 0.05; **p ≤ 0.01; ***p ≤ 0.001; ns, not significant, p > 0.05, Mann–Whitney U test. Scale bars: (A, B) 500 nm; (C, D) 100 nm; (G, J) 10 µm.
Figure 7—figure supplement 1
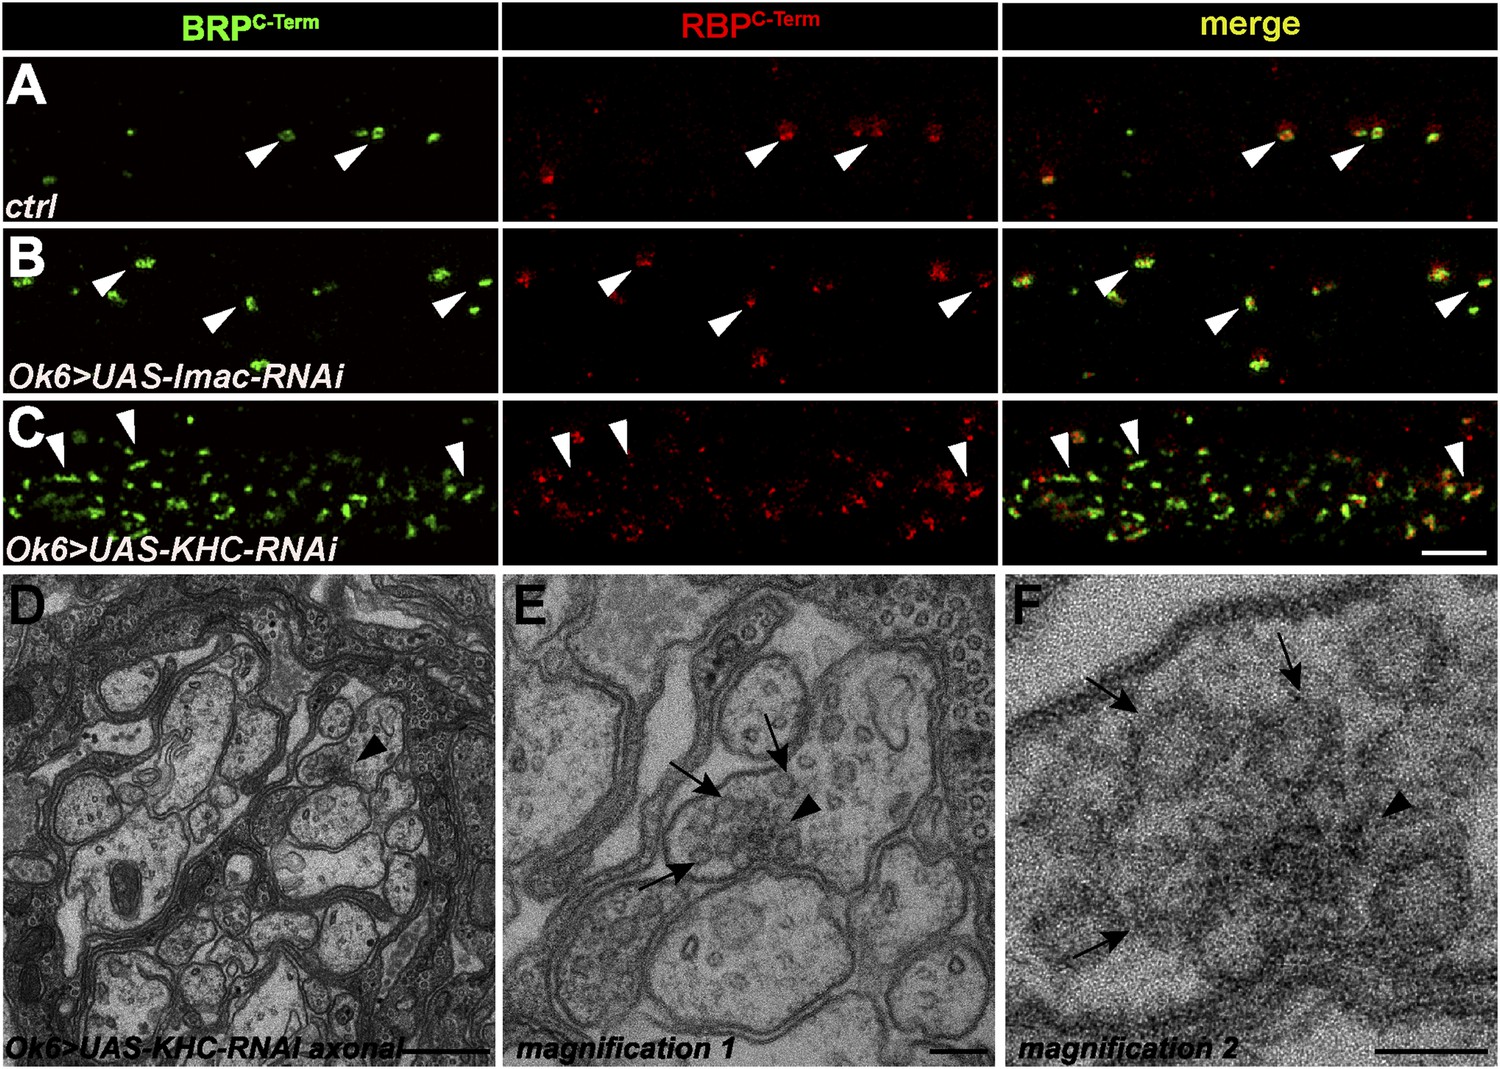
Ectopic AZ protein accumulations in motoneuronal driven Imac- and KHC-RNAi axons.
(A, B) Two-colour STED images of axonal aggregates in ctrl and Ok6::UAS-Imac-RNAi revealed that BRP and RBP co-accumulate in both genotypes but, in contrast to aplip1 mutants, show no preference concerning orientation towards the axonal plasma membrane (arrow heads). (C) Two-colour STED images of axonal aggregates in Ok6::UAS-KHC-RNAi revealed that the BRP-RBP accumulations observed in this genotype mostly show irregular shapes (arrow heads) with diverse orientations in the axon. (D) The only ectopic axonal electron dense formation (arrow head) found in electron micrographs in Ok6::UAS-KHC-RNAi third instar larvae after conventional embedding. (E, F) Magnification of (D). SVs (arrows) accumulate around the ectopic electron-dense structure (arrow head) but are also accumulating all along the axon. Scale bars: (A–C) 1.5 µm; (D) 200 nm; (E) 100 nm; (F) 50 nm.
Author response image 1
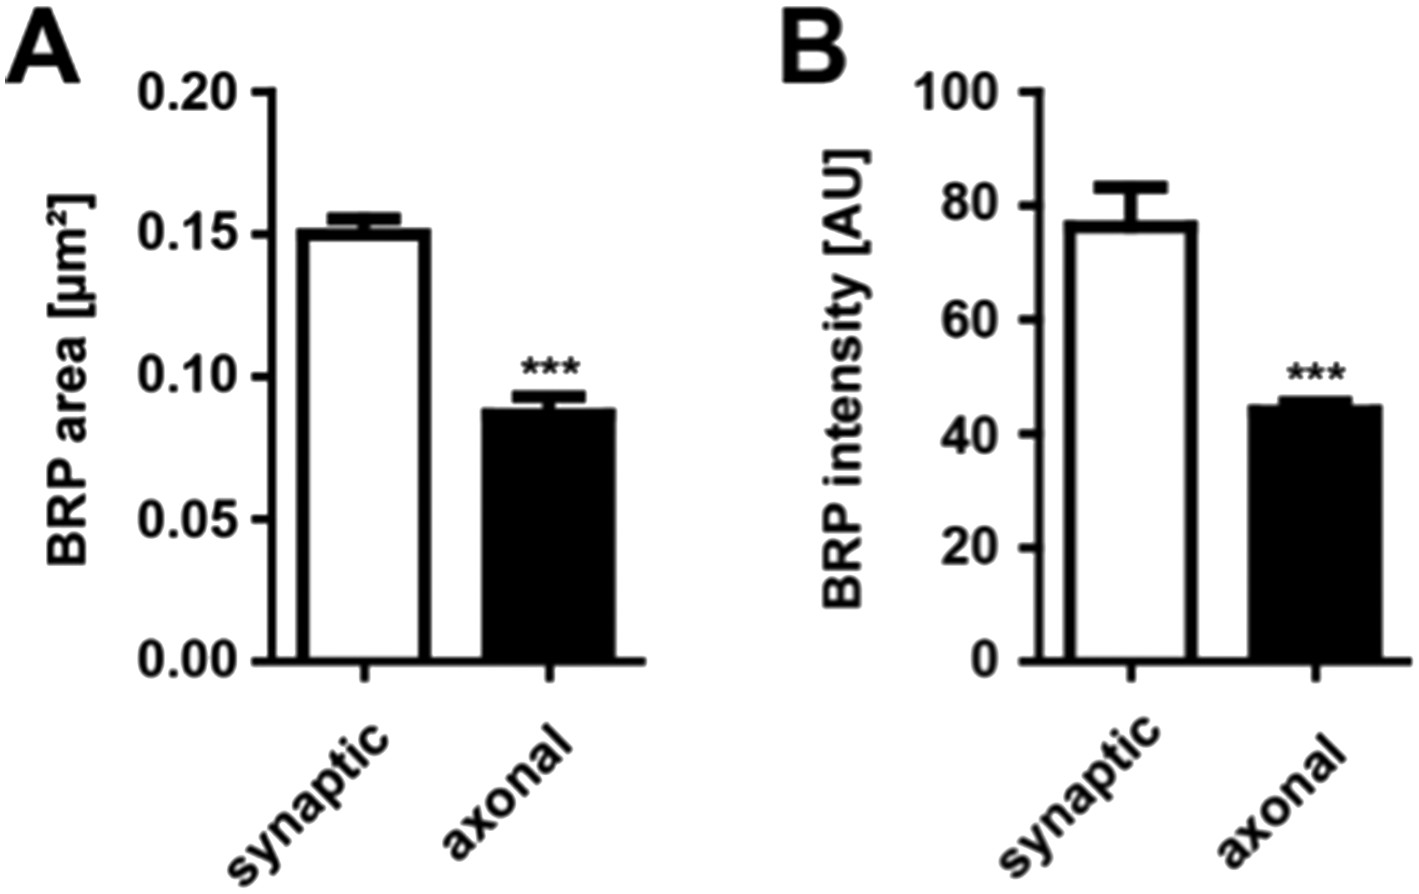
Comparison of synaptic vs. axonal BRP punctae
(A) Quantification of synaptic vs axonal BRP punctae size. Mean area of synaptic BRPC-term punctae 0.1499 ± 0.0055 µm² in WT; mean area of axonal BRPC-term punctae 0.08673 ± 0.0063 µm² in WT; n = 15 NMJs and 14 nerves. (B) Quantification of synaptic vs axonal BRP punctae intensity. Mean intensity of synaptic BRPC-term punctae 76.32 ± 6.02 AU in WT; mean intensity of axonal BRPC-term punctae 43.98 ± 1.55 AU in WT; n = 15 NMJs and 14 nerves. All panels show mean values and errors bars representing SEM. *, p ≤ 0.05; **, p ≤ 0.01; ***, p ≤ 0.001; ns, not significant, p > 0.05, Mann–Whitney U test.
Author response image 2
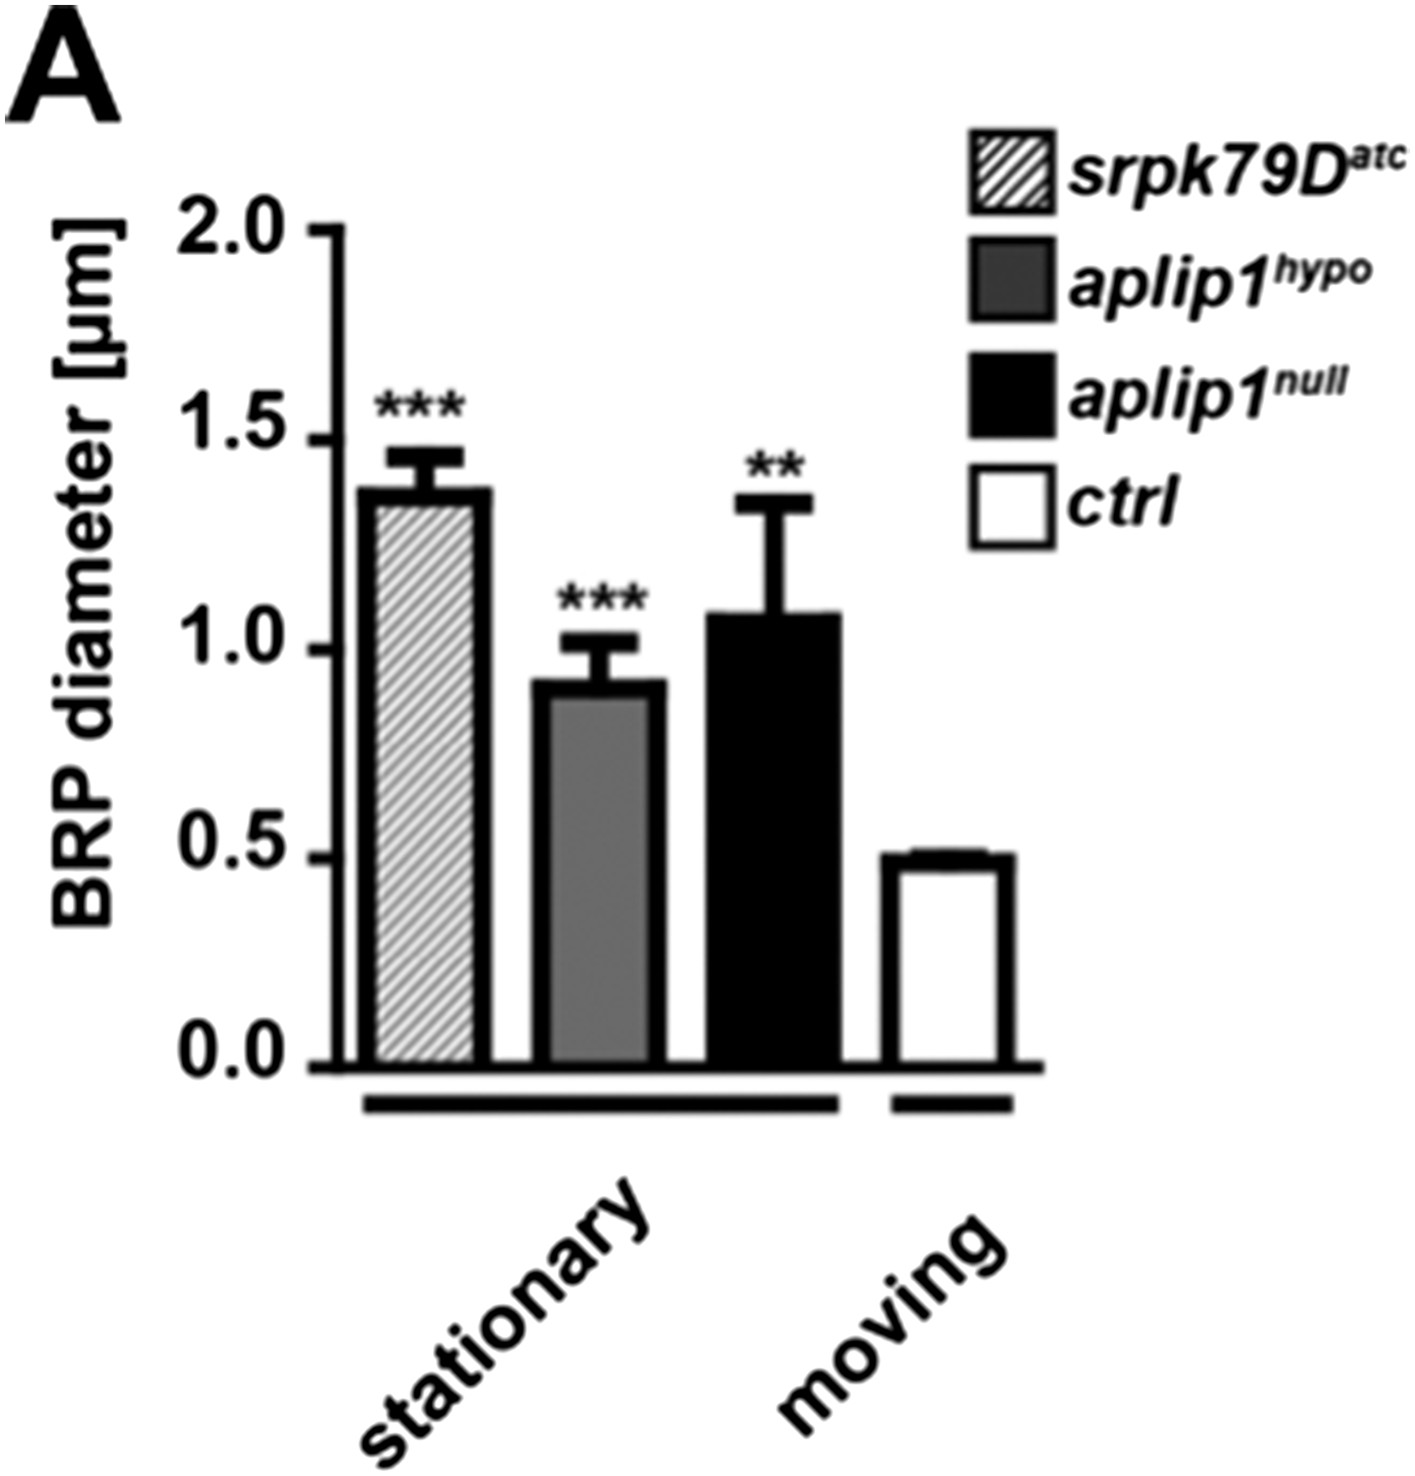
Comparison of moving vs. stationary axonal BRP punctae in aplip1 and srpk79D mutant animals.
(A) Quantification of mean diameter of moving vs stationary axonal BRP punctae. (Mean diameter of moving BRPD3−straw punctae of ctrl 0.491 ± 0.008 nm; n = 20; mean diameter of stationary BRPD3−straw punctae 1.066 ± 0.283 nm in aplip1null; n = 4; mean diameter of stationary BRPD3−straw punctae 0.907 ± 0.110 nm in aplip1hypo; n = 12; mean diameter of stationary BRPD3−straw punctae 1.363 ± 0.096 nm in srpk79Datc; n = 5; mean ± SEM). All panels show mean values and errors bars representing SEM. *, p ≤ 0.05; **, p ≤ 0.01; ***, p ≤ 0.001; ns, not significant, p > 0.05, one-way analysis of variance (ANOVA).
Videos
Video 1
Anterograde co-transport of BRPGFP and RBPcherry.
Live imaging in intact third instar larvae showed anterograde co-transport of BRPGFP and RBPcherry. Video was captured at 0.6 s per frame and played back at 7× real time.
Video 2
Anterograde co-transport of Aplip1GFP and RBPcherry.
Live imaging in intact third instar larvae showed anterograde co-transport of Aplip1GFP and RBPcherry. Video was captured at 0.6 s per frame and played back at 7× real time.
Video 3
Anterograde co-transport of Aplip1GFP and BRP-shortstraw.
Live imaging in intact third instar larvae showed anterograde co-transport of Aplip1GFP and BRP-shortstraw. Video was captured at 0.414 s per frame and played back at 5× real time.
Tables
Table 1
Data collection and refinement statistics
| Data collection | |||
| Structure | RBP SH3-II | RBP SH3-II | RBP SH3-III |
| Aplip1 | Cac | Cac | |
| PDB entry | 4Z88 | 4Z89 | 4Z8A |
| Space group | C2 | P21 | I222 |
| Wavelength (Å) | 0.91841 | 0.91841 | 0.91841 |
| Unit cell | |||
| a; b; c (Å) | 108.3; 62.4; 163.6 | 58.3; 122.2; 68.5 | 52.1; 54.3; 73.6 |
| α; β; γ (°) | 90.0; 90.3; 90.0 | 90.0; 113.2; 90.0 | 90.0; 90.0; 90.0 |
| Resolution (Å)* | 50.00–2.09 | 50.00–2.64 | 50.00–1.75 |
| (2.19–2.09) | (2.74–2.64) | (1.86–1.75) | |
| Unique reflections | 64,269 (7760) | 25,229 (2591) | 10,690 (1579) |
| Completeness* | 98.9 (92.4) | 96.9 (95.0) | 98.7 (92.6) |
| <I/σ(I)>* | 7.7 (2.6) | 8.0 (2.1) | 14.2 (2.2) |
| Rmeas*, † | 0.127 (0.533) | 0.157 (0.726) | 0.127 (0.663) |
| CC1/2* | 99.1 (68.0) | 98.9 (81.2) | 99.7 (76.5) |
| Redundancy* | 3.7 (3.7) | 3.5 (3.2) | 5.6 (3.1) |
| Refinement | |||
| Non-hydrogen atoms | 7564 | 6239 | 850 |
| Rwork*, ‡ | 0.210 (0.314) | 0.255 (0.367) | 0.159 (0.233) |
| Rfree*, § | 0.236 (0.396) | 0.312 (0.490) | 0.208 (0.332) |
| Average B-factor (Å2) | 40.8 | 52.10 | 18.8 |
| No. of complexes | 24 | 10 | 1 |
| Protein residues | 6484/41.0 | 663/51.1 | 74/17.6 |
| Peptide residues | 861/42.7 | 92/63.6 | 15/15.9 |
| Buffer molecules | 11/40.2 | 1/46.3 | – |
| Water molecules | 57/29.6 | 134/30.3 | 110/28.6 |
| r.m.s.d.# | |||
| bond length (Å) | 0.007 | 0.005 | 0.010 |
| bond angles (°) | 1.224 | 1.140 | 1.210 |
| Ramachandran outliers (%) | 0.1 | 0.56 | 0 |
| Ramachandran favoured (%) | 98.4 | 98.0 | 100 |
-
*
values in parentheses refer to the highest resolution shell.
-
†
Rmeas = Σh [n/(n − 1)]1/2 Σi|Ih − Ih,i|/ΣhΣiIh,i where Ih is the mean intensity of symmetry-equivalent reflections and n is the redundancy.
-
‡
Rwork = Σh|Fo − Fc|/ΣFo (working set, no σ cut-off applied).
-
§
Rfree is the same as Rwork, but calculated on 5% of the data excluded from refinement.
-
#
Root-mean-square deviation (r.m.s.d.) from target geometries.
-
CC, coiled coil.
Table 2
Completeness of the model for RBP SH3-II and bound Aplip1 peptide
| RBP SH3-II | Range | Aplip1 | Range |
|---|---|---|---|
| chain A | 1318–1382 | chain M | 153–163 |
| chain B | x1318–1382 | chain N | 155–159 |
| chain C | x1318–1381 | chain O | 154–163 |
| chain D | x1318–1382 | chain P | 153–159 |
| chain E | 1319–1381 | chain Q | 151–163 |
| chain F | x1318–1380 | chain R | 153–159 |
| chain G | x1318–1381 | chain S | 151–163 |
| chain H | x1318–1382 | chain T | 152–156 |
| chain I | x1318–1382 | chain U | 152–163 |
| chain J | x1318–1381 | chain V | 152–158 |
| chain K | x1318–1381 | chain W | 152–163 |
| chain L | x1318–1381 | chain X | 152–158 |
-
Completeness of the model given for the 12 complexes of RBP SH3-II bound to the Aplip1 peptide 149TRRRRKLPEIPKNKK163. Superscript ‘x’ indicates additional N-terminal residues of RBP SH3-II originating from the linker region between the protease cleavage site and the N-terminus.
Table 3
Hydrogen bonding interaction
| Aplip1 | SH3-II | Distance |
|---|---|---|
| Arg153N | Asp1359OD2 | 2.4 |
| Arg153NH2 | Asp1336OD1 | 3.0 |
| Arg153NH2 | Asp1336OD2 | 2.6 |
| Lys154N | Asn1334OD1 | 2.9 |
| Lys154O | Asn1334ND2 | 3.0 |
| Pro156O | Asn1376ND2 | 2.8 |
| Cac | SH3-II | Distance |
|---|---|---|
| Gly1686N | Asp1359OD2 | 2.7 |
| Arg1687N | Asp1359OD2 | 2.8 |
| Arg1688N | Asn1334OD1 | 3.0 |
| Arg1688O | Asn1334ND2 | 2.9 |
| Pro1690O | Asn1376ND2 | 2.8 |
| Cac | SH3-III | Distance |
|---|---|---|
| Arg1687NH1 | Asp1463OD1 | 2.9 |
| Arg1687NH1 | Glu1488OE2 | 3.0 |
| Arg1687NH2 | Glu1488OE2 | 3.1 |
| Arg1688N | Asn1461OD1 | 2.8 |
| Arg1688O | Asn1461ND2 | 3.0 |
| Pro1690O | Asn1376ND2 | 2.9 |
| Thr1692OG | Asn1376ND2 | 2.9 |
| Lys1695O | Tyr1451OH | 2.8 |
| Ser1697OG | Leu1450O | 2.7 |
-
Hydrogen bonding interaction of RBP SH3-II with Aplip1 and Cac, as well as RBP SH3-III in complex with Cac. Distance ≤3.2 Å are given in Å.
Table 4
Completeness of the model for RBP SH3-II and bound Cac peptide
| RBP SH3-II | Range | Cac | Range |
|---|---|---|---|
| chain A | 1318–1381 | chain a | 1686–1697 |
| chain B | x1318–1381 | chain b | 1686–1695 |
| chain C | x1318–1382 | chain c | 1686–1697 |
| chain D | x1318–1381 | chain d | 1686–1697 |
| chain E | 1318–1382 | chain e | 1685–1694 |
| chain F | x1318–1382 | chain f | 1685–1693 |
| chain G | x1318–1382 | chain g | 1686–1693 |
| chain H | 1318–1381 | chain h | 1686–1693 |
| chain I | x1318–1381 | chain i | 1686–1693 |
| chain J | x1318–1382 | chain j | 1686–1697 |
-
Completeness of the model given for the six complexes of RBP SH3-II and the bound Cac peptide 1685IGRRLPPTPSKPSTL1699. Superscript ‘x’ indicates additional N-terminal residues of RBP SH3-II originating from the linker region between the protease cleavage site and the N-terminus.
Download links
A two-part list of links to download the article, or parts of the article, in various formats.
Downloads (link to download the article as PDF)
Open citations (links to open the citations from this article in various online reference manager services)
Cite this article (links to download the citations from this article in formats compatible with various reference manager tools)
A high affinity RIM-binding protein/Aplip1 interaction prevents the formation of ectopic axonal active zones
eLife 4:e06935.
https://doi.org/10.7554/eLife.06935


