KRAS-dependent sorting of miRNA to exosomes
- Vanderbilt University Medical Center, United States
- Vanderbilt University, United States
- Affairs Medical Center, United States
- HudsonAlpha Institute for Biotechnology, United States
Figures
Figure 1 with 1 supplement
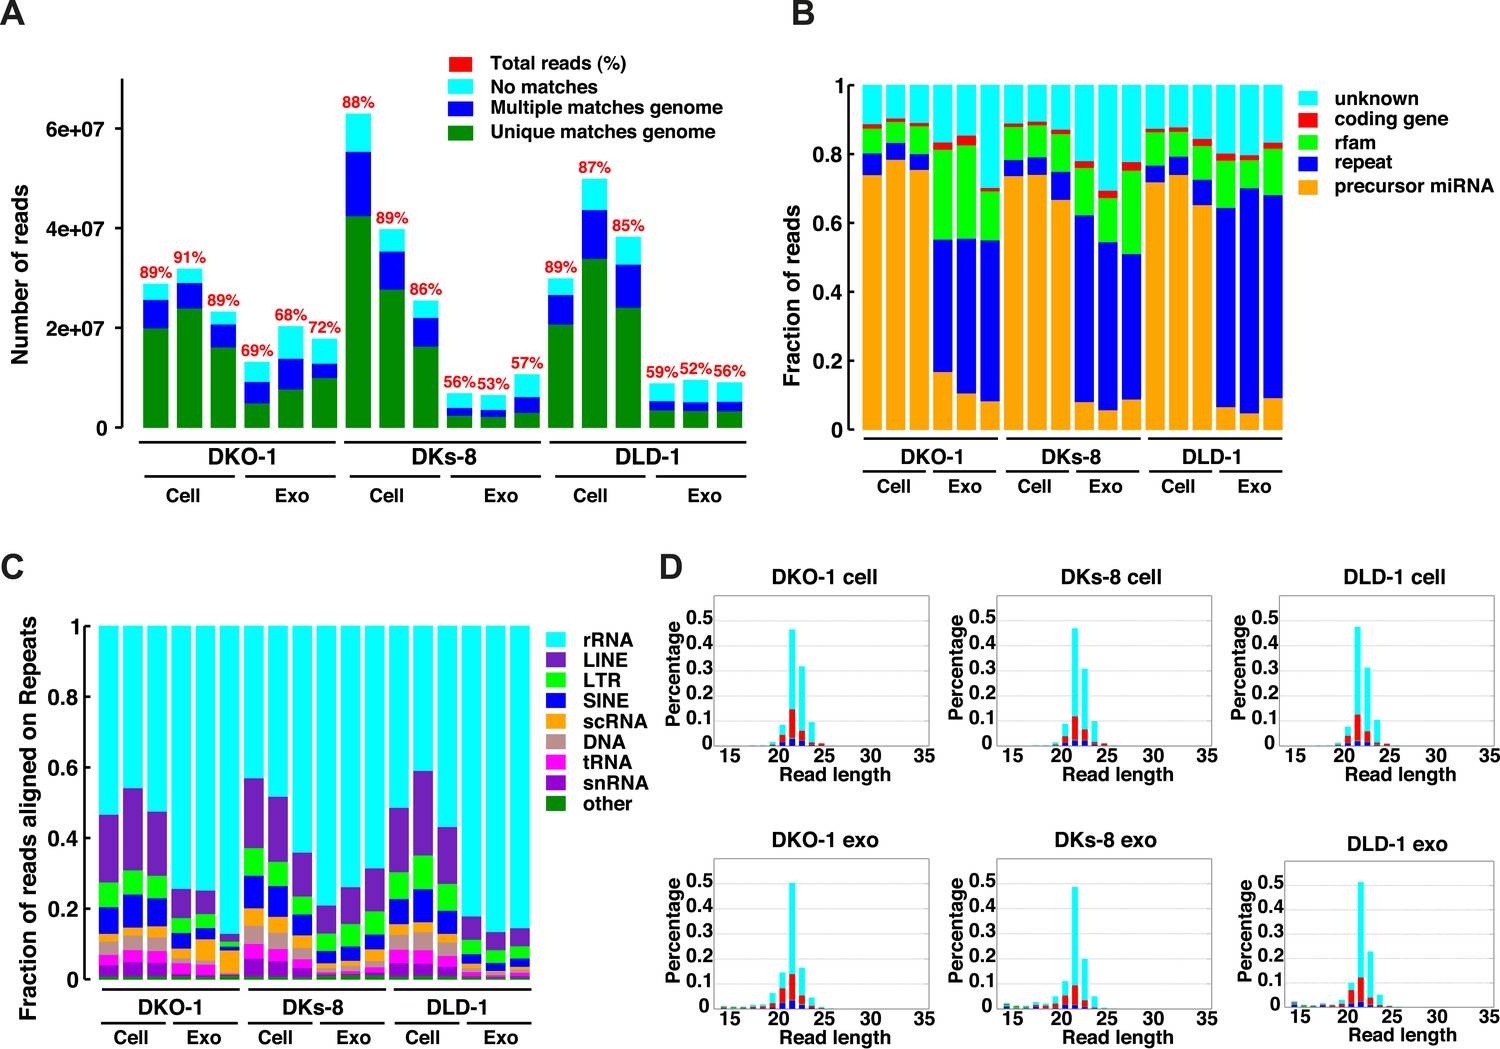
Small RNA sequencing analysis of cellular and exosomal RNAs from CRC cell lines.
Shown are (A) total read numbers (y-axis) and the total percentage of mappable reads (red), percentage of unique mappable reads (green), reads that map to multiple genomic locations (dark blue), and those that could not be mapped (cyan). (B) The majority of mappable small RNA reads were derived from noncoding RNAs in cells and exosomes. In cells, the majority of small RNA reads mapped to microRNAs (miRNAs) (miRbase 19), whereas in exosomes, the majority of small RNA reads mapped to repetitive elements. (C) The origin of repetitive reads from exosomal small RNA sequencing is shown. Repeat reads were annotated based on RepeatMasker and Rfam classified into tRNAs, rRNAs, snRNAs, and others. (D) The length distribution of reads mapping to miRNA hairpins was determined for small RNA reads from the three CRC cell lines and their purified exosomes. Colors represent the nucleotides identified for the 5′ base, T (cyan), A (red), G (green), and C (blue). Figure 1—figure supplement 1.
-
Figure 1—source data 1
Colorectal cancer (CRC) cell lines.
Small RNA sequencing libraries were prepared from three isogenic CRC cell lines with the indicated alleles of KRAS. Table is based on work done in Demory Beckler et al. (2013).
- https://doi.org/10.7554/eLife.07197.004
Figure 1—figure supplement 1

Length distribution of small RNA reads to genome.
The small RNA read length distribution from serum-starved cells and from purified exosomes was determined, as well as the 5′ nucleotide from each read. The pattern from total cellular small RNA is consistent with primarily miRNA reads, the distribution from exosomes is much broader, encompassing a number of small reads derived from many sources (see Figure 1C,D). Colors represent the nucleotides identified for the 5′ base, T (cyan), A (red), G (green), and C (blue).
Figure 2 with 4 supplements

Small RNA composition segregates with KRAS status.
Principal component analysis was performed comparing small RNA sequencing data sets from CRC cells and exosomes. The small RNA composition from cells differed significantly from exosomes. Nevertheless, clustering showed that mutant KRAS status could be inferred from small RNA composition. Also see Figure 2—figure supplements 1–4.
Figure 2—figure supplement 1
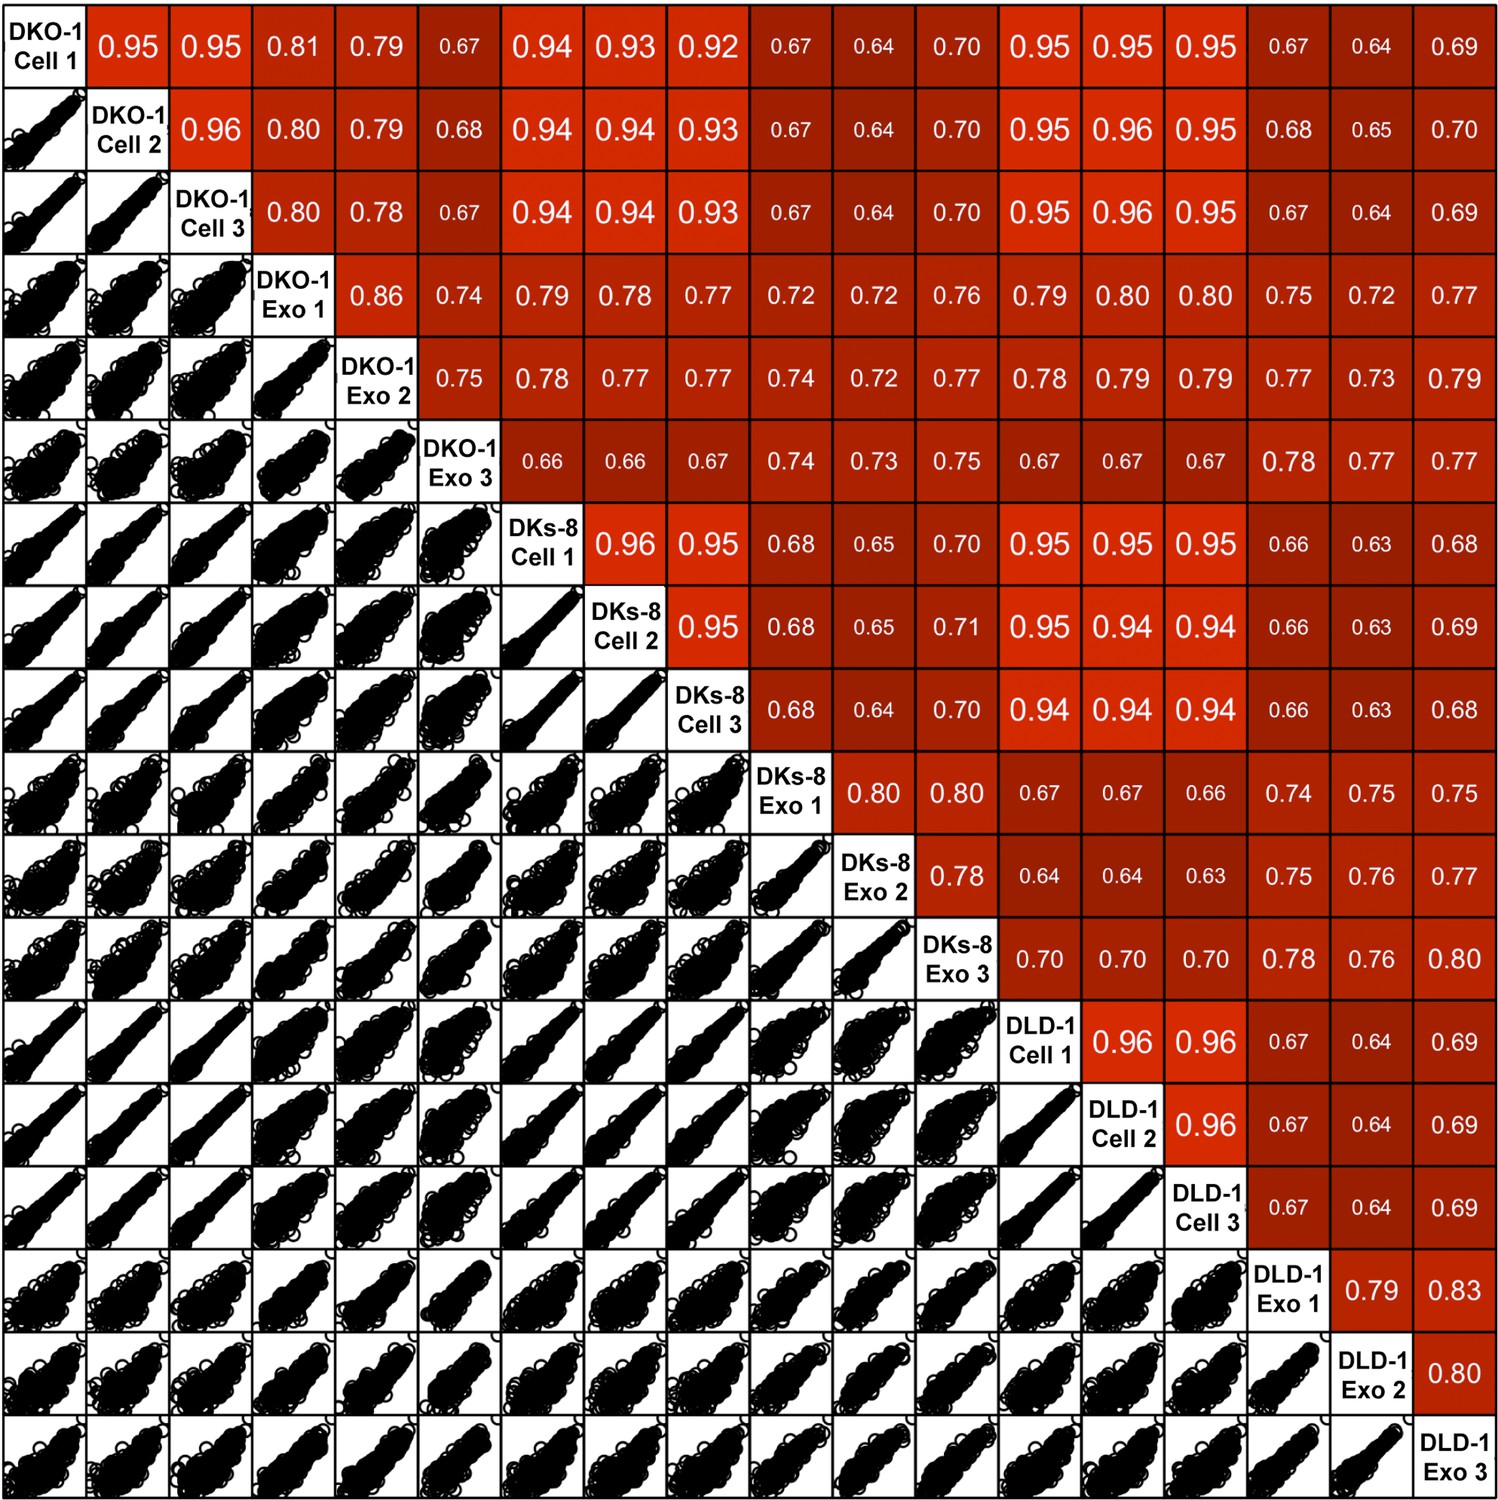
Spearman correlations between miRNA expression profiles in cells and exosomes.
Pairwise similarity between the RNA sequencing data sets derived from cells and exosomes. Spearman correlations are shown between the cell samples (R = 0.93–0.96), between exosomes and cognate cells (R = 0.64–0.83) and between exosome samples (R = 0.74–0.86). Results were generated using the DESeq ‘pooled’ method.
Figure 2—figure supplement 2
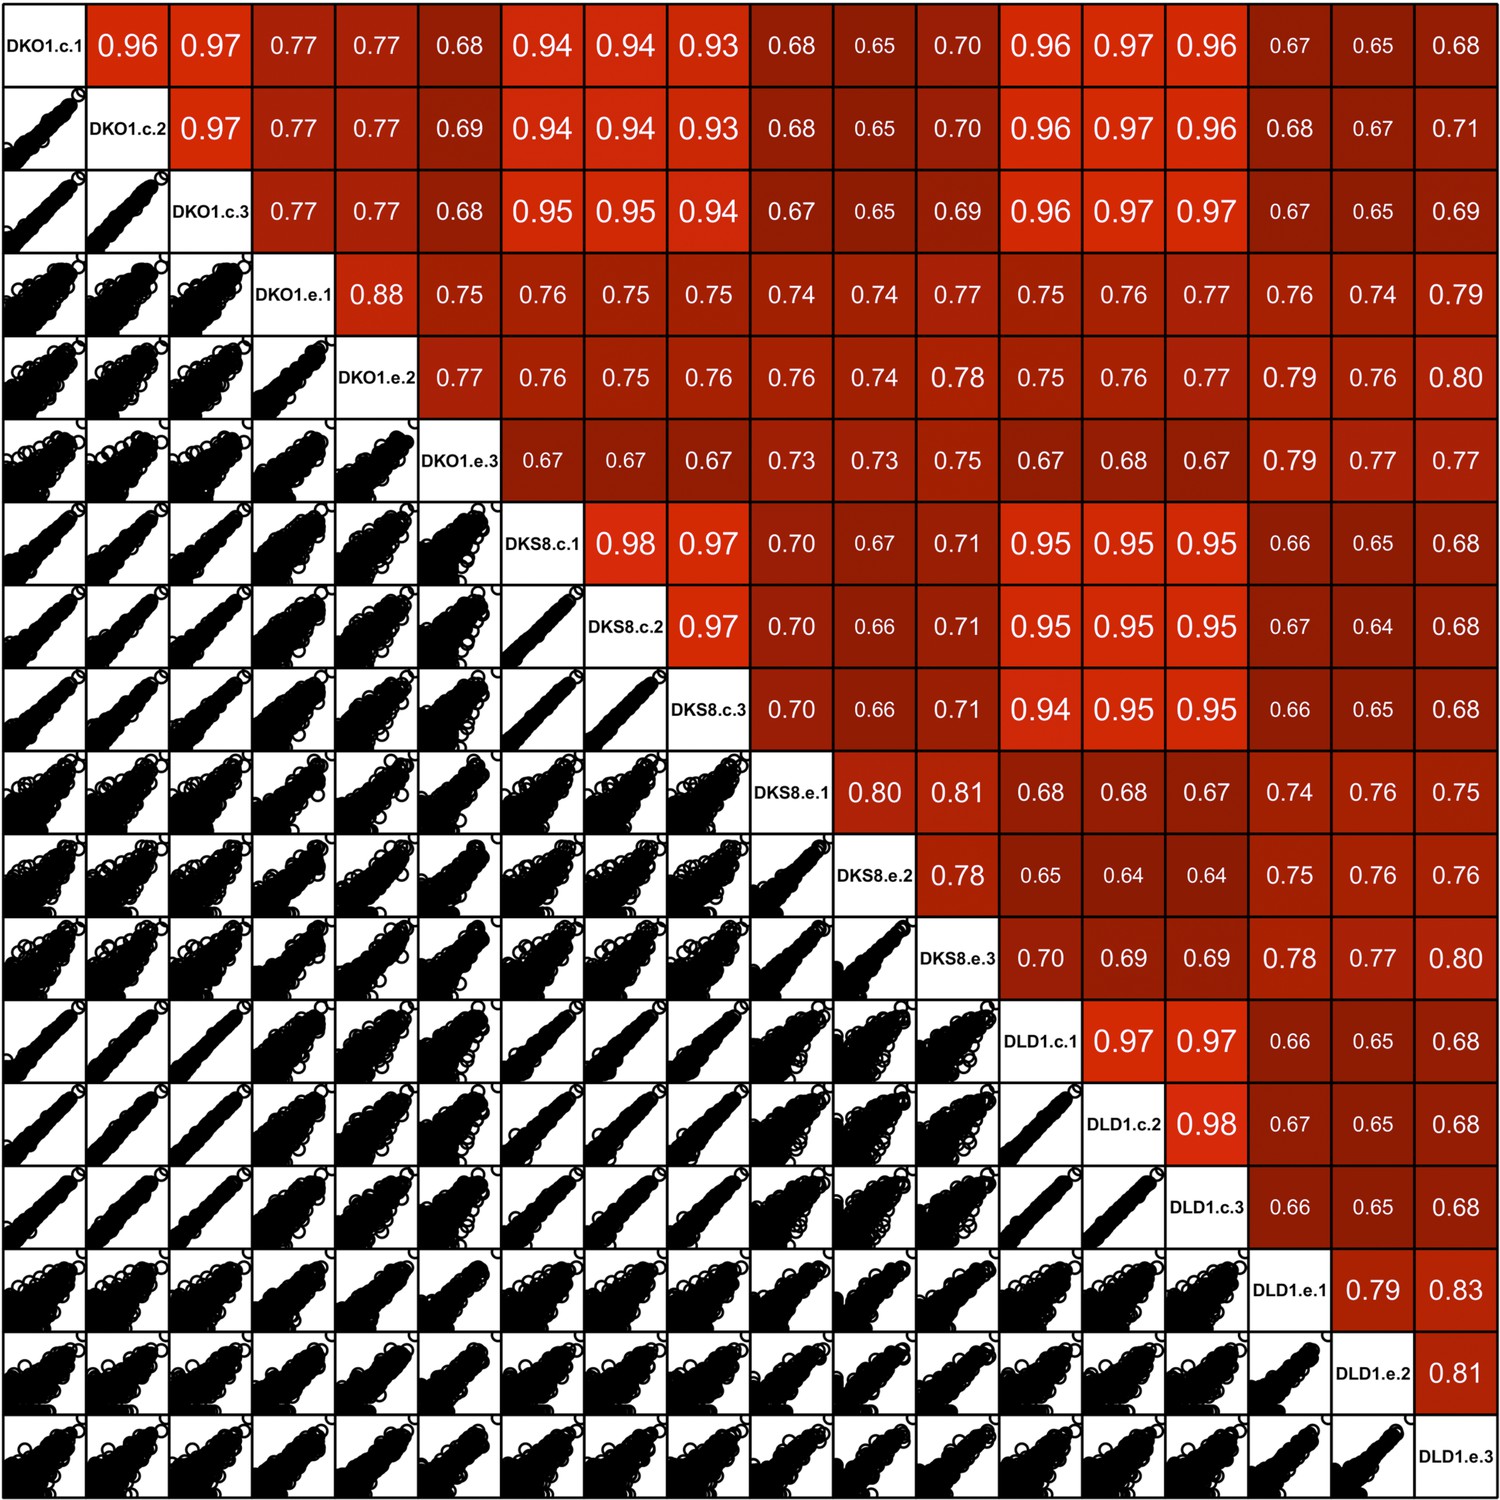
Spearman correlations between miRNA expression profiles in cells and exosomes.
Similar to supplemental Figure 2A. Differential analysis using the DESeq ‘per condition’ method.
Figure 2—figure supplement 3

Spearman correlations between miRNA expression profiles in cells (top) and exosomes (bottoms) in reads per million (RPM).
https://doi.org/10.7554/eLife.07197.009
Figure 2—figure supplement 4
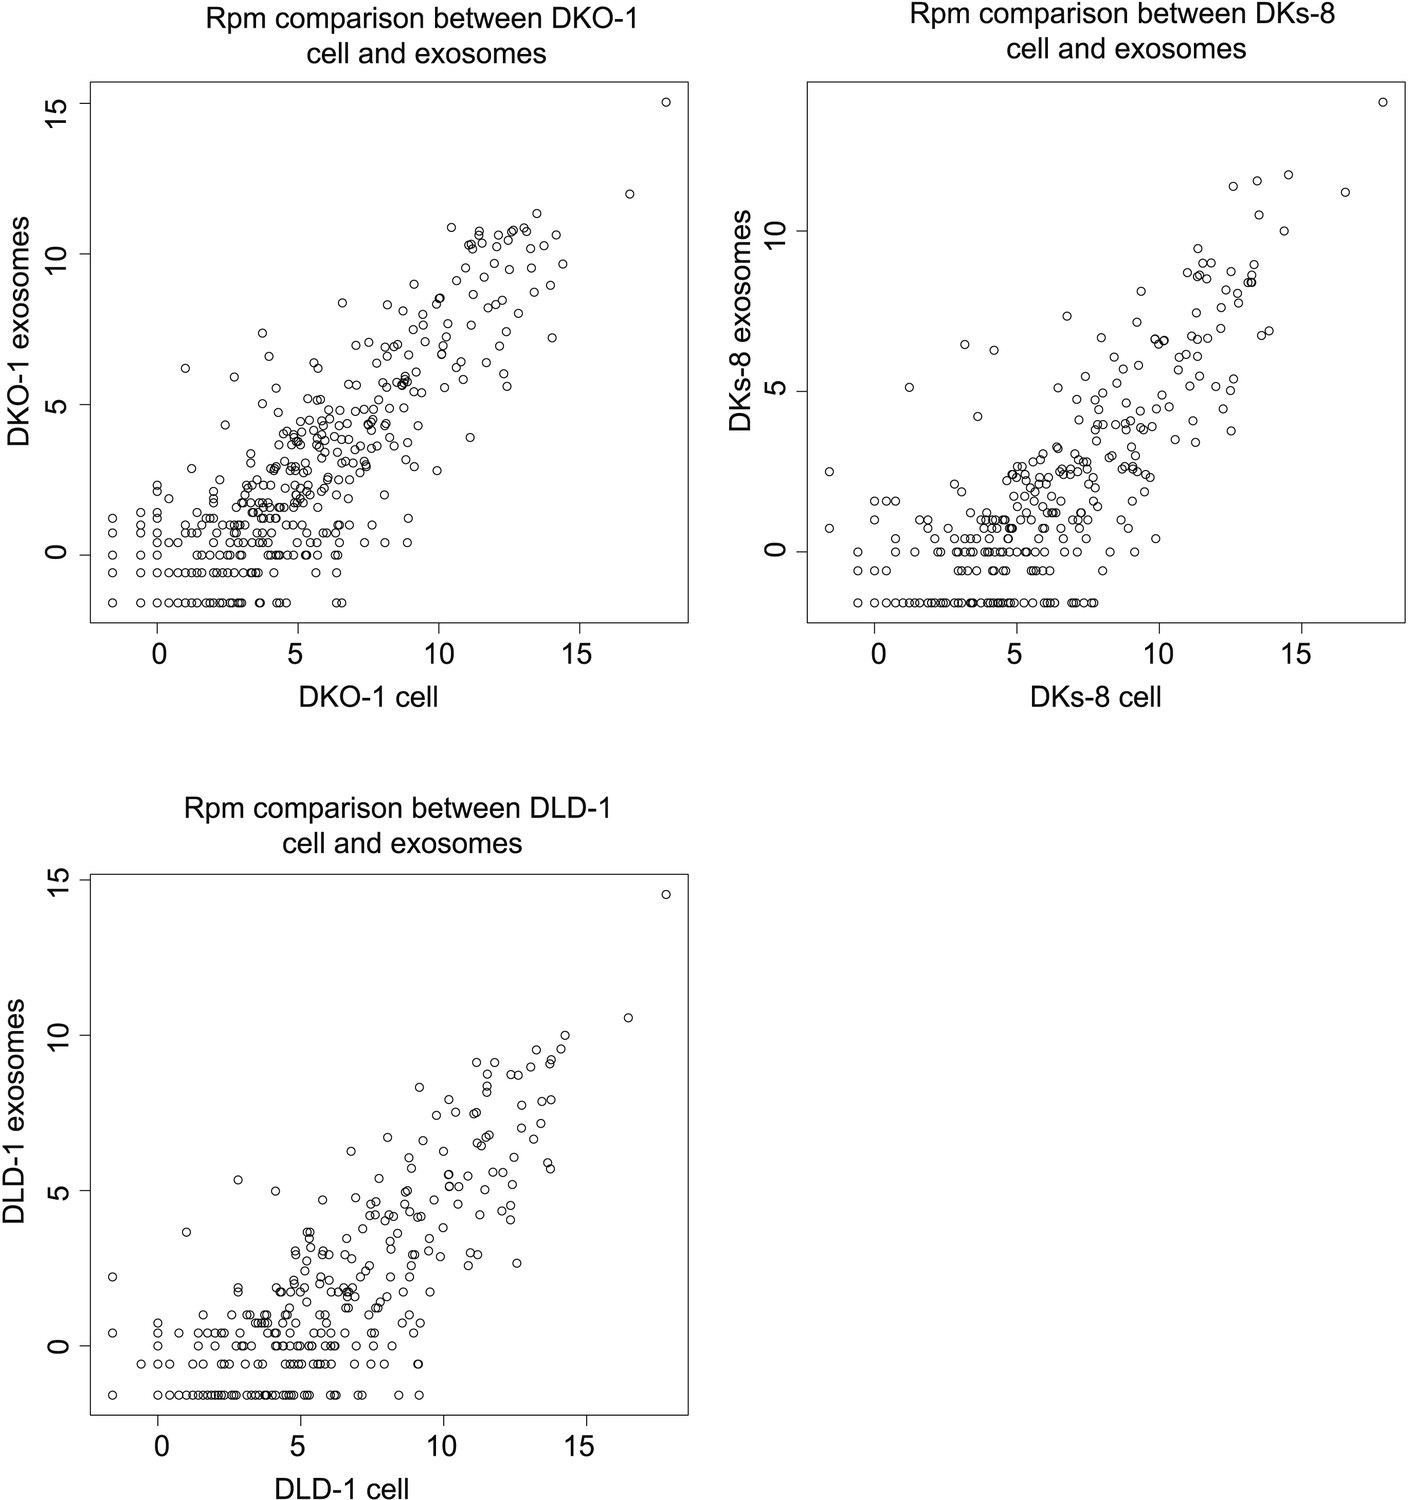
Spearman correlations comparing miRNA expression profiles in exosomes to parent cell in RPM.
https://doi.org/10.7554/eLife.07197.010
Figure 3
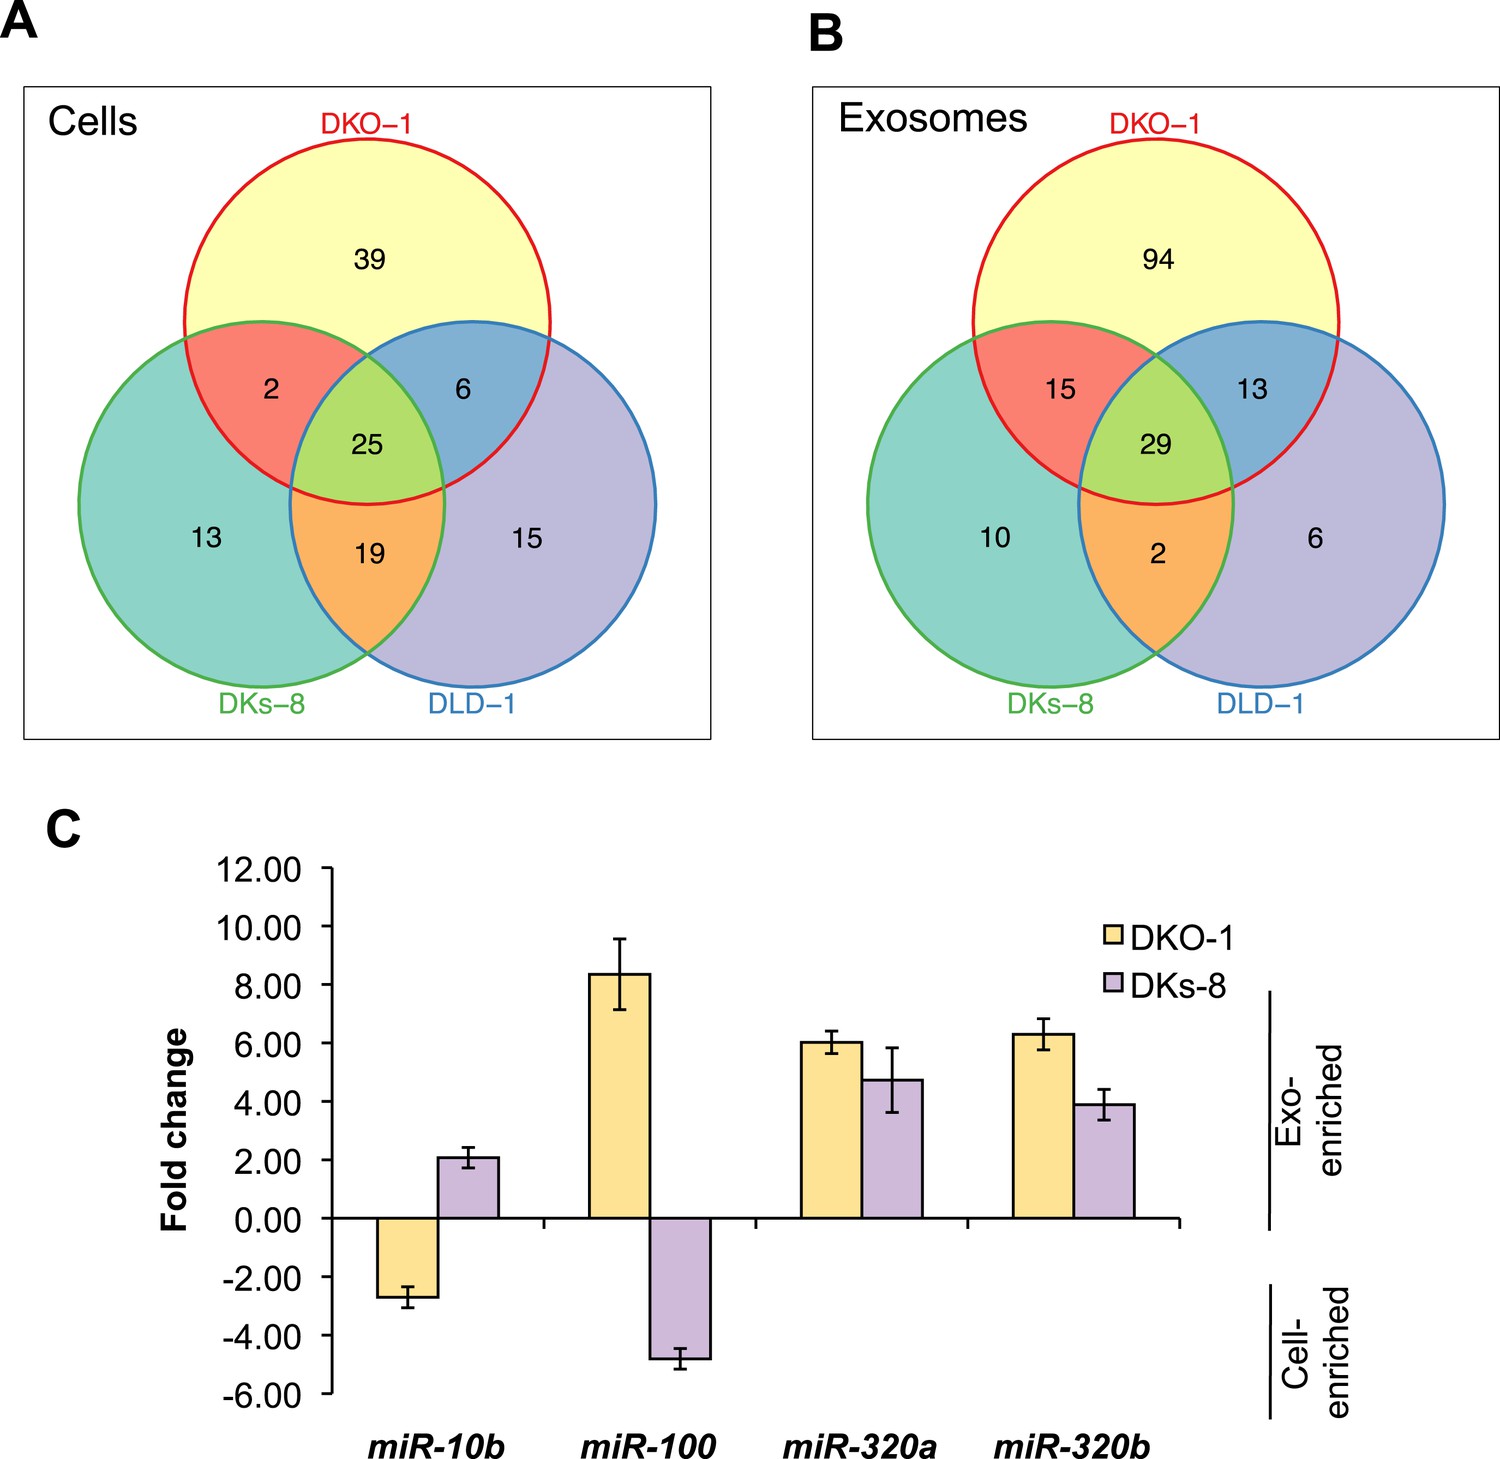
KRAS-dependent regulation of miRNAs in exosomes and cells.
Differentially distributed miRNAs in (A) cells and (B) exosomes from the three CRC cell lines differing in KRAS status. (C) qRT-PCR validation of selected miRs from DKs-8 and DKO-1 cellular and exosomal RNA samples normalized to U6 snRNA. Fold changes were calculated using the ΔΔC(t) method comparing exosomes to cells. Negative fold changes indicate greater enrichment in cells, and positive fold changes indicate greater enrichment in exosomes. Also see Supplementary file 2.
Figure 4 with 3 supplements

Comparison of miRNA 3′ trimming and tailing between cells and exosomes.
Data from the heat maps shown in Figure 4—figure supplement 2 were pooled to illustrate overall changes in either 3′ nucleotide additions (tailing) or 3′ resection (trimming) compared to full length miRNA sequences (intact). Overall, the patterns between cells and between exosomes are very similar. A comparison of cells to exosomes shows that exosomes display a slight increase in trimmed miRNAs. Also see Figure 4—figure supplement 2.
Figure 4—figure supplement 1
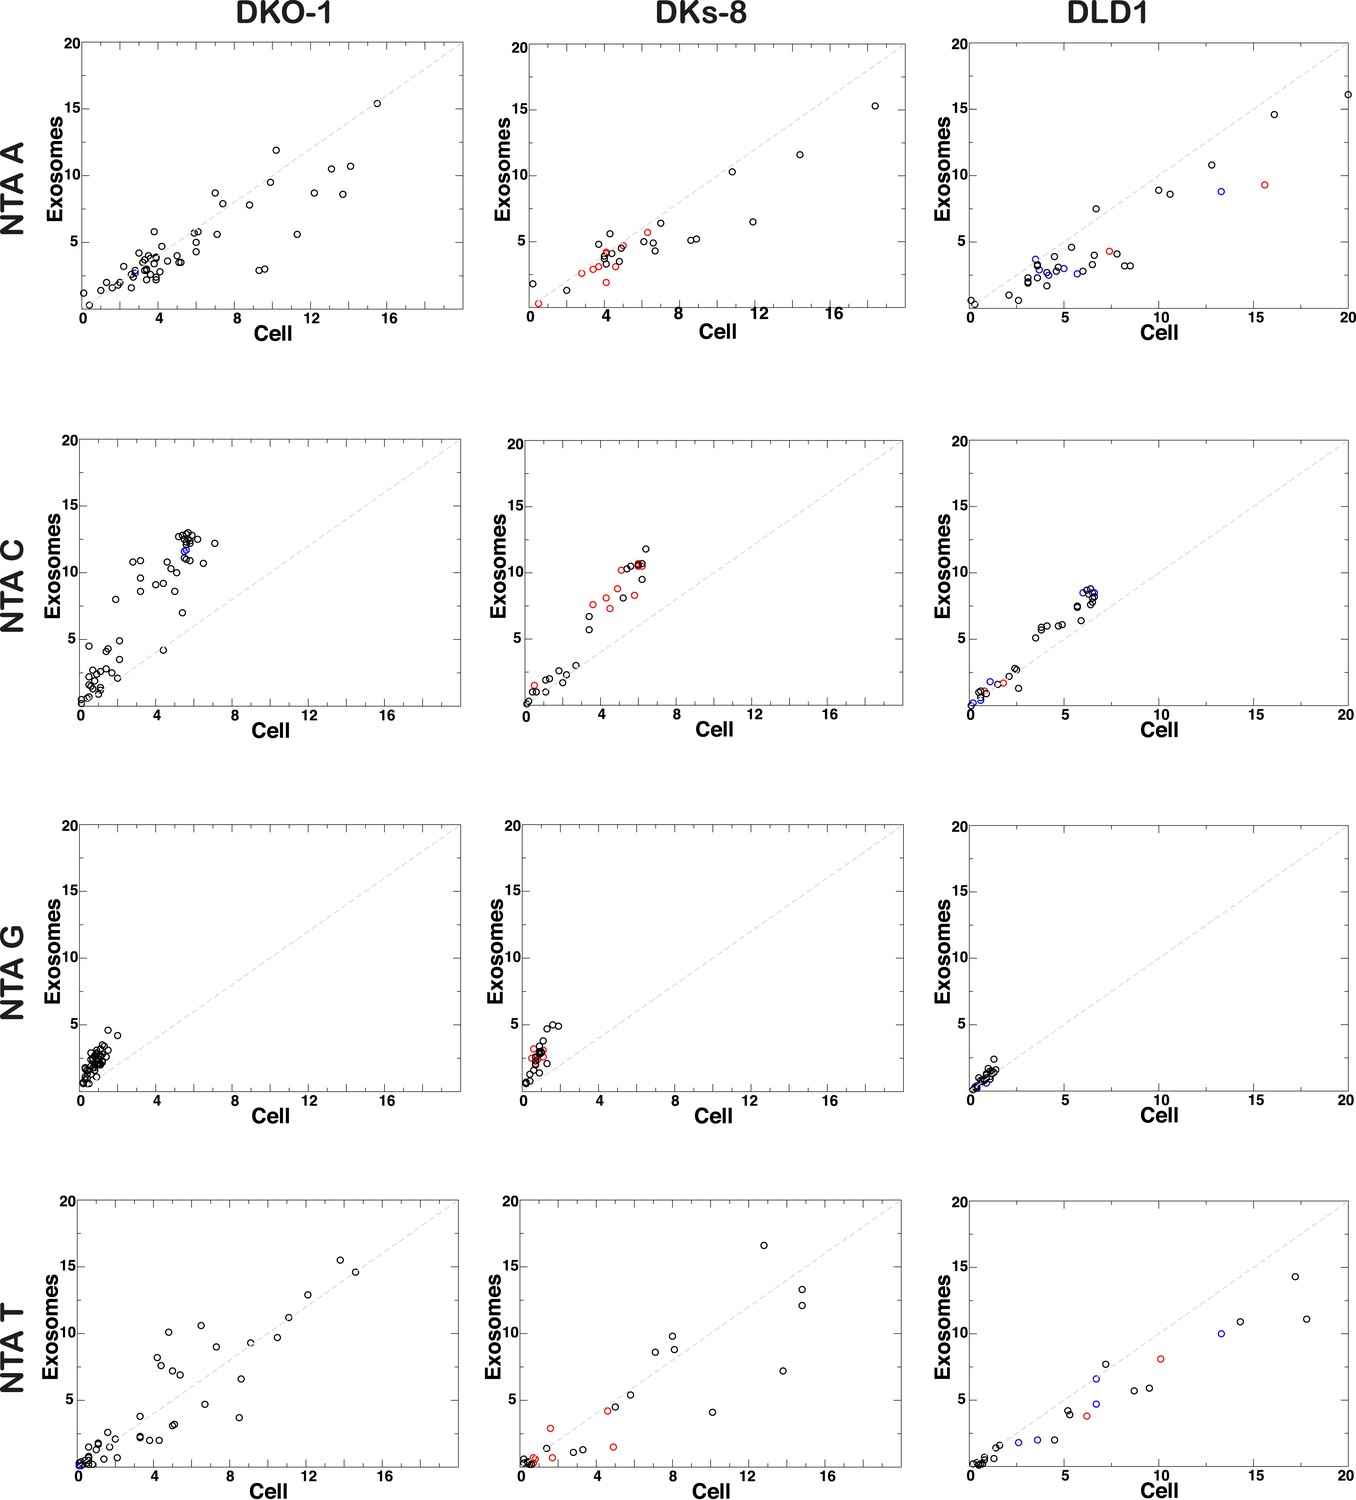
Non-templated addition (NTA) of nucleotides to 3′ ends of miRNAs.
3′ NTA of A-tailed miRNAs is enriched in cells independent of KRAS status, whereas NTA of C residues are more abundant in wild-type KRAS DKs-8 exosomes. miRNAs with read counts ≥500 reads in both cells and exosomes were used in the analysis. Reads mapping to hairpin sequences were considered as templated miRNAs (untrimmed). Reads ≥18 nucleotides that did not map to hairpin or genome sequences were trimmed one nucleotide at the 3′-termini and mapped again to hairpin sequences. This was repeated three times to account for NTA's extending up to three nucleotides from the 3′-terminus. miRNAs significantly enriched in exosomes or cells are represented by red and blue circles, respectively.
Figure 4—figure supplement 2

Comparison of miRNA 3′ trimming and tailing between cells and exosomes.
Heat maps show the extent of either 3′ nucleotide additions (tailing) or 3′ resection (trimming) compared to full-length miRNA sequences (intact).
Figure 4—figure supplement 3

MEME analysis of miRNA sequence in exosomes.
MEME analysis was performed to attempt to identify sequence motifs that might target miRNAs for export into exosomes. The top most abundant motifs found in miRNAs in Tables 1, 2 are shown for both cells and exosomes from DKO-1, DKs-8, or DLD-1 cell lines. (Upregulated in DKO-1 exo: 51, 1.5e-009; Upregulated in DKO-1 cell: 28,1.5e-007; Upregulated in DKs-8 exo, 22, 1.7e-010; Upregulated in DKs-8 cell, 19, 7.6e-007; Upregulated in DLD-1 exo, 8, 2.3e-003; Upregulated in DLD-1 cell 23, 3.3e-012).
Figure 5
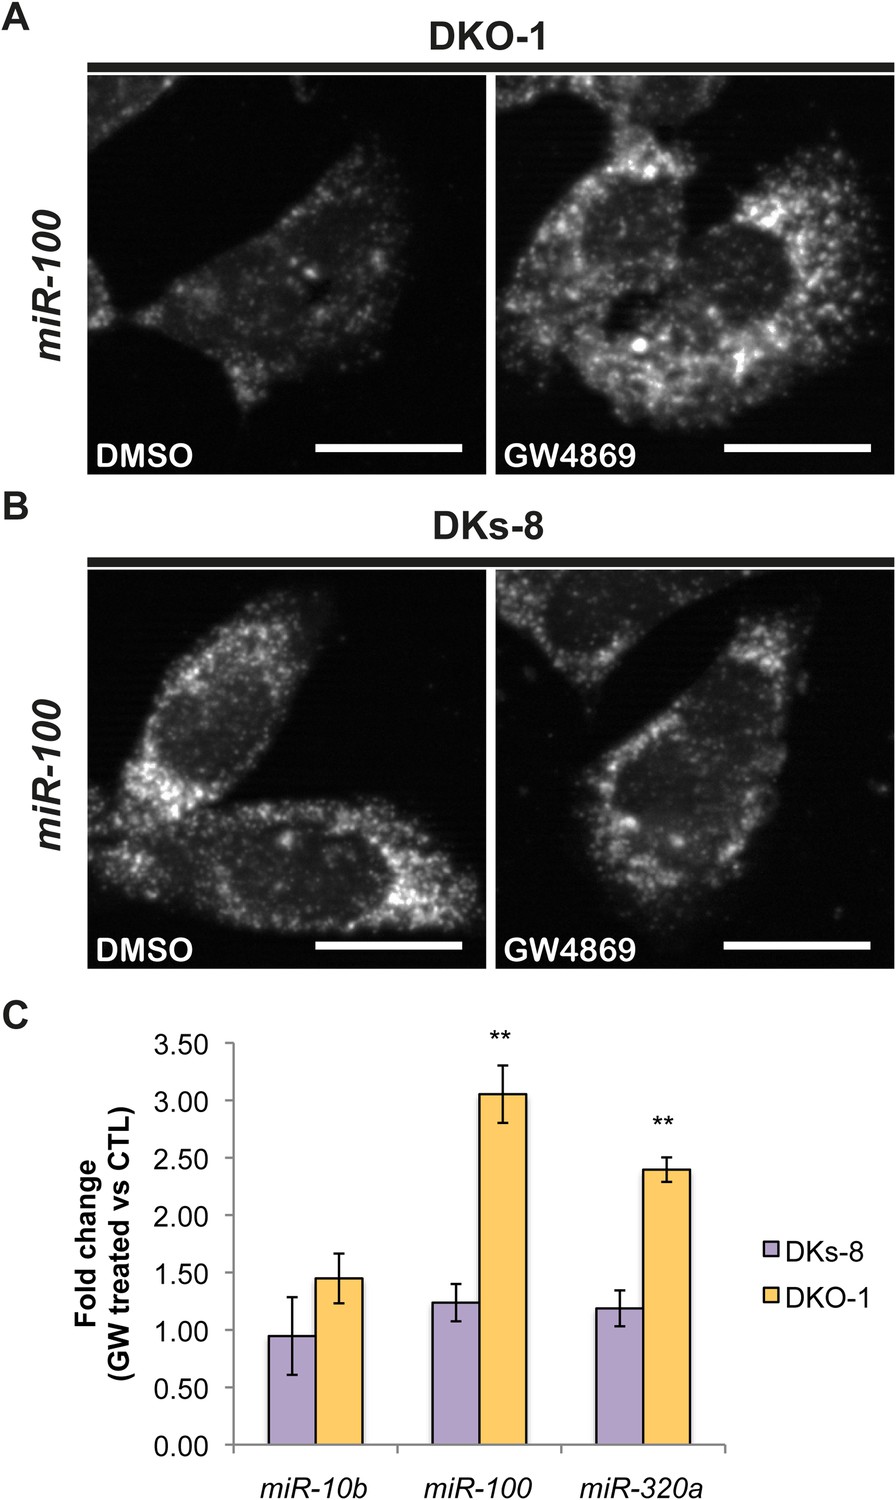
Ceramide-dependent miRNA export into exosomes.
DKO-1 or DKs-8 cells were treated with an inhibitor of neutral sphingomyelinase 2 (nSMase 2), GW4869. After treatment, in situ hybridization experiments were performed with probes against miR-100 (A, B). (C) qRT-PCR for miR-10b, miR-100, and miR-320a was performed on cells treated with GW4869 or DMSO, and fold change in expression was determined in treated vs untreated cells. In wild-type KRAS cells (DKs-8), inhibition of nSMase 2 had little or no effect on the cellular levels of these miRNAs. In contrast, mutant KRAS cells (DKO-1) showed an increase in cellular miRNA levels after inhibition of nSMAse 2. Data were derived from three biological replicates and performed in technical triplicates for qRT-PCR. Significance was determined by two-tailed, paired t-tests where * are p values ≤ 0.05 and ** ≤0.01.
Figure 6 with 3 supplements

Transfer of extracellular miRNAs by mutant DKO-1 cells promotes target repression in wild-type DKs-8 cells.
Transwell co-culture of DKs-8 recipient cells with or without DKs-8 or DKO-1 donor cells. Luciferase (Luc) expression was measured in DKs-8 recipient cells transiently expressing (A) Luc fused to three perfectly complementary synthetic miR-100 target sites (miR-100-PT) or (B) Luc fused to the 3′UTR of mTOR, which harbors 3 endogenous target sites for miR-100. (C) Luc expression increased upon mutation of two (MS2) sites with full expression upon mutation of all three sites (MS3). Luc-CTL contains three random scrambled target sites that do not match any known miRNA sequence. (D) Luc expression was restored in recipient cells expressing miR-100-PT upon pretreatment of donor DKO-1 cells with 100 nM miR-100 antagomirs (AI-100) compared to pre-treatment of donor DKO-1 cells with 100 nm control antagomirs (AI-CTL) targeting cel-miR-67. (E) Taqman qRT-PCR for miR-100. Compared to DKs-8 recipient cells grown without donor cells, mir-100 levels increased by approximately 34% in the presence of mutant DKO-1 donor cells pre-treated with AI-CTL compared to an 8% increase in AI-100 pre-treated donor cells. Y axis is % increase in miR-100 = (CPAI-CTL or CPAI-100 − CPno donor/CPno donor)*100, where CP = absolute copy number. All Luc values were normalized to co-transfected vectors expressing β-galactosidase; n = 3 independent experiments in A–C and n = 4 in D, E. All Luc assays were performed in technical triplicate. Significance was determined by two-tailed, paired t-tests where * are p values ≤ 0.05 and ** ≤0.01. Also see Figure 6—figure supplements 1–3.
Figure 6—figure supplement 1

miR-100 binding sites in the mTOR 3′UTR.
miR-100 binding sites within the mTOR 3′UTR. Mutated nucleotides indicated in red (oligonucleotide sequences in Supplementary file 3).
Figure 6—figure supplement 2

Presence of mutant DKO-1 donor cells augments miR-100 levels in DKs-8 recipient cells.
Taqman qRT-PCR for miR-100. miR-100 levels increased by approximately 114 copies in recipient cells cultured with DKO-1 donor cells pre-treated with AI-CTL compared to recipient cells cultured without donor cells. Pre-treatment of mutant DKO-1 donor cells with miR-100 antagomir inhibitor (AI-100) attenuated this effect. Absolute levels of miR-100 determined by standard curve generation of synthetically derived miR-100 (see ‘Materials and methods’). Approximately, 357.23 ± 16.65, 442.58 ± 12.59, and 329.48 ± 13.62 copies of miR-100 per input RNA were found in DKs-8 recipient cells cultured with DKO-1 donor AI-100, DKO-1 donor AI-CTL and without donor cells, respectively.
Figure 6—figure supplement 3

Transfer of extracellular miRNAs by mutant DKO-1 cells promotes target repression in wild-type DKs-8 cells.
Transwell co-culture of DKs-8-recipient cells with or without DKs-8 or DKO-1 donor cells. Luc expression was measured in DKs-8-recipient cells expressing Luc fused to three perfectly complementary synthetic miR-222 target sites (miR-222-PT).
Tables
Table 1
Differential expression of miRNAs in colorectal cancer cells*
| DKO-1 | |||
| hsa-miR-548u | hsa-miR-16-1-3p | hsa-miR-33a-3p | hsa-miR-33a-5p |
| hsa-miR-31-5p | hsa-miR-181b-3p | hsa-miR-450a-5p | hsa-miR-424-5p |
| hsa-miR-9-5p | hsa-miR-219-5p | hsa-miR-190a | hsa-miR-573 |
| hsa-miR-30d-3p | hsa-miR-204-5p | hsa-miR-1226-3p | hsa-miR-499a-5p |
| hsa-miR-450b-5p | hsa-miR-499b-3p | hsa-miR-3662 | hsa-miR-20a-3p |
| hsa-miR-27b-5p | hsa-miR-5701 | hsa-miR-4677-3p | hsa-let-7i-5p |
| hsa-miR-331-3p | hsa-miR-31-3p | hsa-miR-651 | hsa-miR-1306-5p |
| hsa-miR-147b | hsa-miR-3611 | hsa-miR-1305 | hsa-miR-148a-3p |
| hsa-miR-27b-3p | hsa-miR-1306-3p | hsa-miR-374b-3p | hsa-miR-1260b |
| hsa-miR-3940-3p | hsa-miR-200c-5p | hsa-miR-548ar-3p | |
| DKs-8 | |||
| hsa-miR-132-5p | hsa-miR-484 | hsa-miR-374a-5p | hsa-miR-1180 |
| hsa-miR-1307-3p | hsa-miR-200a-5p | hsa-miR-548o-3p | hsa-miR-149-5p |
| hsa-miR-3615 | hsa-miR-100-5p | hsa-miR-197-3p | hsa-miR-378a-5p |
| hsa-let-7a-3p | |||
| DLD-1 | |||
| hsa-miR-141-3p | hsa-miR-26b-5p | hsa-miR-24-3p | hsa-miR-3074-5p |
| hsa-miR-15a-5p | hsa-miR-27a-3p | hsa-miR-3613-5p | hsa-miR-30b-5p |
| hsa-miR-29a-3p | hsa-miR-301a-5p | hsa-let-7i-3p | hsa-miR-185-5p |
| hsa-let-7g-5p | hsa-miR-23b-3p | hsa-miR-22-3p | |
| DKO-1 and DKs-8 | |||
| hsa-miR-141-5p | hsa-miR-582-5p | ||
| DKO-1 and DLD-1 | |||
| hsa-miR-556-3p | hsa-miR-374a-3p | hsa-miR-106b-5p | hsa-miR-17-3p |
| hsa-miR-24-1-5p | hsa-miR-340-3p | ||
| DLD-1 and DKs-8 | |||
| hsa-miR-24-2-5p | hsa-miR-106a-5p | hsa-miR-30e-5p | hsa-miR-107 |
| hsa-miR-429 | hsa-miR-98-5p | hsa-miR-425-5p | hsa-miR-140-5p |
| hsa-miR-93-5p | hsa-miR-210 | hsa-miR-126-3p | hsa-miR-194-5p |
| hsa-miR-29b-3p | hsa-miR-15b-5p | hsa-miR-362-5p | hsa-miR-27a-5p |
| hsa-miR-454-3p | hsa-miR-452-5p | hsa-miR-196b-5p | |
| DKO-1, DLD-1 and DKs-8 | |||
| hsa-miR-32-5p | hsa-miR-582-3p | hsa-miR-542-3p | hsa-miR-96-5p |
| hsa-miR-101-3p | hsa-miR-18a-5p | hsa-miR-3529-3p | hsa-miR-7-5p |
| hsa-miR-19a-3p | hsa-miR-142-3p | hsa-miR-20a-5p | hsa-miR-32-3p |
| hsa-miR-130b-5p | hsa-miR-1278 | hsa-miR-7-1-3p | hsa-miR-590-3p |
| hsa-miR-4473 | hsa-miR-17-5p | hsa-miR-103a-3p | hsa-miR-103b |
| hsa-miR-19b-3p | hsa-miR-340-5p | hsa-miR-200a-3p | hsa-miR-34a-5p |
| hsa-miR-372 | |||
-
*
miRNAs differentially enriched in cells when comparing mean reads in exosomes vs cell.
-
miRNAs expression patterns were compared between DKs-8, DKO-1, and DLD-1 cells. miRNAs were identified that were enriched in just one of the three cell types or that overlapped between combinations of cells. For miRNAs, 25 were identified that are expressed in all three cell types, 13 were enriched in DKs-8 cells, 15 in DLD-1 cells, and 39 were unique to DKO-1 cells.
Table 2
Differential distribution of miRNAs in exosomes*
| DKO-1 | |||
| hsa-miR-139-5p | hsa-miR-3178 | hsa-miR-151b | hsa-miR-125b-1-3p |
| hsa-miR-193b-3p | hsa-miR-935 | hsa-miR-130b-3p | hsa-miR-628-3p |
| hsa-miR-139-3p | hsa-let-7d-3p | hsa-miR-589-3p | hsa-miR-4532 |
| hsa-miR-451a | hsa-miR-6087 | hsa-miR-151a-5p | hsa-miR-940 |
| hsa-miR-222-3p | hsa-miR-766-5p | hsa-miR-505-5p | hsa-miR-3187-3p |
| hsa-miR-125a-3p | hsa-miR-3679-5p | hsa-miR-4436b-3p | hsa-miR-4787-3p |
| hsa-miR-2277-3p | hsa-miR-361-5p | hsa-miR-1293 | hsa-miR-3183 |
| hsa-miR-3162-5p | hsa-miR-642a-3p | hsa-miR-642b-5p | hsa-miR-197-5p |
| hsa-miR-324-3p | hsa-miR-145-3p | hsa-miR-3182 | hsa-miR-3127-3p |
| hsa-miR-3127-5p | hsa-miR-4728-3p | hsa-miR-3184-5p | hsa-miR-125b-5p |
| hsa-miR-186-5p | hsa-miR-1 | hsa-miR-100-5p | hsa-miR-423-3p |
| hsa-miR-766-3p | hsa-miR-4753-5p | hsa-miR-145-5p | hsa-miR-4724-5p |
| hsa-miR-373-3p | hsa-miR-223-5p | hsa-miR-1307-5p | hsa-miR-1914-3p |
| hsa-miR-3121-3p | hsa-miR-3613-3p | hsa-miR-205-5p | hsa-miR-98-3p |
| hsa-miR-23a-3p | hsa-miR-3124-5p | hsa-miR-3656 | hsa-miR-3918 |
| hsa-miR-4449 | hsa-miR-378c | hsa-miR-3138 | hsa-miR-1910 |
| hsa-miR-3174 | hsa-miR-4466 | hsa-miR-3679-3p | hsa-miR-3200-5p |
| hsa-miR-6511b-5p | hsa-miR-1247-5p | hsa-miR-22-3p | hsa-miR-877-5p |
| hsa-miR-4687-3p | hsa-miR-1292-5p | hsa-miR-181c-5p | hsa-miR-6131 |
| hsa-miR-6513-5p | hsa-miR-3661 | hsa-miR-132-3p | hsa-miR-214-3p |
| hsa-miR-574-3p | hsa-miR-3190-3p | hsa-miR-326 | hsa-miR-3191-5p |
| hsa-miR-3198 | hsa-miR-3928 | hsa-miR-629-3p | hsa-miR-4489 |
| hsa-miR-4700-5p | hsa-miR-5006-5p | hsa-miR-5088 | hsa-miR-2110 |
| hsa-miR-3911 | hsa-miR-3146 | ||
| DKs-8 | |||
| hsa-miR-1224-5p | hsa-let-7b-5p | hsa-miR-155-5p | hsa-let-7c |
| hsa-let-7a-5p | hsa-miR-146b-5p | hsa-miR-4647 | hsa-miR-4494 |
| hsa-miR-711 | hsa-miR-1263 | ||
| DLD-1 | |||
| hsa-miR-1226-5p | hsa-miR-4745-5p | hsa-miR-4435 | hsa-miR-939-5p |
| hsa-miR-409-3p | hsa-miR-1304-3p | ||
| DKO-1 and DKs-8 | |||
| hsa-miR-146a-5p | hsa-miR-4508 | hsa-miR-224-5p | hsa-miR-4429 |
| hsa-miR-222-5p | hsa-miR-629-5p | hsa-miR-4492 | hsa-miR-3653 |
| hsa-miR-320a | hsa-miR-1290 | hsa-miR-1262 | hsa-miR-5010-5p |
| hsa-miR-204-3p | hsa-miR-4461 | hsa-miR-5187-5p | |
| DKO-1 and DLD-1 | |||
| hsa-miR-483-5p | hsa-miR-4658 | hsa-miR-4758-5p | hsa-miR-492 |
| hsa-miR-5001-5p | hsa-miR-371a-5p | hsa-miR-1323 | hsa-miR-371b-3p |
| hsa-miR-501-3p | hsa-miR-4446-3p | hsa-miR-6511a-5p | hsa-miR-30a-3p |
| hsa-miR-4727-3p | |||
| DLD-1 and DKs-8 | |||
| hsa-miR-28-3p | hsa-miR-3934-5p | ||
| DKO-1, DLD-1 and DKs-8 | |||
| hsa-miR-658 | hsa-miR-320d | hsa-miR-4792 | hsa-miR-1246 |
| hsa-miR-320e | hsa-miR-4516 | hsa-miR-320b | hsa-miR-4488 |
| hsa-miR-1291 | hsa-miR-320c | hsa-miR-4634 | hsa-miR-3605-5p |
| hsa-miR-4741 | hsa-miR-3591-3p | hsa-miR-122-5p | hsa-miR-486-3p |
| hsa-miR-184 | hsa-miR-223-3p | hsa-miR-3651 | hsa-miR-486-5p |
| hsa-miR-3180 | hsa-miR-3180-3p | hsa-miR-3168 | hsa-miR-4497 |
| hsa-miR-423-5p | hsa-miR-3184-3p | hsa-miR-150-5p | hsa-miR-664a-5p |
| hsa-miR-182-5p | |||
-
*
miRNAs differentially enriched in exosomes when comparing mean reads in exosomes vs cell.
-
miRNAs expression patterns were compared between exosomes purified from DKs-8, DKO-1, and DLD-1 cells. miRNAs were identified that were enriched in exosomes from just one of the three cell lines or that overlapped between combinations of cell lines. 29 miRNAs were common between exosomes from all three cell lines. 94 were enriched in exosomes from DKO-1 cells, 10 in exosomes from DKs-8 cells, and only 6 in exosomes from DLD-1 cells.
Author response table 1
Comparison of miRNA positions based on the most abundant reads and annotations from miRBase.
| Sample | Same | Different | Same percentage |
|---|---|---|---|
| DKO1.cell.1 | 279 | 96 | 74.4% |
| DKO1.cell.2 | 274 | 86 | 76.1% |
| DKO1.cell.3 | 255 | 90 | 73.9% |
| DKO1.exo.1 | 129 | 52 | 71.3% |
| DKO1.exo.2 | 134 | 43 | 75.7% |
| DKO1.exo.3 | 84 | 28 | 75.0% |
| DKS8.cell.1 | 330 | 125 | 72.5% |
| DKS8.cell.2 | 293 | 108 | 73.1% |
| DKS8.cell.3 | 272 | 90 | 75.1% |
| DKS8.exo.1 | 60 | 21 | 74.1% |
| DKS8.exo.2 | 48 | 16 | 75.0% |
| DKS8.exo.3 | 76 | 24 | 76.0% |
| DLD1.cell.1 | 277 | 92 | 75.1% |
| DLD1.cell.2 | 308 | 115 | 72.8% |
| DLD1.cell.3 | 290 | 97 | 74.9% |
| DLD1.exo.1 | 62 | 17 | 78.5% |
| DLD1.exo.2 | 53 | 16 | 76.8% |
| DLD1.exo.3 | 70 | 21 | 76.9% |
Author response table 2
Comparison of miRNA counts based on miRBase annotations and positions of the most abundant reads.
| Sample | Same | Difference more than 10% |
|---|---|---|
| DKO1.cell.1 | 77.00% | 6.90% |
| DKO1.cell.2 | 78.80% | 7.20% |
| DKO1.cell.3 | 79.10% | 6.70% |
| DKO1.exo.1 | 78.90% | 6.50% |
| DKO1.exo.2 | 80.00% | 5.80% |
| DKO1.exo.3 | 86.80% | 2.30% |
| DKS8.cell.1 | 77.30% | 7.80% |
| DKS8.cell.2 | 79.70% | 6.70% |
| DKS8.cell.3 | 79.70% | 6.30% |
| DKS8.exo.1 | 82.50% | 6.20% |
| DKS8.exo.2 | 85.10% | 4.50% |
| DKS8.exo.3 | 79.80% | 4.00% |
| DLD1.cell.1 | 79.70% | 6.00% |
| DLD1.cell.2 | 77.10% | 7.60% |
| DLD1.cell.3 | 78.30% | 6.10% |
| DLD1.exo.1 | 79.80% | 3.60% |
| DLD1.exo.2 | 87.70% | 2.70% |
| DLD1.exo.3 | 85.10% | 2.10% |
Additional files
-
Supplementary file 1
Read counts for (A) individual miRNA species and (B) repeat families.
- https://doi.org/10.7554/eLife.07197.023
-
Supplementary file 2
Abundant miRNAs. Normalized read counts (see ‘Materials and methods’) were used to determine the miRNAs with the highest number of reads (top 50) from cell and exosomal data sets. The top 50 most abundant miRNAs were compared between exosomes and cells for each cell line. Most abundant miRNAs in exosomes (blue), cells (orange), or both.
- https://doi.org/10.7554/eLife.07197.024
-
Supplementary file 3
Related to experimental procedures. Primers used for plasmid construction.
- https://doi.org/10.7554/eLife.07197.025
Download links
A two-part list of links to download the article, or parts of the article, in various formats.
Downloads (link to download the article as PDF)
Open citations (links to open the citations from this article in various online reference manager services)
Cite this article (links to download the citations from this article in formats compatible with various reference manager tools)
KRAS-dependent sorting of miRNA to exosomes
eLife 4:e07197.
https://doi.org/10.7554/eLife.07197


