Slit2 as a β-catenin/Ctnnb1-dependent retrograde signal for presynaptic differentiation
- Institute of Basic Medical Sciences, China
- Georgia Regents University, United States
- Charlie Norwood VA Medical Center, United States
Figures
Figure 1 with 1 supplement
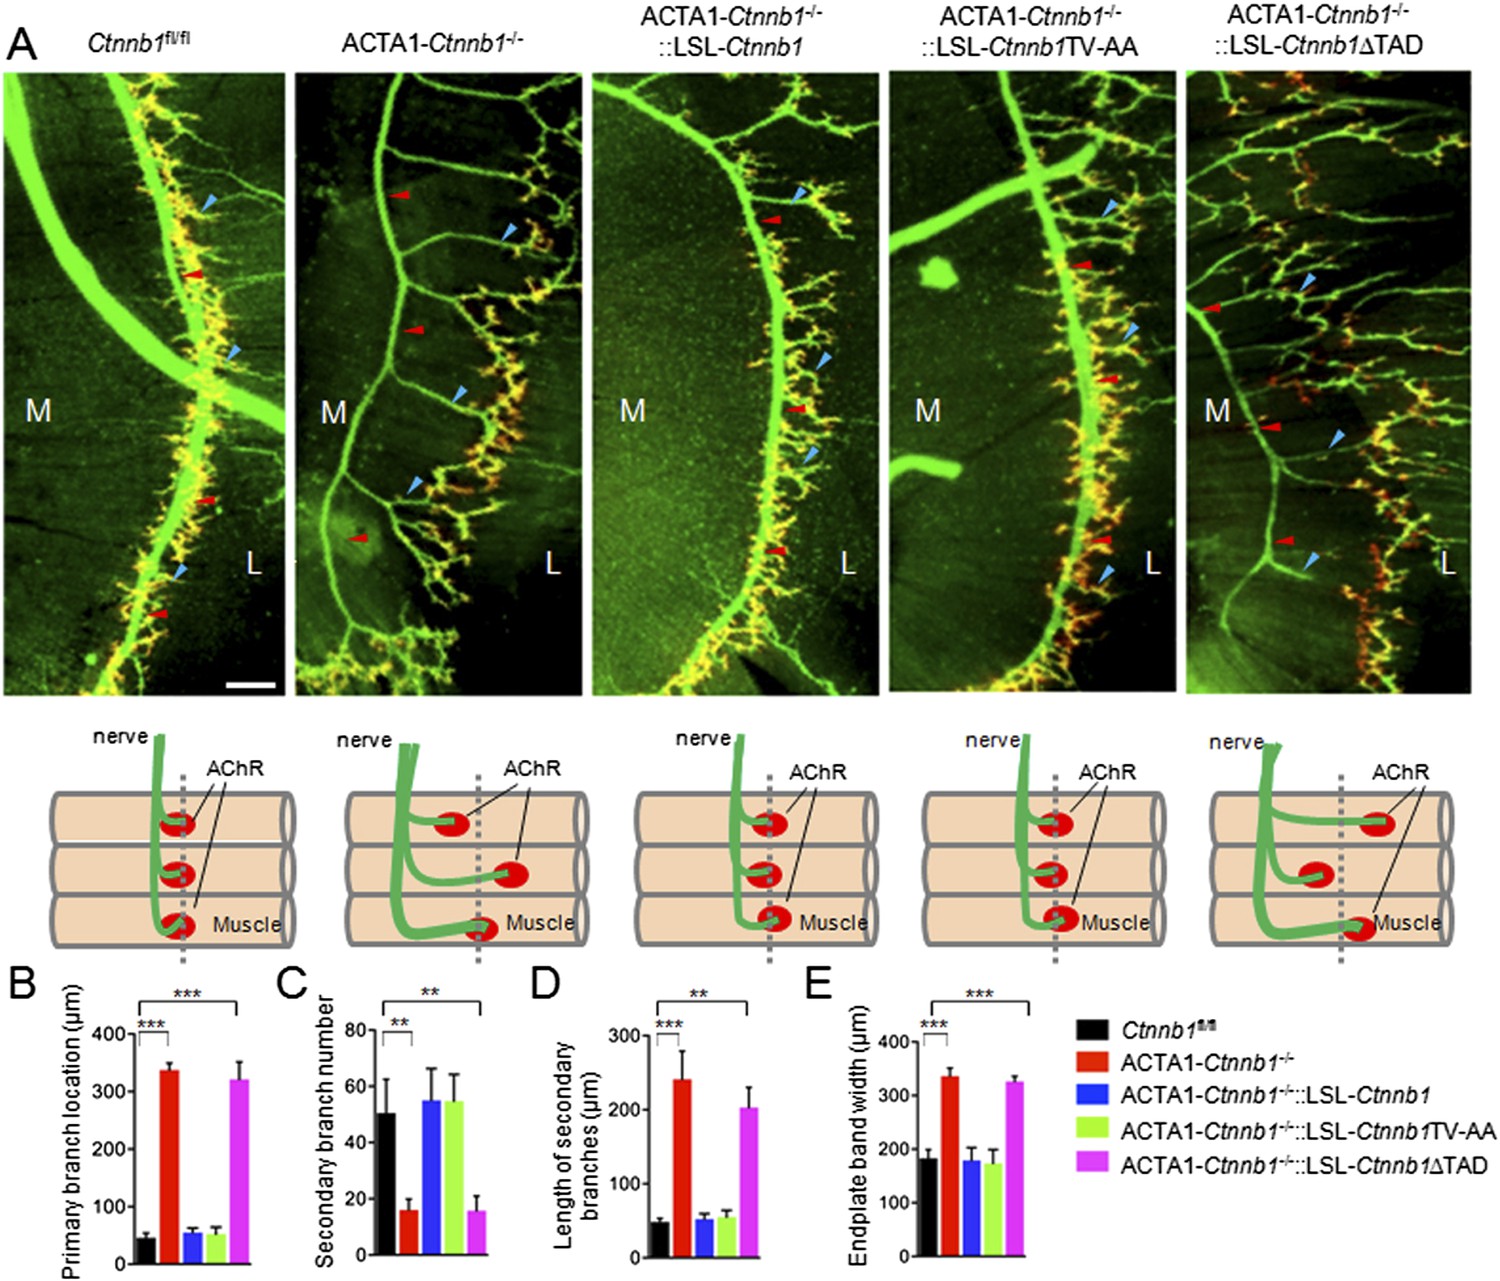
Requirement of the TAD domain to rescue presynaptic deficits in ACTA1-Ctnnb1−/− deficits.
(A) Diaphragms of P0 mice of indicated genotypes were stained whole mount with rhodamine-conjugated α-BTX (R-BTX) to label AChR clusters and anti-NF/synaptophysin antibodies (green) to label axons and nerve terminals. Shown were left ventral areas. Red arrowhead, primary branches; blue arrowheads, secondary branches. M, medial; L, lateral. Diagrams summarizing morphological deficits. (B–E) Quantitative analysis of data in A. Data were shown as mean ± SEM; **, p < 0.01; ***, p < 0.001; One-way ANOVA; n = 4; bar, 50 μm.
Figure 1—figure supplement 1
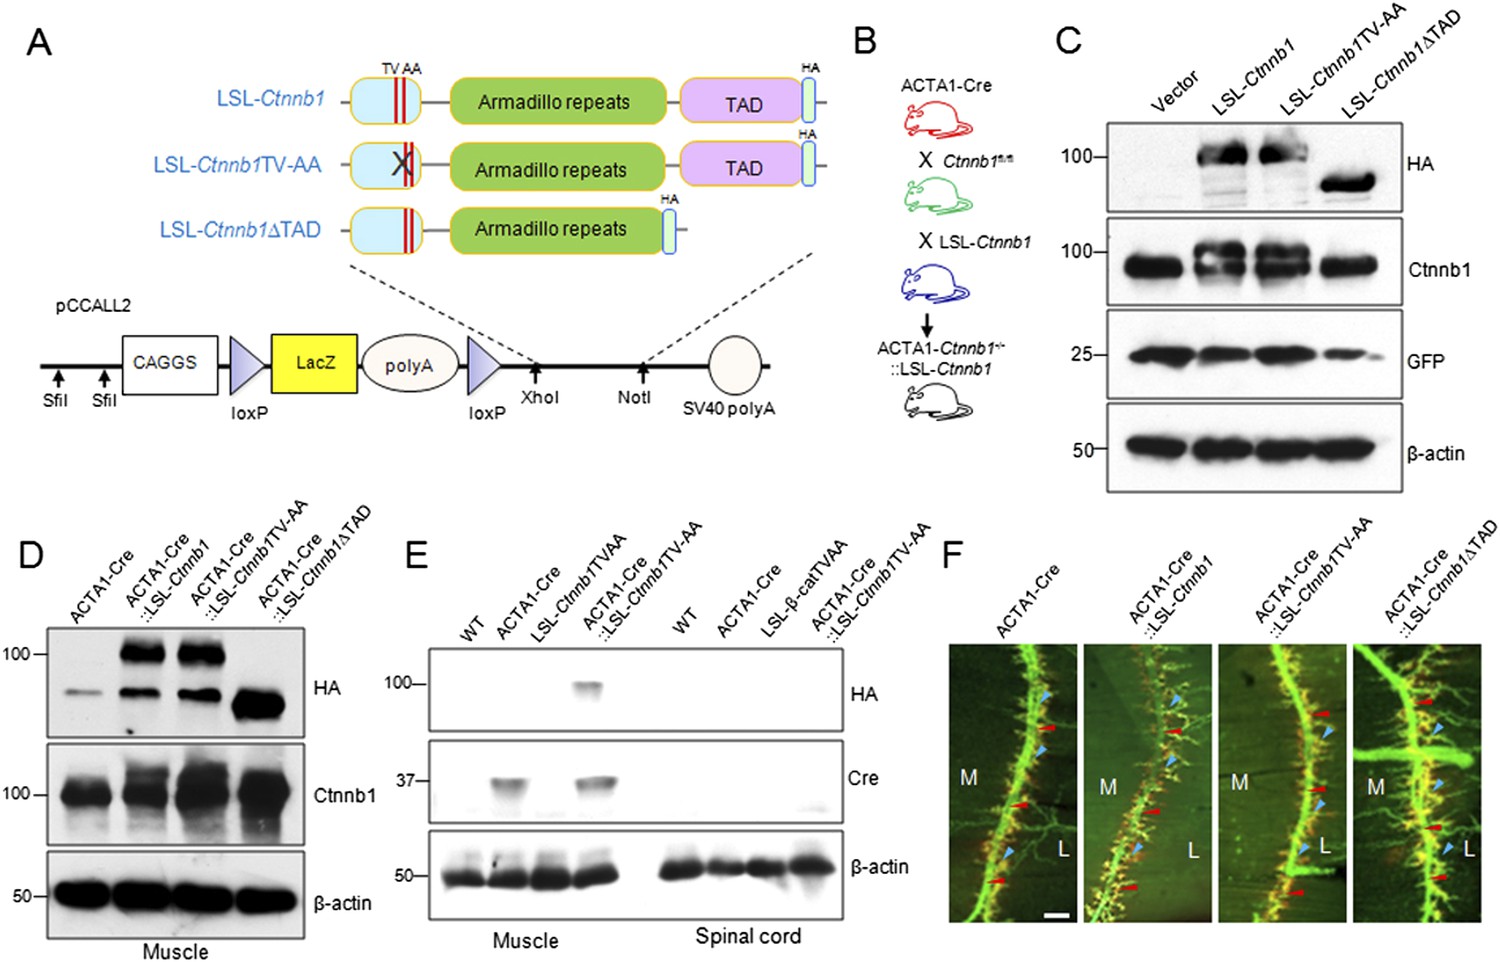
Generation and identification of LSL-Ctnnb1, LSL-Ctnnb1TV-AA, LSL-Ctnnb1ΔTAD transgenic mice.
(A) The wild-type, TV-AA, and ΔTAD Ctnnb1 were tagged at the C-terminus by HA-tag and were subcloned into the pCCALL2 vector. (B) Breeding scheme to generate rescue genotypes. (C) Western blot showing Cre-dependent expression of wild-type, TV-AA, and ΔTAD Ctnnb1 transgenes in HEK293 cells. (D) Western blot showing ACTA1-Cre-dependent expression of Ctnnb1 transgenes in vivo. (E) Western blot showing HA-tagged Ctnnb1TV-AA expressed only in the muscles of ACTA1-Ctnnb1−/−::LSL-Ctnnb1TV-AA, with concomitant deletion of endogenous Ctnnb1 alleles were knocked out. (F) Diaphragms of P0 mice of indicated genotypes were stained whole mount with R-BTX to label AChR clusters (red) and anti-NF/synaptophysin antibodies (green) to label axons and nerve terminals. Shown were left ventral areas. Red arrowhead, primary branches; blue arrowheads, secondary branches. M, medial; L, lateral; bar = 100 μm.
Figure 2 with 1 supplement
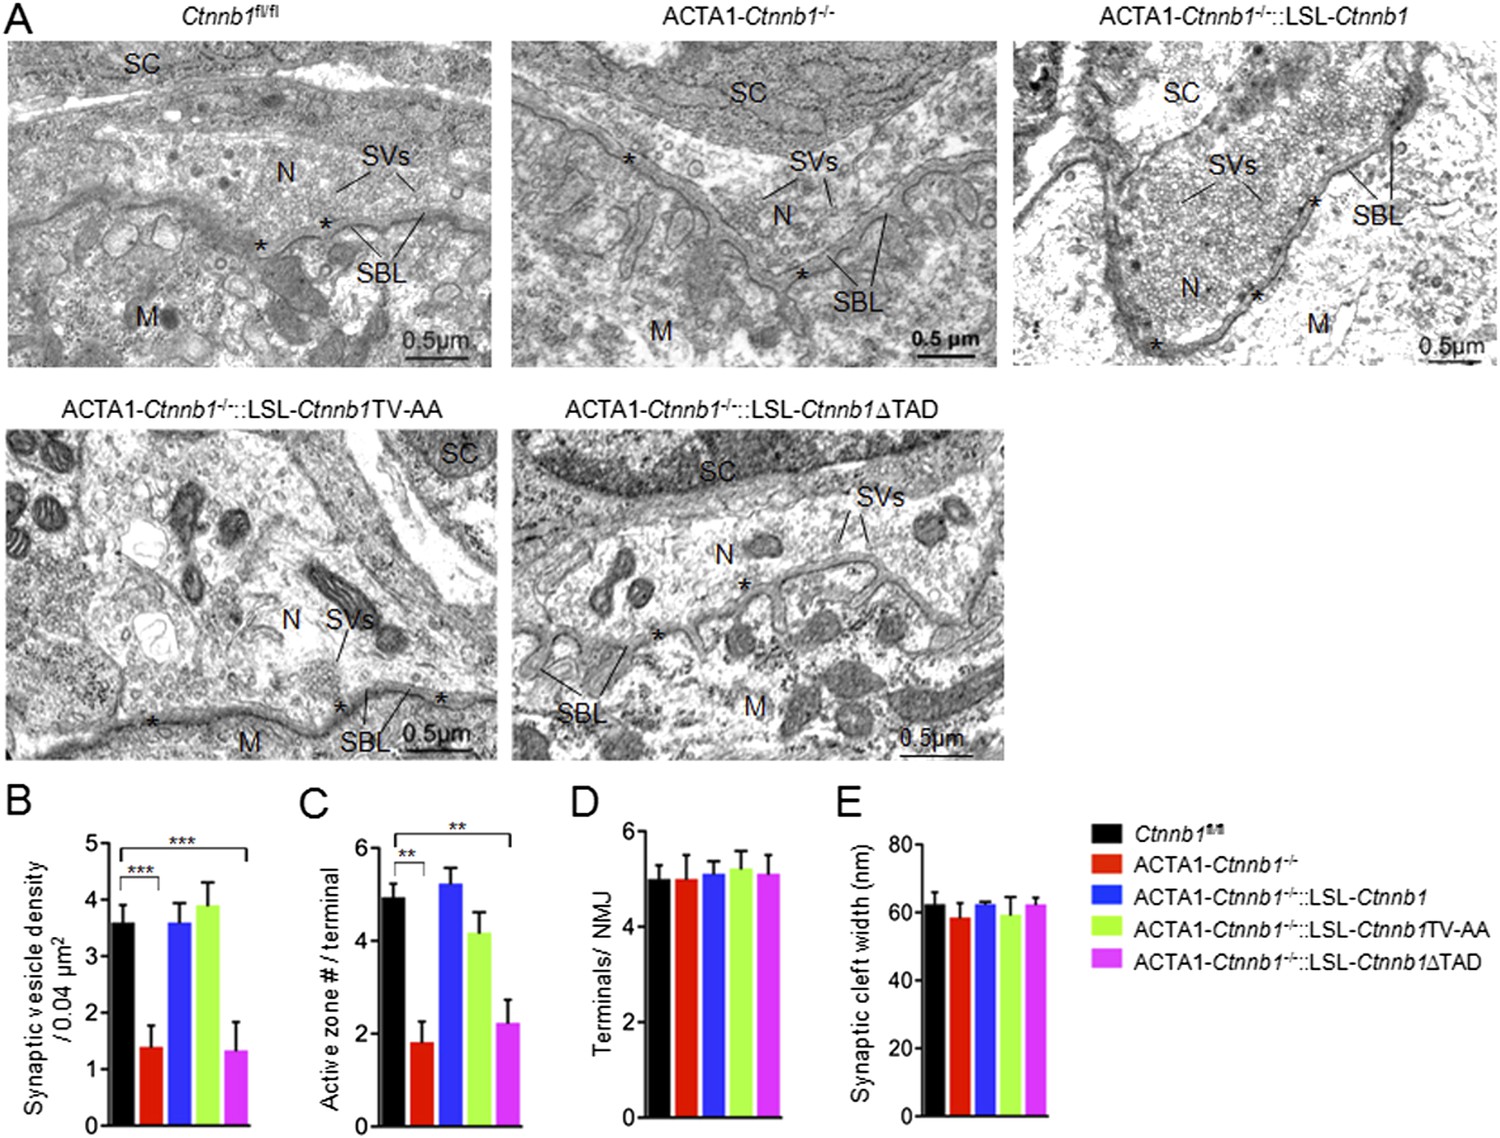
The TAD is necessary for muscle Ctnnb1 to regulate presynaptic development.
Diaphragms of P0 mice were subjected to electron microscopic analysis. (A) Representative electron micrographic images of indicated genotypes. Asterisks, active zones; SBL, synaptic basal lamina; N, nerve terminals; M, muscle fibers; SC, Schwann cells; SV, synaptic vesicle. (B–E) Quantitative analysis of data in A. Data were shown as mean ± SEM; **, p < 0.01; ***, p < 0.001, One-way ANOVA, n = 10.
Figure 2—figure supplement 1
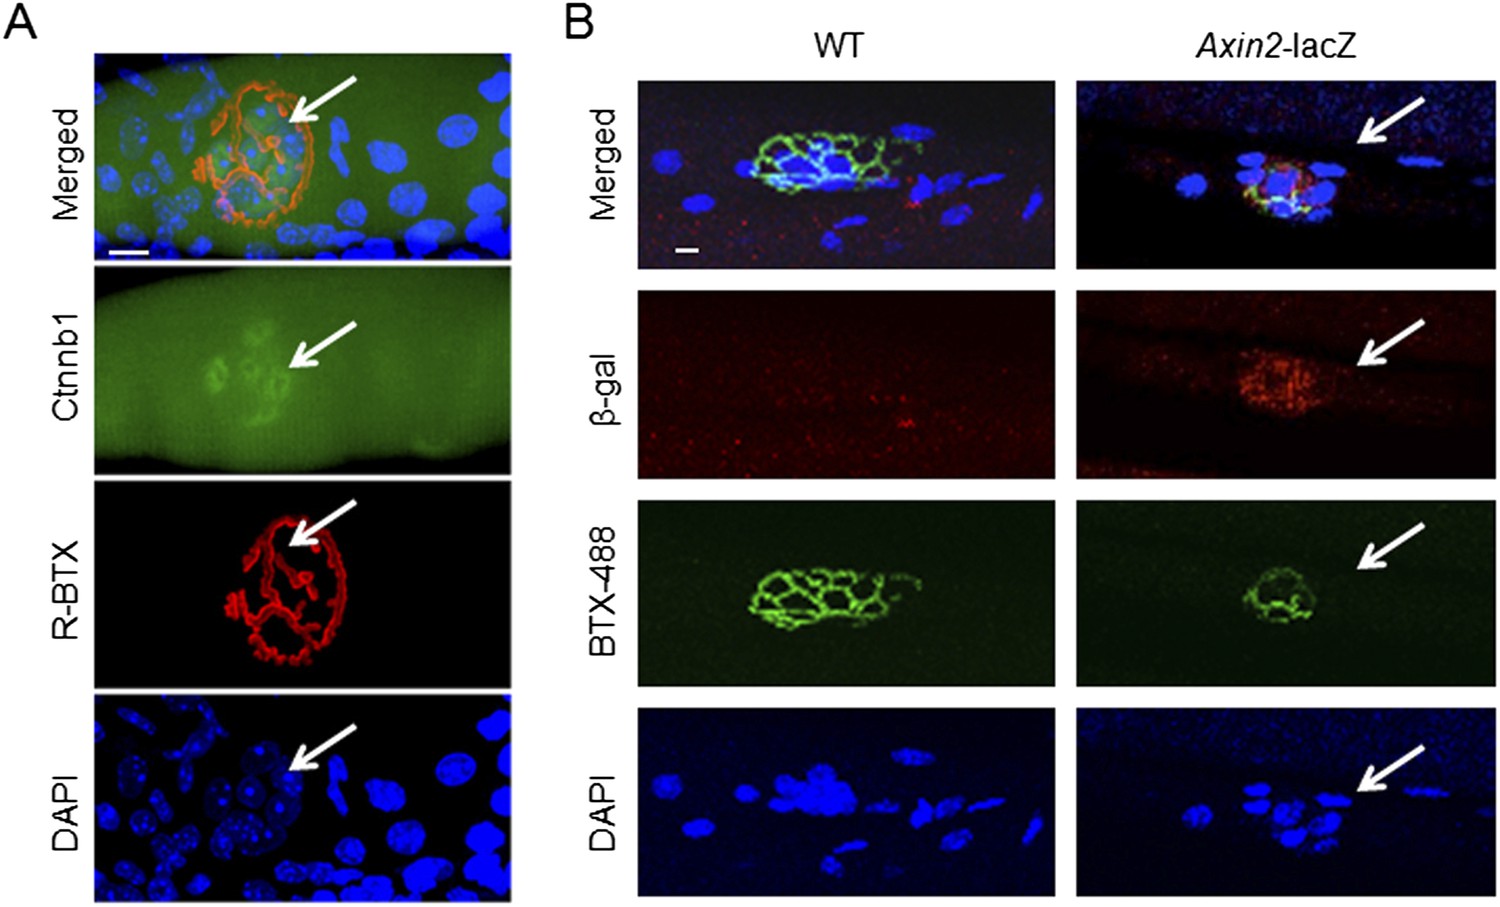
Synaptic nuclear localization of Ctnnb1 and Axin2-nlacZ in the NMJ region.
Muscle fibers were stained whole mount with anti-Ctnnb1 (A, green) or for β-galactosidase (B, red), together with DAPI to label nuclei and R-BTX to label AChR. bar = 10 μm. NMJ, neuromuscular junction.
Figure 3
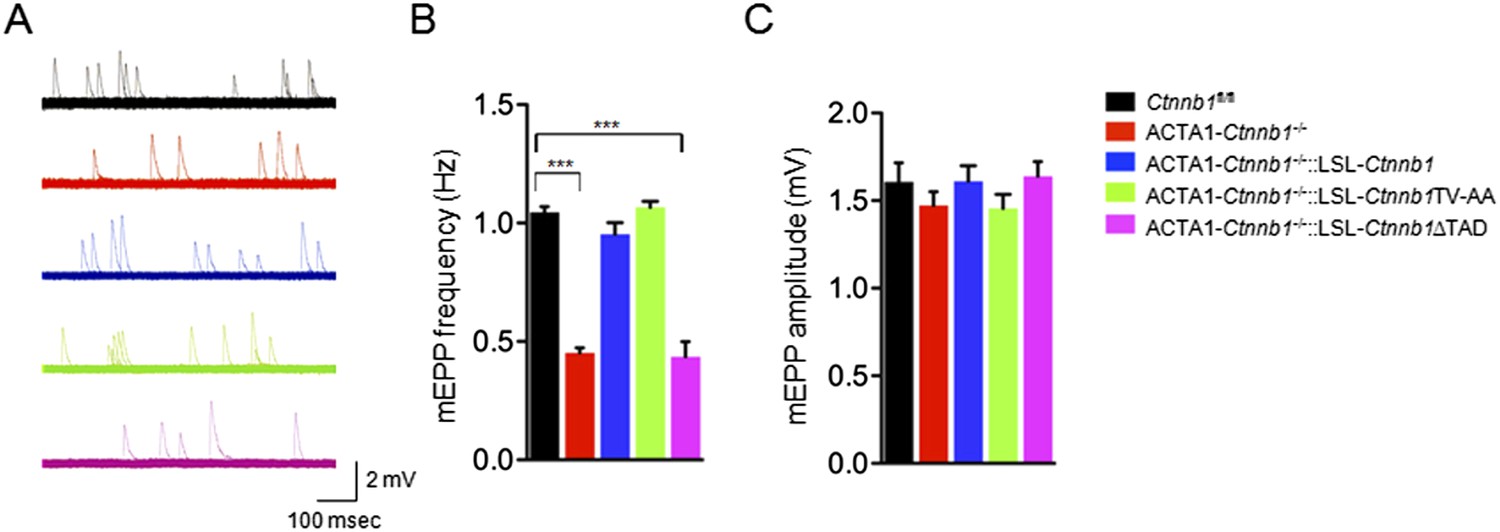
Rescue of neurotransmission deficits depends on Ctnnb1 TAD domain.
miniature end-plate potentials (mEPPs) were recorded in P0 diaphragms of indicated genotypes. (A) Representative mEPP traces. (B–C) Quantitative analysis of mEPP amplitude (B) and frequency (C). Data were shown as mean ± SEM; ***, p < 0.001; One-way ANOVA; n = 4.
Figure 4
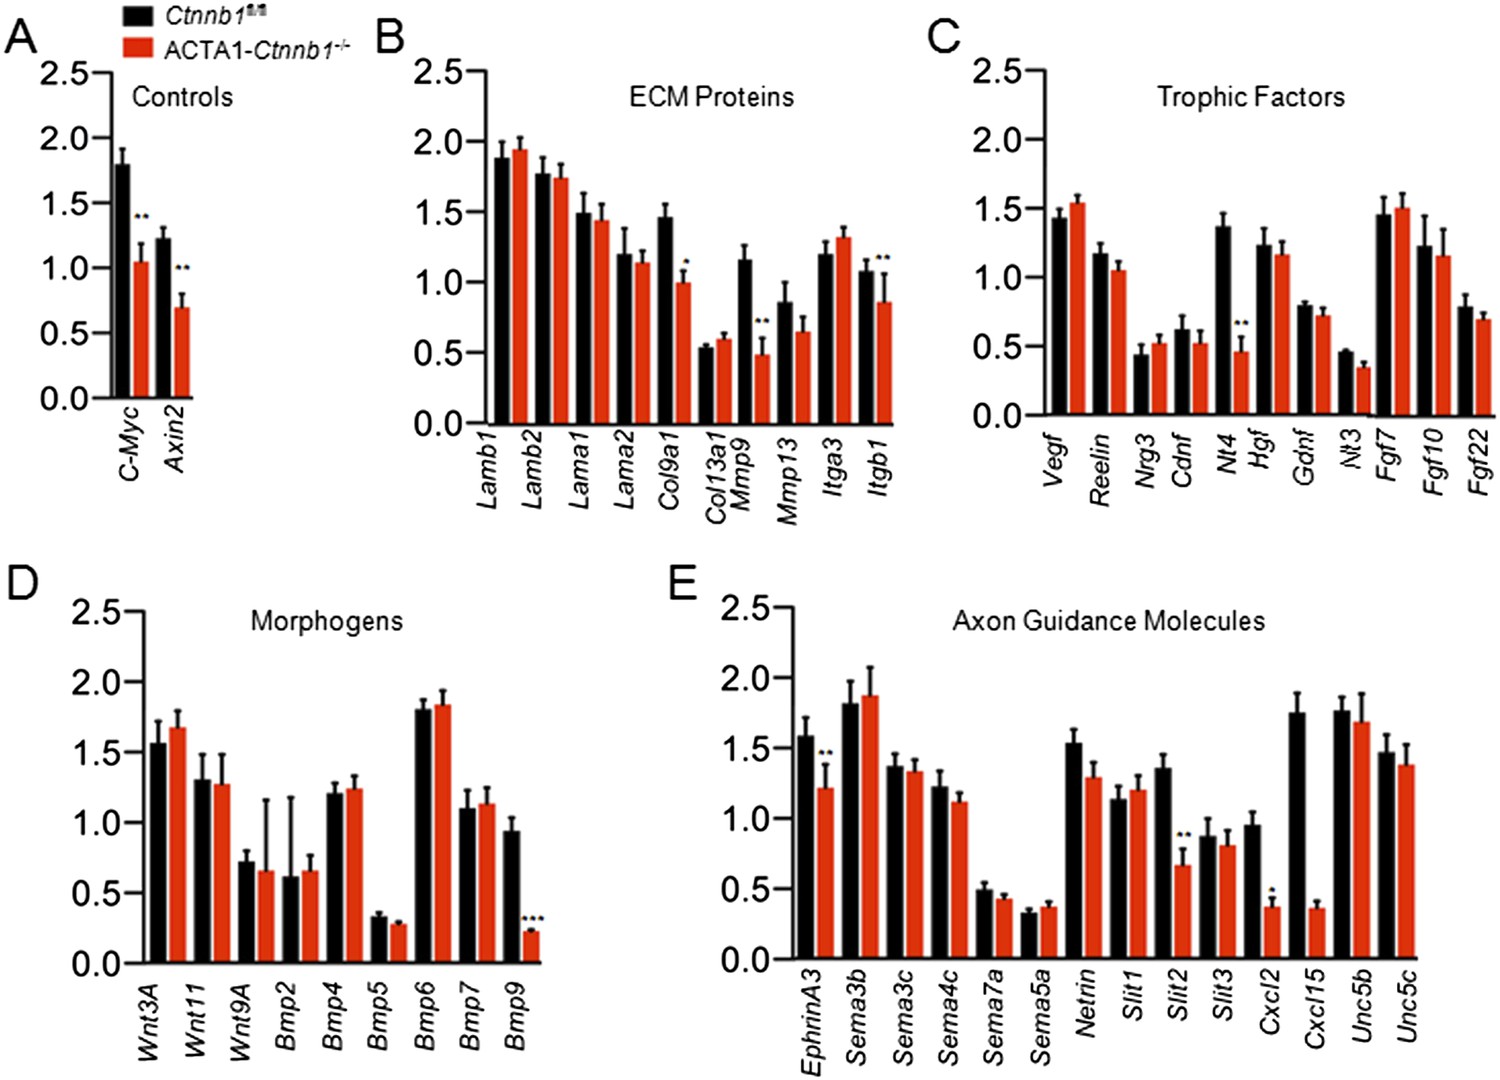
Slit2 was reduced in ACTA1-Ctnnb1−/− muscle.
RNA was purified from P0 muscles of Ctnnb1fl/fl (black) and ACTA1-Ctnnb1−/− (red) and subjected to quantitative real-time PCR. Of 70 genes, the expression of 25 was negligible. Shown were genes in different groups: known Ctnnb1 targets (A), ECM (extracellular matrix) proteins (B), trophic factors (C), morphogens (D), and environmental cues (E). Data are shown as mean ± SEM; *, p < 0.05; **, p < 0.01; ***, p < 0.001; t-test; n = 3.
Figure 5
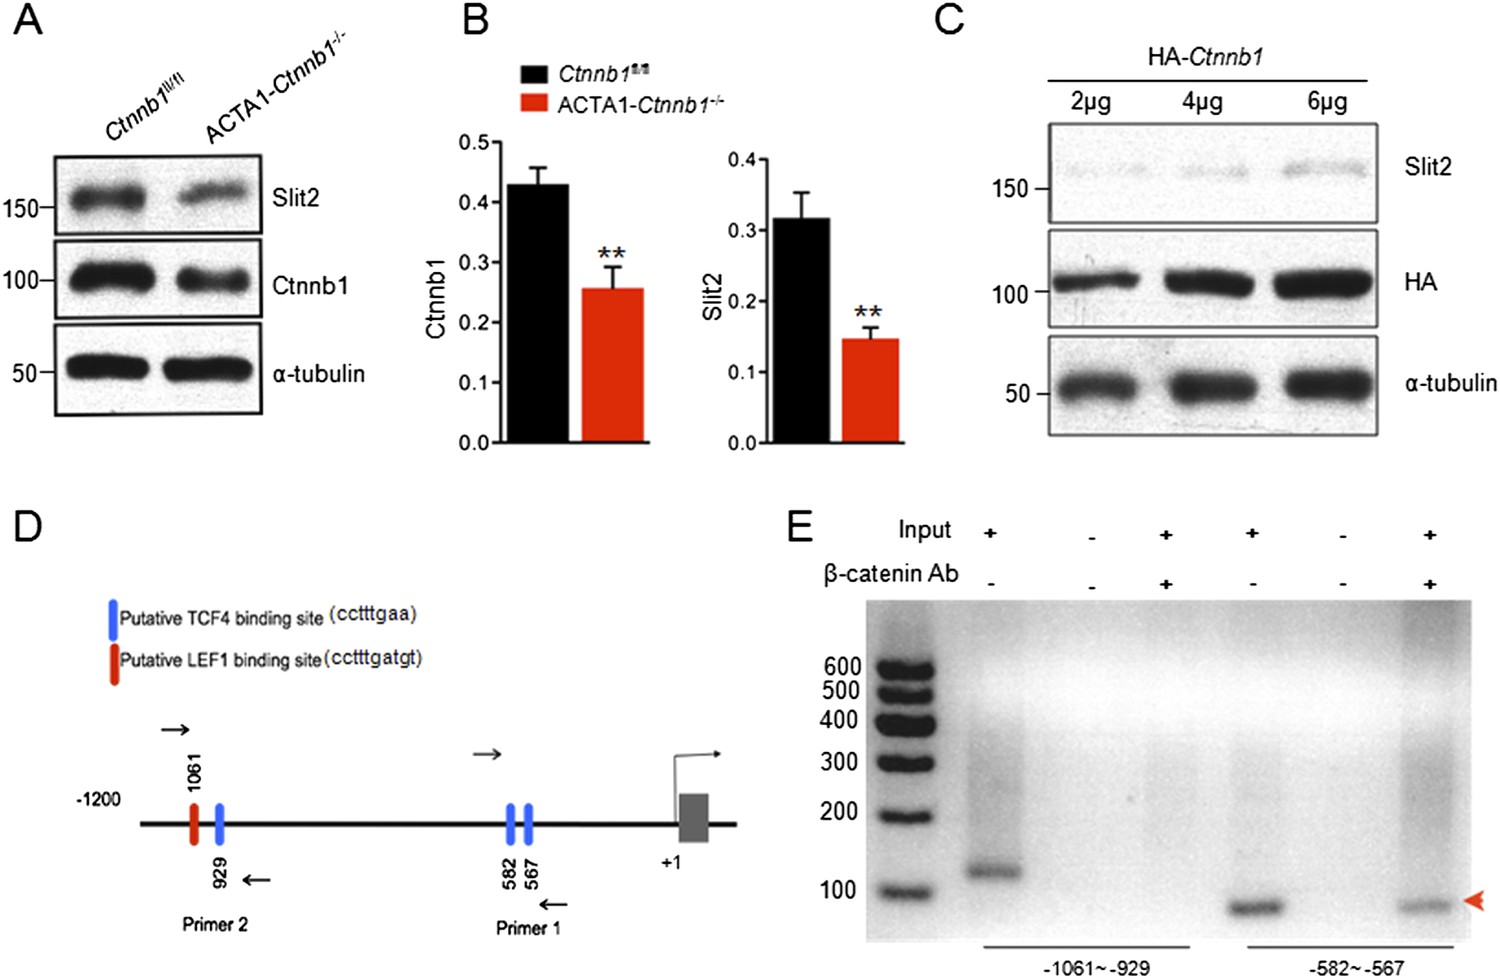
Transcriptional regulation of Slit2 by Ctnnb1.
(A) Expression of Slit2 was reduced in ACTA1-Ctnnb1−/− muscles. (B) Quantitative analysis of data in A. Data are shown as mean ± SEM; **, p < 0.01; t-test; n = 3. (C) Slit2 expression was increased by elevating Ctnnb1. C2C12 myoblasts were transfected with HA-Ctnnb1. Resulting myotubes were subjected to Western blot with antibodies against Slit2 or HA. (D) Diagram showing putative TCF4/LEF1 binding sites in 5′-UTR. Sites were identified by ChIP-MAPPER (Marinescu et al., 2005). Primers for CHIP analysis were indicated by arrows. (E) Ctnnb1 binding to the promoter of Slit2 5′UTR (red arrowhead). Cross-linked DNA of C2C12 myotubes was subjected precipitation with anti-Ctnnb1 antibody. The complex was used as a template for PCR with the primers indicated in D.
Figure 6 with 2 supplements
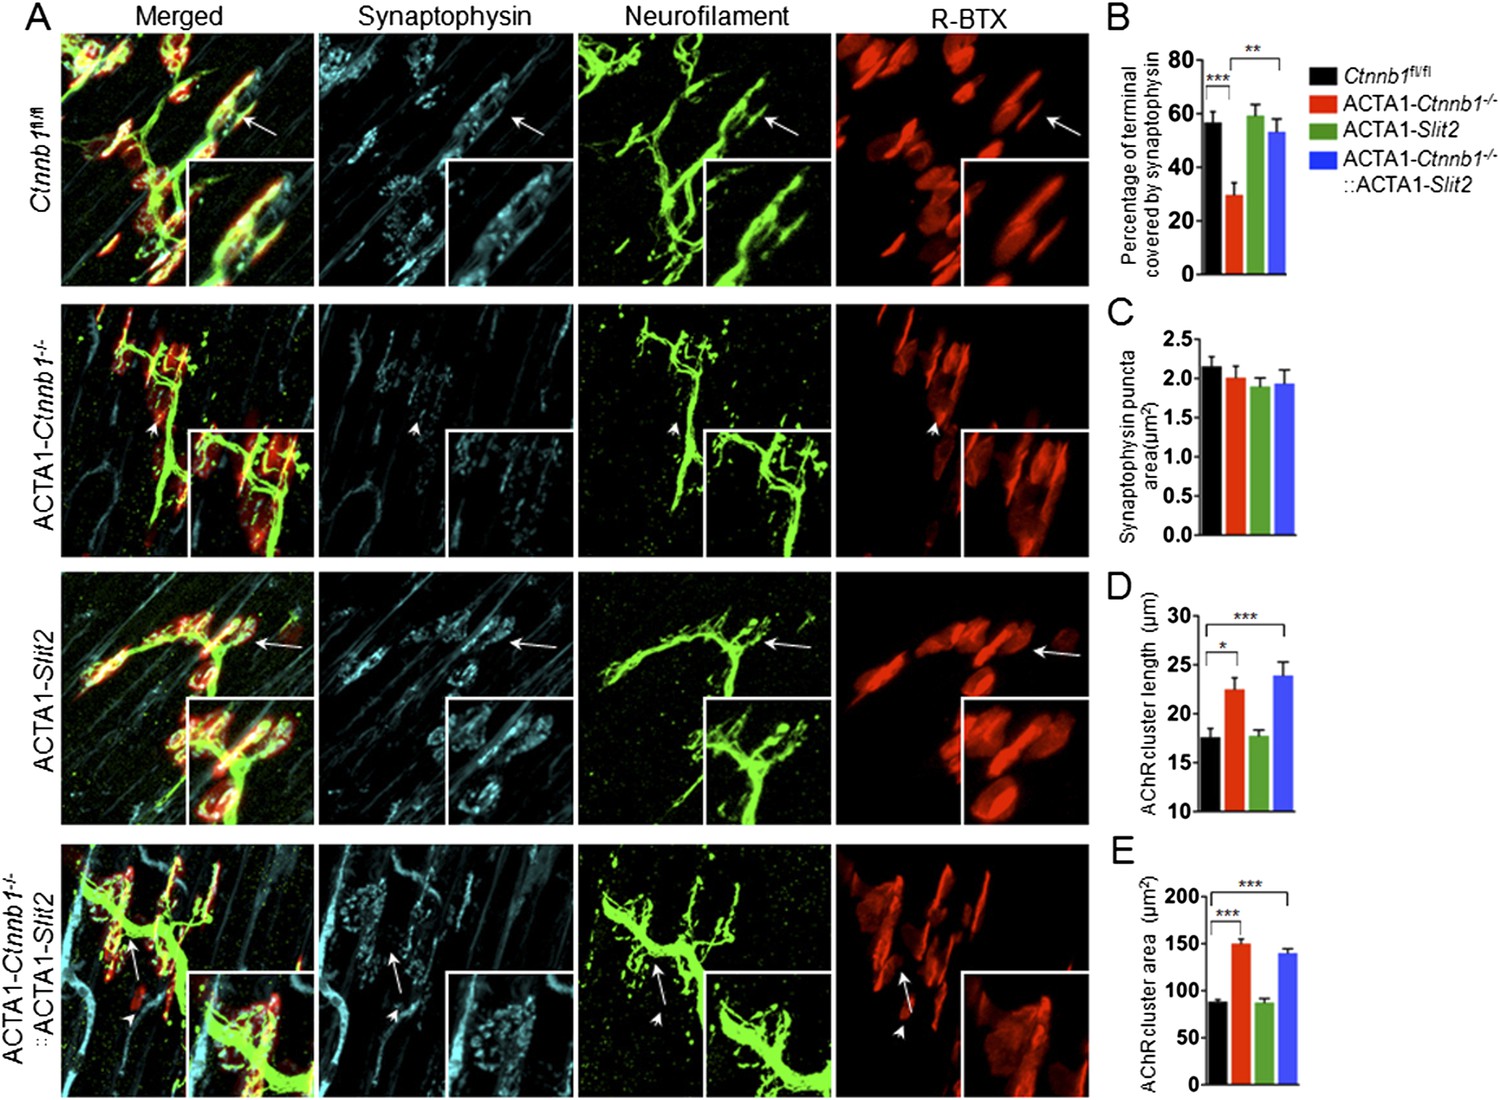
Slit2 overexpression increased synaptophysin staining at the NMJ.
P0 diaphragms of indicated genotypes were stained whole mount with R-BTX (red) and antibodies against neurofilament to label axons (green), and anti-synaptophysin antibody to label synaptic vesicles (cyan). (A) Representative images. Arrows indicate NMJs with synaptophysin; arrowheads indicate NMJ with reduced synaptophysin. (B–E) Quantitative analysis of data in A. Data are shown as mean ± SEM; *, p < 0.05; **, p < 0.01; ***, p < 0.001; n = 9; One-way ANOVA; bar = 10 μm. NMJ, neuromuscular junction.
Figure 6—figure supplement 1
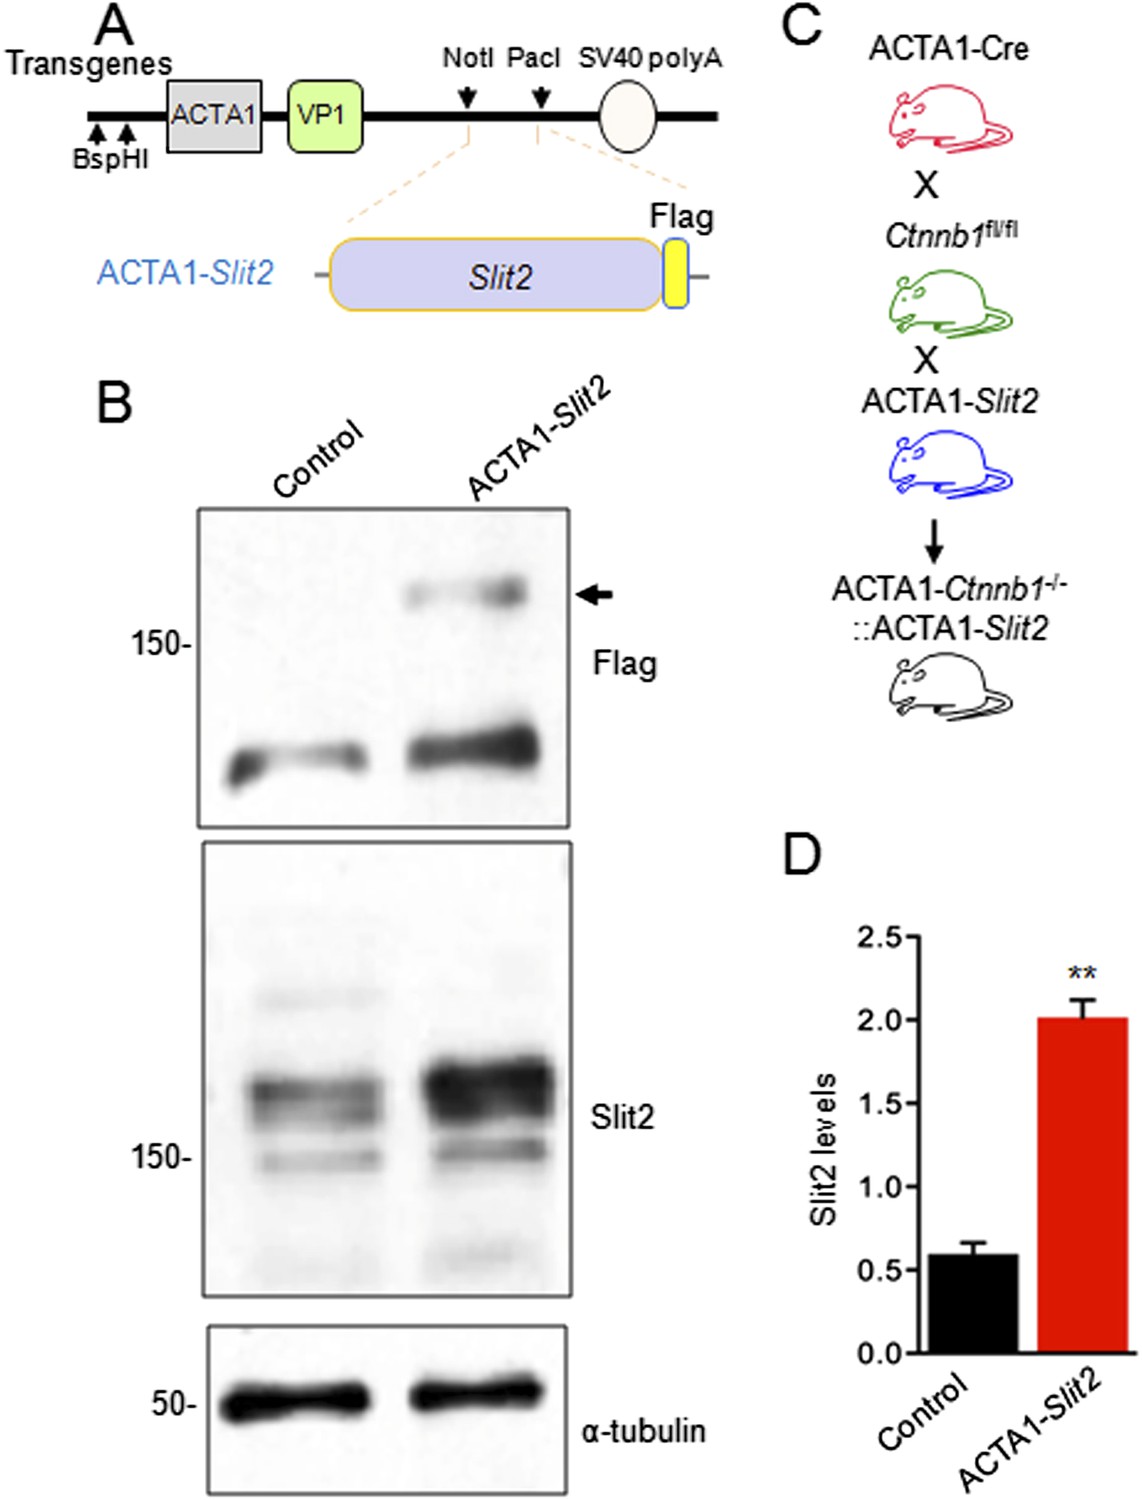
Generation of ACTA1-Slit2 transgenic mice.
(A) Flag-Slit2 subcloned downstream of ACTA1 promoter used for the generation of ACTA1-Slit2 transgenic mice. (B) Breeding scheme to generate ACTA1-Slit2 mice. (C) Transgenic Slit2 expression was detected in the diaphragm muscles of ACTA1-Slit2 mice. (D) Quantitative analysis of C. Data are shown as mean ± SEM; **, p < 0.01; t-test.
Figure 6—figure supplement 2
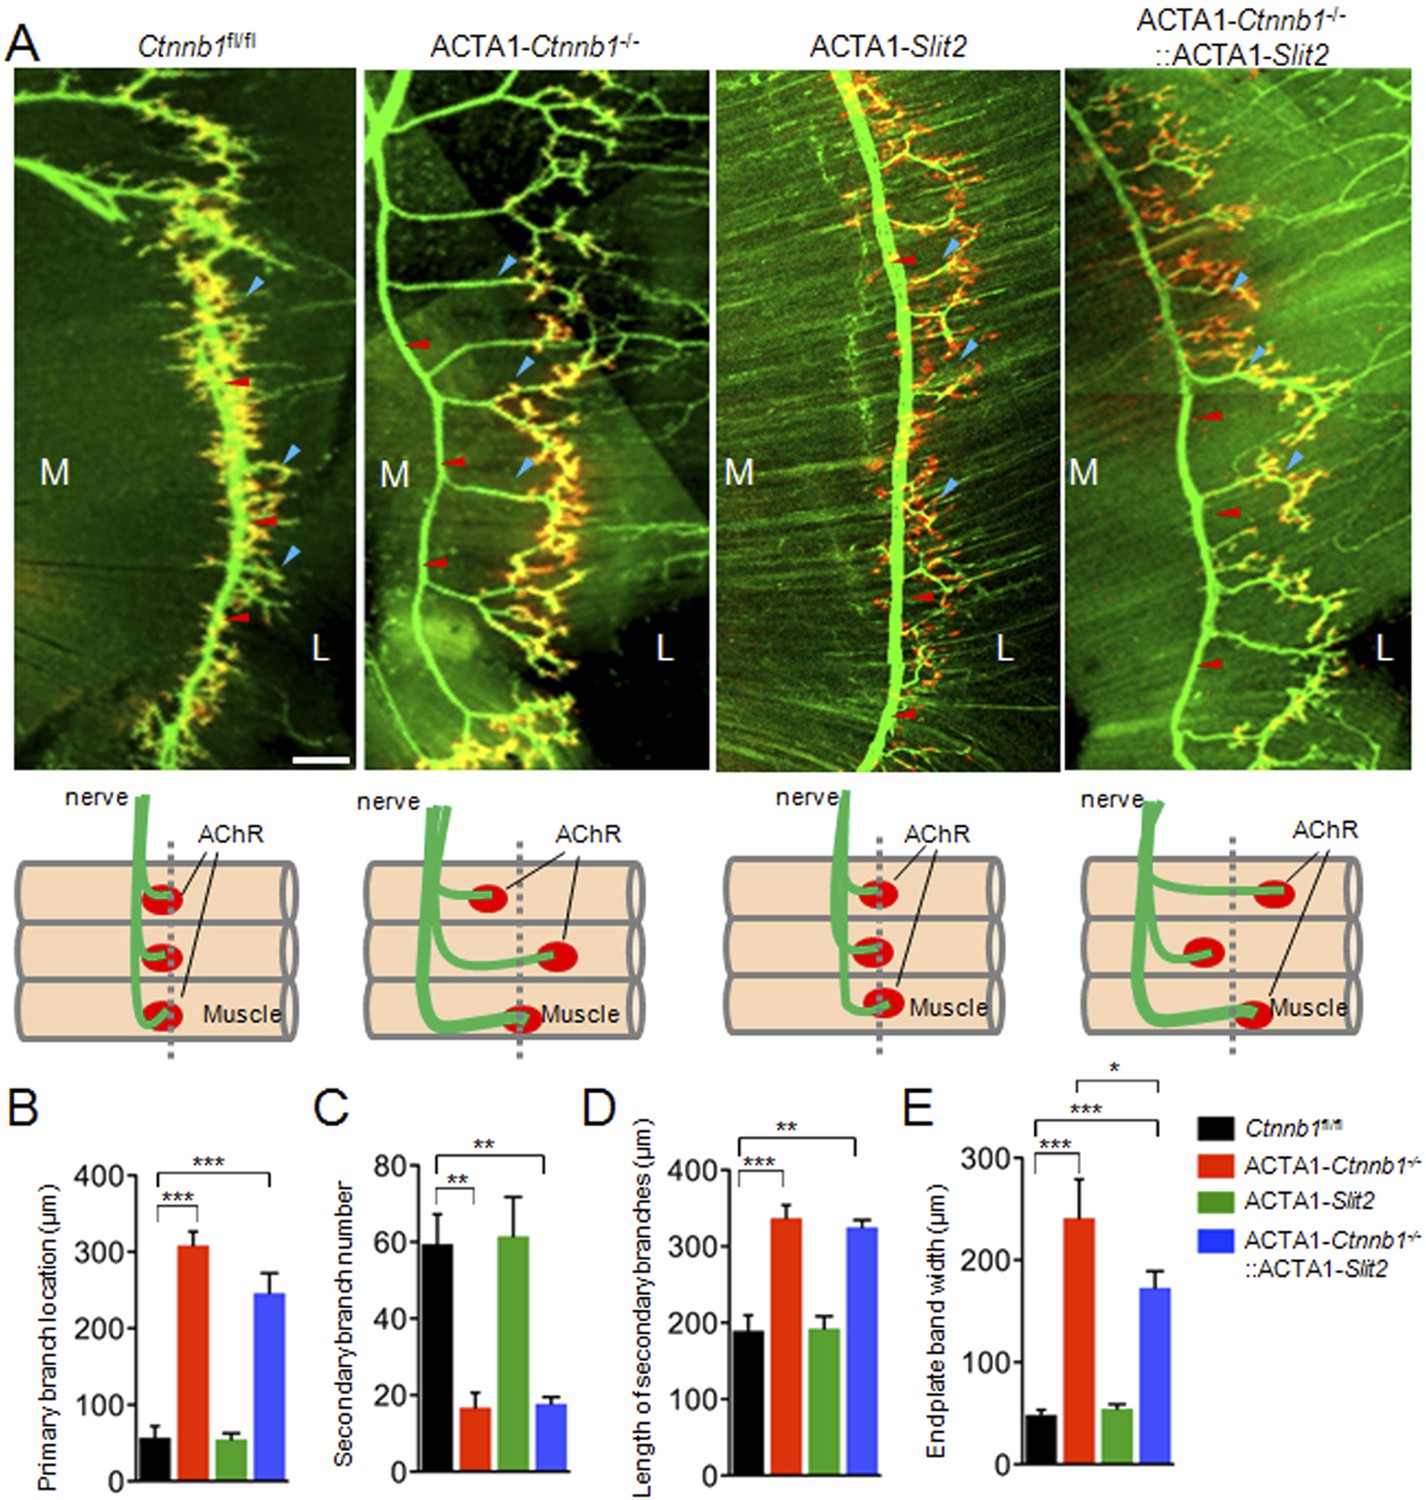
ACTA1-Slit2 partially rescues ACTA1-Ctnnb1−/− axon arborization defects.
(A) Diaphragms of P0 mice of indicated genotypes were stained whole mount with R-BTX to label AChR clusters (red) and anti-NF/synaptophysin antibodies (green) to label axons and nerve terminals. Shown were left ventral areas. Red arrowhead, primary branches; blue arrowheads, secondary branches. M, medial; L, lateral; bar = 100 μm. Diagrams summarizing morphological deficits. (B–E) Quantitative analysis of data in A. Data were shown as mean ± SEM; *, p < 0.05; **, p < 0.01; ***, p < 0.0001; One-way ANOVA; n = 4; bar, 50 μm.
Figure 7
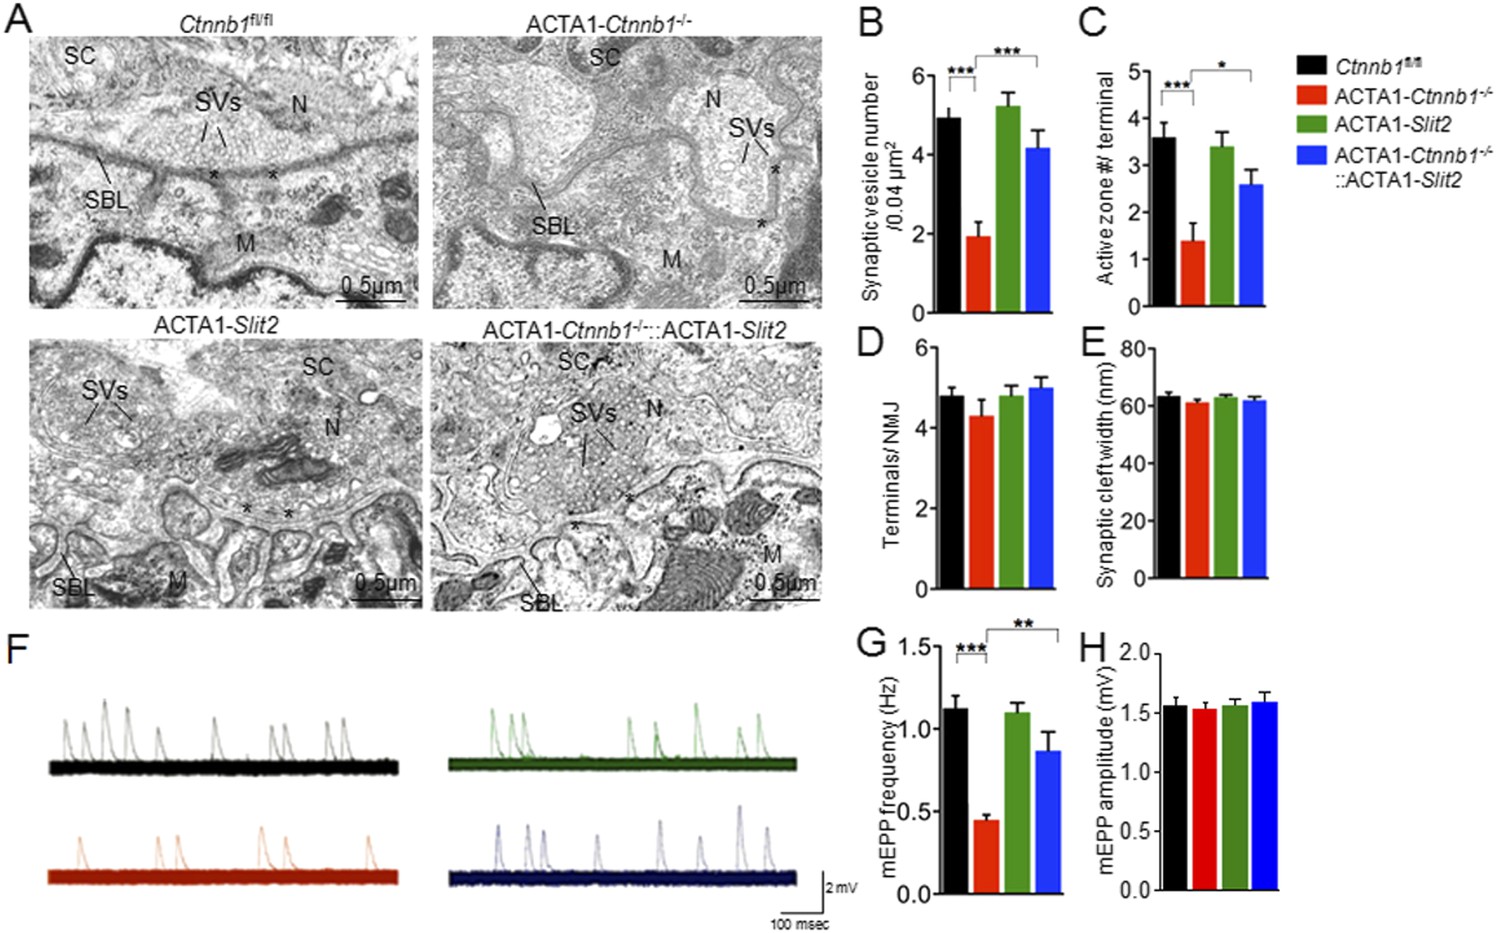
Rescue of nerve terminal deficits by ACTA1-Slit2.
(A) Rescue of nerve terminal morphology. Representative electron micrographic images of indicated genotypes. Asterisks, active zones; SBL, synaptic basal lamina; N, nerve terminals; M, muscle fibers; SC, Schwann cells; SVs, synaptic vesicles. (B–E) Quantitative analysis of data in A. (F) Rescue of mEPP frequency reduction. Shown were representative mEPP traces. (G–H) Quantitative analysis of mEPP amplitude and frequency, respectively. Data were shown as mean ± SEM; *, p < 0.05; **, p < 0.01; ***, p < 0.001; One-way ANOVA; n = 10 for B–E; n = 4 for G–H.
Figure 8
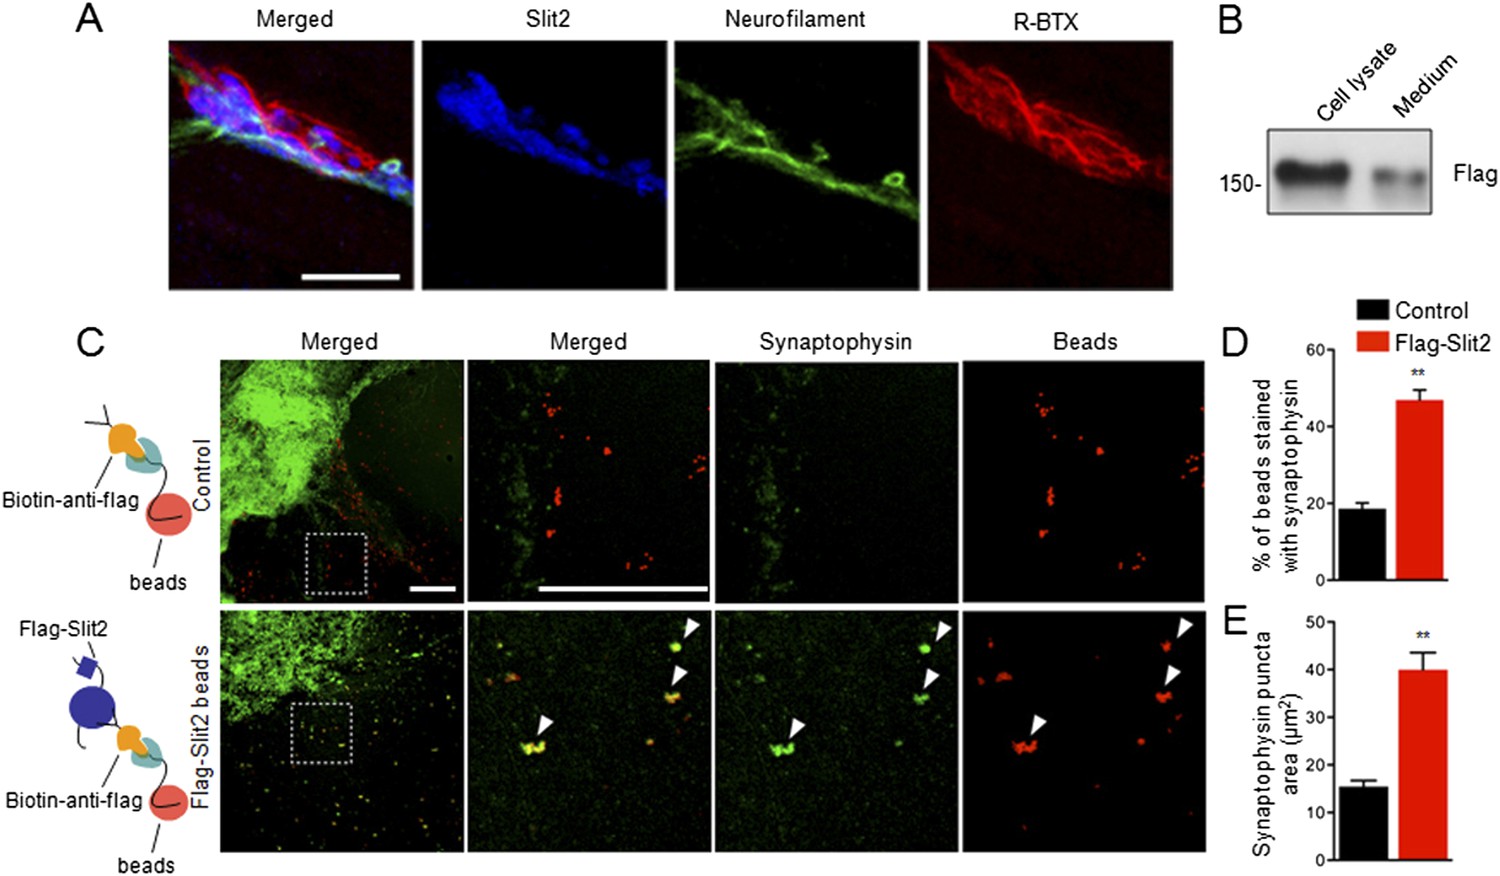
Slit2 was enriched at the NMJ and induced synaptophysin puncta of spinal cord explants.
(A) P12 tibilalis anterior muscles stained with R-BTX (red), anti-neurofilament antibody (green), and anti-Slit2 antibody (blue). (B) Detection of Flag-Slit2 in condition medium of transfected HEK293 cells. (C) Increased synaptophysin puncta co-localization with Flag-Slit2-conjugated beads. (D–E) Quantitative analysis of data in C, Data are shown as mean ± SEM; **, p < 0.01; t-test; bar = 10 μm for A; bar = 500 μm for C.
Additional files
-
Supplementary file 1
The sequences of primers used for qRT-PCR.
- https://doi.org/10.7554/eLife.07266.015
Download links
A two-part list of links to download the article, or parts of the article, in various formats.
Downloads (link to download the article as PDF)
Open citations (links to open the citations from this article in various online reference manager services)
Cite this article (links to download the citations from this article in formats compatible with various reference manager tools)
Slit2 as a β-catenin/Ctnnb1-dependent retrograde signal for presynaptic differentiation
eLife 4:e07266.
https://doi.org/10.7554/eLife.07266


