The effects of a deleterious mutation load on patterns of influenza A/H3N2's antigenic evolution in humans
- Duke University, United States
- National Institutes of Health, United States
- Eidgenössische Technische Hochschule Zürich, Switzerland
Figures
Figure 1
The effect of a deleterious mutation load on the fate of an antigenic mutant.
(A) A resident antigenic strain at its deleterious mutation-selection balance. The histogram shows pk, the proportion of infected individuals carrying a virus with k deleterious mutations at its endemic equilibrium. The viral class carrying the fewest number of deleterious mutations is defined as mutation class k = 0. Inset: variation in the basic reproductive rate of infected individuals (gray histogram) and variation in the net reproductive rate R of infected individuals (brown histogram) resulting from variation in the number of deleterious mutations carried by circulating viruses. Model parameters: λ = 0.10, sd = 0.008, μ = 1/30 years−1, γ = 1/4 days−1, R0,k = 0 = 2.25. (B) Simulations showing the three dynamical fates that an antigenic mutant can experience: rapid loss (blue, with expanded inset), transient circulation (green), and successful establishment (red). The blue antigenic mutant (with σ = 0.008) arises in a genetic background with k = 16 deleterious mutations. The green antigenic mutant (with σ = 0.04) arises in a background of k = 10 deleterious mutations. The red antigenic mutant (with σ = 0.06) arises in a background of k = 5 deleterious mutations. All other parameters are as in (A). (C) The proportion of antigenic mutants that result in each of the three dynamical fates shown in (B) as a function of their antigenic size σ. All parameters as in (A). (D) The average antigenic size of successfully establishing antigenic mutants under different deleterious mutation rates λ (x-axis) and for three transmission fitness costs (see (E) for legend). The size of arising antigenic mutations σ are assumed to be gamma distributed with mean of 0.012 and a shape parameter of 2. All other parameters are as in (A). (E) The relative rate of antigenic evolution under different deleterious mutation rates λ (x-axis) and for the three transmission fitness costs shown in (D). Other model parameters are as in (D). The relative rate of antigenic evolution is given by the fraction of arising antigenic mutants that establish under the deleterious mutation load relative to the fraction of arising antigenic mutants that would establish under a no-load scenario. See ‘Materials and methods’ for choice of model parameters.
Figure 2

Epidemiological dynamics following the emergence of an antigenic mutant.
First row: antigenic mutants arising in low-load genetic backgrounds (k = 3 deleterious mutations). Second row: antigenic mutants arising in average-load genetic backgrounds (k = 13 deleterious mutations). Left column: antigenic mutants that are of a small size (σ = 0.004). Right column: antigenic mutants that are of a large size (σ = 0.045). (A) Small antigenic mutants arising in good genetic backgrounds transiently circulate. (B) Small antigenic mutants arising in average genetic backgrounds are rapidly lost. (C) Large antigenic mutants arising in good genetic backgrounds can successfully establish and exclude the resident antigenic strain, resulting in an antigenic cluster transition. (D) Large antigenic mutants arising in average genetic backgrounds transiently circulate. All simulations assume a host population size of N = 4 billion and start with a single antigenic strain at evolutionary and epidemiological equilibrium. The remaining parameters are as in Figure 1A.
Figure 3
Explosiveness in cluster invasion dynamics in the presence and absence of deleterious mutation accumulation.
(A) A representative example of the population dynamics of an antigenic mutant in the presence of deleterious mutation accumulation. The new antigenic strain invades and successfully establishes, while excluding the resident strain, characteristic of a successful antigenic cluster transition. Model parameters are N = 4 billion, μ = 1/30 years−1, γ = 1/4 days−1, λ = 0.10, sd = 0.008, R0,k = 0 = 2.25, and σ = 0.05. In this simulation, the antigenic mutant arises in a genetic background with k = 4 deleterious mutations. (B) A representative example of the population dynamics of an antigenic mutant in the absence of deleterious mutations. The new antigenic strain invades explosively, leading to its own burn-out along with exclusion of the resident strain. Model parameters are N = 4 billion, μ = 1/30 years−1, γ = 1/4 days−1, R0 = 2.04, and σ = 0.121. The value of R0 was chosen such that, prior to the invasion of the antigenic mutant, the fraction of the host population susceptible to infection and the number of infected hosts was the same across the two simulations. In (B), the value of σ was chosen such that Rm(t = 0) was the same across the two simulations (at a value of 1.13).
Figure 4
Influenza phylogenies consistent with the three distinct molecular pathways by which antigenic cluster transitions may occur.
(A) Maximum clade credibility (MCC) phylogeny showing the BE92-WU95 antigenic cluster transition, reconstructed from sequences spanning years 1993–1997. The phylogeny shows evolutionary dynamics that are consistent with a ‘jackpot’ combination of a large antigenic mutation arising in a rare low-load genetic background. Hemagglutination inhibition assays experimentally indicated that only a single amino acid change of large antigenic effect (145NK) was necessary to precipitate the cluster transition (Koel et al., 2013). Nodes are colored by the amino acid present at this site (145N = blue; 145K = red; other = black). (B) MCC phylogeny showing the WU95-SY97 antigenic cluster transition, reconstructed from sequences spanning years 1995–1999. The phylogeny shows evolutionary dynamics consistent with the two-step antigenic change molecular pathway leading to antigenic cluster transitions, as depicted in Figure 5A. Hemagglutination inhibition assays experimentally indicated that two amino acid changes (156KQ and 158EK) were necessary to precipitate the cluster transition (Koel et al., 2013). Nodes are colored by the amino acids present at these sites (156K158E = red; 156Q158K = blue; other = black). Note that both amino acid changes occur on the same short internal branch, such that this apparently rapid transition is unlikely to be an artifact of sparse sampling. (C) MCC phylogeny showing the SY97-FU02 and FU02-CA04 cluster transitions, reconstructed from sequences spanning years 2001–2005. The phylogeny shows evolutionary dynamics consistent with the two-step reassortant molecular pathway leading to antigenic cluster transitions, as depicted in Figure 5B. Hemagglutination inhibition assays experimentally indicated that only a single amino acid change (156QH) antigenically defined the SY97-FU02 cluster transition (Koel et al., 2013). Nodes are colored by the amino acid present at this site (156Q = blue; 156H = red). Vertical bar shows the FU02 reassortant clade. The genetically distant non-hemagglutinin (HA) parent lineage of this reassortant clade is also shown. Phylogenies in (A–C) were inferred using BEAST (Drummond et al., 2012) from full HA1 sequences with specified sampling dates.
Figure 5
Two-step approaches to antigenic cluster transitions.
(A) A cluster transition arising from two consecutive antigenic mutations. A small antigenic mutation (σ = 0.003, dashed line) first arises in a good genetic background (deleterious mutation load k = 2) of the resident strain (dotted line). Shortly after, a second and larger-sized antigenic mutation (σ = 0.045, solid line) occurs in an individual infected with the single antigenic mutant. This sequence of events precipitates an antigenic cluster transition, with the double mutant replacing the resident strain and the low-frequency single mutant. We assume that the degree of immune escape is additive, such that σ between the resident strain and the double mutant is σ = 0.048. (B) A cluster transition arising from intrasubtypic viral reassortment. A large-sized antigenic mutation (σ = 0.06, dashed line) first arises in an average genetic background (k = 10) of the resident strain (dotted line). After 2.5 years of circulation, a coinfection that leads to the generation of low-load mutant (k = 4) occurs. This low-load mutant (solid line) replaces the resident strain and the average-load carrying antigenic mutant, ultimately precipitating an antigenic cluster transition. Other model parameters in (A) and (B) are N = 4 billion, μ = 1/30 years−1, γ = 1/4 days−1, R0,k = 0 = 2.25, λ = 0.10, and sd = 0.008.
Figure 6
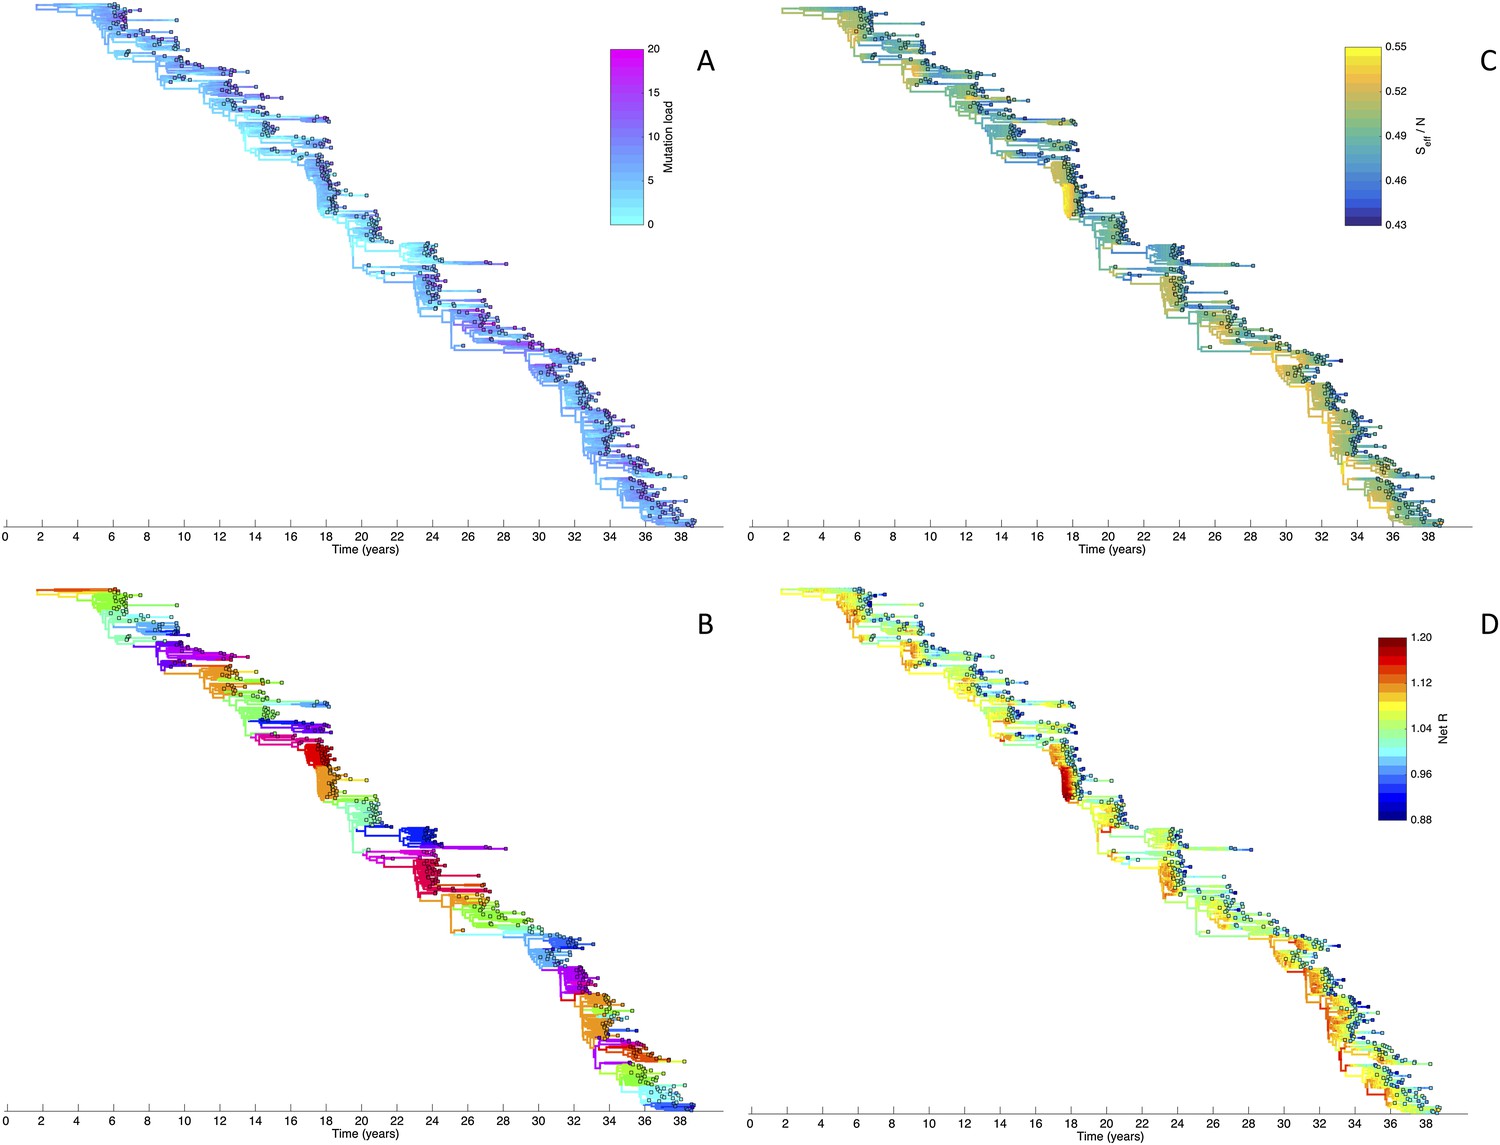
Viral phylogenies from a simulation of the phylodynamic model incorporating antigenic and non-antigenic mutations.
(A) Simulated phylogeny reproducing H3N2's spindly HA phylogeny, with low levels of genetic and antigenic diversity over the long run. Lineages are colored according to their deleterious mutation loads. (B) Simulated phylogeny shown in (A) with lineages colored according to their antigenic type. Similarly colored lineages that are genetically distinct are antigenically distinct (colors were re-used due to their limited number). (C) Simulated phylogeny shown in (A) with lineages colored according to the fraction of the host population susceptible to infection with that lineage (Seff/N). (D) Simulated phylogeny shown in (A) with lineages colored according to their net reproductive rate R.
Figure 7

Fitness variance dynamics, epidemiological dynamics, and times to most recent common ancestor for a simulation of the phylodynamic model incorporating antigenic and non-antigenic mutations.
(A) The fraction of (log) viral fitness variation explained by deleterious mutations over time for the simulation whose phylogenies are plotted in Figure 6. The fraction not explained by mutation load is due to antigenic variation in the population. (B) Simulated epidemiological dynamics showing co-circulation of multiple antigenic variants and sustained prevalence levels over time for this same simulation. (C) Times to the most recent common ancestor (tMRCAs), computed over time from the phylogenies shown in Figure 6.
Figure 8
Simulations of the phylodynamic model in the absence of a deleterious mutation load.
(A) Simulated phylogeny showing explosive genetic and antigenic diversity over a 20-year period. Lineages are colored according to their antigenic type, with similarly colored lineages that are genetically distinct being antigenically distinct (colors were re-used due to their limited number). (B) Simulated epidemiological dynamics showing prevalence levels generally increasing over time.
Figure 9
Simulations of the phylodynamic model in the absence of antigenic mutations.
(A) Simulated phylogeny under a parameterization with no antigenic mutations, showing genetic diversity generally increasing over time. (B) Times to the most recent common ancestor (tMRCAs) computed over time from the phylogeny shown in (A).
Figure 10
Sensitivity of evolutionary and epidemiological dynamics to parameters of the phylodynamic model.
Subplots (A, B) show model sensitivity to the deleterious mutation rate λ. Subplots (C, D) show model sensitivity to the fitness cost of deleterious mutations sd. Subplots (E, F) show model sensitivity to the antigenic mutation rate λantigenic. The top row shows maximum (red dots) and minimum (black dots) times to the most recent common ancestor (tMRCAs) for 20 independent simulations. The red dashed line indicates the maximum tMRCA inferred from a phylogenetic analysis of influenza A/H3N2's HA (Bedford et al., 2011); the black dashed line indicates the minimum tMRCA inferred from this same analysis. The bottom row shows maximum (red dots) and minimum (black dots) annual attack rates for the same 20 simulations. The red dashed line indicates an estimate of the maximum annual attack rate for influenza A/H3N2; the black dashed line indicates an estimate of the minimum annual attack rate for influenza A/H3N2. These values are based on annual attack rate estimates in adults of 5–10%, such that the maximum annual attack rate is on the order of 10%, and the minimum annual attack rate is shown at 1% (which would correspond to years of negligible circulation of this influenza subtype). Each simulation was run for 28 years, and minimum and maximum tMRCAs and attack rates were computed from years 15–25 of the simulation. In subplots (A) and (B), λ is varied, sd = 0.008 and λantigenic = 0.00075. In subplots (C) and (D), λ = 0.10, sd is varied, and λantigenic = 0.00075. In subplots (E) and (F), λ = 0.10, sd = 0.008, and λantigenic is varied. All other parameter values are as listed in Figure 6.
Download links
A two-part list of links to download the article, or parts of the article, in various formats.
Downloads (link to download the article as PDF)
Open citations (links to open the citations from this article in various online reference manager services)
Cite this article (links to download the citations from this article in formats compatible with various reference manager tools)
The effects of a deleterious mutation load on patterns of influenza A/H3N2's antigenic evolution in humans
eLife 4:e07361.
https://doi.org/10.7554/eLife.07361


