A molecular mechanism underlying gustatory memory trace for an association in the insular cortex
- University of Haifa, Israel
Figures
Figure 1 with 1 supplement
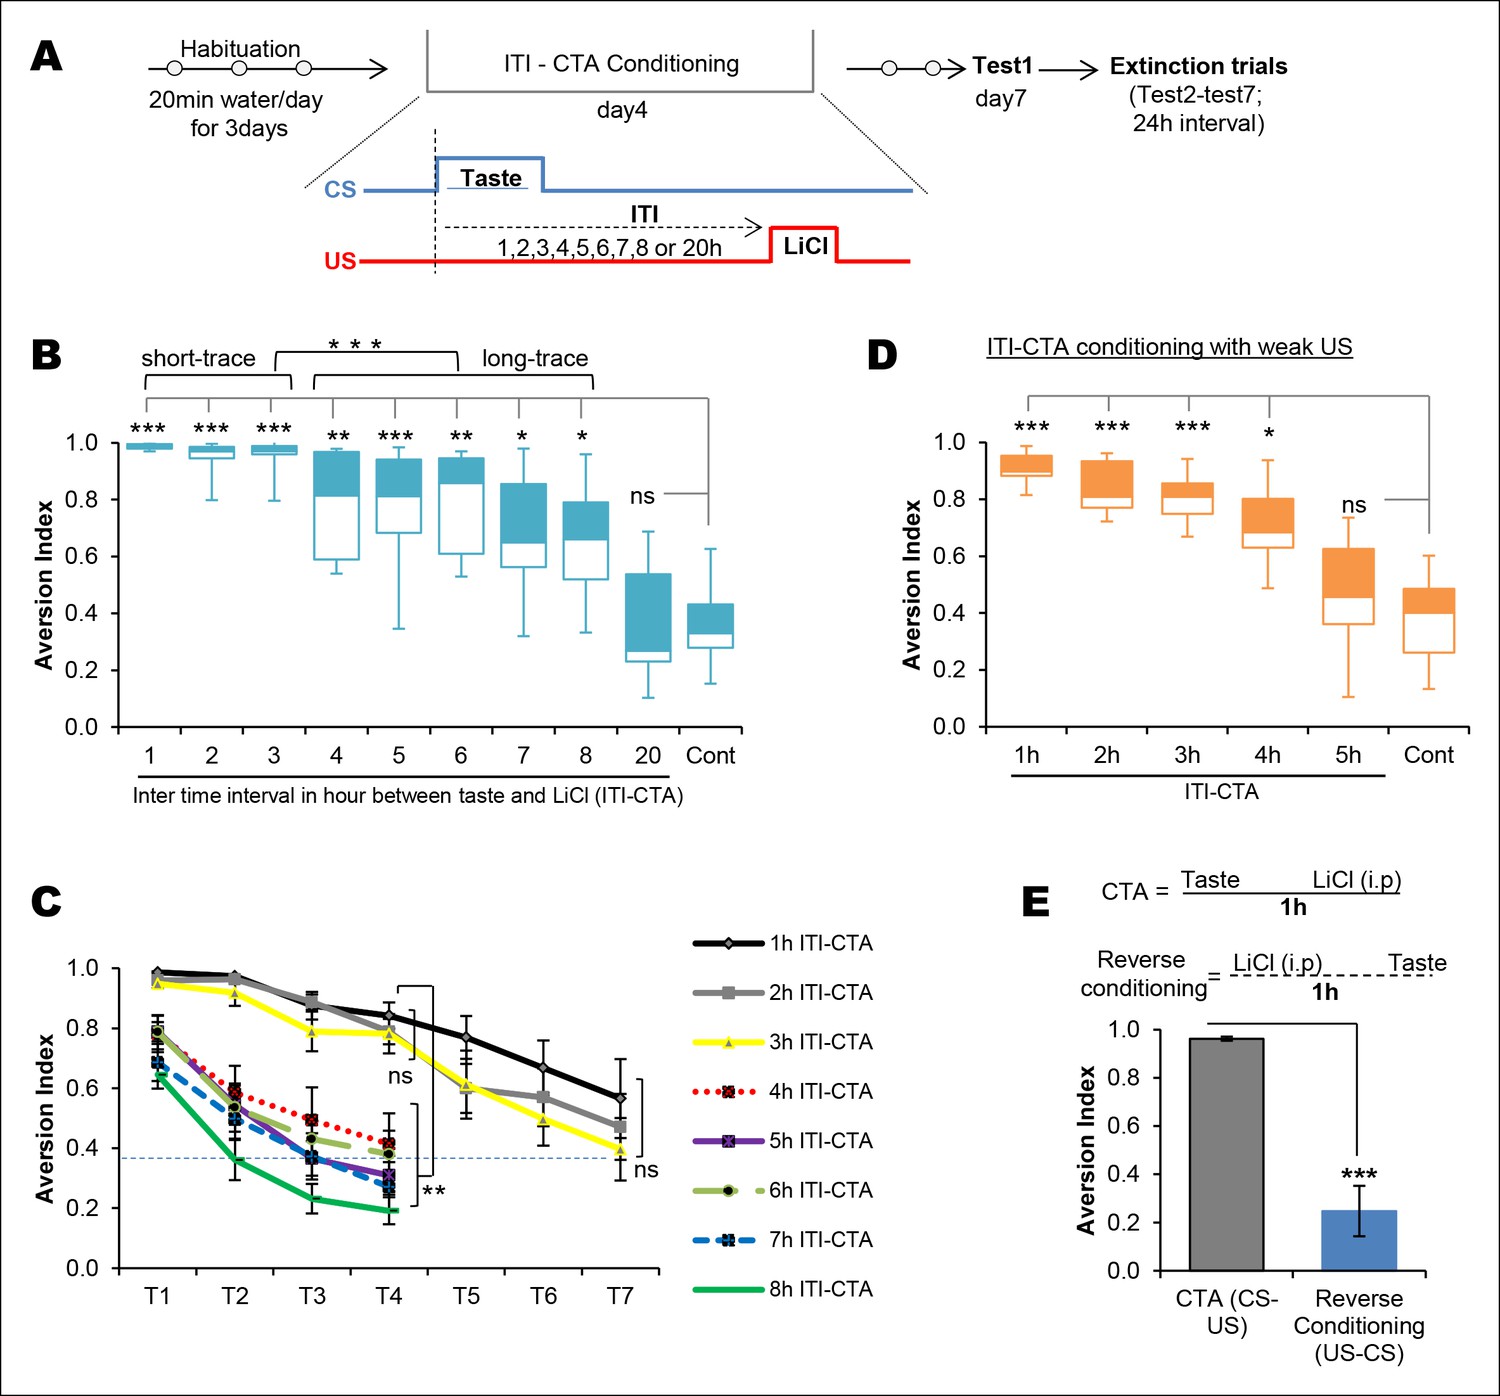
Temporal boundaries of taste memory trace for the association with malaise in CTA.
(A) Schematic diagram of the experimental design. CS, 0.1% saccharin and US, 0.15M LiCl. (B) Box-whisker plots showing Test1 results (memory). 1–8 hr ITI-CTA groups but not 20 hr ITI-CTA group showed significantly higher aversion index (AI; a measure of CTA memory) compared to control group. There are two different clusters among 1–8 hr ITI-CTA groups: short-trace (1–3 hr ITI-CTAs) and long-trace (4–8 hr ITI-CTAs). (C) 1–3 hr ITI-CTA groups exhibited a similar pattern of extinction and reached AI similar to control group by Test7 whereas 4–8 hr ITI-CTA groups extinguished CTA memory by Test4. Dashed line denotes the mean AI of the control group upon Test1. (D) Box-whisker plots showing test1 results following ITI-CTA conditioning with weak US (0.025M LiCl). 1 hr, 2 hr, 3 hr, 4 hr but not 5 hr ITI-CTA groups were significantly different from the control group. (E) Top: schematic representation of the CTA conditioning and reverse conditioning trials. In reverse conditioning the novel taste was presented 1 h after the LiCl injection. Bottom: reverse conditioning group did not show CTA. Data in B and D are median and quartile range between 25% to 75%. Data in C and E are mean ± SEM, *p <0.05, **p <0.01, ***p <0.001. n ≥ 5. See also Figure 1—source data 1 and Figure 1—figure supplement 1.
-
Figure 1—source data 1
Statistical analysis of Figure 1.
Kruskal-Wallis non-parametric ANOVA (1B, 1E), cluster analysis (1B), Mann-Whitney test (1B) and Friedman's non-parametric repeated measures ANOVA (1C) and independent samples t-test (1F) were conducted to analyse the group effect.
- https://doi.org/10.7554/eLife.07582.004
Figure 1—figure supplement 1
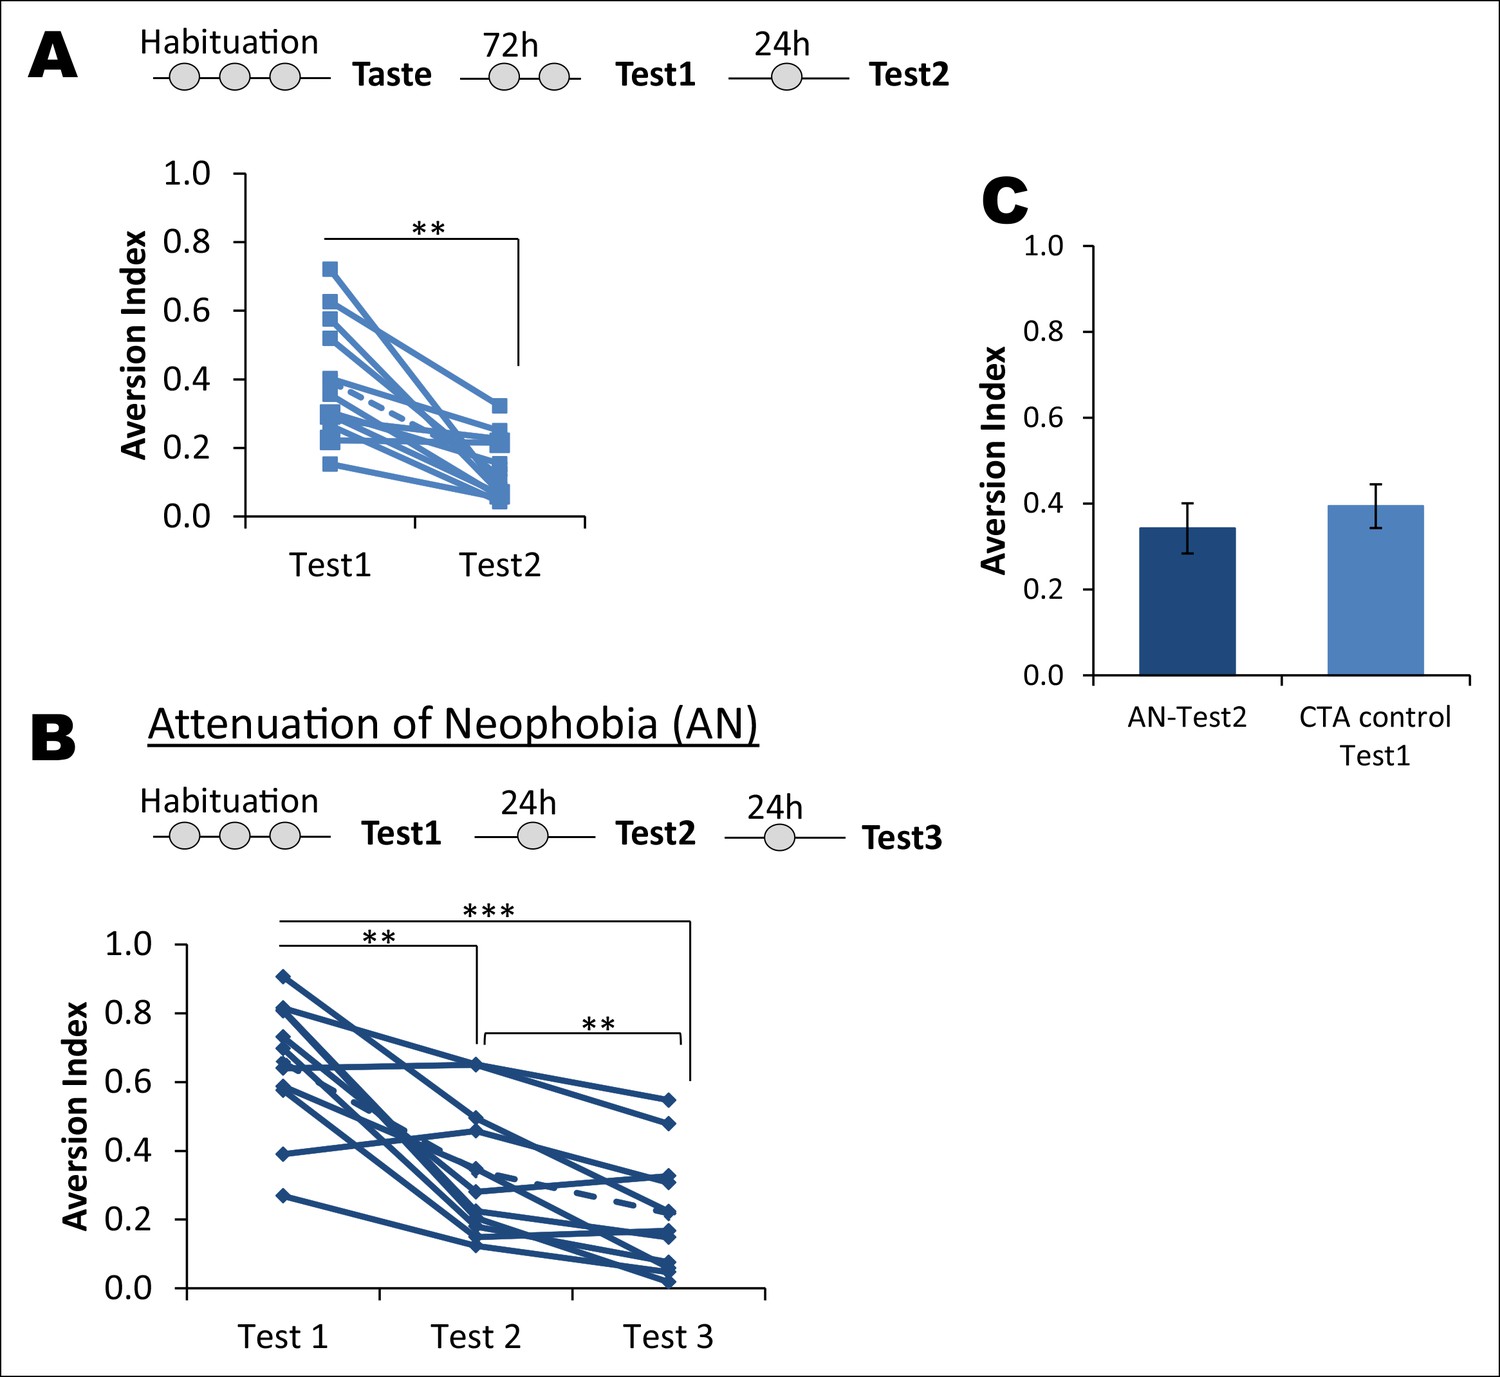
Attenuation of taste neophobia.
(A) The control group from the main Figure 1B, which exhibited taste aversion of about 36% upon the second taste encounter (Test1), demonstrated less aversion on the third taste encounter (paired t-test between Test1 and Test2; T = 4.781, p=0.001). Upper panel depicts the experimental design. (B) Rats demonstrated high aversion to a novel palatable taste upon sampling for the first time. This is referred to as neophobia, i.e., reluctance to consume a novel taste due to lack of knowledge regarding the post-ingestive consequences. However, rats exhibited less aversion upon the second and third encounter, demonstrating that taste preference is an adaptive process. This phenomenon is called attenuation of neophobia. Each line represents a rat and a dotted line is a mean of the group (one way ANOVA; F (1.427, 14.273) = 27.925, p=0.00003. Bonferroni post hoc test, between Test1 and Test2 p=0.004; Test2 and Test3 p=0.009; and Test1 and Test3 p=0.0003). (C) As expected, the CTA control group upon Test1 (i.e. second time consumption of the novel taste) did not differ from Test2 of attenuation of neophobia group (T (19) = 0.954, p=0.352), indicating that ingesting a taste only once is not sufficient to determine that the taste is completely safe to consume and thus rats need to ingest the same taste at least three times to form a memory that the taste is completely safe.
Figure 2 with 3 supplements
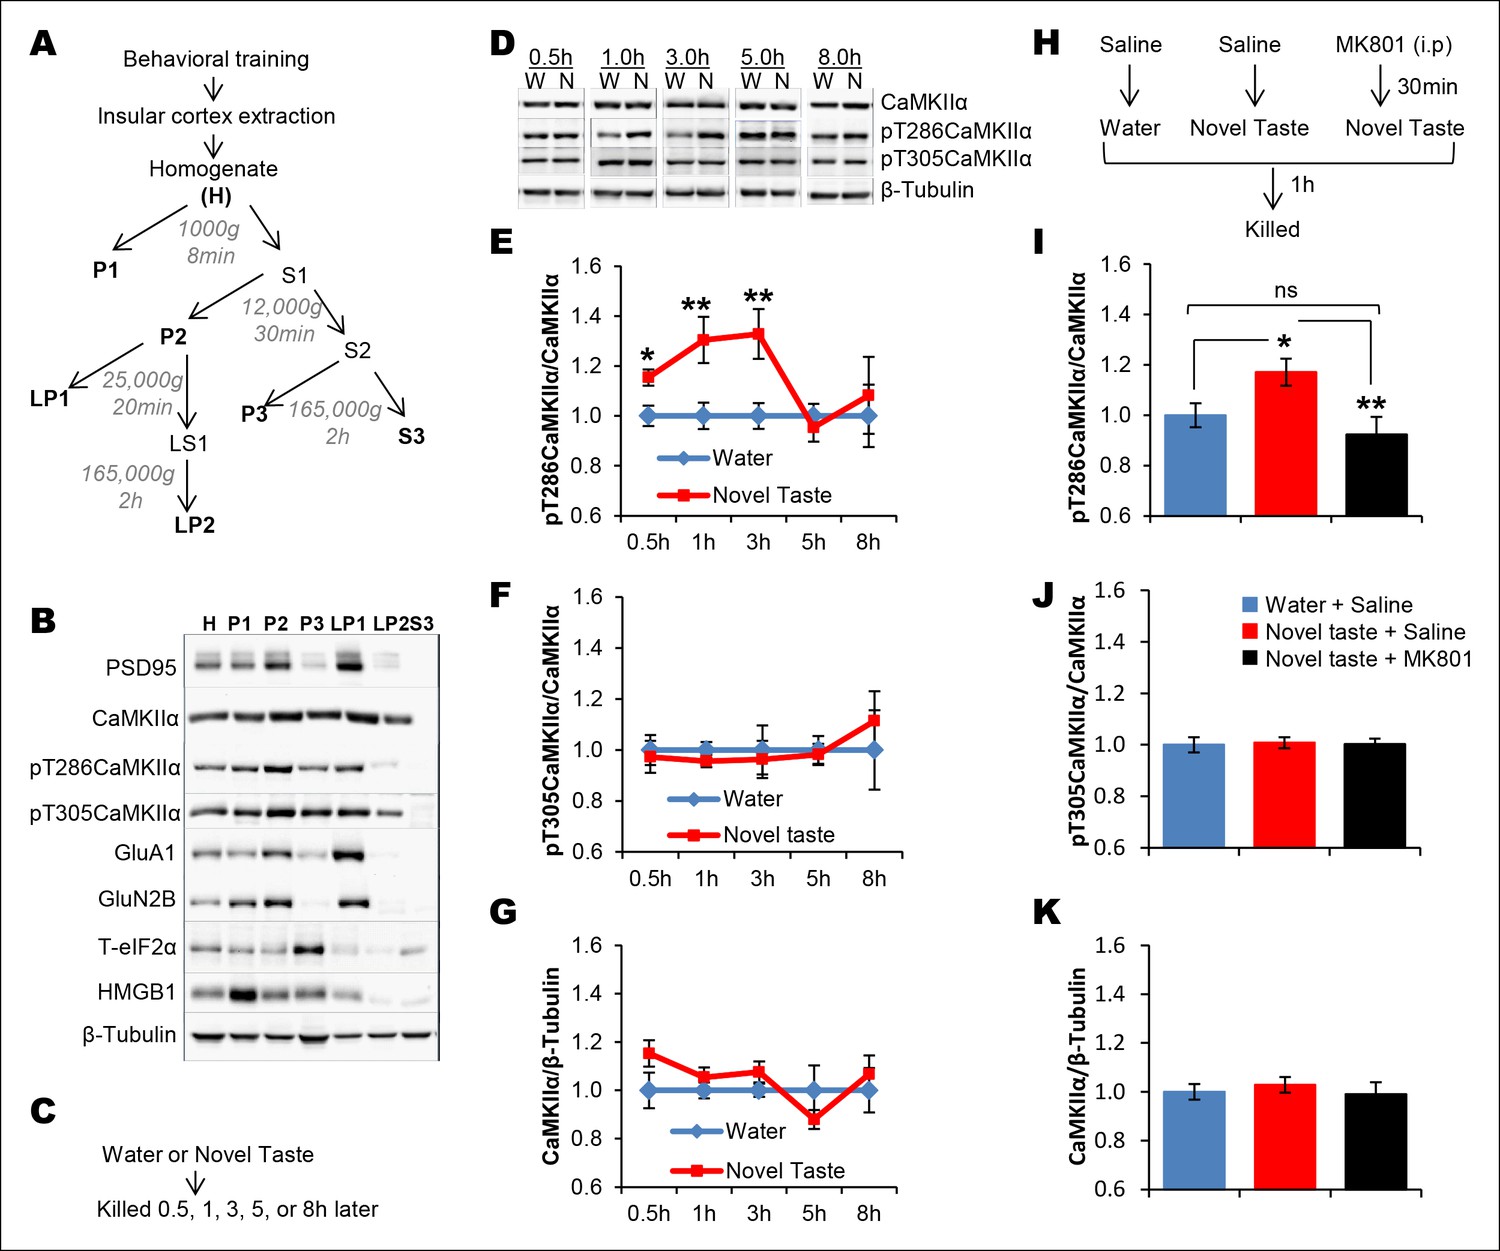
Novel taste experience induces CaMKIIα phosphorylation in the IC in an NMDAR-dependent manner.
(A) Experimental design depicting biochemical fractionation from the IC after behavioral training. (B) Representative immunoblots of marker proteins for different fractions. (C) Rats were sacrificed at the indicated time points after exposure to either water or novel taste solution. (D) Representative pT286CaMKIIα, pT305CaMKIIα, and total CaMKIIα immunoblots from P2-fractions of water (W) and novel taste (N) groups are shown. (E) Novel taste groups showed increased pT286CaMKIIα levels in the IC synaptosomal fraction at 0.5, 1, and 3 hr compared to water controls. 5 and 8 hr groups showed no difference in pT286CaMKIIα levels between water and novel taste groups. (F,G) There was no difference in (F) pT305CaMKIIα and (G) total CaMKIIα levels between water and novel taste groups at any time point. (H) Schematic representation of experimental design. Rats were injected with saline or MK801 30 min before they were exposed to water or novel taste, and 1 hr later were sacrificed and IC was extracted. (I) Novel taste group injected with saline showed increased pT286CaMKIIα compared to water group. MK801-injected groups which received novel taste did not differ from the water group but expressed significantly less phosphorylated CaMKIIα (pT286) than novel taste group injected with saline. (J,K) There was no difference in (J) pT305CaMKIIα and (K) total CaMKIIα levels between any groups. Data are mean ± SEM, *p<0.05, **p<0.01. n ≥ 6. See also Figure 2—source data 1 and Figure 2—figure supplement 1–3.
-
Figure 2—source data 1
Statistical analysis of Figure 2.
Independent samples t-test (2E, 2F, 2G) and one way ANOVA (2I, 2J, 2K) were conducted to analyse the group effect.
- https://doi.org/10.7554/eLife.07582.007
Figure 2—figure supplement 1
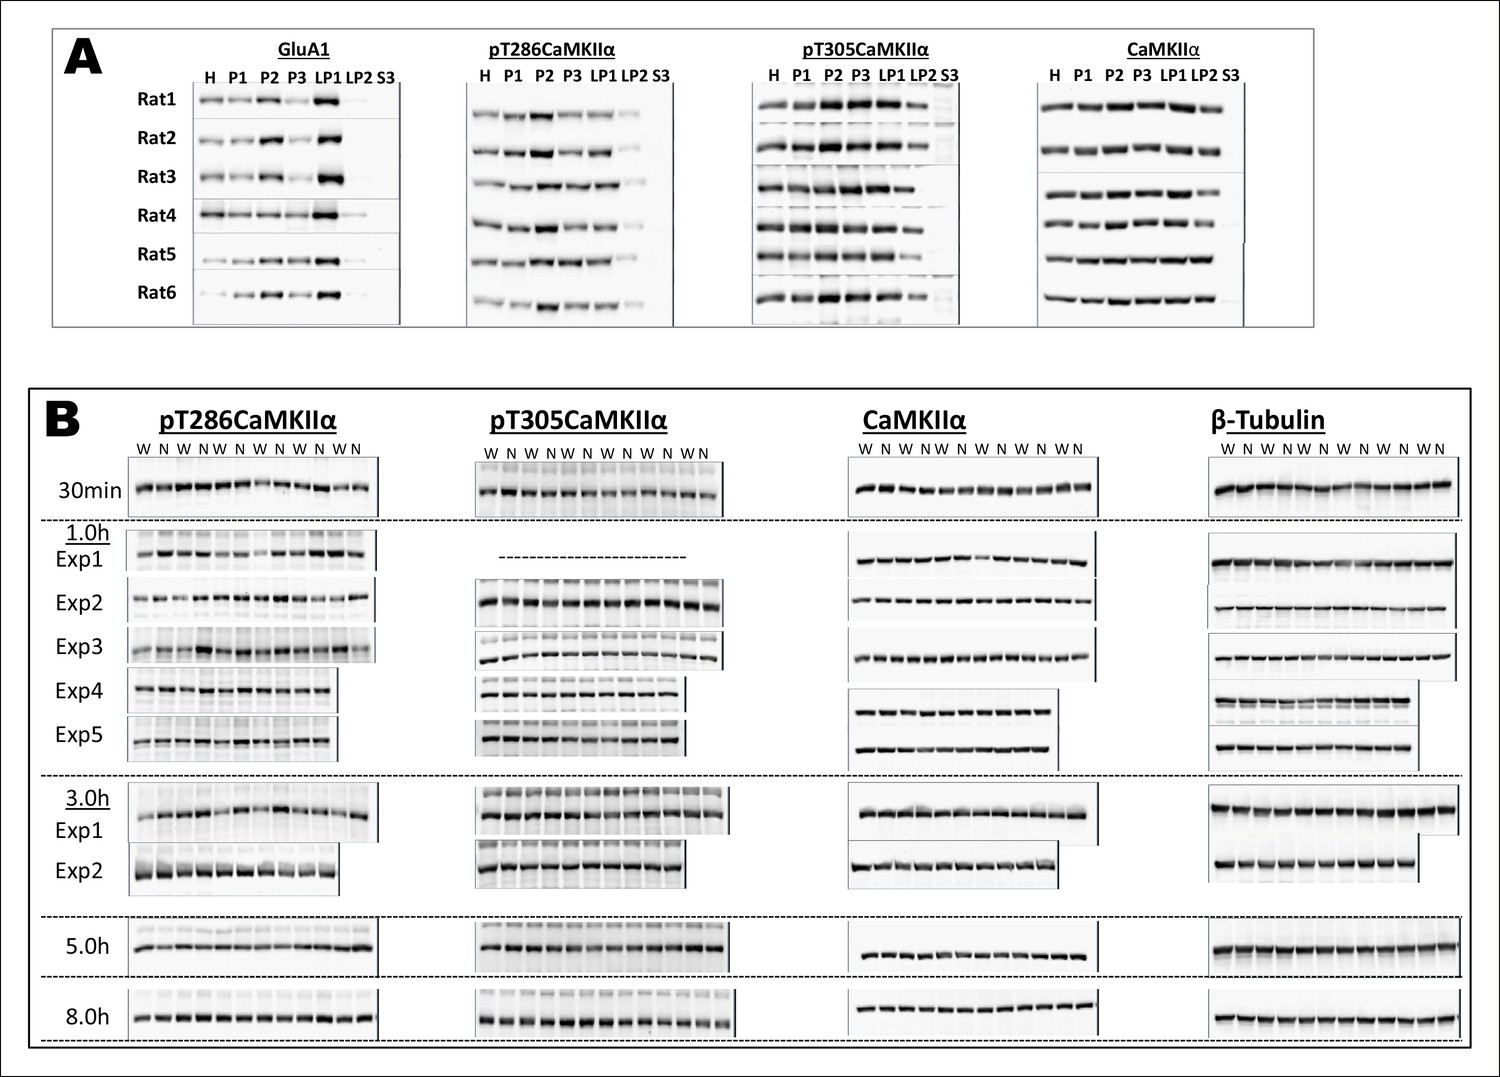
Uncropped immunoblots of main Figure 2.
(A) Immunoblots showing the expression patterns of GluA1, pT286CaMKIIα, pT305CaMKIIα, CaMKIIα in H, P1, P2, P3, LP1, LP2, and S3 fractions. Note the enrichment of pT286CaMKIIa in P2-fraction (synaptosomal fraction). (B) Thus, P2 fraction was further used for the expression analysis of the aforementioned proteins after the rats were exposed to either water or novel taste solution. All the uncropped original immunoblots for Figure 2D,E, and F are shown. W and N denote water and novel taste, respectively.
Figure 2—figure supplement 2
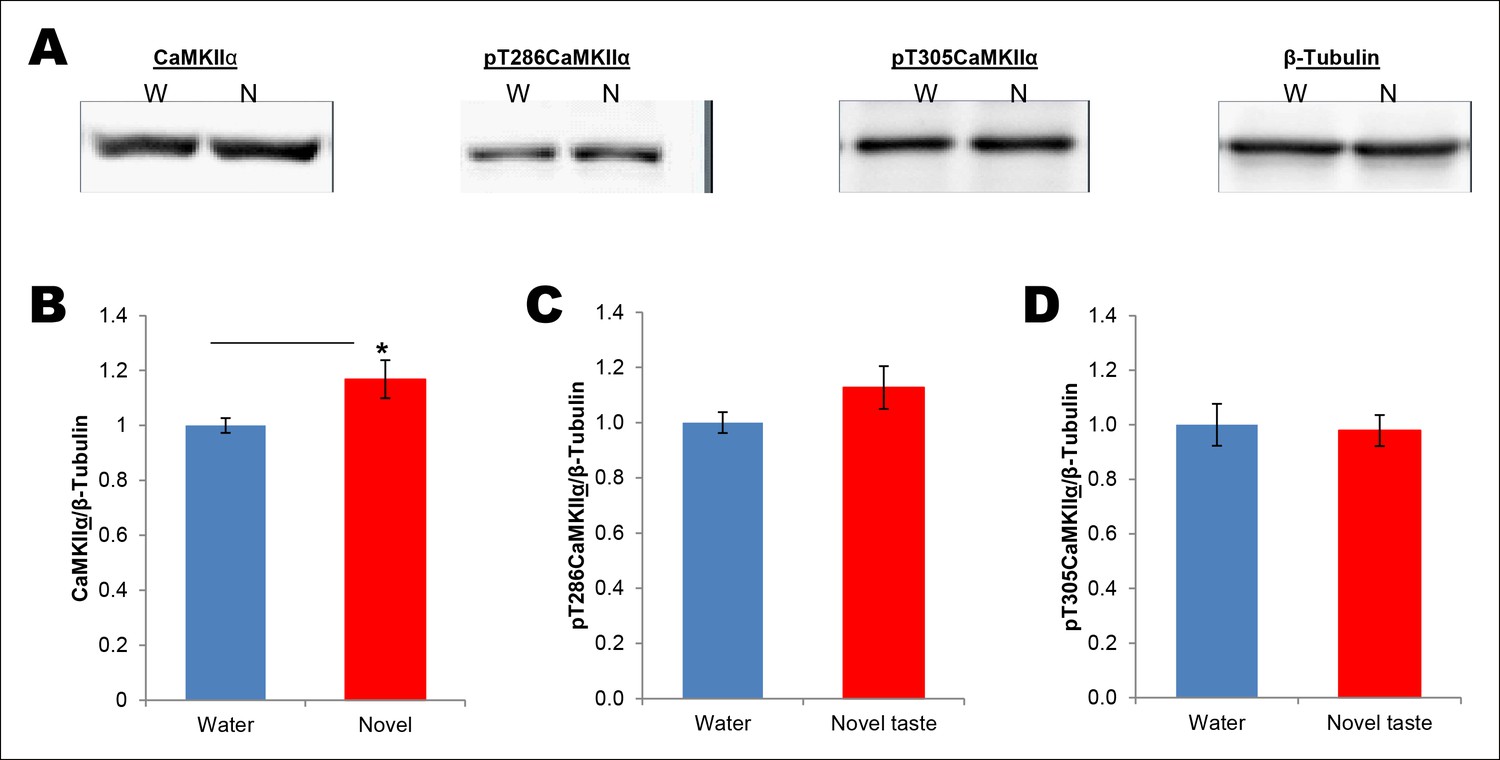
Total amount of CaMKIIα in the synaptoneurosomal fractions from IC is increased 15 min following novel taste learning.
(A) 25 min after the rats were exposed to water or novel taste, they were sacrificed, and immunoblot analysis was conducted using the P2 fraction. (B) Consistent with a previous report (Belelovsky et al., 2005), novel taste experience significantly increased total CaMKIIα compared to water controls (T (10) = -2.273, p=0.046). (C,D) There was a non-significant trend in the novel taste group in pT286CaMKIIα (T (10) = -1.471, p= 0.17) and pT305CaMKIIα did not differ between water and novel taste groups (T (10) = -0.134, p=0.896).
Figure 2—figure supplement 3
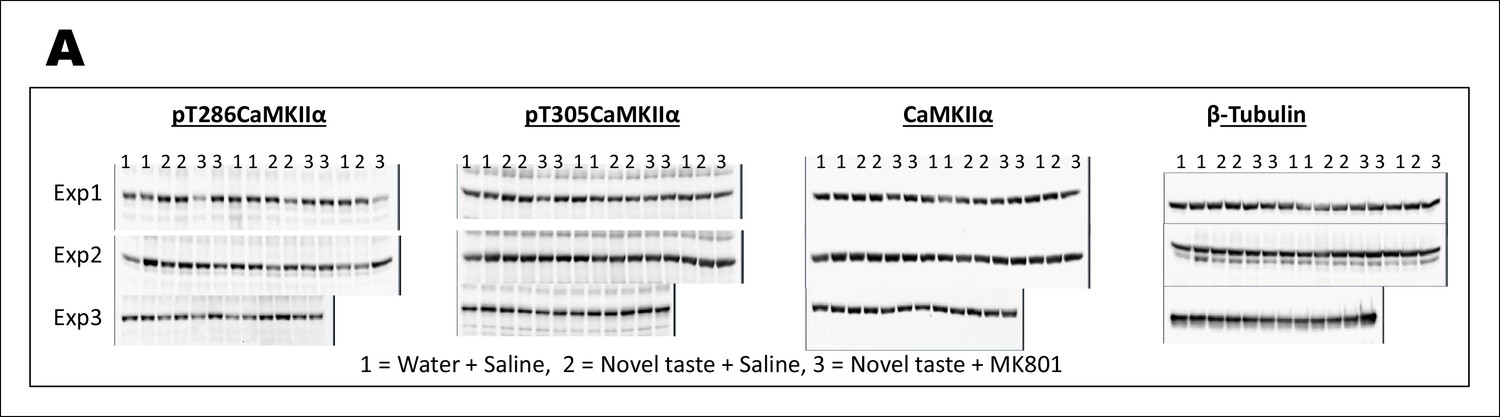
Uncropped immunoblots of main Figure 2.
(A) Immunoblots of pT286CaMKIIα, pT305CaMKIIα, CaMKIIα, and β-Tubulin from P2-fraction for Figure 2I–K are shown.
Figure 3 with 4 supplements
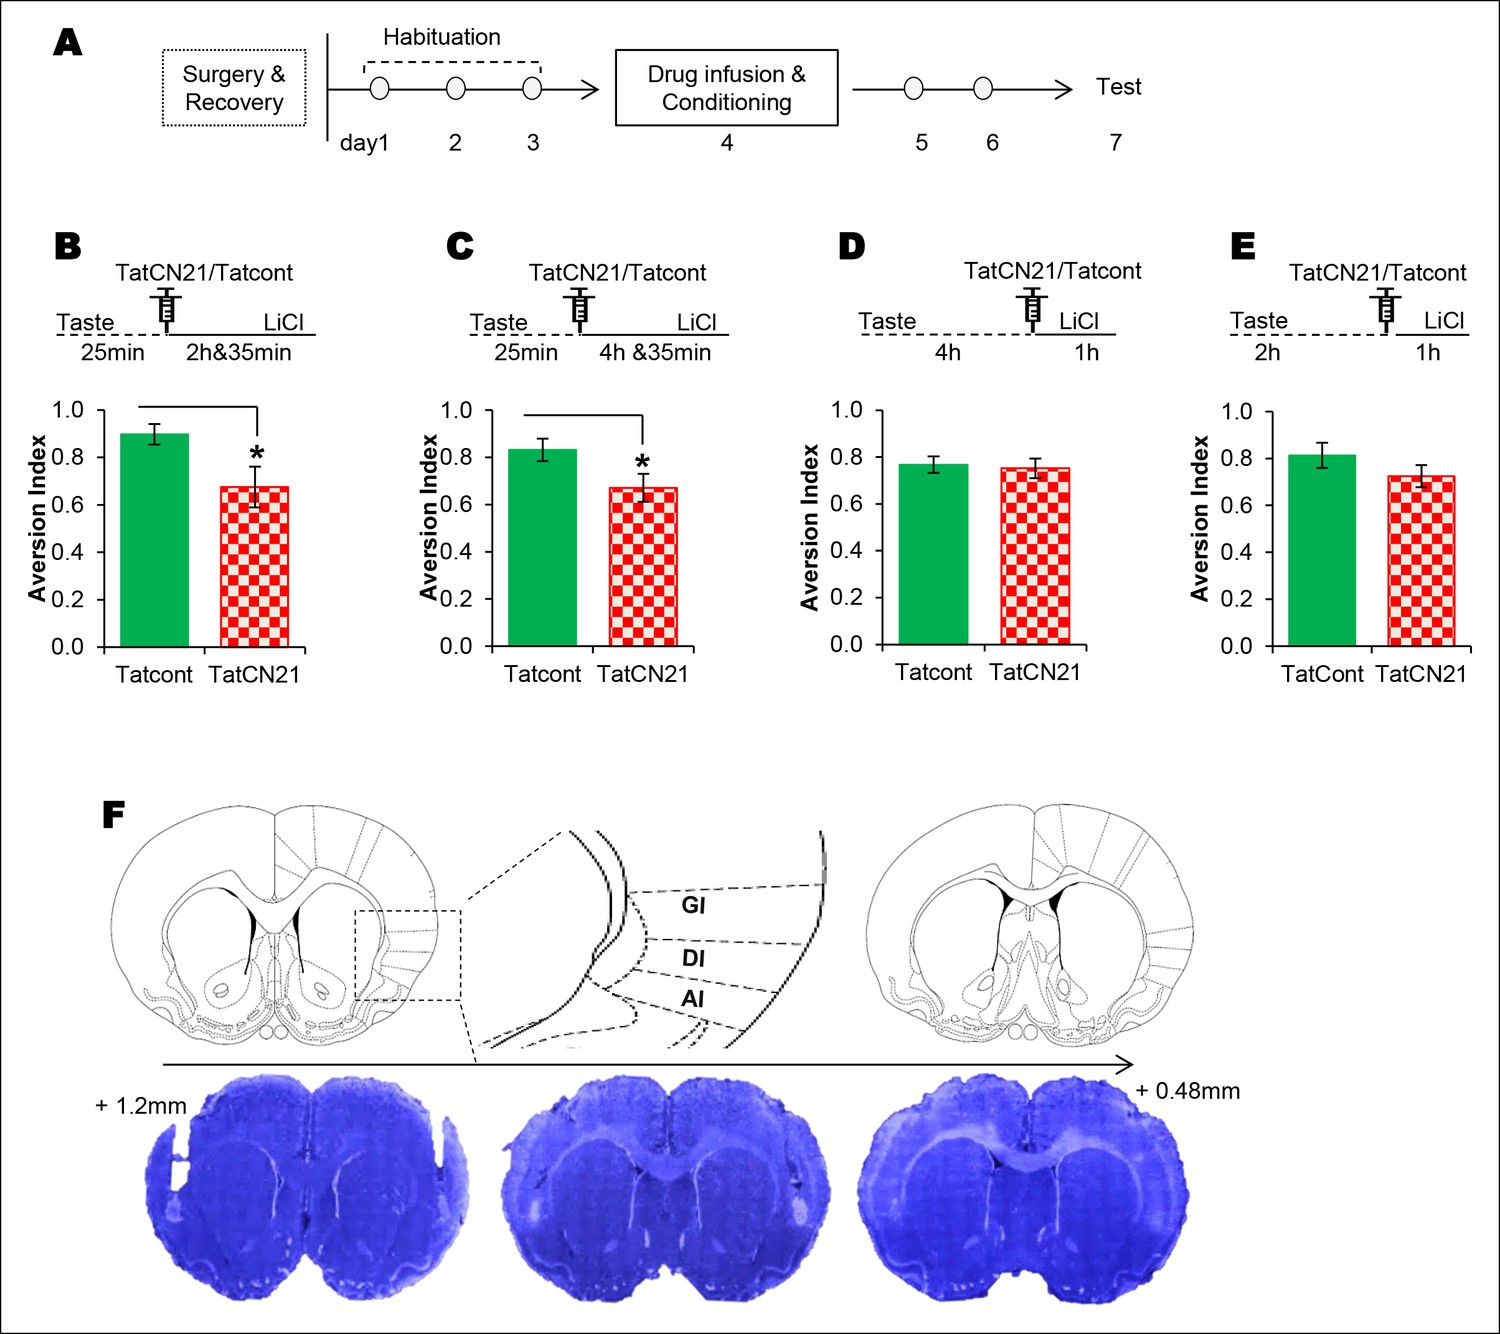
The requirement of CaMKIIα in the IC for associative learning of CTA is a function of time.
(A) Outline of the experimental design. (B) Infusion of CaMKIIα inhibitor TatCN21 into the IC 25 min after the taste consumption in 3 hr ITI-CTA conditioning attenuated the CTA memory. (C) Infusion of CaMKIIα inhibitor TatCN21 into the IC 25 min after the taste consumption in 5 hr ITI-CTA conditioning attenuated the CTA memory. (D) Infusion of CaMKIIα inhibitor TatCN21 into the IC 4 hr after the taste consumption in 5 hr ITI-CTA conditioning had no effect on CTA memory. (E) TatCN21 micro-infusion 2 hr after the consumption of taste in 3 hr ITI-CTA training did not affect the CTA memory. Upper panel in B, C, D, and E depict the conditioning trial. The syringe represents microinfusion. (F) A series of coronal sections from a representative rat brain, showing the cannula placement in the rostro-caudal planes (lower panel) and the corresponding coronal sections of rat brain atlas images (upper panel). Abbreviations; AI-agranular insular cortex, DI-disgranular insular cortex, GI-granular insular cortex. Data are mean ± SEM, *p <0.05. n ≥ 11. See also Figure 3—source data 1 and Figure 3—figure supplement 1–4.
-
Figure 3—source data 1
Statistical analysis of Figure 3.
Independent samples t-test was conducted to analyse the group effect. The differences between the variances of groups were corrected following Levene’s test for equality of variances.
- https://doi.org/10.7554/eLife.07582.012
Figure 3—figure supplement 1
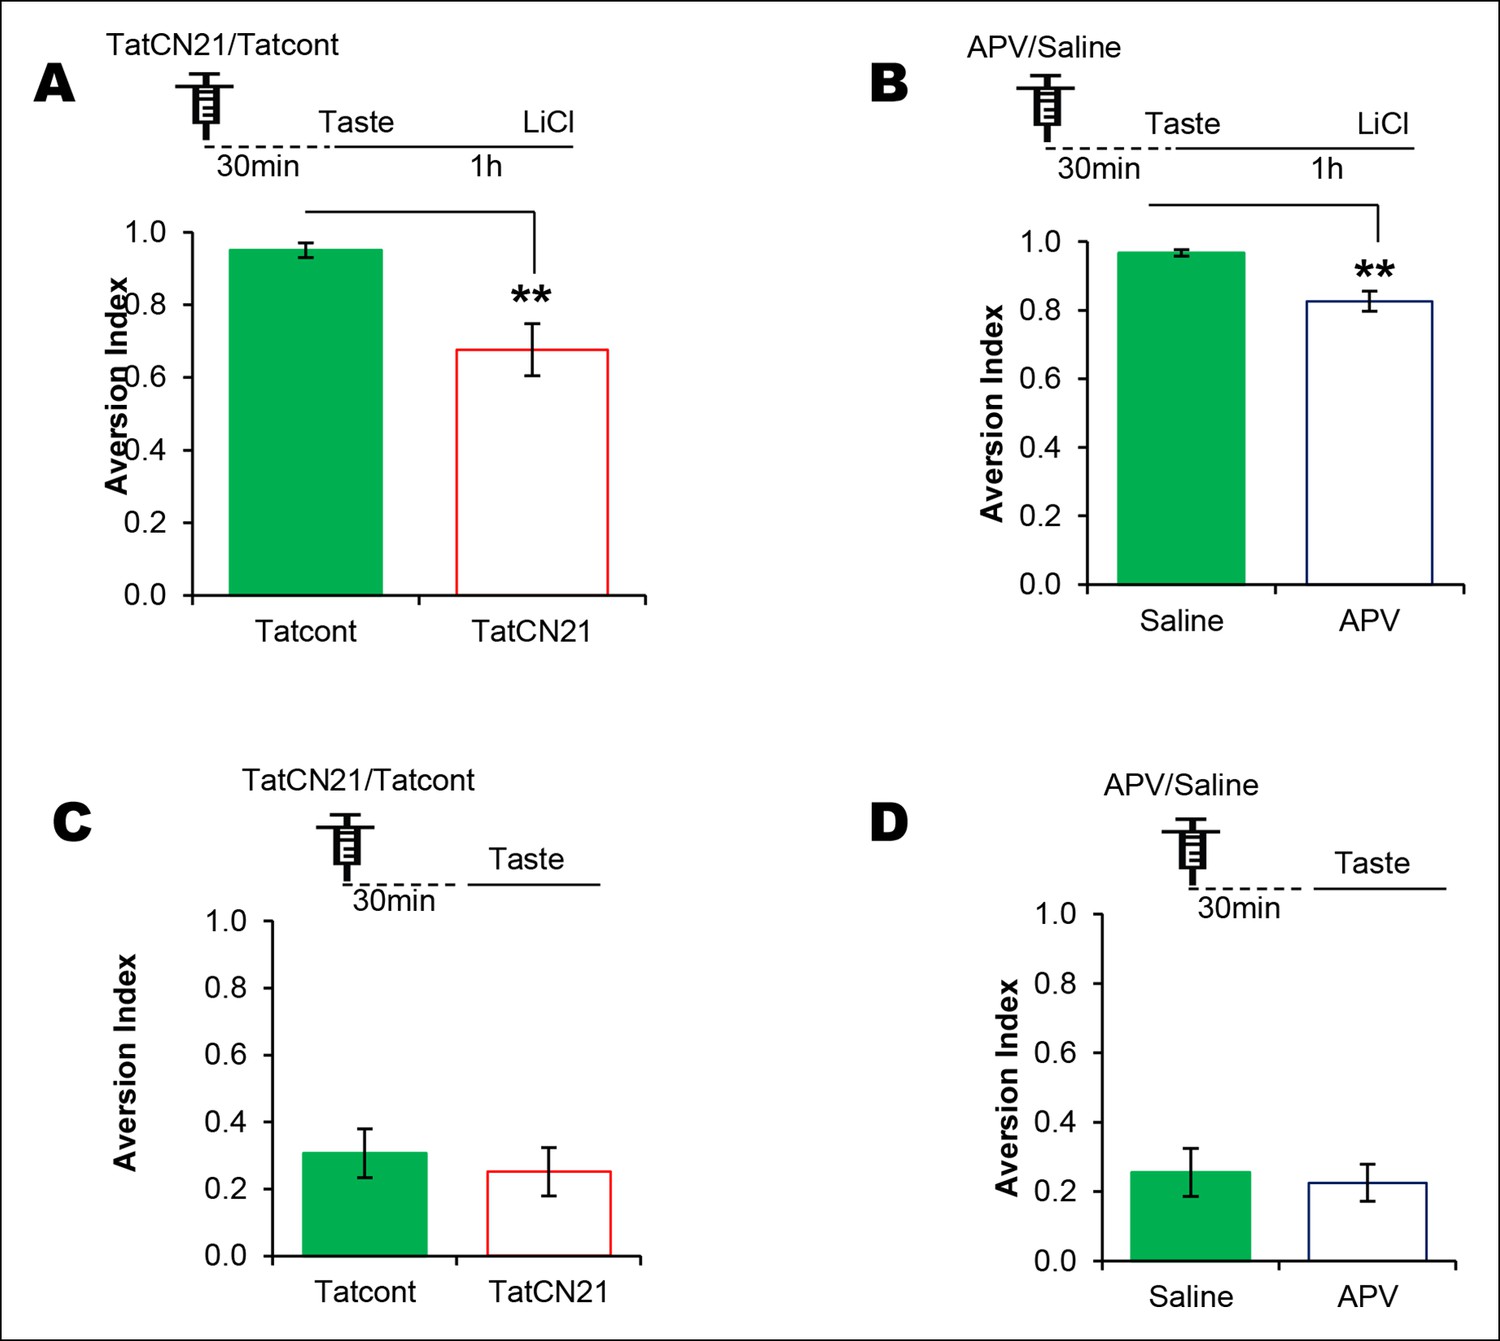
NMDAR and CaMKIIα in the IC are required for associative but not for incidental taste learning.
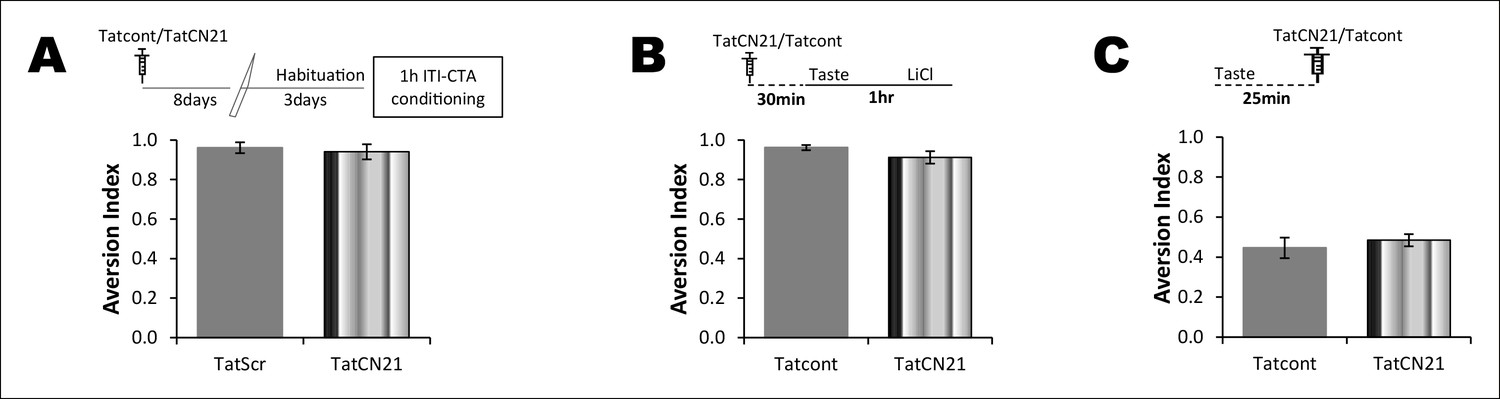
We investigated whether CaMKIIα and its upstream NMDAR in the IC are required for associative CTA and/or incidental taste learning. (A) Infusion of CaMKIIα inhibitor TatCN21 into the IC 30 min before 1 hr ITI-CTA conditioning disrupted CTA memory. (B) Infusion of NMDAR antagonist APV (10 μg/μl) into the IC 30 min before 1 hr ITI-CTA conditioning disrupted CTA. (C) TatCN21 infusion 30 min before novel taste consumption did not affect the incidental taste memory. (D) APV infusion 30 min before novel taste consumption did not affect the incidental taste memory. Upper panels in all graphs depict the conditioning trial. Data are mean ± SEM, **p<0.01.
Figure 3—figure supplement 2
The effect of CaMKIIα inhibitor on CTA learning is a function of time and concentration of TatCN21.
(A) Top: schematic representation of experimental design. Rats underwent CTA conditioning 8 days after TatCN21 microinjection into the IC. TatCN21 (0.3 nM/μl) did not have an effect on CTA learning and memory (n=Tatcont, 4; TatCN21, 5; T (7) = 0.407, p=0.696). (B) Upper panel shows the conditioning paradigm. Microinjection of low concentration of TatCN21 (0.05 nM/μl) into the IC 30 min before 1 hr ITI-CTA conditioning did not have an effect on CTA learning (n = Tatcont, 4; TatCN21, 5; T (7) = 1.596, p=0.154). (C) CaMKIIα inhibition 25 min after taste consumption did not have an effect on the non-associative form of incidental taste memory (n = Tatcont, 14; TatCN21 (0.3 nM/μl), 14; T (20.97) = 0.669, p=0.511).
Figure 3—figure supplement 3
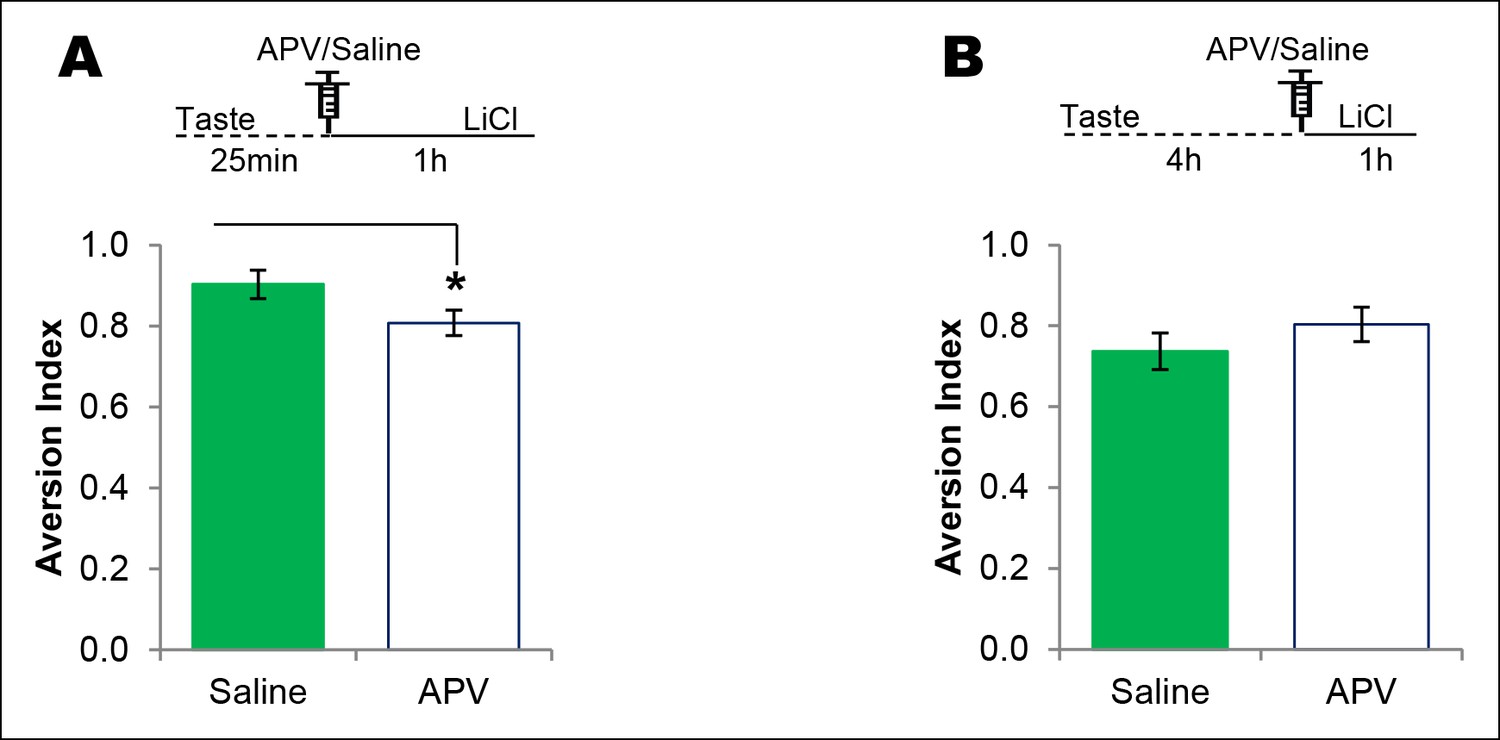
NMDAR in the IC plays a time-dependent role in CTA learning.
(A) Microinjection of NMDAR antagonist, APV, into the IC 25 min after the consumption of novel taste in 1 hr ITI-CTA conditioning with US attenuated CTA memory (T (16) = 2.046, p=0.05). (B) APV micro-infusion 4 hr after the taste in 5 hr ITI-CTA conditioning did not affect the CTA memory (T (15) = 1.069, p=0. 302).
Figure 3—figure supplement 4
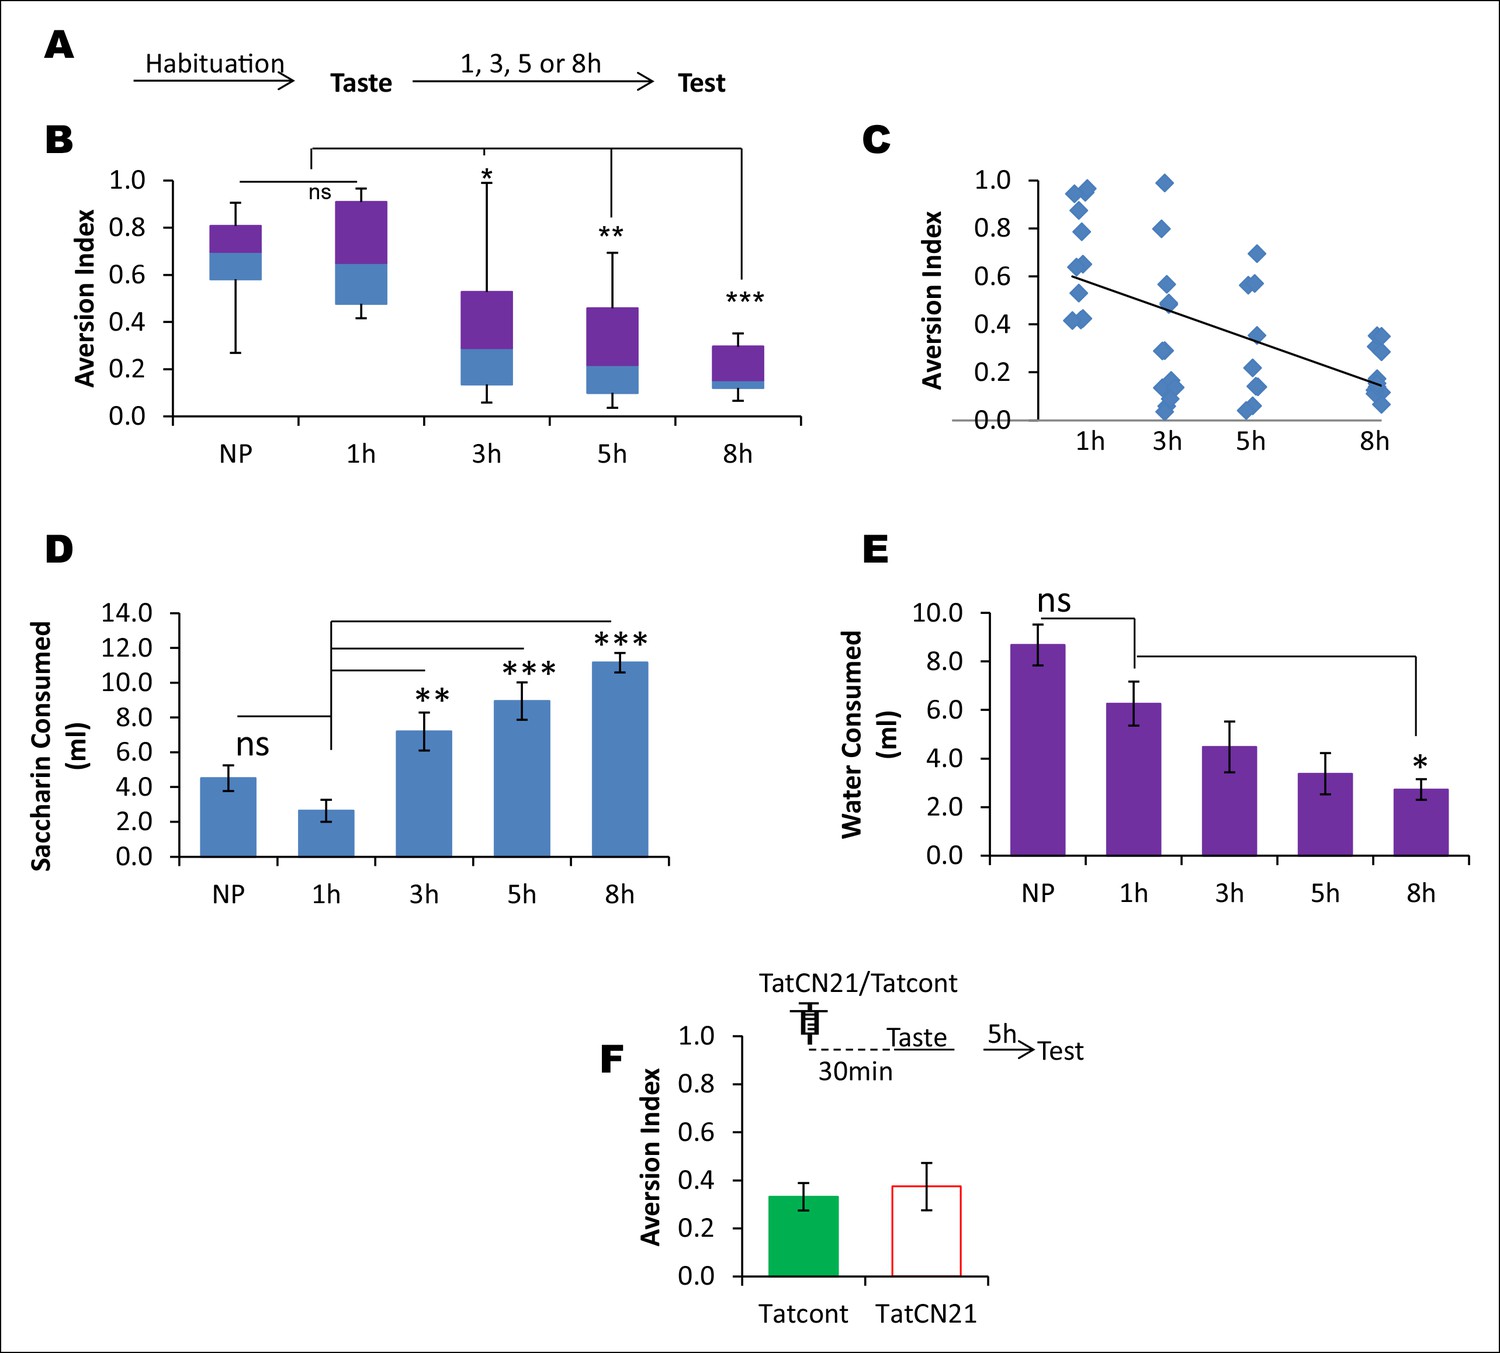
CaMKIIα in the IC does not affect the learned safety about the taste.
In order to test the possibility that the effects produced by TatCN21 in Figures 3B,C are attributable to an increase in the short term learning about the safety of the taste rather than disruption in taste-LiCl association, we conducted a behavioral experiment in which rats were presented with a novel taste and at various time intervals ranging from 1–8 hr were tested for their preference to the pre-exposed taste. We later investigated whether short-term taste memory is amenable to perturbation of CaMKIIα in the IC. (A) Outline of the behavioral experiment. Following habituation rats were exposed to novel taste and 1, 3, 5, and 8 hr later they were subjected to a taste choice test and the aversion index was calculated. (B) Interestingly, 5 and 8 hr groups exhibited less aversion and were significantly lower than both 1 hr and naïve preference (NP) groups (Kruskal-Wallis ANOVA; n = 11 rats/group; X2 (4, n = 55) = 25.162, p<0.0001; Post-hoc test compared to NP group, 1 hr, p=0.884; 3 hr, p=0.199; 5 hr, p=0.018; 8 h, p=0.002. Post-hoc test compared to 1 hr group; 3 hr, p=0.133; 5 hr, p=0.011; 8 hr, p=0.001). (C) The regression line between elapsed time after taste pre-exposure and aversion index, which is statistically significant, is shown (n = 44 [naïve preference group was not included], R = - 0.593, p<0.001). (D,E) The decreased AI to the pre-exposed taste as shown in A and B cannot be attributed to the difference in the fluid consumption as revealed by the negative relationship between saccharin and water consumption with the preference index (MANOVA; Pillai's trace, general interaction; F (8, 100) = 9.438, p<0.001; Saccharin volume consumption, F (4, 50) = 16.198, p<0.0001; Post-hoc Tukey's HSD, compared to naïve preference group, 1 hr, p= 0.528; 3 hr, p<0.177; 5 hr, p=0.004; 8 hr, p<0.0001; compared to 1 hr group, 3 hr, p= 0.003; 5 hr, p<0.001; 8 hr, p<0.0001. Water volume consumption, F (4, 50) = 8.168, p<0.0001; Post-hoc Tukey's HSD, compared to naïve preference group, 1 hr, p= 0.266; 3 hr, p=0.008; 5 hr, p=0.0001; 8 hr, p<0.0001; compared to 1 hr group, 3 hr, p=0.570; 5 hr, p=0.125; 8 hr, p=0.035). (F) Infusion of CaMKIIα inhibitor TatCN21 into the IC 30 min before taste consumption had no effect on the short term incidental taste memory (t-test; n = Tatcont, 9 and TatCN21, 8; T (15) = 0.388, p=0.704). Upper panel depicts the conditioning trial and the syringe represents microinfusion.
Figure 4 with 5 supplements
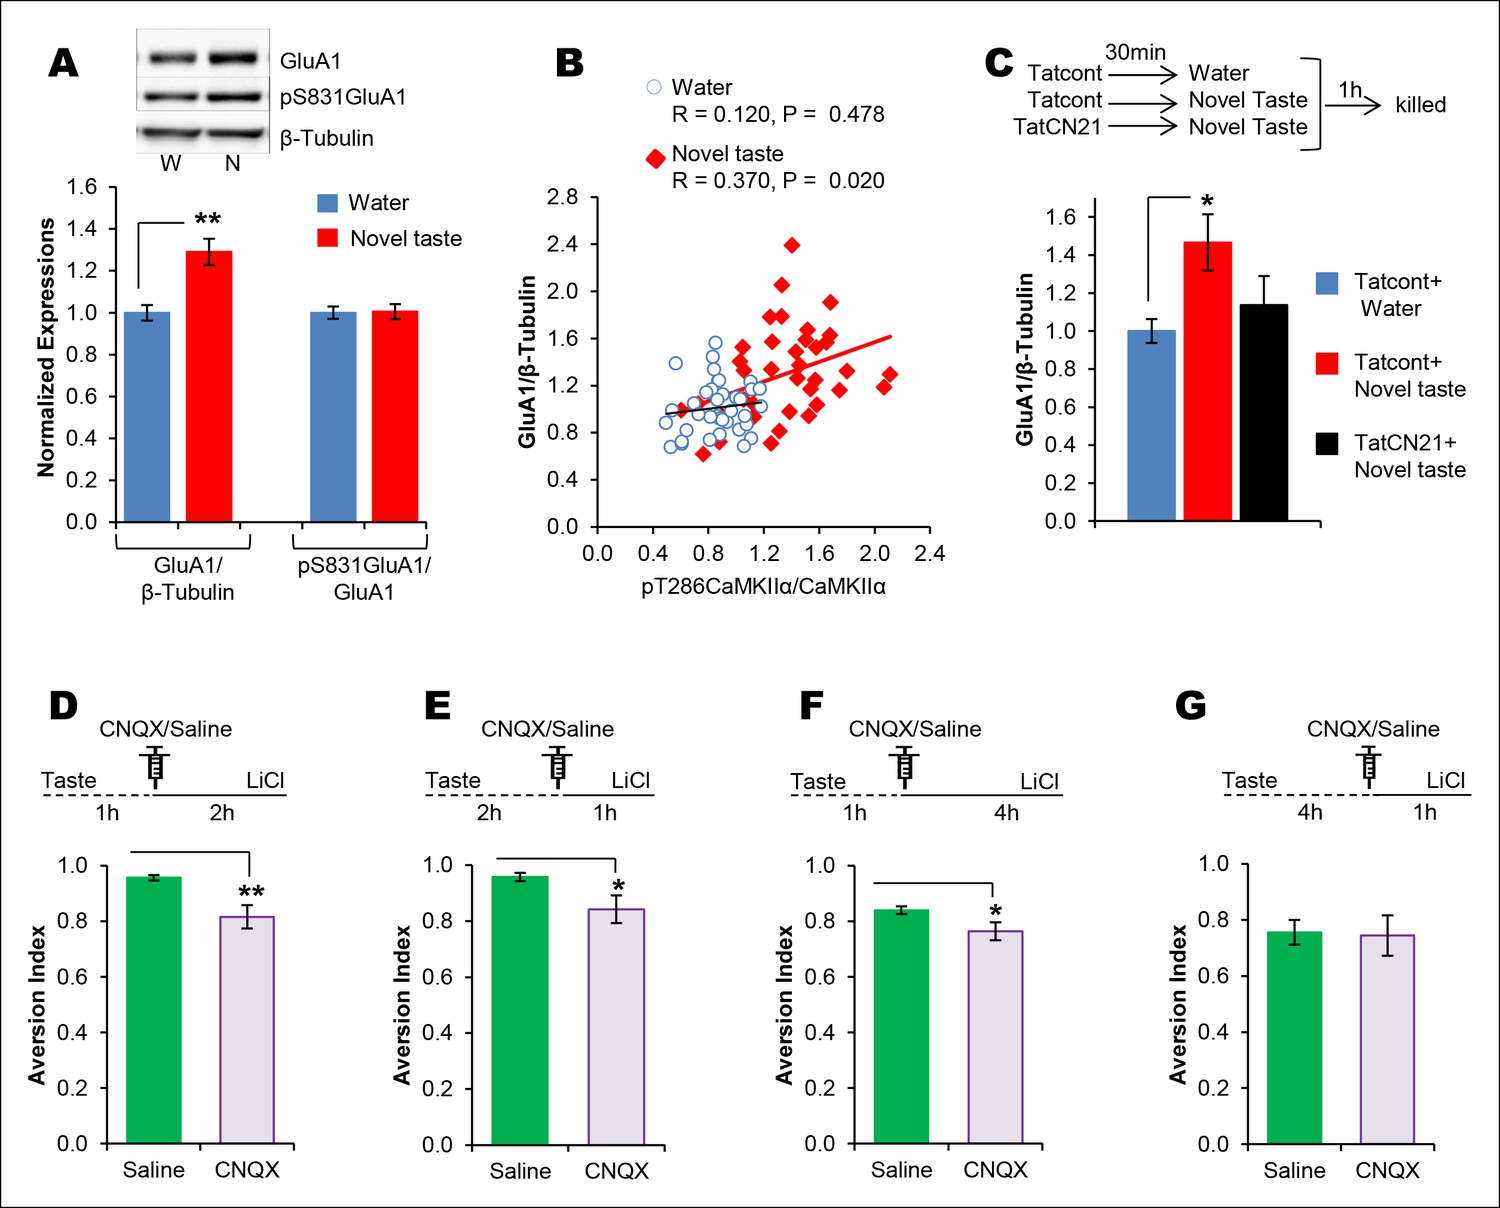
The requirement of CaMKIIα-dependent GluA1 expression in the IC for the associative process of CTA is a function of time.
(A) 1 hr after novel taste consumption total GluA1 but not pS831GluA1 was increased in the P2-fraction. Upper panel shows the representative immunoblots. (B) pT286CaMKIIα was positively correlated with GluA1 levels in the novel taste group but not in the water group. (C) Upper panel depicts the experimental design. Novel taste-dependent increased GluA1 expression in the IC was precluded by TatCN21 microinjection into the IC. (D) CNQX microinjection into the IC 1 hr after the taste consumption in 3 hr ITI-CTA conditioning attenuated the CTA memory. (E) CNQX infusion into the IC 2 hr after the consumption of taste in 3 hr ITI-CTA training attenuated CTA memory. (F) CNQX microinjection into the IC 1 hr after taste consumption in 5 hr ITI-CTA conditioning attenuated the CTA memory. (G) CNQX application 4 hr after taste consumption in 5 hr ITI-CTA conditioning had no effect on CTA memory. Upper panels in D, E, F, and G depict the conditioning trial. Data are mean ± SEM, *p<0.05, **p<0.01. n ≥ 9. See also Figure 4—source data 1 and Figure 4—figure supplement 1–5.
-
Figure 4—source data 1
Statistical analysis of Figure 4.
Independent samples t-test (4A, 4C, 4D, 4E, 4F, 4G) was conducted to analyse the group effect. Pearson’s correlation was used to analyse the association between the association between GluA1 and pT286CaMKIIα (4B).
- https://doi.org/10.7554/eLife.07582.018
Figure 4—figure supplement 1
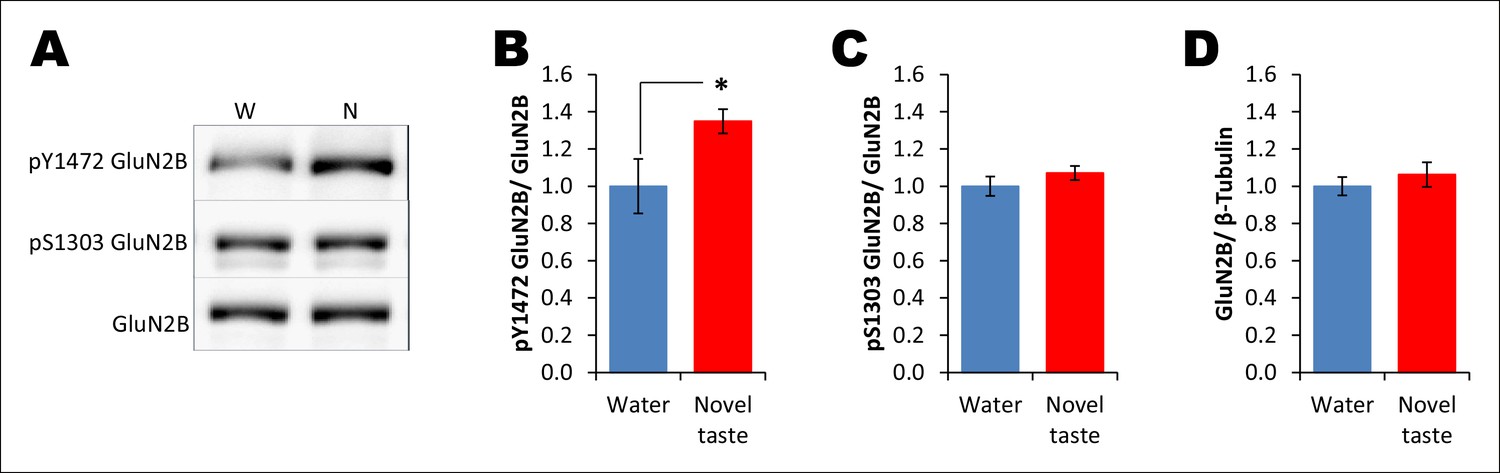
Novel taste experience leads to an increase in Y1472 but not S1303 phosphorylation of GluN2B.
(A) Representative immunoblots of pY1472GluN2B, pS1303GluN2B, and GluN2B. Similarly to main Figure 3C, 1 hr after the rats were exposed to water or novel taste, they were sacrificed, and immunoblot analysis was conducted using the P2-fraction. (B) Consistent with a previous report (Barki-Harrington et al., 2009), novel taste experience significantly increased pY1472GluN2B compared to water controls (T (10) = -2.319, p=0.046). (C) Interestingly, however, pS1303GluN2B phosphorylation, which is known to be regulated by CaMKIIα, was not different from water and novel taste groups (T (35) = -1.078, p=0.288). (D) Also, total GluN2B was not different between water and novel taste groups (T (35) = -0.748, p=0.460).
Figure 4—figure supplement 2
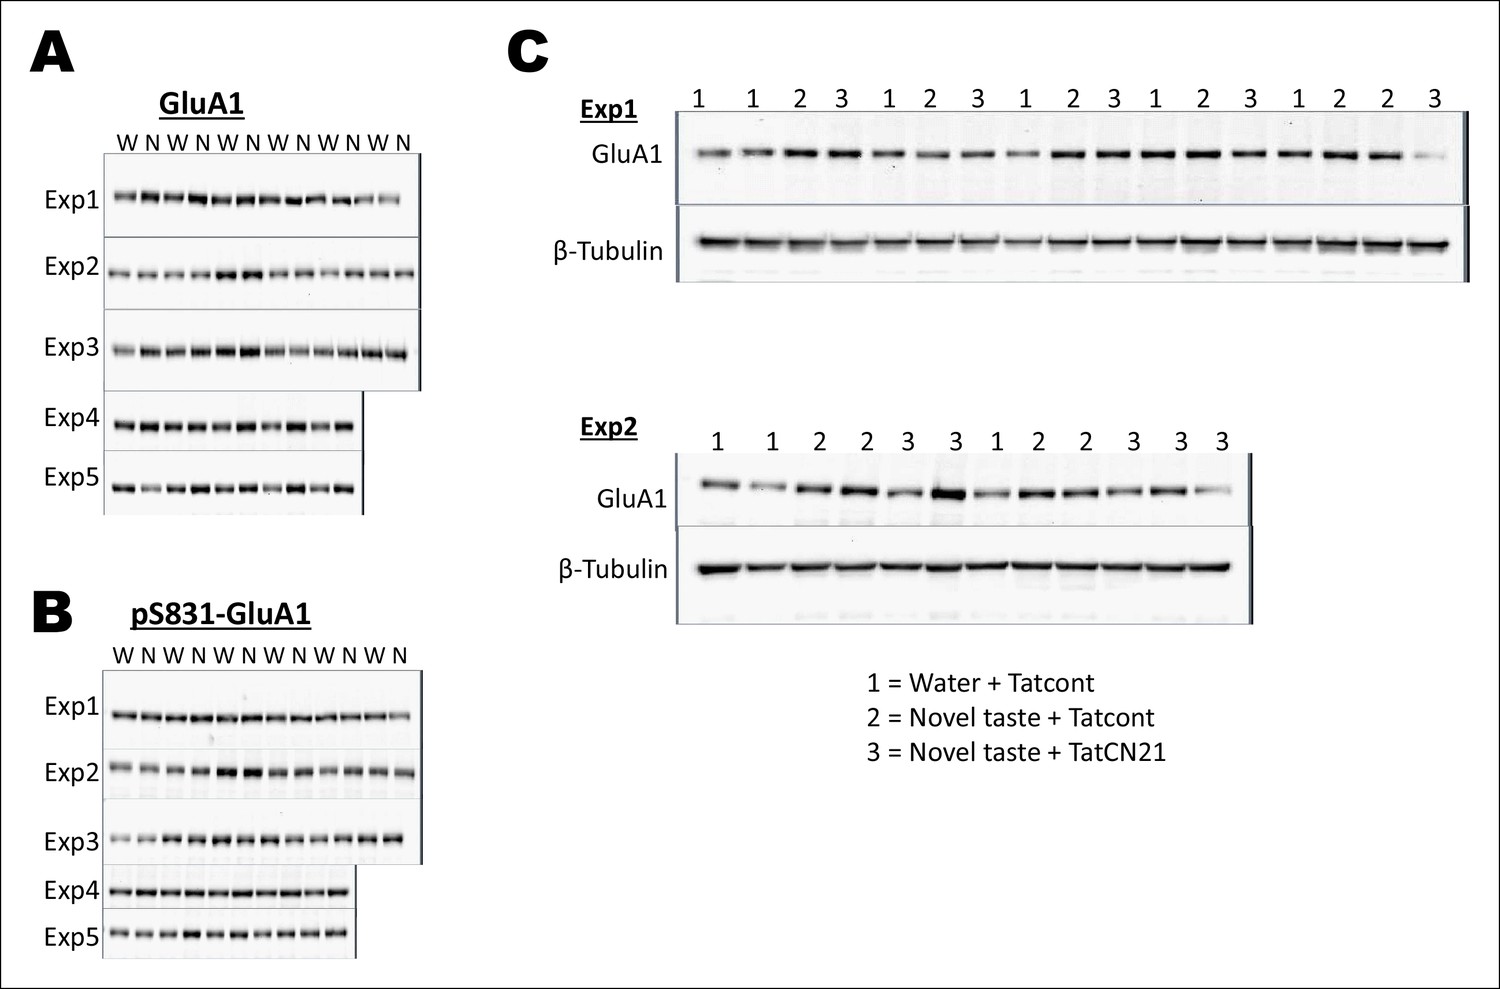
Uncropped original immunoblots of main Figure 4.
(A,B) All the original (A) GluA1 and (B) pS831GluA1 immunoblots for Figure 4A are shown. The corresponding β-Tubulin immunoblots can be seen in Figure 2—figure supplement 1. (C) All original immunoblots of GluA1 and β-Tubulin for Figure 4C are shown. Water + Tatcont and novel taste + Tatcont samples from this experiment were combined to generate Figure 4B.
Figure 4—figure supplement 3
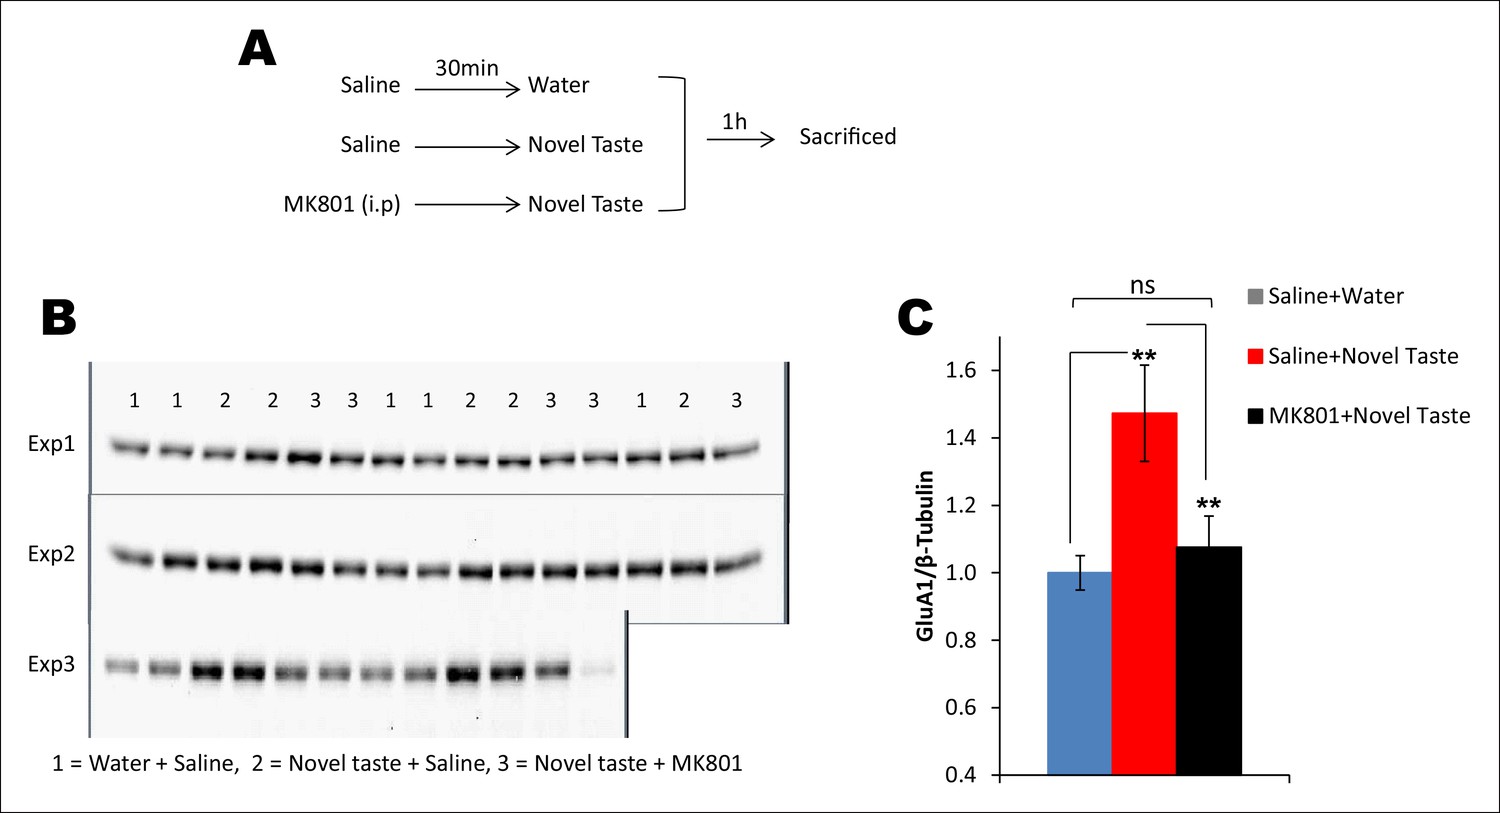
Novel taste experience-induced GluA1 in the IC is NMDAR-dependent.
(A) Outline of the experimental design. (B,C) Uncropped original immunoblots and (C) the quantification thereof. Novel taste group injected with saline showed increased GluA1 expression levels compared to water group. MK801 (0.2 mg per kg b.w.) injected groups which received novel taste did not differ from the water group, but expressed significantly lower levels of GluA1 than novel taste group injected with saline, suggesting that NMDAR is upstream to increased GluA1 after the novel taste experience (n = 14/group; one way ANOVA; F (2, 41) = 6.132, p=0.005; post-hoc LSD; water + saline Vs novel taste + saline p=0.002, novel taste + saline Vs novel taste + MK801 p=0.009 and water + saline Vs novel taste + MK801 p=0.605).
Figure 4—figure supplement 4
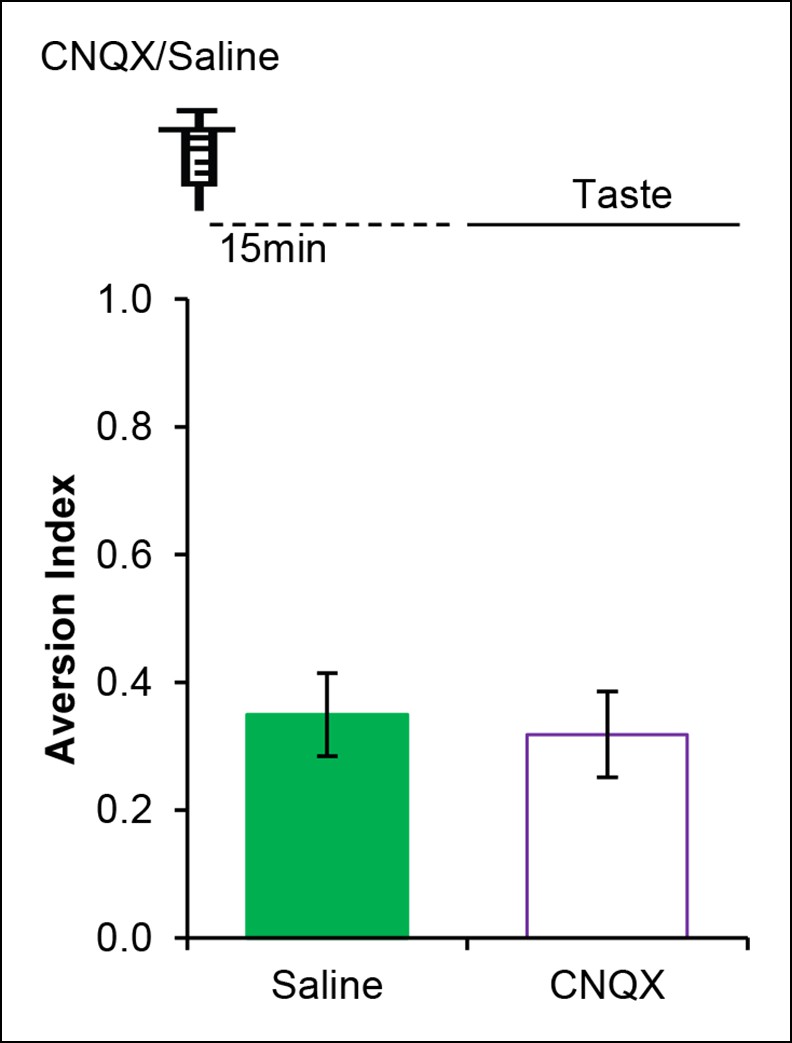
AMPAR in the IC is dispensable for incidental taste learning.
Micro-infusion of AMPAR antagonist CNQX 30 min before the taste learning did not affect the incidental form of the appetitive taste memory (T (14) = 0.335, p=0.743).
Figure 4—figure supplement 5
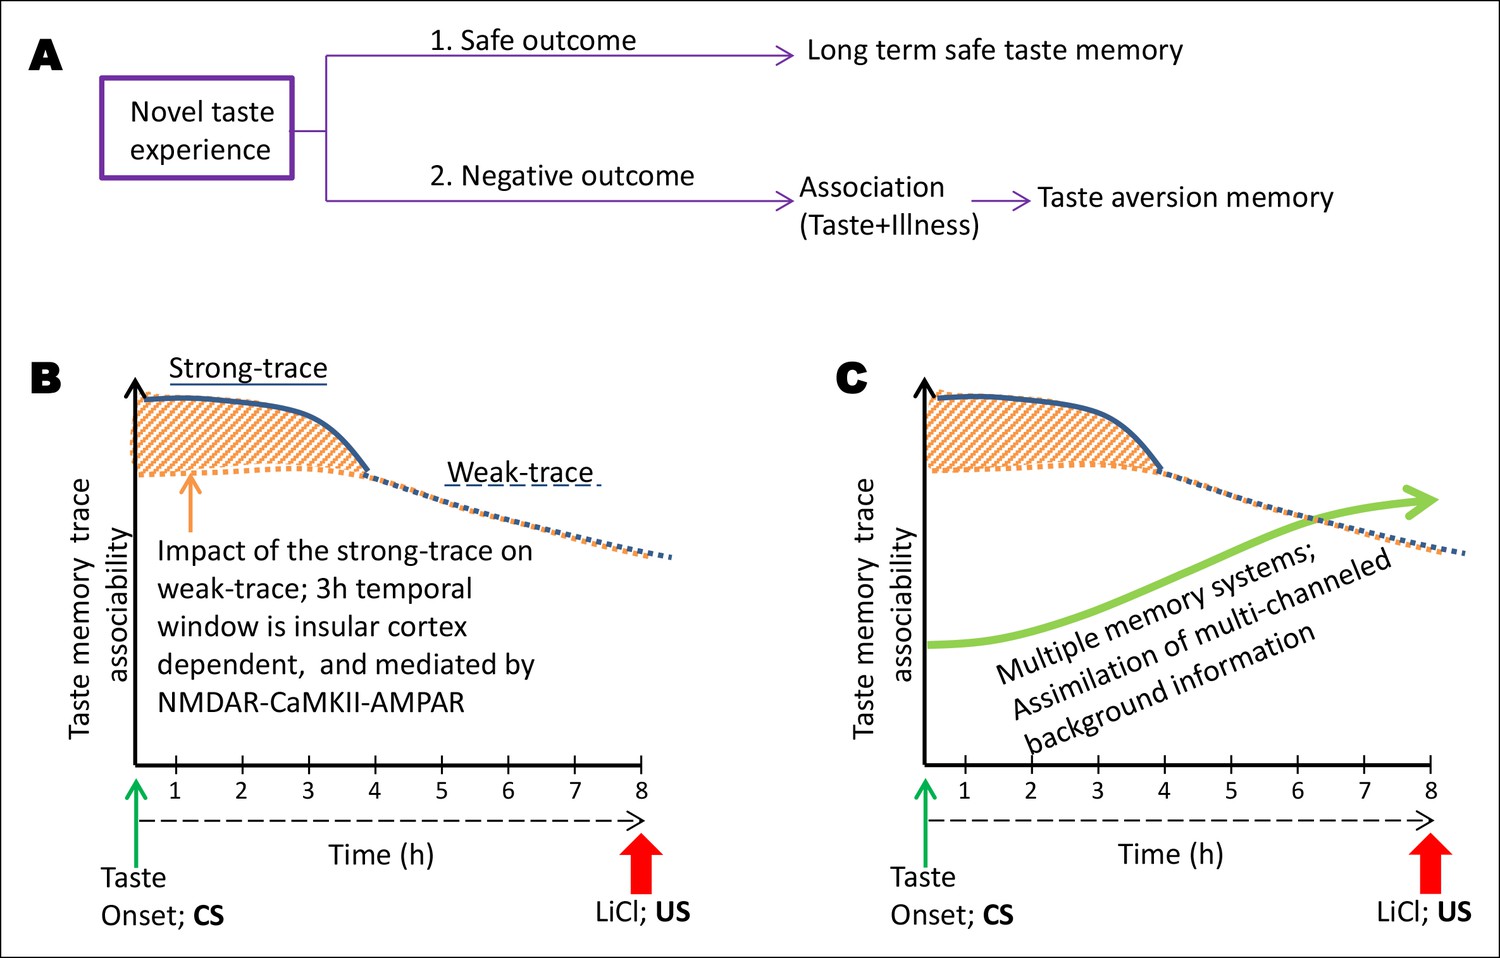
Schematic representation of the conceptual parallel taste-memory trace model.
(A) When an animal feels no negative visceral consequence after eating a novel taste, it forms a long term safe taste memory. However, when it encounters nausea, it forms an associative aversive taste memory (CTA). The strength of the CS or the US or the time lapse between the two or other sensory cues at the time of learning can affect the formation of the internal representation. Here, we focused on the variable of ITI between the CS and US. (B) In the present model we aim to explain the temporal constraints and biological mechanisms underlying trace-CTA. Using sodium saccharin as CS and 0.14M LiCl as strong US we found that the novel taste memory trace is generated after the consumption of novel taste, and lasts for approximately 8 hr to associate with its outcome. The associability of the taste memory trace changes at around 4 hr after the novel taste consumption with the US. Taken together, the behavioral readout with different ITIs and pharmacological manipulations of the NMDAR-CaMKIIα-GluA1 axis in the IC using different ITI-CTA training, we reason that there are two parallel taste memory traces with different underlying mechanisms: one that is robust but decays quickly (strong-trace; solid blue line) and the second trace, which is weak but lasts longer (weak-trace; dashed blue line). X-axis depicts the time in hours between the taste and malaise. Y-axis indicates the strength of the associable taste memory trace. It is possible that the weak taste-memory trace is parallel to that of the strong taste-memory trace or independent of the strong trace. Given our findings that different pharmacological manipulations in the insular cortex (APV, TatCN21, CNQX) affect the associability of the taste-memory trace when applied only during the strong-trace timescale but not in the weak taste-memory trace timescale (longer than 3 hr), we suggest that the weak-taste memory trace is parallel to that of the strong one. (C) Finally, we add the dimension of additional information registered during the association phase by additional brain areas. We propose a multiple memory systems/trace theory, which posits that CTA learning may engage multiple memory systems to take part in the long-trace associative process and that after experiencing the taste, the NMDA receptor-dependent CaMKIIα and GluA1 pathway in the insular cortex plays a critical role only during the short-trace, whereas NMDA receptors in the hippocampus play a crucial role as the time increases (Chinnakkaruppan et al., 2014), for the association with the US. Note that the background information/experience exists right from the CS stimulus experience but arguably they accumulate more with time.
Author response image 1
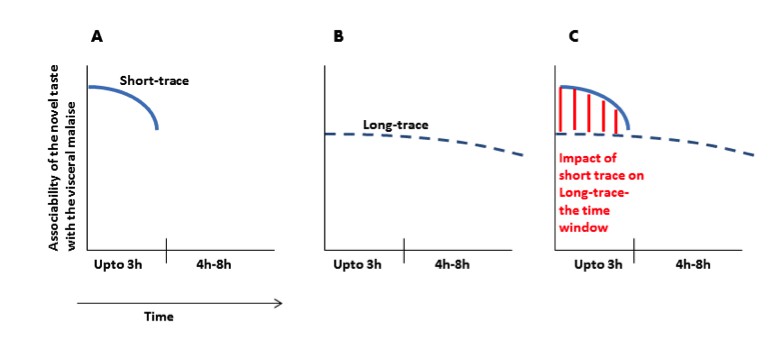
(A) Immediately after ingesting a novel taste a robust taste memory trace is generated and it lasts for about 3h. (B) concurrently, the weak taste memory trace is also generated and it lasts longer, for about 8h. (C) As presented in the manuscript that “inhibition of the CaMKII-GluA1 pathway during short-trace timescale attenuated long-trace CTA, however, long-trace CTA is not affected when CaMKII-GluA1 pathway in the IC was left intact for 3h” and that we suggest that there are two parallel taste memory traces; one that is robust but decays quickly and the second which is weak but lasts longer.
Download links
A two-part list of links to download the article, or parts of the article, in various formats.
Downloads (link to download the article as PDF)
Open citations (links to open the citations from this article in various online reference manager services)
Cite this article (links to download the citations from this article in formats compatible with various reference manager tools)
A molecular mechanism underlying gustatory memory trace for an association in the insular cortex
eLife 4:e07582.
https://doi.org/10.7554/eLife.07582


