The active-zone protein Munc13 controls the use-dependence of presynaptic voltage-gated calcium channels
- Weill Cornell Medical College, United States
Figures
Figure 1
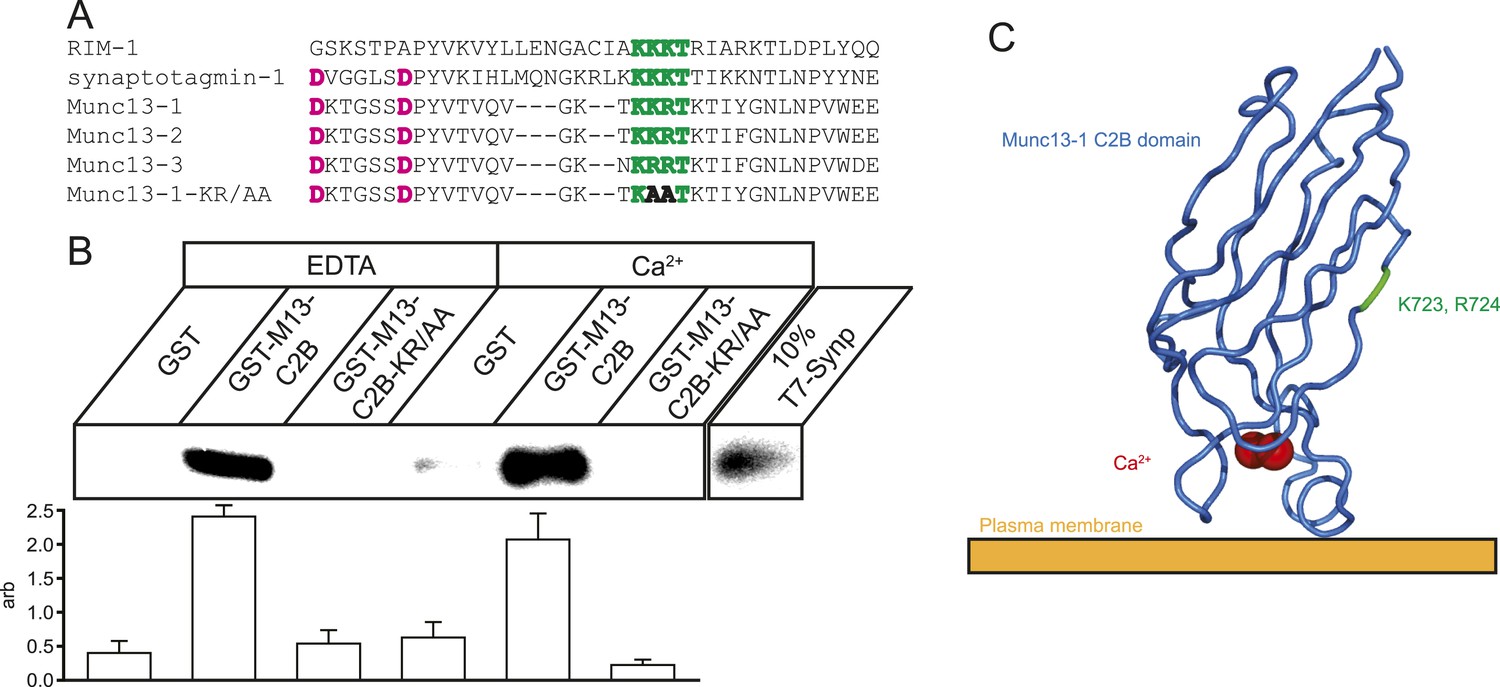
Munc13 C2B domain interacts with CaV2.2 synprint.
(A) Alignment of C2 domains from RIM1, synaptotagmin-1, Munc13 isoforms 1, 2, and 3, and Munc13-KR/AA showing the synprint binding polybasic sequence (green), Ca2+-interacting residues (pink), and the two mutated residues in Munc13-KR/AA to prevent synprint binding (bold). (B) Top, representative pull-down of T7-tagged CaV2.2 Synprint region by Glutathione–sepharose bound GST or GST-Munc13-1-C2B fusions in the presence of 1 mM EDTA or 1 mM Ca2+. Bottom, quantification of N = 4 independent pull-down experiments normalized to average blot intensity. Results are mean ± SEM. p < 10−6 for grouping by genotype, p = n.s. for the presence of Ca2+ or genotype–Ca2+ interaction. (C) Cartoon illustrating the relative position and orientation of the synprint binding site and the residues mutated in Munc13-KR/AA with respect to the plasma membrane and Ca2+ binding site. PDB structure 3KWU.
Figure 2
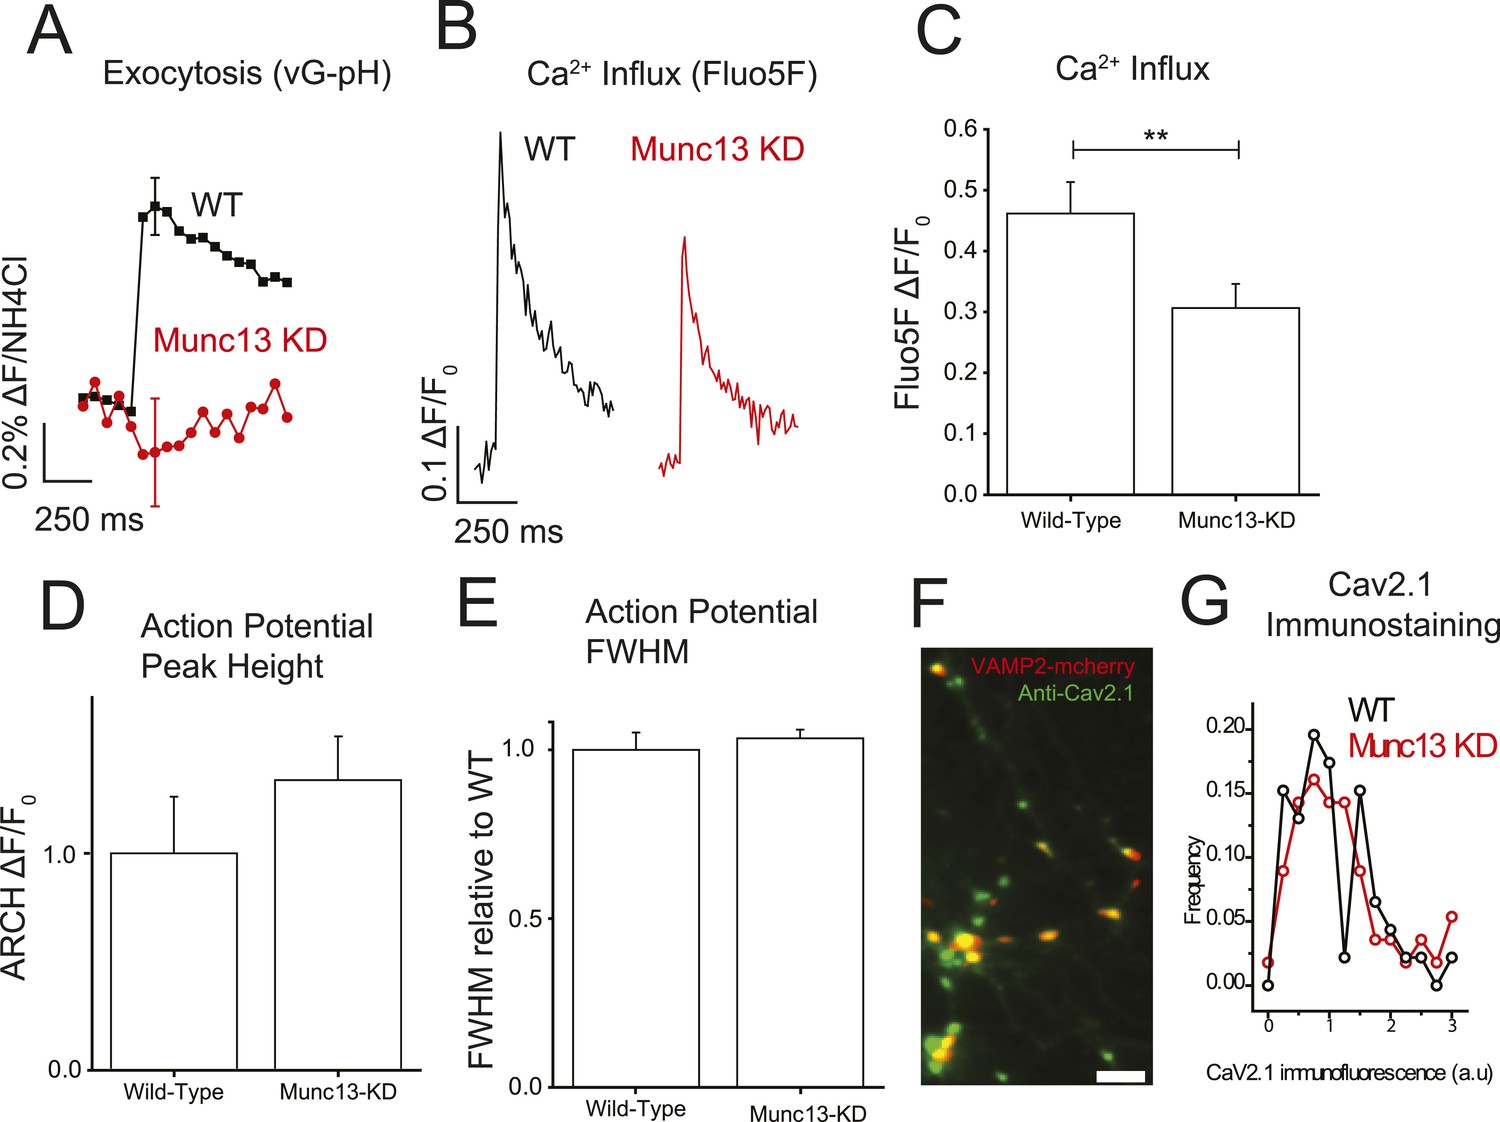
Munc13-KD reduces Ca2+ influx at the presynaptic terminal.
(A) Average single AP vG-pHluorin response in wild-type (WT) (black, N = 5) and Munc13-KD (red, N = 5) neurons. (B) Example traces of Ca2+ influx detected by Fluo5F fluorescence in response to a single AP in WT (black) and Munc13-KD (red) neurons. (C) Averages of peak Fluo5F Ca2+ measurements ±SEM. N = 10, 13 respectively. **p < 0.01. (D) Averages of peak ARCH voltage measurements normalized to WT. N = 5, 7 respectively. Results are mean ± SEM. p = n.s. (E) Averages of FWHM from ARCH AP measurements for WT and Munc13 KD normalized to WT. Results are mean ± SEM. N = 5, 7 respectively. p = n.s. (F) Example image of VAMP2-mCherry + Munc13-KD synaptic terminals (red) labeled with Alexa488 anti-CaV2.1 (green). Scale bar 5 µM. (G) Frequency histogram of Cav2.1 staining intensities at VAMP-mCherry-positive Munc13-KD boutons (red) compared to Cav2.1 puncta in non-transfected neurons in the same field of view (N = 56 and 46 boutons for KD and WT respectively from three separate coverslips) showed that ablation of Munc13 does not alter the abundance of Cav2.1 (p = 0.39, 2 tailed t-test).
Figure 3
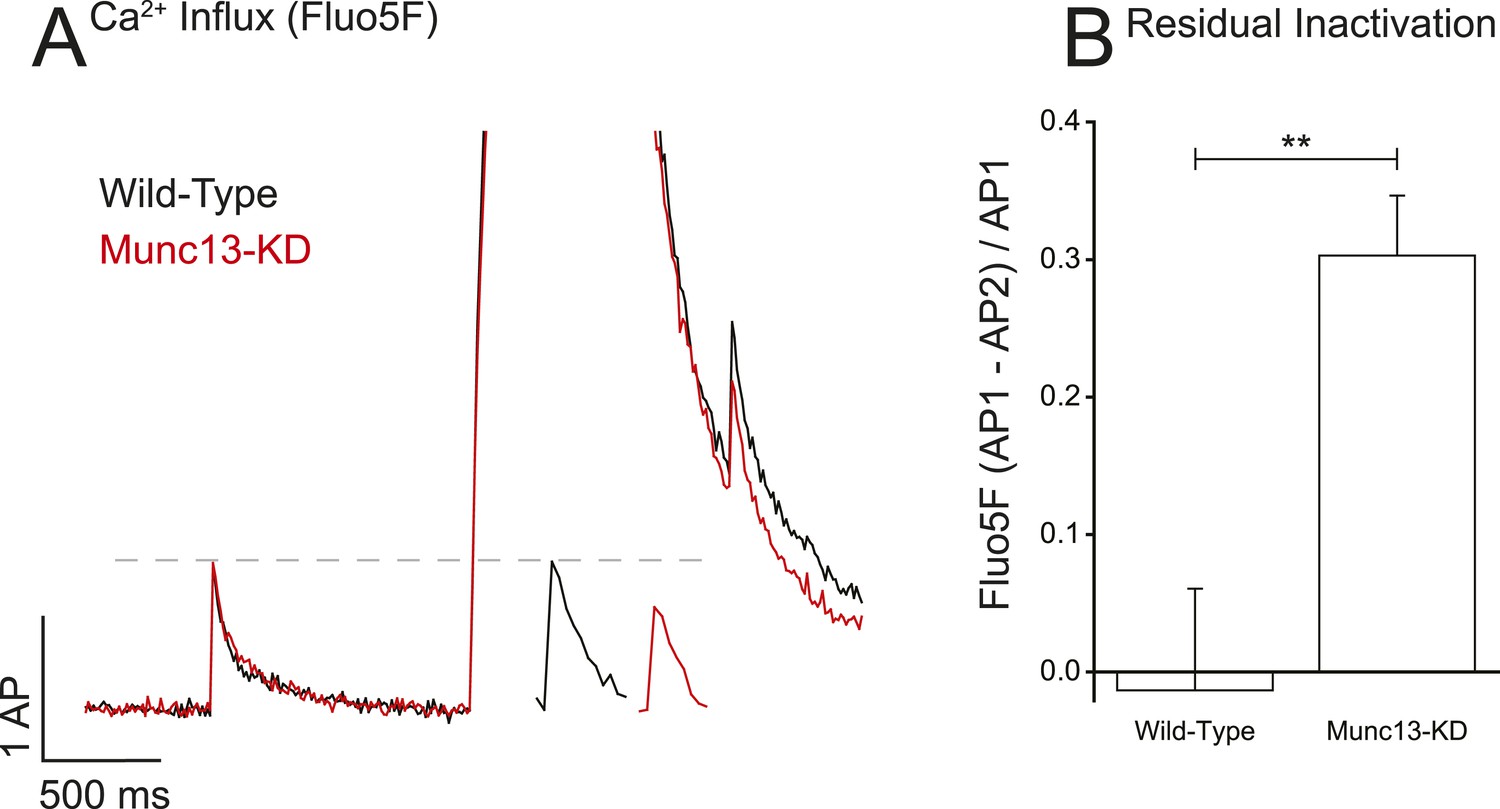
Munc13-KD prolongs VGCC inactivation on long-time scales.
(A) Example of Ca2+ reactivation assay for WT and Munc13-KD neurons showing the difference in single AP responses before and after a 100 Hz 50 AP train showing that WT but not Munc13-KD cells have fully recovered from inactivation 500 ms after the end of the train. Inset shows AP following train on expanded time scale for more clarity. (B) Average inactivation of Ca2+ influx for WT and Munc13-KD neurons from the reactivation assay shown in A. Results are mean ± SEM. **p < 0.01.
Figure 4
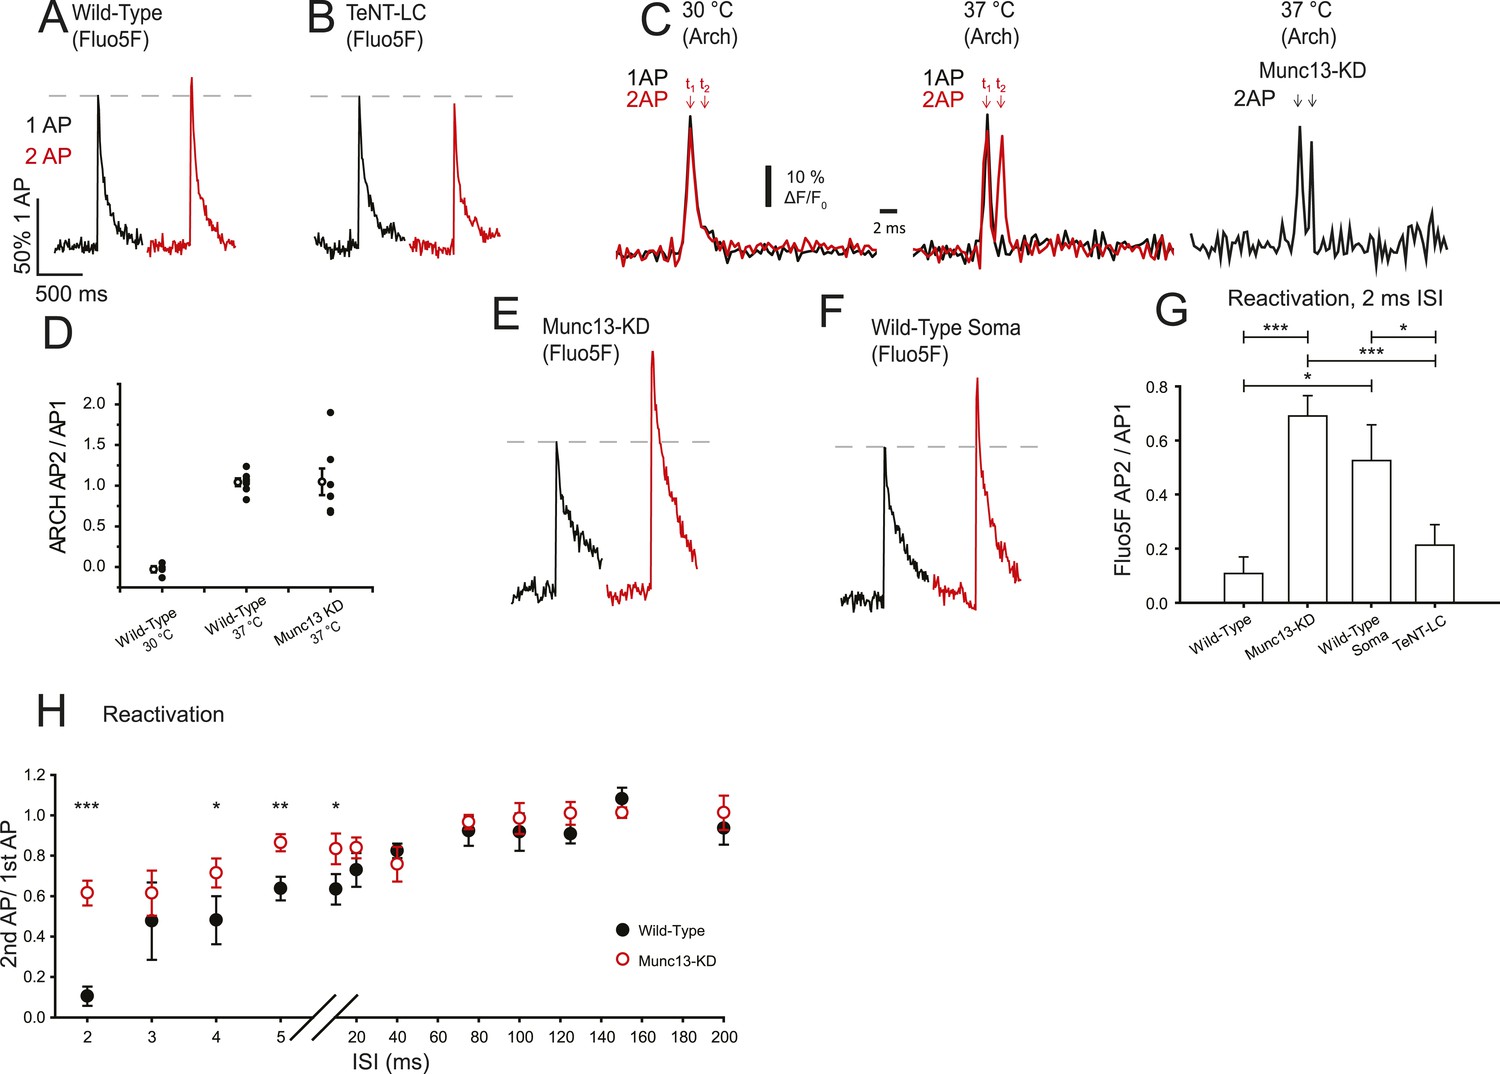
Munc13-KD increases VGCC reactivation on a very short time scale.
(A, B, E, F) Example traces of Ca2+ responses to one AP (black) and two APs separated by 2 ms for wild-type (WT) boutons (A), TeNT-LC expressing boutons (B), Munc13-KD boutons (E), and WT soma (F). (C) Average membrane AP waveform measured using ARCH at WT boutons for single and double AP (2 ms ISI) at 30°C (left) and 37°C (right) indicating AP failure for the second AP at the lower temperature but successful firing and propagation of both APs at physiological temperature. Arch recordings from Munc13-KD boutons also show successful firing of the second AP. (D) ARCH amplitude ratios of second AP peak with respect to first AP peak for WT at 30°C (left), WT at 37°C (middle) and Munc13-KD at 37°C (right). Open symbols show the mean ± SEM value for N = 4, WT 30°C; N = 7, WT 37°C, N = 7 Munc13 KD 37°C. (G) Average Ca2+ signal peak height in 2 ms paired pulses ISI normalized to the respective Ca2+ signal peak in response to 1AP. (H) Average Ca2+ signal peak calculated for the second AP during paired pulses of various ISI for WT (black) and Munc13-KD (red) cells normalized to Ca2+ signal peak in response to 1 AP. Results are mean ± SEM. *p < 0.05, **p < 0.01, ***p < 0.001, all other comparisons n.s.
Figure 5

Millisecond refractory period controlled by Munc13 is insensitive to extracellular Ca2+.
(A) Example traces of wild-type (WT) neurons stimulated with 1 AP and 2 AP with a 2 ms ISI at 2.0, 1.2, and 0.6 mM extracellular Ca2+. Values are normalized to 1 AP for the three extracellular Ca2+ conditions. (B) Relative Ca2+ influx in response to 1 AP upon reduced extracellular Ca2+ as a fraction of influx in 2 mM Ca2+. N = 5 each. *p < 0.05, **p < 0.01. Results are mean ± SEM. (C) 2 ms ISI Ca2+ influx normalized to 1 AP for the three extracellular Ca2+ conditions. No significant difference between conditions of the same genotype. N = 5 each. *p < 0.05, **p < 0.01. Results are mean ± SEM.
Figure 6
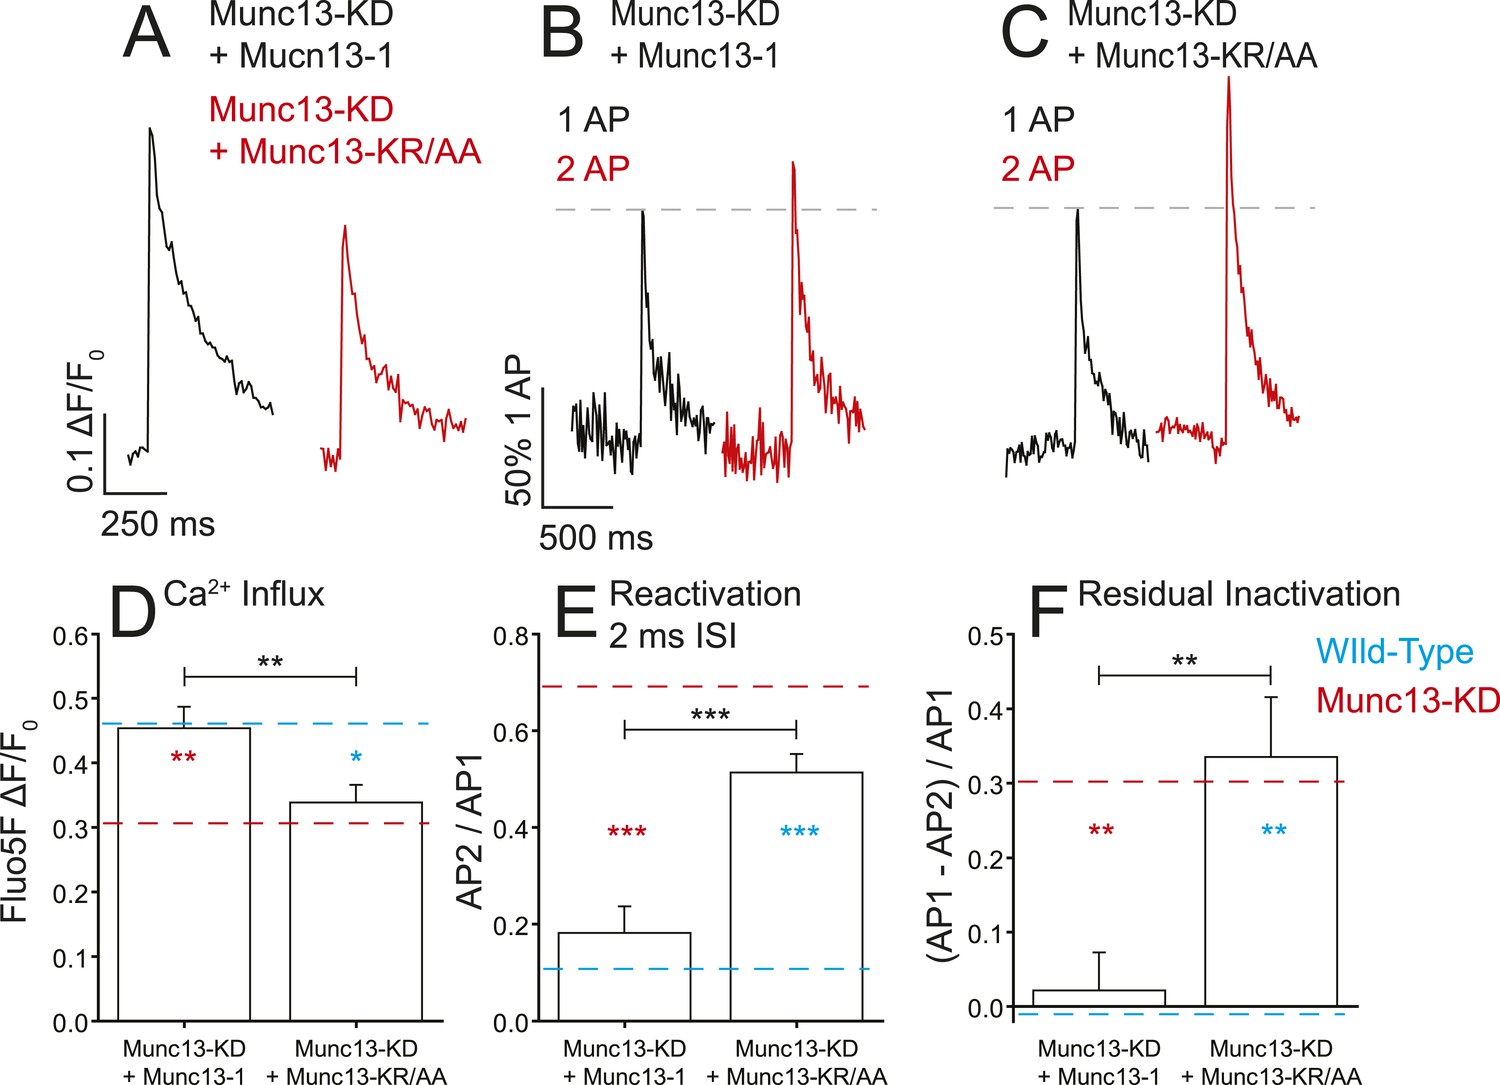
Munc13-1 but not Munc13-KR/AA rescues the Ca2+ influx phenotypes associated with Munc13-KD.
(A) Example traces of Ca2+ influx detected by Fluo5F fluorescence in response to a single AP in Munc13-1 (black) and Munc13-KR/AA (red) expressing neurons in a Munc13-KD background. (B, C) Example traces of one AP (black) and two APs separated by 2 ms for Munc13-1 (B) and Munc13-KR/AA (C) expressing boutons in a Munc13-KD background. (D–F) Average values for Ca2+ influx (D), reactivation at 2 ms ISI (E), and residual inactivation (F), in Munc13-KD + Munc13-1 and Munc13-KD + Munc 13-KR/AA cells, as in Figures 3, 4. Results are mean ± SEM. *p < 0.05, **p < 0.01, ***p < 0.001, all other comparisons n.s.
Figure 7

Munc13-KR/AA rescues synaptic vesicle exocytosis and reveals the effect of fast reactivation on exocytosis.
(A–C) Average traces synaptic vesicle exocytosis detected by vGlut1-pHluorin in response to single APs (black) and two APs separated by 2 ms (red) for wild-type (WT) in 2 mM external Ca2+ (A), 1.2 mM external Ca2+ (B), Munc13-KD + Munc13-1 (C), and Munc13-KD + Munc13-KR/AA. Dashed line shows the response amplitude of the single AP for comparison (D). Increased exocytosis with two APs in Munc13-KD + Munc13-KR/AA cells indicates that the trends in Ca2+ influx have a demonstrable effect on exocytosis, and that the Munc13 interaction with VGCC affects neural processing on this time scale. Exocytosis for a single AP is depressed in Munc13-KD + Munc13-KR/AA terminal by 38% compared to WT rescue, consistent with reduced Ca2+ influx in these cells. (E) Average values for fast reactivation at 2 ms ISI for the cell types in A–C. Results are mean ± SEM. **p < 0.01, ***p < 0.001, all other comparisons n.s.
Tables
Table 1
Values for Fluo5- and vG-pHluorin-paired pulse experiments
| WT | SEM | N | Munc13 KD | SEM | N | Munc13 KD + Munc13-1 | SEM | N | Munc13 KD + Munc13 KR/AA | SEM | N | ||
|---|---|---|---|---|---|---|---|---|---|---|---|---|---|
| 1 AP Fluo5F | ΔF/F0 | 0.461 | 0.039 | 10 | 0.306 | 0.039 | 13 | 0.454 | 0.032 | 6 | 0.338 | 0.027 | 11 |
| 2 AP FLuo5F (2 ms ISI) | ΔF/F0 | 0.511 | 0.052 | 10 | 0.518 | 0.070 | 10 | 0.536 | 0.046 | 6 | 0.518 | 0.044 | 10 |
| AP Post 50 AP Train | ΔF/F0 | 0.467 | 0.052 | 7 | 0.213 | 0.030 | 10 | 0.444 | 0.039 | 6 | 0.224 | 0.032 | 7 |
| 1 AP vGlut-pHluorin | ΔF/NH4Cl | 0.007 | 0.001 | 12 | −0.001 | 0.001 | 5 | 0.004 | 0.001 | 6 | 0.002 | 0.0005 | 7 |
| 2 AP vGLut-pHluorin (2 ms ISI) | ΔF/NH4Cl | 0.008 | 0.001 | 12 | – | – | – | 0.004 | 0.001 | 8 | 0.003 | 0.0006 | 8 |
Download links
A two-part list of links to download the article, or parts of the article, in various formats.
Downloads (link to download the article as PDF)
Open citations (links to open the citations from this article in various online reference manager services)
Cite this article (links to download the citations from this article in formats compatible with various reference manager tools)
The active-zone protein Munc13 controls the use-dependence of presynaptic voltage-gated calcium channels
eLife 4:e07728.
https://doi.org/10.7554/eLife.07728


