Progerin reduces LAP2α-telomere association in Hutchinson-Gilford progeria
- Institute of Medical Biology, Singapore
- Nanyang Technological University, Singapore
- National University of Singapore, Singapore
- IPAL UMI 2955, Singapore
- Sorbonne Universites, France
Figures
Figure 1 with 2 supplements
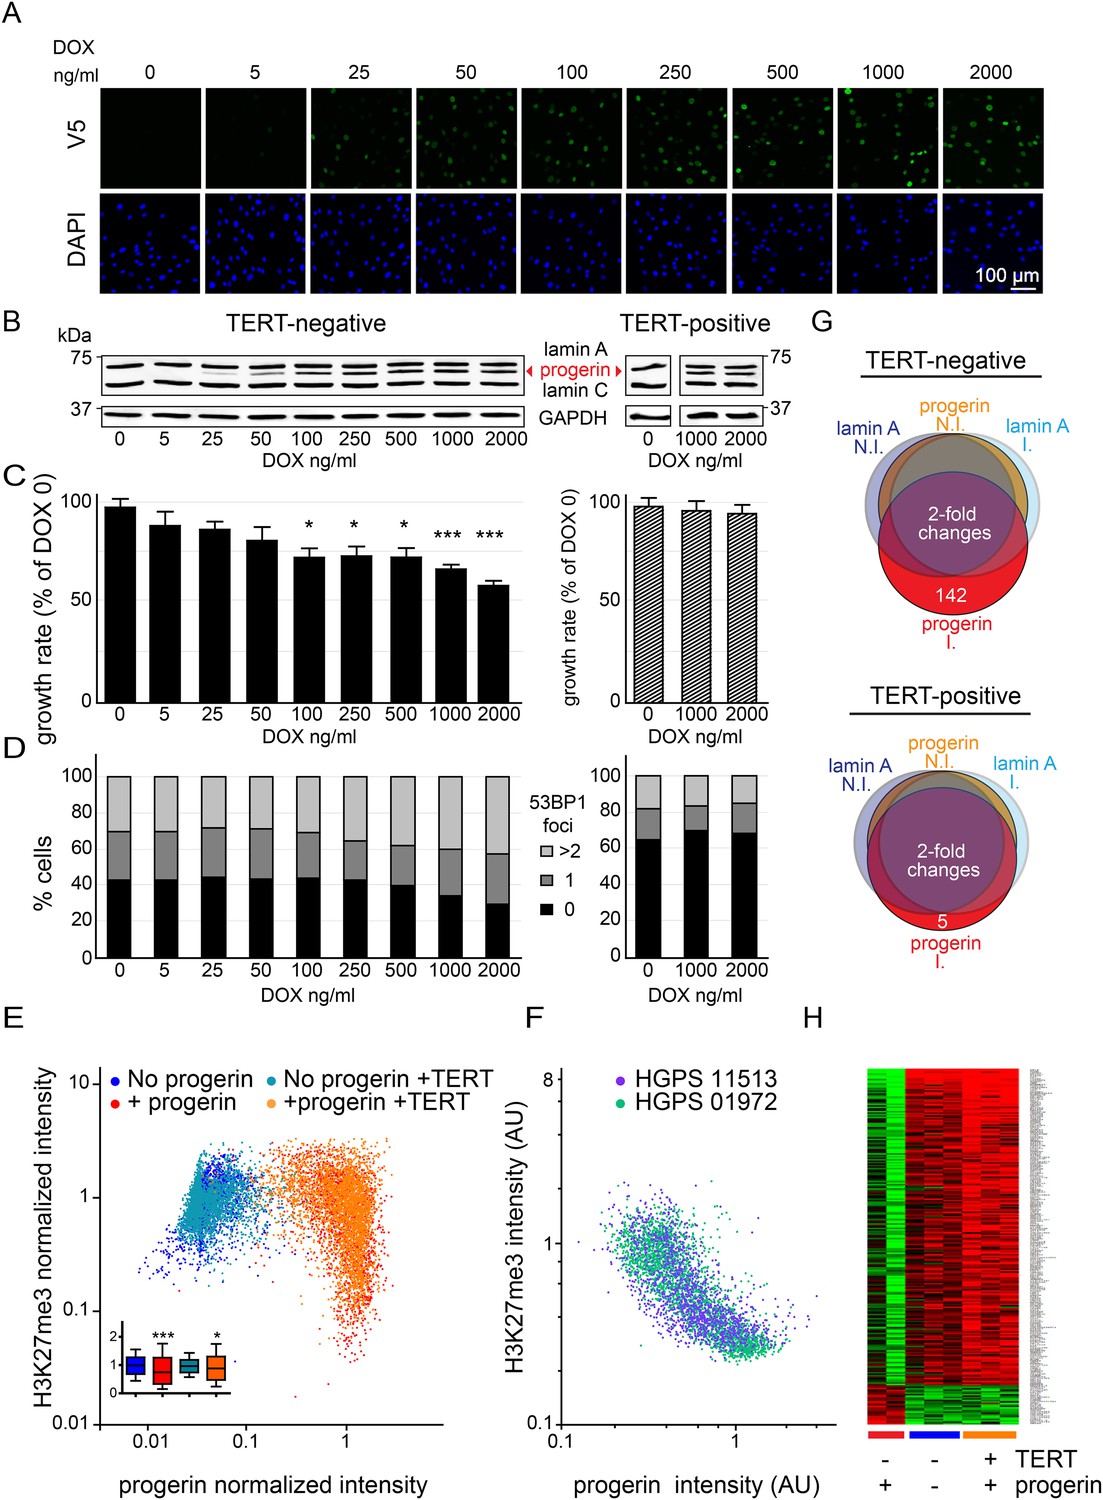
Telomerase rescues dose dependent progerin-induced proliferation defects, DNA damage and gene expression changes without alleviating chromatin changes.
(A) Immunofluorescence microscopy using v5-tag antibody showing doxycycline-dependent inducible expression of v5-progerin and its localization to the nuclear periphery. DAPI staining is shown on the bottom panels. Scale bar: 100 μm. (B) Western blotting showing doxycycline-dependent progerin expression in primary (left panel) and TERT+ (right panel) fibroblasts. Progerin migrates between lamin A and C as indicated (red arrowhead). Doxycycline concentrations (0–2000 ng/ml) are indicated under each lane. (C) Quantification of progerin-induced proliferation defects. Relative growth rates of primary (left panel) and TERT+ cells (right panel) according to progerin expression levels (*p < 0.05; ***p < 0.001 compared to control 0 ng/ml doxycycline, error bars represent SEM, 2-way ANOVA with Bonferroni's post-test). (D) Quantification of progerin-induced 53BP1 DNA damage foci in response to progerin expression levels, in primary (left panel, p < 0.01, χ2 test) and TERT+ cells (right panel). 350–500 cells were counted for each condition. (E) Scatter plot analysis of primary (blue, red) and TERT+ (cyan, orange) cells showing an inverse correlation between H3K27me3 and progerin expression in each cell nucleus using immunofluorescence microscopy (Pearson r = −0.43 and −0.24 for TERT negative and TERT+ cells expressing progerin, respectively, p < 0.001, n > 9800). Inset: box plot of the same data, whiskers represent 10–90 percentile (***p < 0.001, *p < 0.05, one way ANOVA with Bonferroni's post-test). (F) Scatter plot analysis of H3K27me3 and progerin expression in single nuclei of two primary HGPS lines using immunofluorescence microscopy (Pearson r = −0.70 and −0.52 for HGPS AG01972 and HGPS AG11513 respectively, p < 0.001, n > 4000). (G) Illustration showing the number of genes whose expression changed more than twofold after 28 days of lamin A or progerin expression (I, induced. N.I., non-induced). No significant changes were observed upon expression of lamin A. In primary and TERT+ cells, 5 and 142 genes were differentially regulated upon progerin expression, respectively. (H) Heatmap representation of the 142 differentially regulated genes in the presence or absence of progerin and TERT, in human fibroblasts.
Figure 1—figure supplement 1
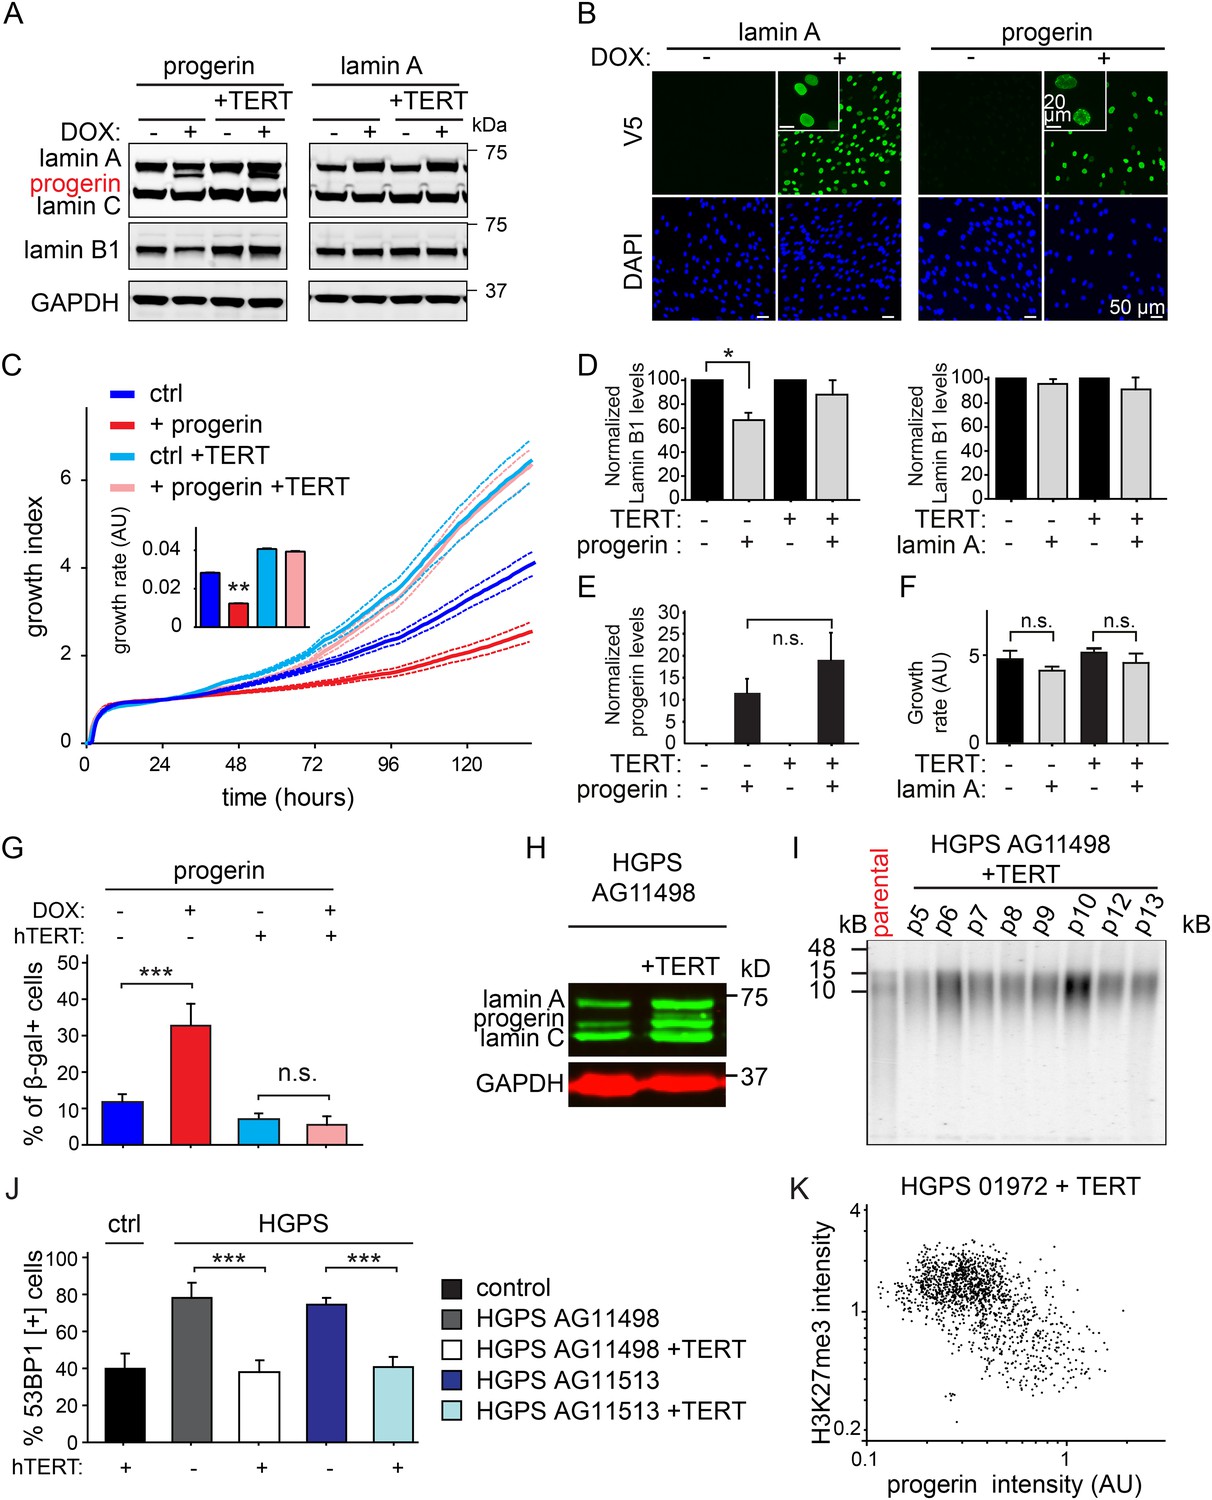
Progerin induced senescence, lamin B1 loss, DNA damage, and telomere shortening are prevented by TERT in primary and HGPS fibroblasts, control experiments.
(A) Western blotting showing inducible expression of progerin or wild type lamin A in primary and TERT+ human fibroblasts ± doxycyclin (DOX) as indicated. (B) Immunofluorescence microscopy using V5-tag antibody (top panels) showing doxycyclin-dependent expression of v5-lamin A and v5-progerin in TERT+ human fibroblasts and localization to the nuclear periphery. Inset: higher magnification image of different field. DAPI staining is shown in bottom panels. Scale bar: 50 μm; scale bar inset: 20 μm. (C) Growth curve of TERT+ and primary cells in the presence or absence of progerin (±DOX). Dotted lines indicate SEM (n = 5). Inset: growth rate after 6 days, error bars indicate SEM (**p < 0.01, one-way ANOVA with Tukey's post-test). (D) Quantification of lamin B1 levels upon progerin or lamin A expression in primary and TERT+ cells. Error bars indicate standard deviation (n = 4, *p = 0.05, Student's t-test). Values were normalized to no DOX control. (E) Quantification of progerin protein levels upon induction with doxycycline (±DOX) in primary and TERT+ human fibroblasts. Levels were normalized to GAPDH loading control (n = 3, error bars indicate standard deviation). (F) Growth rate of primary and TERT+ fibroblasts in the presence (+DOX) or absence (−DOX) of exogenous lamin A (n = 3, error bars indicate SEM). (G) Percentage of senescence-associated β-gal-positive cells in the presence or absence of progerin induction (±DOX) in primary or TERT+ fibroblasts (n = 3, error bars indicate standard deviation, ***p < 0.001, two-way ANOVA with Tukey's post-test). (H) Western blotting showing expression of lamin A, lamin C and progerin in TERT negative and TERT+HGPS cells. (I) Telomere blot showing telomere length in the parental AG11498 HGPS cells, and subsequent re-elongation upon ectopic expression of TERT. (J) Percentage of DNA-damage associated 53BP1-foci, in the presence or absence of TERT, in wild type primary fibroblast and two different HGPS fibroblasts lines (AG11498, AG11513). Error bars indicate standard deviation (n = 4, ***p < 0.001, one-way ANOVA with Tukey's post-test). (K) Scatter plot of H3K27me3 and progerin levels in TERT+HGPS AG01972 by immunofluorescence microscopy (Pearson r = −0.5, n > 1400 nuclei).
Figure 1—figure supplement 2
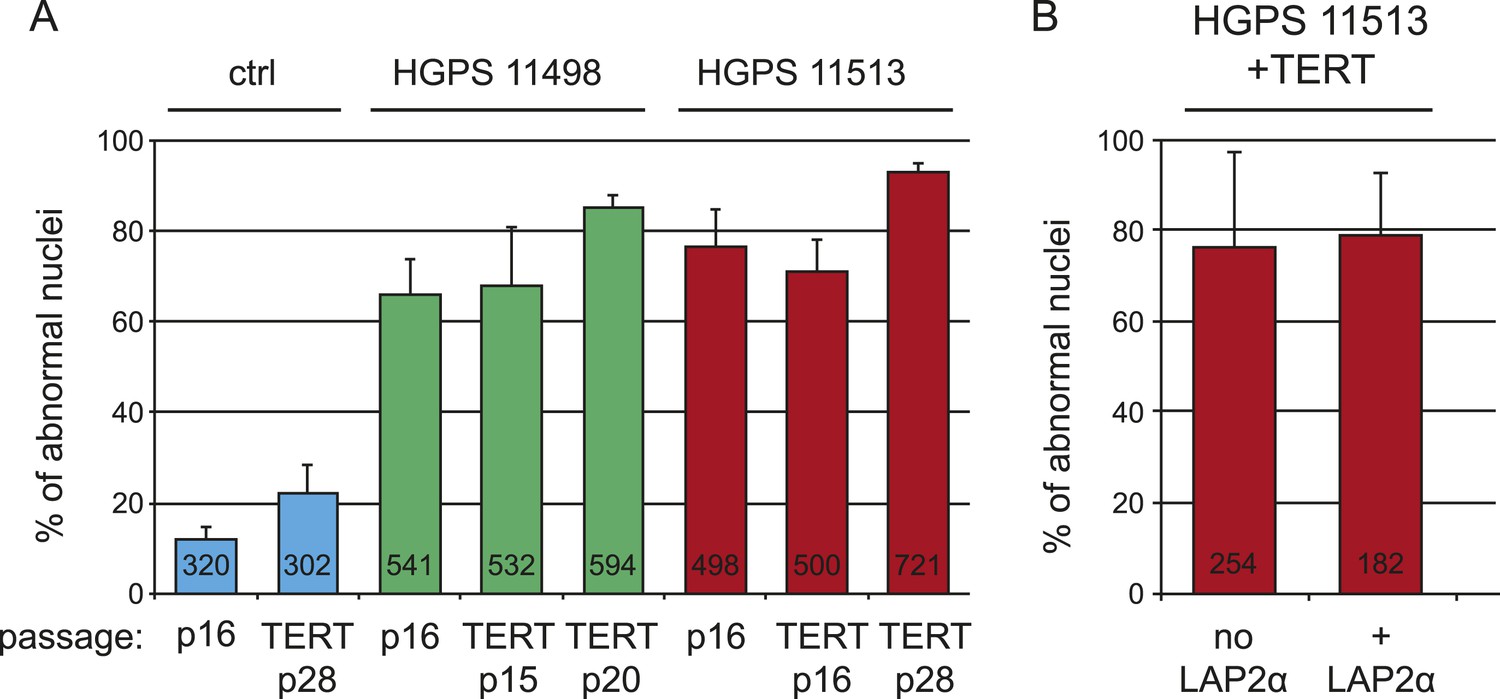
Expression of hTERT or LAP2α does not alleviate nuclear abnormalities in HGPS cells.
(A) Percentage of cells with nuclear abnormalities before and after transduction with hTERT. P16 control (ctrl), HGPS AG11498 and HGPS AG11513 were transduced with hTERT and propagated for an additional 20 to 28 passages. (B) Percentage of cells with nuclear abnormalities in the presence or absence of ectopic LAP2α. HGPS AG11513 were transduced with hTERT and pTRIPZ-LAP2α. Nuclear abnormalities were scored by immunofluorescence microscopy, numbers of scored cells are indicated within each bar. Error bars represent standard deviation.
Figure 2 with 1 supplement

Physiological levels of telomerase prevent progerin-induced defects in mouse ESC.
(A) Growth curve of mouse ESC expressing progerin (PG) or lamin A (LA) upon DOX induction (n = 3, error bars indicate SEM). (B) Heatmap showing the number of genes whose expression changed more than twofold after 8 days of lamin A or progerin expression (I, induced. N.I., non-induced). (C) Immunofluorescence microscopy using Oct-4, emerin, lamin B1 and Sox2 antibodies in the presence or absence of v5-lamin A and v5-progerin expression. (D) Embryoid body (EB) formation upon removal of leukemia inhibitory factor (LIF). The orange line indicates the total size of the differentiated EB, while the pink line indicates the differentiated cell outgrowth. (E) Quantification of total embryoid body size in ESC expressing lamin A (LA+DOX) or progerin (PG+DOX), compared to EBs differentiated from ESC LA non induced controls (one-way ANOVA, n > 80, p > 0.05). (F) Quantification of the size of the differentiated cell layer, in percentage of the total EB size for each EB, compared to EBs differentiated from non-induced ESC LA controls (p < 0.01, n > 80, one-way ANOVA with Tukey's post-test). (G) Cell counts of Tert−/− ESC in the presence (PG+DOX) or absence (PG) of progerin. Cells were induced for 5 days prior to cell counting (p < 0.05, n = 3, Student's t-test). (H) Brightfield microscopy images of Tert−/− ESC ± progerin. Pictures were taken 7 days after induction with progerin (PG+DOX) or non-induced controls (PG). (I) Total size of EBs differentiated from Tert−/− ESC expressing progerin (PG+DOX) or controls (PG) (p < 0.001, n > 160, Student's t-test).
Figure 2—figure supplement 1

(A) Western blot showing inducible expression of v5-progerin or v5-lamin A in primary mouse ESC ± doxycycline (DOX) as indicated.
V5, nanog, GAPDH and actin are shown. (B) Immunofluorescence microscopy using v5-tag antibody (top panels) showing doxycycline-dependent expression of v5-lamin A and v5-progerin and localization to the nuclear periphery. (C) Immunofluorescence staining of embryoid body outgrowth. V5-tagged progerin (v5, green) and DNA damage foci (53BP-1, red) are shown. (D) Expression of v5-progerin in telomerase-deficient ESC. Western blot showing DOX-regulated expression of v5-progerin. Antibodies: v5-tag, lamin B1, GAPDH. (E) Immunofluorescence microscopy of Tert−/− ESC in the presence of absence of v5-progerin. Antibody: v5-tag (red), DAPI (blue).
Figure 3 with 2 supplements
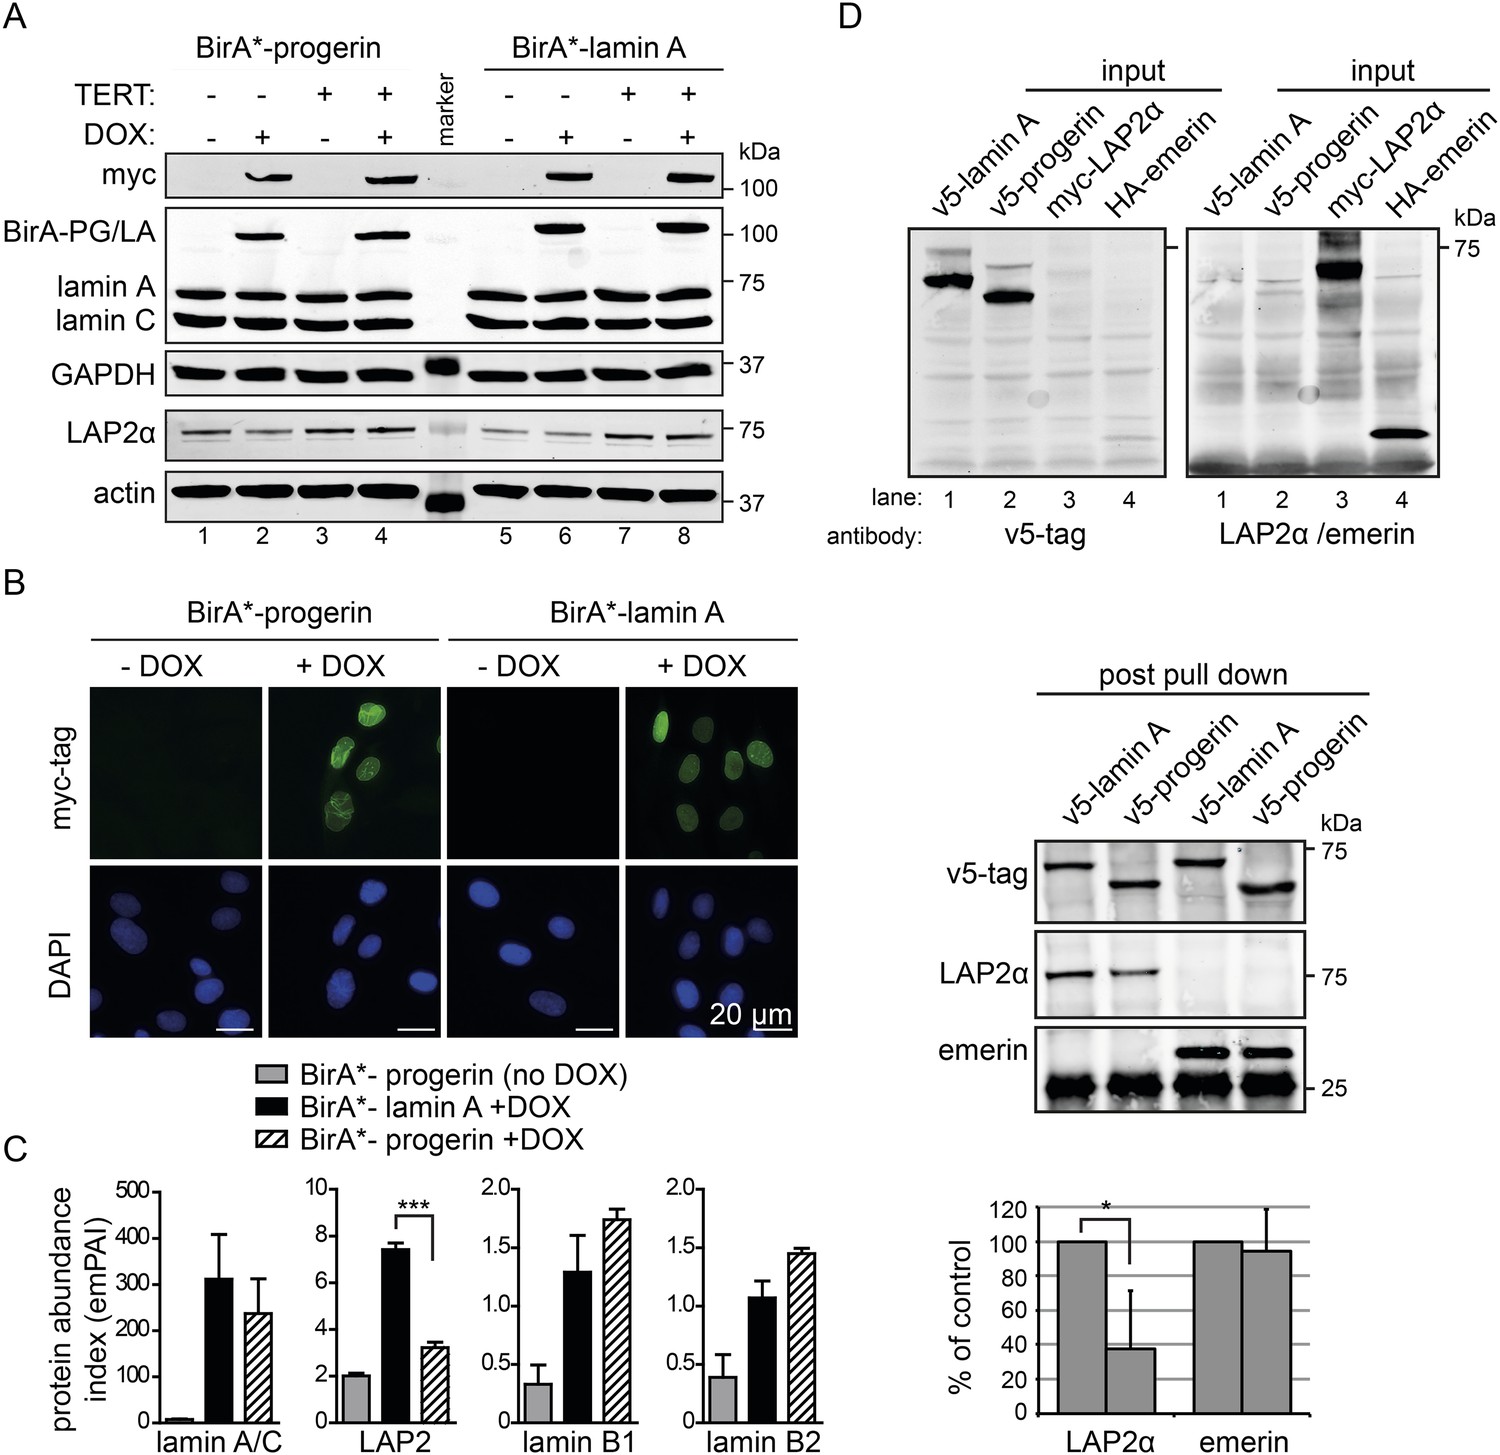
BioID analysis reveals differential interaction of lamin A and progerin with lamina-associated polypeptide 2 (LAP2).
(A) Western blot showing doxycycline-dependent expression of myc-BirA*-progerin (BirA-PG) and myc-BirA*-lamin A (BirA-LA) fusion constructs in primary and TERT+ cells. Antibodies are indicated: myc; lamin A, lamin C, LAP2α, actin, GAPDH. (B) Immunofluorescence microscopy confirms doxycycline-dependent induction and localization of BirA*-lamin A/BirA*-progerin fusion constructs to the nuclear periphery (green, myc tag; blue, DAPI staining). Scale bar: 20 μm. (C) Impaired interaction of LAP2 with progerin. Quantitative interactome of lamin A (black bars) or progerin (striped bars) with nuclear proteins lamin A, LAP2, lamin B1 and B2. Control: non-induced BirA*-lamin A (grey bars). BioID (emPAI) index: quantification based on the number of peptides for each protein detected by mass spectrometry error bars represent SEM (n = 3, ***p < 0.001, one-way ANOVA with Tukey's post-test). (D) Interaction of lamin A or progerin with LAP2α or emerin by co-immunoprecipitation. In vitro transcribed and translated v5-tagged lamin A, v5-tagged progerin, LAP2α and emerin (antibodies: v5-tag, LAP2α, emerin are indicated). Top panel: recombinant v5-tagged progerin and lamin A, myc-LAP2α and HA-emerin were efficiently immunoprecipitated using anti-v5-tag or anti-myc antibodies, respectively (input lanes two, three and four). Bottom panel: LAP2α or emerin immunoprecipitated by either v5-lamin A or v5-progerin. Quantification of LAP2α and emerin pulled down by v5-lamin A or v5-progerin is shown below (normalized to respective v5-signal, *p < 0.05, Student's t-test).
Figure 3—figure supplement 1
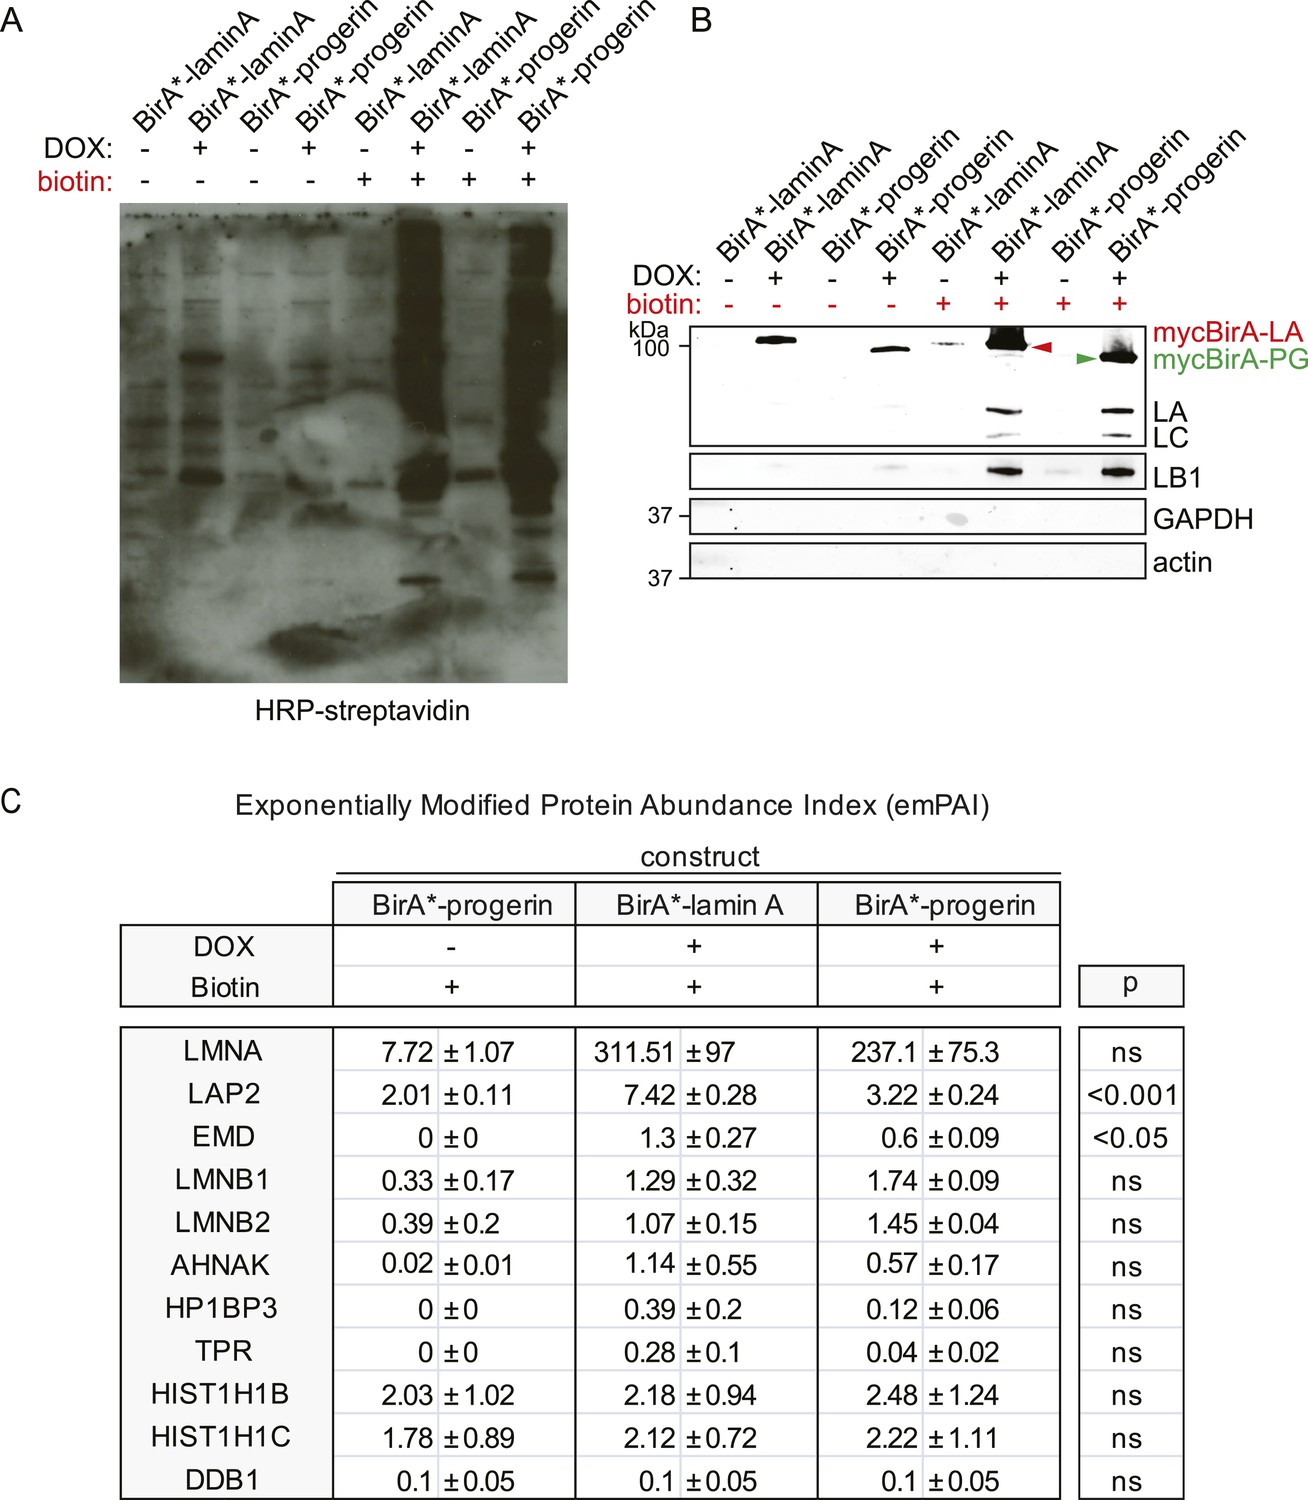
BirA*-dependent biotinylation of proteins in human fibroblasts, control experiments and protein list.
(A) Western blot showing specific biotinylation of proteins by BirA*-laminA and BirA*-progerin fusion proteins, upon DOX induced expression and in the presence of biotin. Conditions are indicated above each lane. Staining: HRP-streptavidin. (B) Western blot analysis of pulled down biotinylated proteins (prior to mass spectrometry analysis). Antibodies: lamin A/C antibody recognizes both endogenous lamin A (LA), lamin C (LC) and fusion constructs BirA*-lamin A and BirA*-progerin, lamin B1 (LB1), GAPDH and actin. (C) Comparative interactome of lamin A and progerin after BioID assay using the exponentially modified protein abundance index (emPAI). emPAI index quantifies the abundance of a protein identified by mass spectrometry in a protein mixture. DOX untreated cells in the presence of biotin were used as negative controls accounting for endogenous biotinylation. Upper panel: top row: experimental conditions (±doxycyclin) and expressed constructs (BirA*-lamin A or BirA*-progerin). Lower panel (shaded row): list of proteins identified by mass spectrometry and their respective emPAI index. p-values and SEM from three independent experiments are indicated (one-way ANOVA with Tukey's post-test).
Figure 3—figure supplement 2
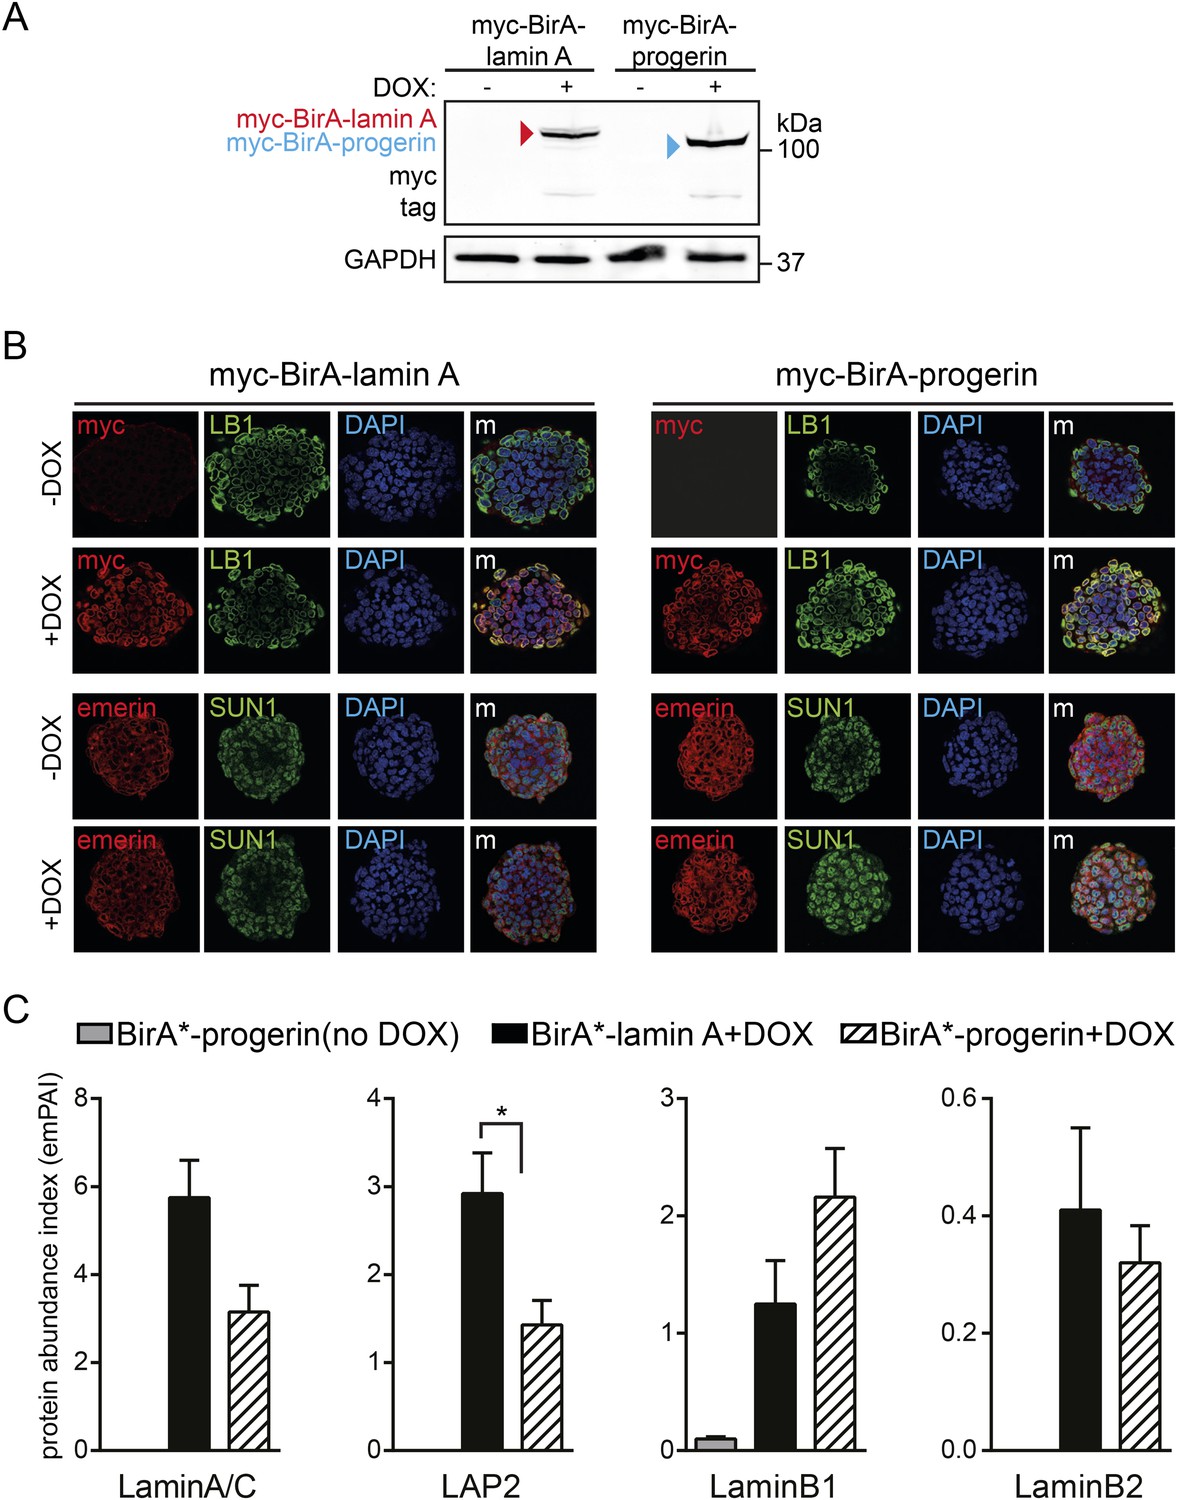
BioID analysis of lamin A or progerin in pluripotent ESC.
(A) Western blot showing doxycyclin-dependent expression of myc-BirA*-progerin and myc-BirA*-lamin A fusion constructs in ESC. Antibodies are indicated: myc, GAPDH. (B) Doxycyclin-dependent induction and localization of BirA*-lamin A/BirA*-progerin fusion constructs to the nuclear periphery by immunofluorescence microscopy. Antibodies: myc, lamin B1 (LB1), emerin, SUN1 and DAPI staining. (C) Comparative interactome of lamin A and progerin with LAP2, lamin B1 and Lamin B2 after BioID using emPAI. Cells in the absence of DOX but in the presence of biotin were used as negative controls (*p < 0.05, one-way ANOVA with Tukey's post-test).
Figure 4 with 1 supplement
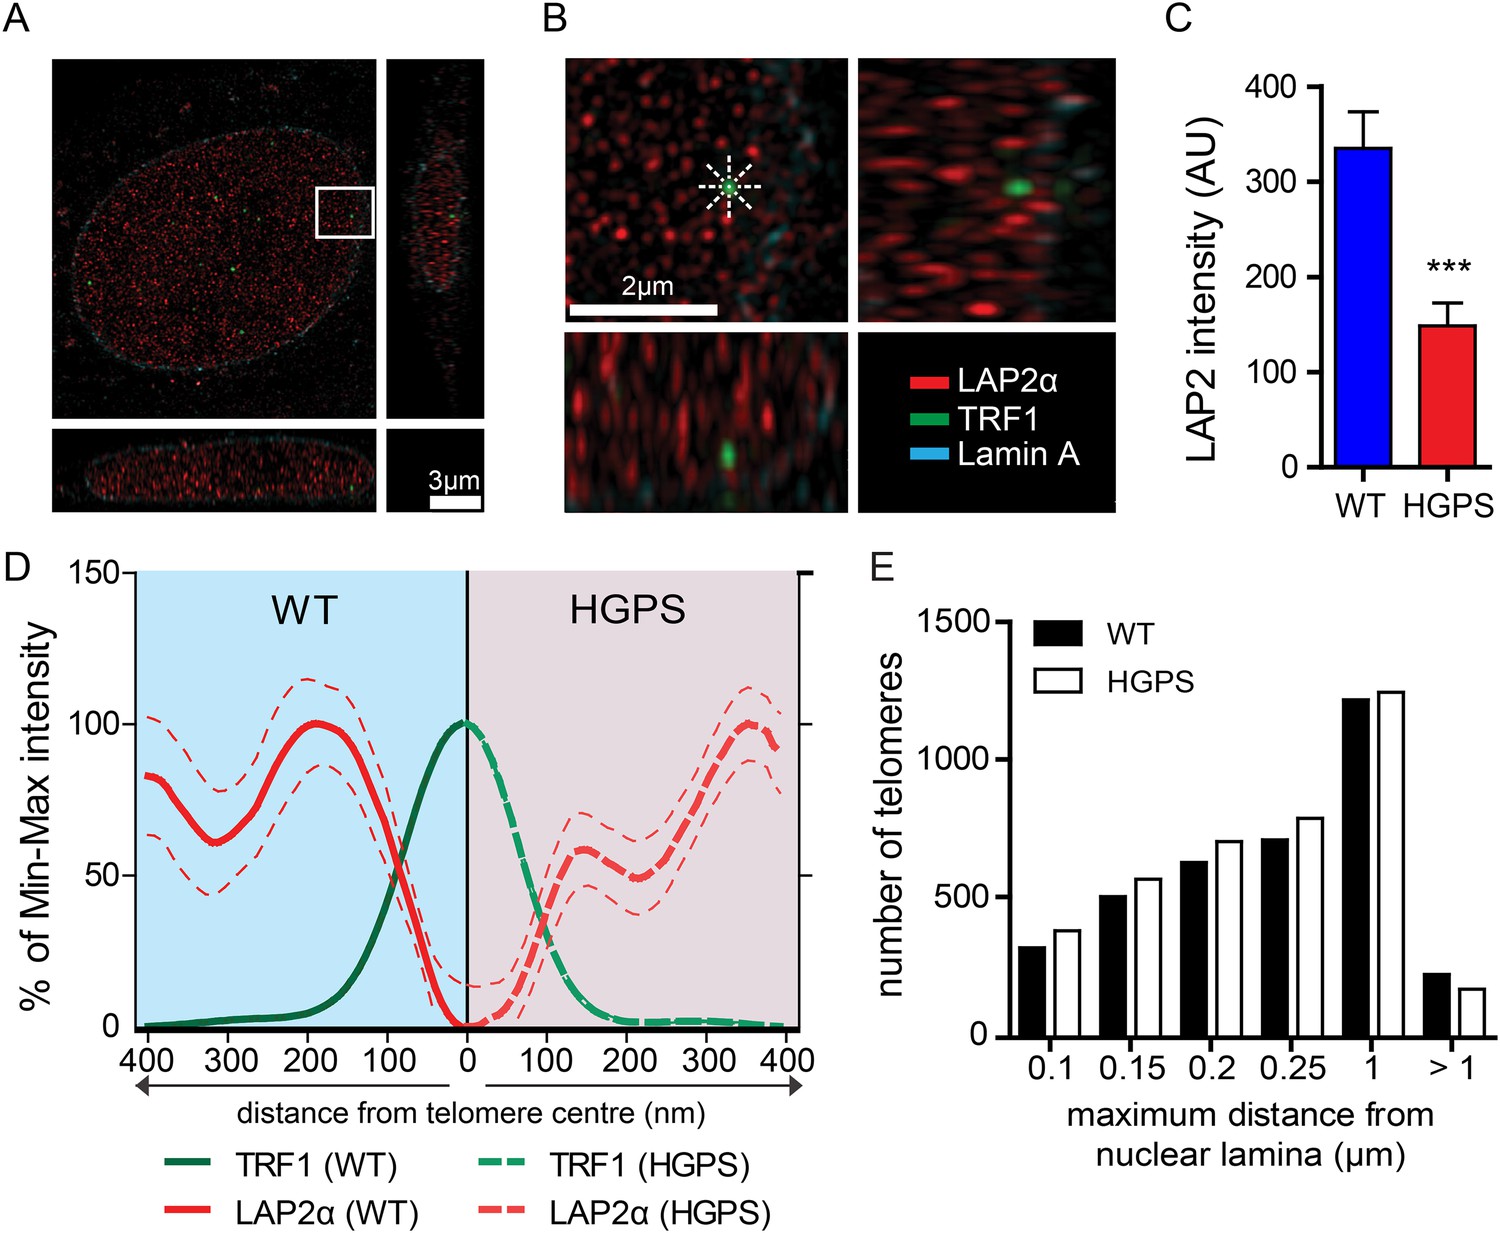
LAP2α association with telomeres.
(A, B) Projection of an extended section of a wild-type fibroblast nucleus showing lamin A (blue), LAP2α (red) and TRF1 (green) staining. Magnified section indicated by the white frame is shown in panel (B). The eight radiuses used to measure the distribution profile of LAP2α around each telomere are indicated by the dotted white lines. (C) Average LAP2α intensity in WT or TERT+HGPS nucleus (n = 17, ***p < 0.001, errors bars indicate SEM, Student's t-test). (D) Intensity profile of LAP2α (red) near telomeres (TRF1, green) in WT (left part, blue) or TERT+HGPS (right part, red) nuclei along ∼400 nm axis, relative to the minimum and maximum LAP2α and TRF1 signal per nucleus. Dotted lines indicate SEM, n ≥ 88. (E) Quantification of telomere distance to the nuclear lamina (a total number of 2891 telomeres from 34 nuclei were analyzed).
Figure 4—figure supplement 1
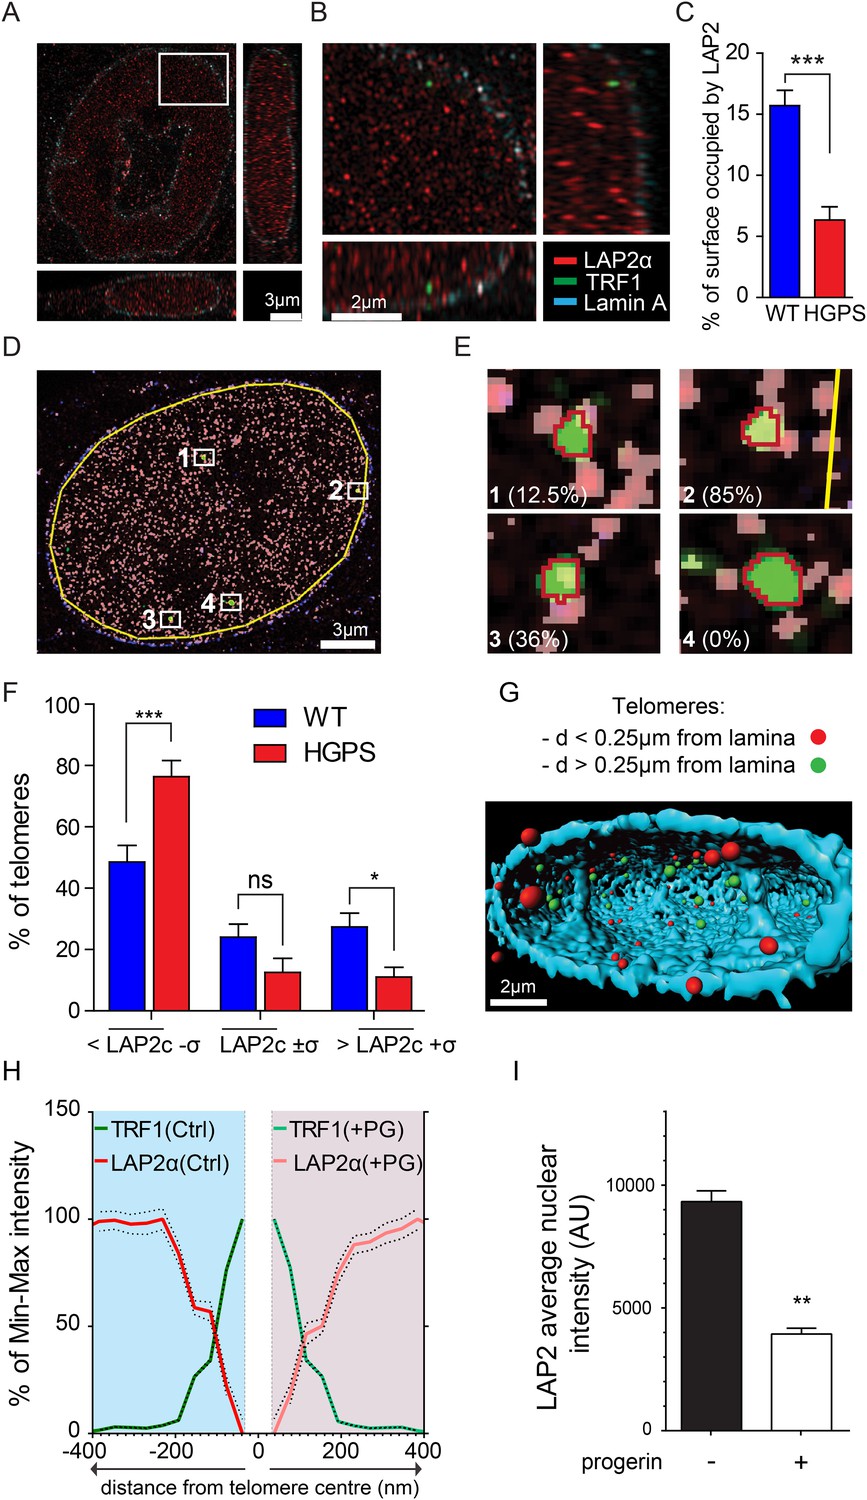
LAP2α association with telomeres, control experiments and details of analysis.
(A, B) Projection of an extended section of a HGPS nucleus showing lamin A (blue), LAP2α (red) and TRF1 (green) staining. Scale bar (A): 3 μm; scale bar (B): 2 μm. (C) Average surface occupied by LAP2α in wild type and HGPS nuclei (errors bars indicate SEM, p < 0.001, n = 25, Student's t-test). (D) Processed section of a wild-type nucleus showing LAP2α (pink), TRF1 (green) and lamin A. The yellow line marks the borders of the area used to quantify the average LAP2α surface coverage per nucleus (LAP2c = 15.3% in this nucleus). Scale bar: 3 μm. (E) Higher magnification of identified telomeres objects shown in (D). The red line marks the borders of the area used to quantify the LAP2α surface coverage for each telomere. LAP2α surface coverage for each telomere is indicated in brackets: telomere 1: 12.5% , telomere 2: 85% , telomere 3: 36% , telomere 4: 0% . (F) Proportion of the surface of a telomere associated with LAP2α in WT or TERT+HGPS nuclei. The LAP2α/TRF1 colocalization is expressed in relation to the average surface occupied by LAP2α for each nucleus (LAP2c: average nuclear surface covered by LAP2α in one nucleus, [n = 25, *p < 0.05, ***p < 0.001, errors bars indicate SEM, two-way ANOVA with Bonferroni's post-test]). (G) 3D rendering of a wild type nucleus from super resolution imaging data. The nuclear lamina (light blue) has been rendered partially to allow visualizing the position of telomeres within the nucleus. Telomeres are represented as spheres and their proximity to the nuclear lamina is indicated as follows: within 250 nm (red) or outside 250 nm (green) of the nuclear lamina. Scale bar: 2 μm. (H) Intensity profile of LAP2α (red) near telomeres (TRF1, green) in TERT+ human fibroblasts, control (left part) or progerin expressing nuclei (right part) along a ∼400 nm axis, relative to the minimum and maximum LAP2α and TRF1 signal per nucleus. Dotted lines indicate SEM, n ≥ 38 nuclei. (I) Average LAP2α intensity in control or progerin induced TERT+ human fibroblasts (n ≥ 38, **p < 0.01, errors bars indicate SEM, Student's t-test).
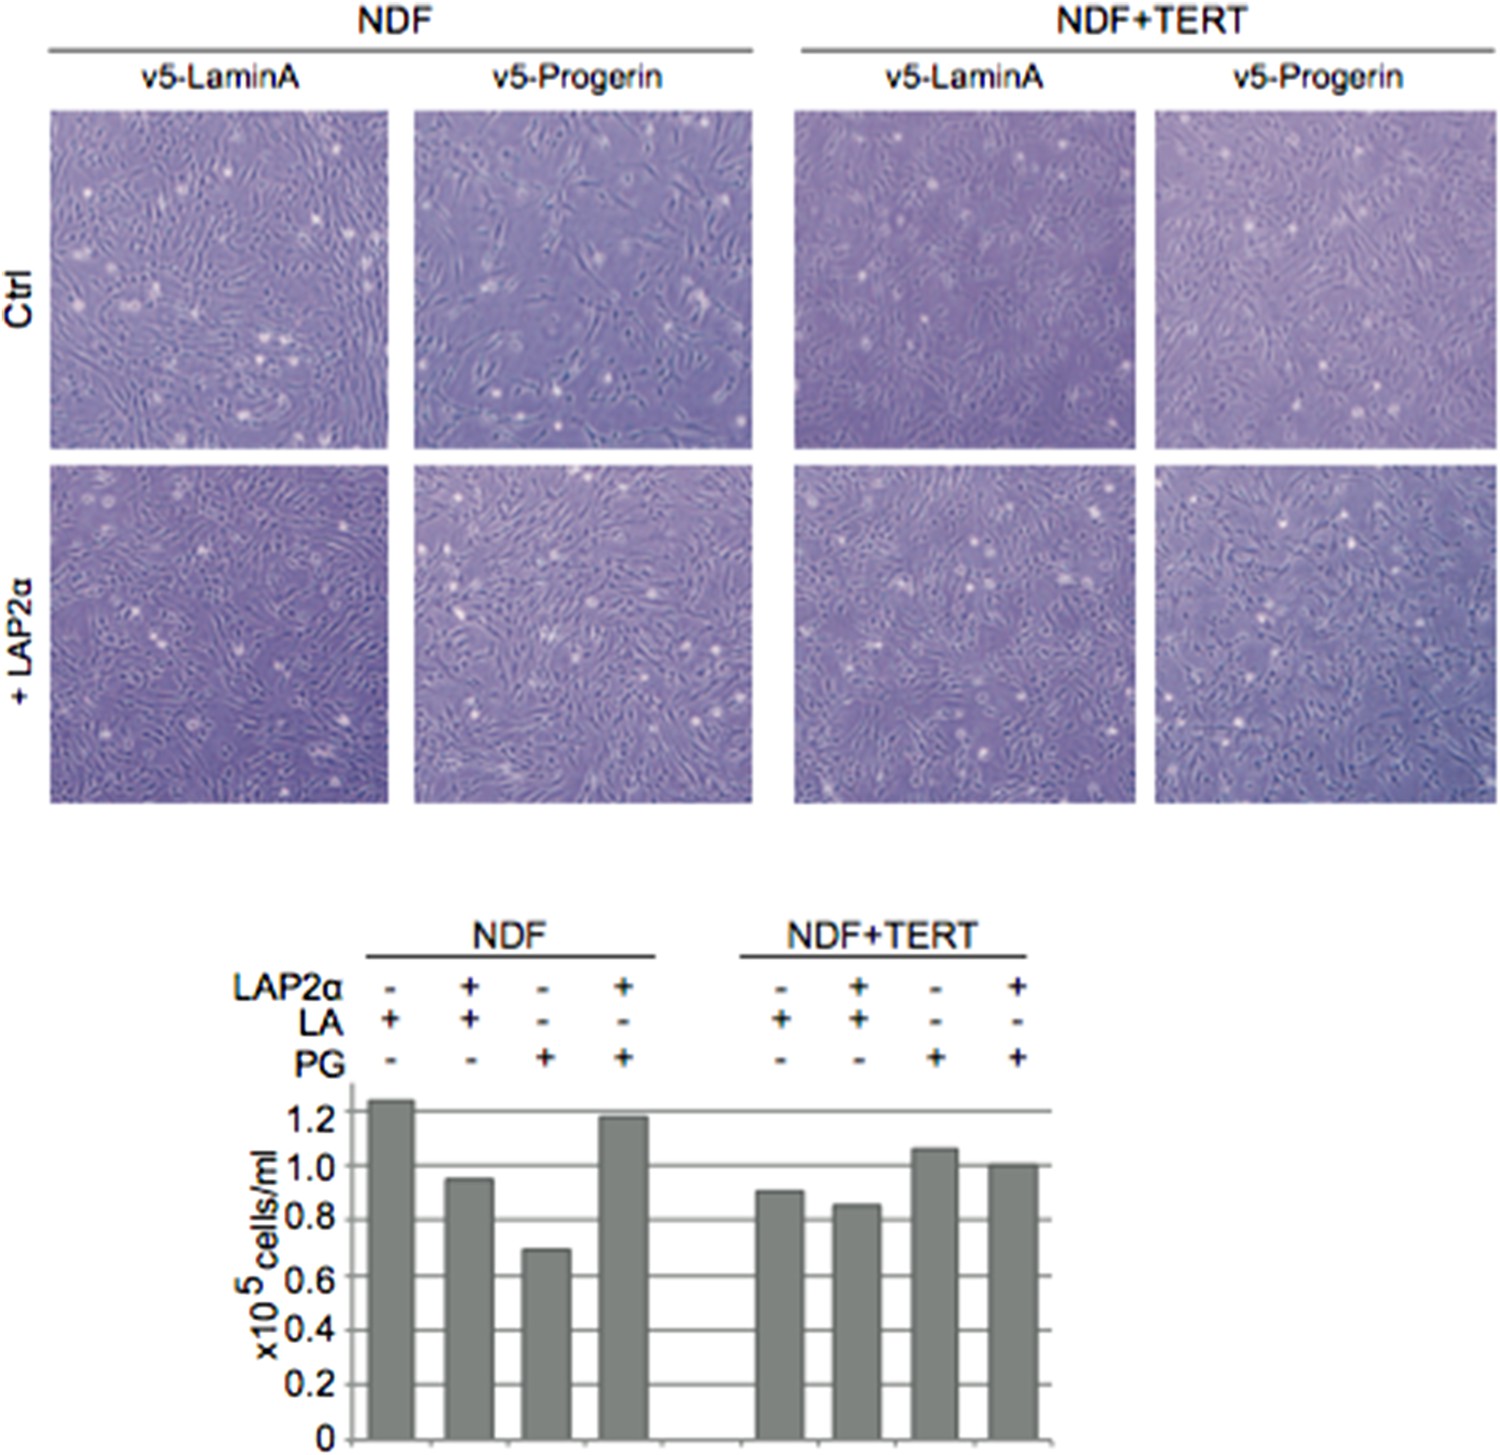
Figure 5 with 3 supplements
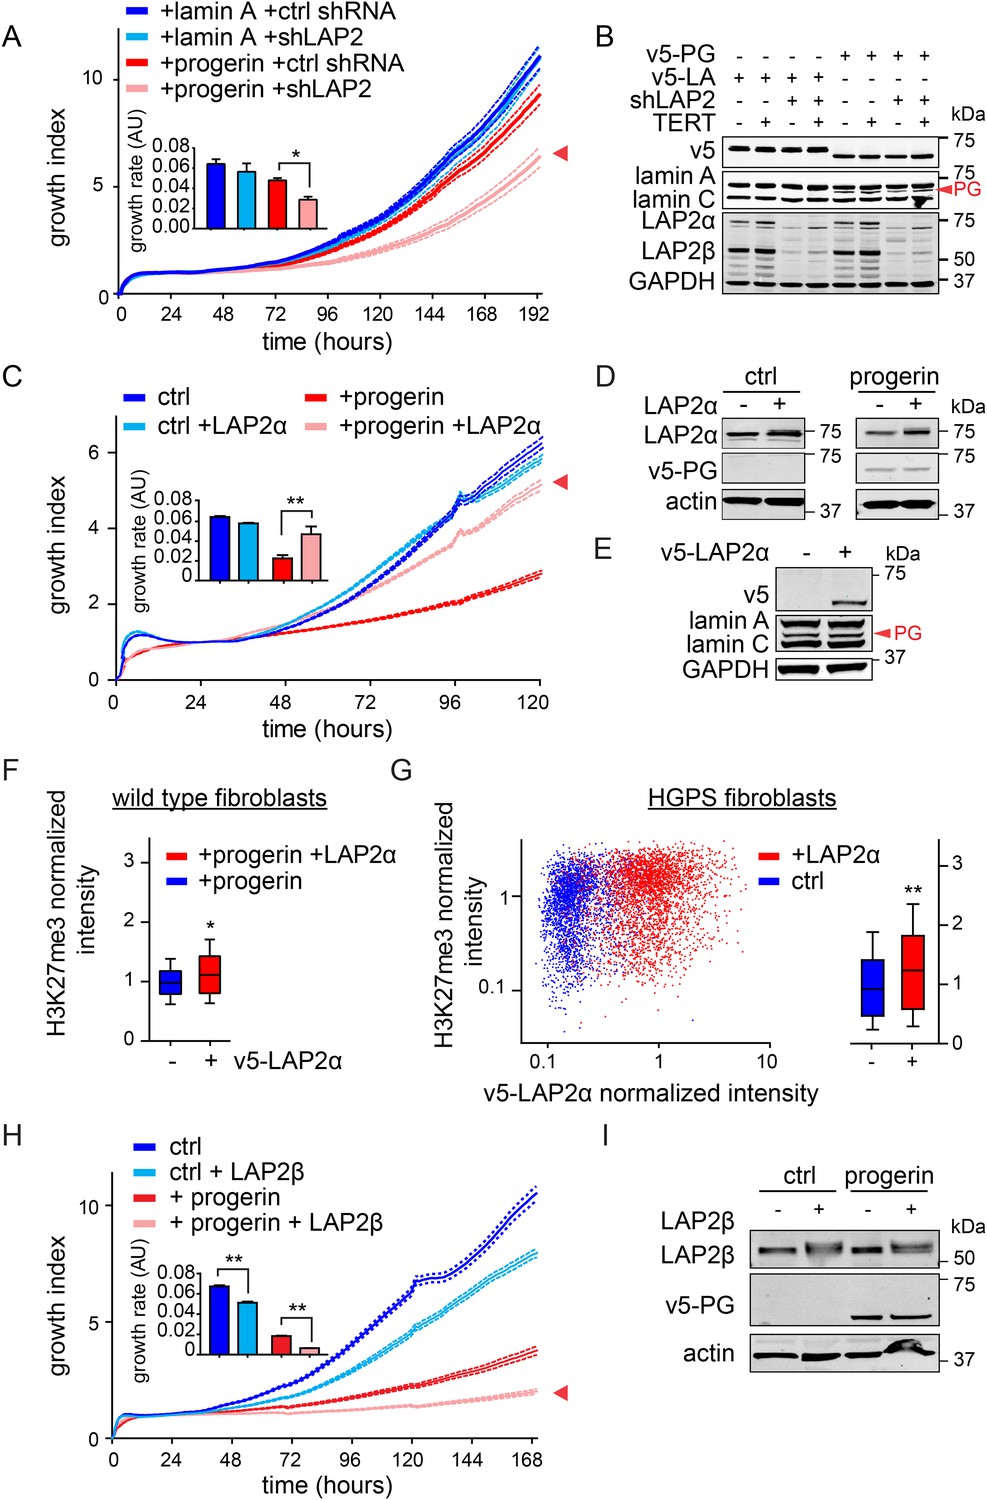
LAP2 depletion exacerbates the progerin-induced proliferation defect whereas specific overexpression of LAP2α rescues it.
(A) Growth curve of normal (ctrl shRNA) and LAP2-depleted (shLAP2) primary fibroblasts expressing progerin or lamin A. Dotted lines indicate SEM (n = 3). Inset: growth rate after 8 days, error bras indicate SEM (*p < 0.05, Student's t-test). (B) Western blot of primary and TERT+ cells expressing v5-tagged lamin A (v5-LA) or progerin (v5-PG) with or without LAP2 silencing by shRNA (shLAP2). V5-tag, lamin A, lamin C, progerin (PG), LAP2α, LAP2β and GAPDH are indicated. (C) Growth curve of fibroblasts expressing control vector or progerin in the presence or absence of doxycycline-inducible LAP2α. LAP2α expression was induced by addition of 0.25 µg/ml doxycycline. Dotted lines indicate SEM (n = 3). Inset: growth rate after 5 days, error bras indicate SEM (**p < 0.01, Student's t-test). (D) Western blot of primary fibroblasts carrying doxycycline-inducible v5-LAP2α, expressing control vector or progerin. LAP2α expression was induced by addition of 0.25 µg/ml doxycycline. LAP2α, progerin and actin are indicated. (E) Western blot showing doxycycline-dependent induction of v5-LAP2α in TERT+HGPS cells. (F) Box plot of H3K27me3 levels in human fibroblasts expressing progerin in the presence (red) or absence (blue) of ectopically expressed LAP2α (Student's t-test, p < 0.05, n > 7500 cell analyzed, whiskers represent 10–90 percentile. (G) Scatter plot analysis of H3K27me3 levels in TERT+HGPS cells in the presence (red) or absence (blue) of ectopically expressed LAP2α showing increased levels of H3K27me3 upon LAP2α induction (Student's t-test, p < 0.01, n > 4000 cell analyzed. Inset: box plot of the same data, whiskers represent 10–90 percentile, ***p < 0.001). (H) Growth curve of control (ctrl) or progerin expressing fibroblasts (+progerin) in the presence or absence of doxycycline-inducible v5-LAP2β. Dotted lines indicate SEM (n = 3). Inset: growth rate after 6 days, error bars indicate SEM (**p < 0.01, Student's t-test). (I) Western blot of fibroblasts transduced with doxycycline-inducible LAP2β and expressing control vector or progerin. LAP2β, progerin and actin are shown.
Figure 5—figure supplement 1
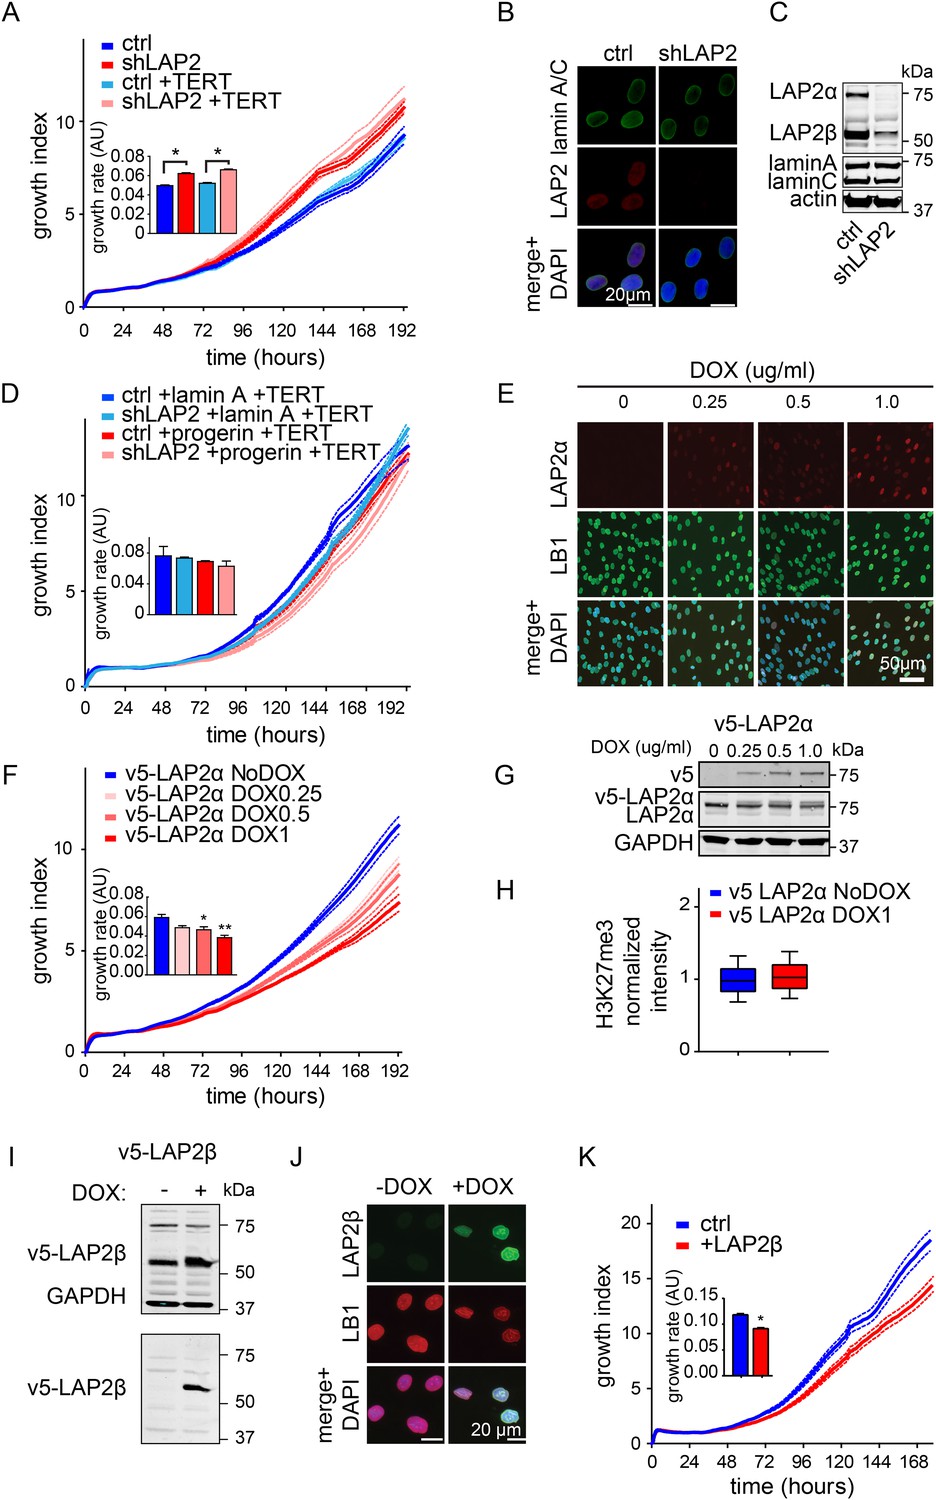
Depletion and expression of LAP2 in wild type and progerin expressing fibroblasts, control experiments.
(A) Growth curve of primary and TERT+ control and LAP2 shRNA expressing fibroblasts. Dotted lines indicate SEM (n = 3). Inset: growth rate after 7 days. (B) Immunofluorescence microscopy analysis of lamin A/C and LAP2 levels in cells expressing scrambled (ctrl) or LAP2-specific shRNA (shLAP2). Scale bar: 20 μm. (C) Western blot of wild type cells expressing scrambled control shRNA (ctrl) or LAP2 shRNA (shLAP2). The LAP2 antibody recognizes both α and β-isoforms of LAP2. Lamin A, lamin C and actin loading control are indicated. (D) Growth curve of normal (ctrl) and LAP2-depleted (shLAP2) TERT+ fibroblasts expressing progerin or lamin A. Dotted lines indicated SEM (n = 3). Inset: growth rate after 7 days. (E) Immunofluorescence microscopy showing dose-dependent induction of v5-LAP2α and its nucleoplasmic localization. Antibodies: v5, lamin B1 (LB1), merged + DAPI. Doxycyclin concentrations are indicated on the left. Scale bar: 50 μm. (F) Growth curve of primary fibroblasts expressing varying amounts of v5-LAP2α (doxycyclin concentration: 0, 0.25, 0.5 and 1 µg/ml). Dotted lines indicate SEM (n = 3). Inset: growth rate after 7 days (*p < 0.05, **p < 0.01, errors bars indicate SEM). (G) Western blot showing dose (doxycyclin)-dependent induction of v5-tagged LAP2α in normal dermal fibroblasts. Antibodies recognizing v5-tag, LAP2α and GAPDH are shown. (H) Box plot of H3K27me3 levels in human TERT+ fibroblasts expressing LAP2α (or non induced control), whiskers represent 10–90 percentile). (I) Western blot showing doxycyclin-dependent induction of v5-tagged LAP2β in normal fibroblasts. Western blot was probed with an antibody recognizing LAP2α and LAP2β, GAPDH (upper panel) and v5-tag (lower panel). (J) Immunofluorescence microscopy showing doxycyclin-dependent induction of v5-LAP2β and its localization to the nuclear periphery. Antibodies: v5-tag (green), lamin B1 (LB1, red), merged + DAPI. Scale bar: 20 μm. (K) Growth curve of normal fibroblasts in the presence (+DOX) or absence (no DOX) of ectopic LAP2β. Dotted lines indicate SEM (n = 3). Inset: growth rate after 7 days (*p < 0.05, errors bars indicate SEM, Student's t-test).
Figure 5—figure supplement 2
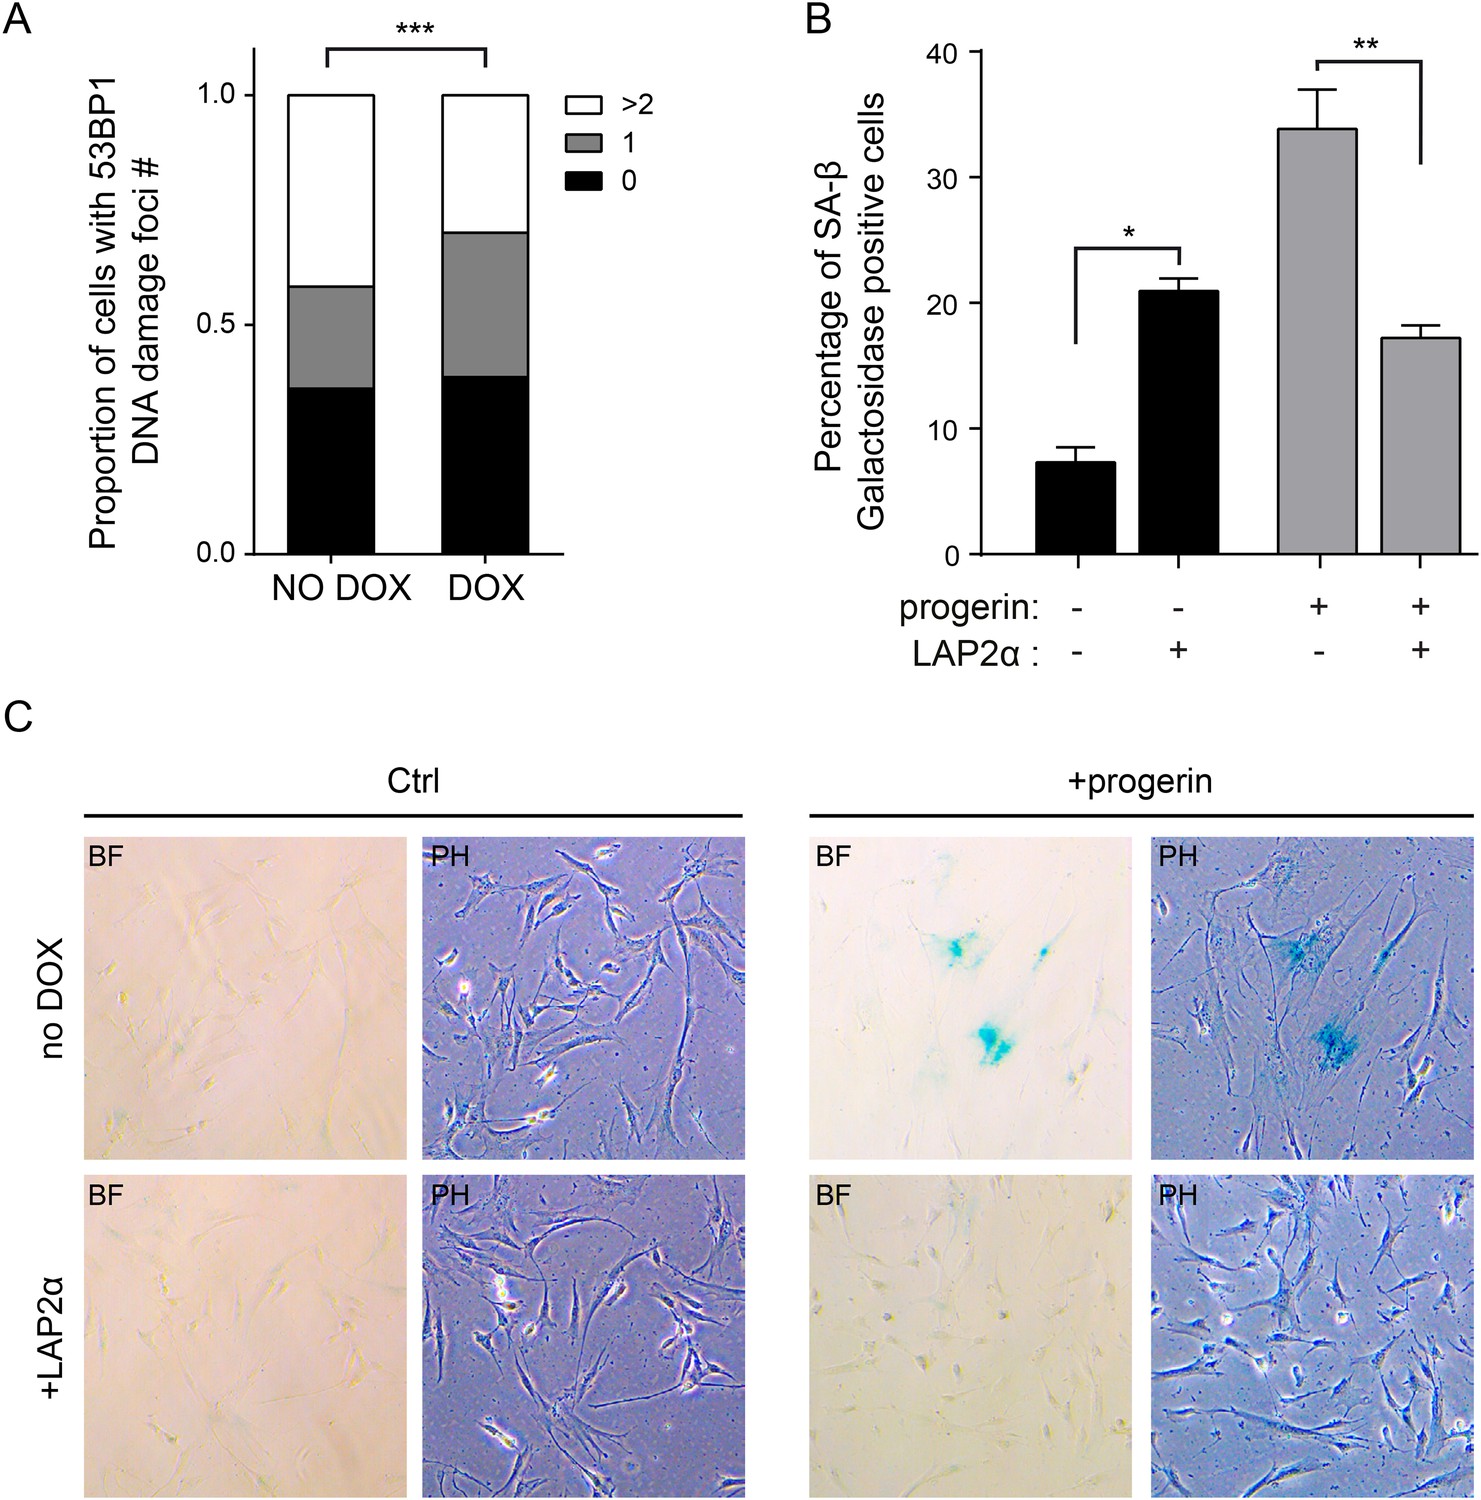
Expression of LAP2α prevents progerin induced DNA damage and premature senescence.
(A) Quantification of progerin-induced 53BP1 DNA damage foci in response to expression of v5-LAP2 α levels (p < 0.001, n > 300, χ2 test). (B) Percentage of senescence-associated β-gal-positive cells in control or progerin expressing cells in the presence or absence of ectopic LAP2α (n = 3, error bars indicate SEM, *p < 0.05, **p < 0.01, two-way ANOVA with Tukey's post-test). (C) Brightfield (BF) and phase contrast (PH) images of control or progerin expressing cells ± ectopic LAP2α.
Figure 5—figure supplement 3
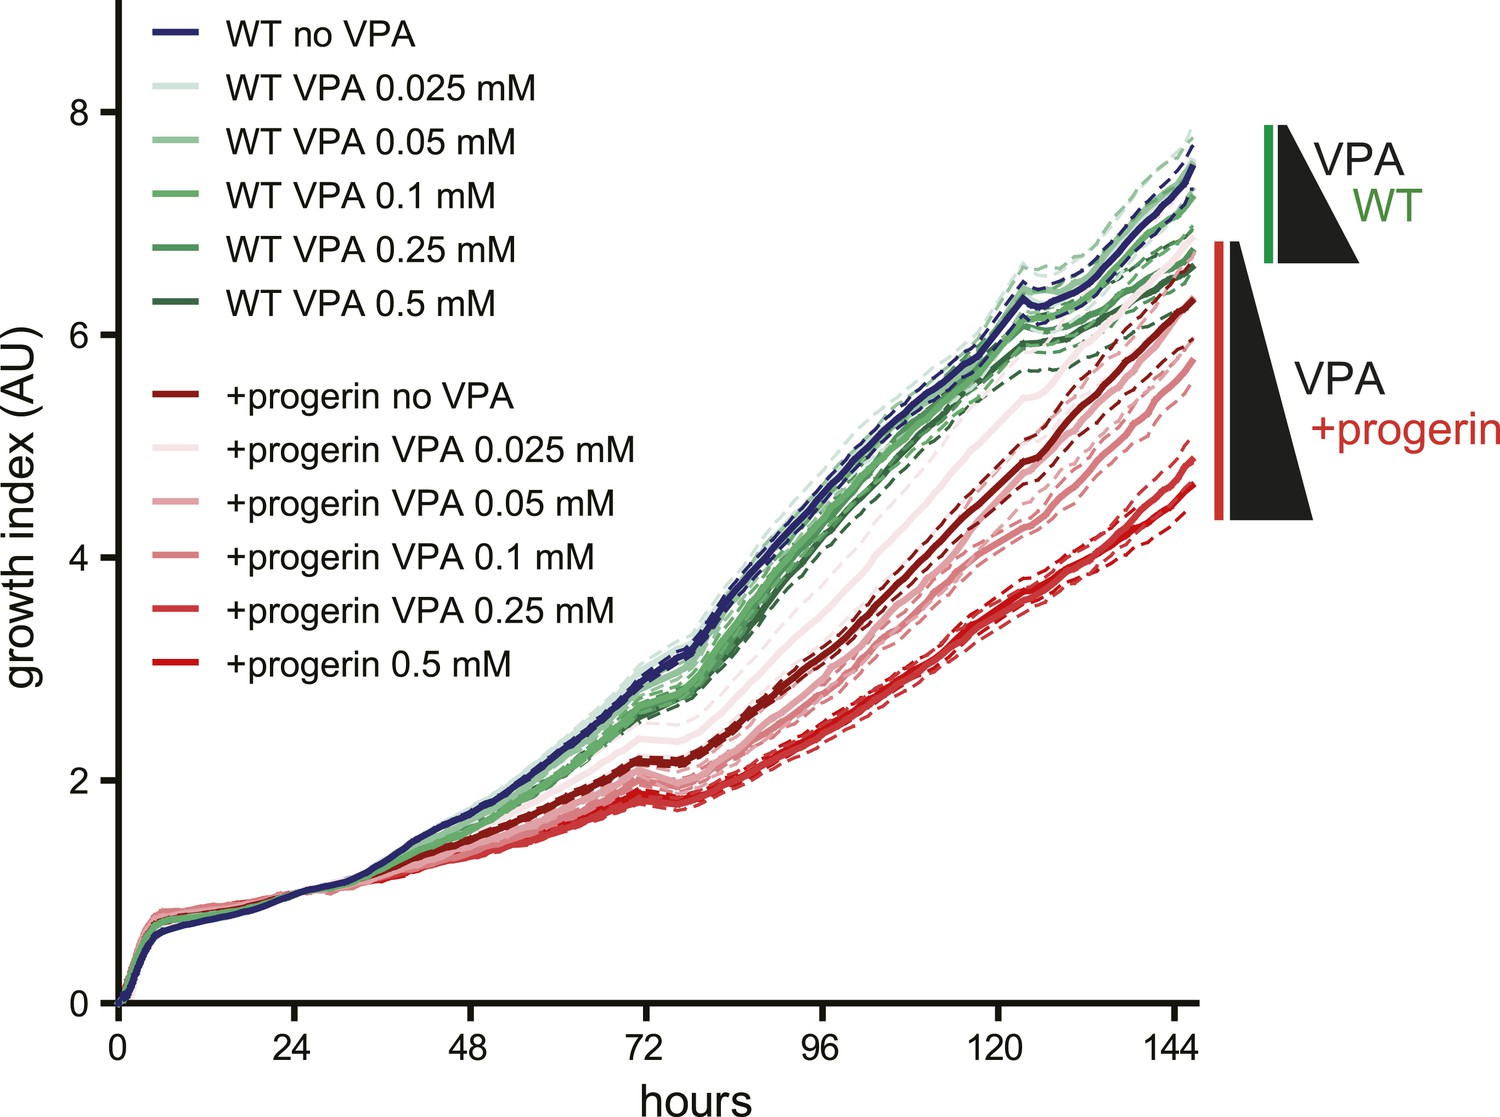
Effects of valproic acid treatment on proliferation of control (non-induced WT, green lines) and progerin-expressing (red lines) normal dermal fibroblasts.
Concentrations of valproic acid 0.025–0.5 μM are indicated.
Figure 6
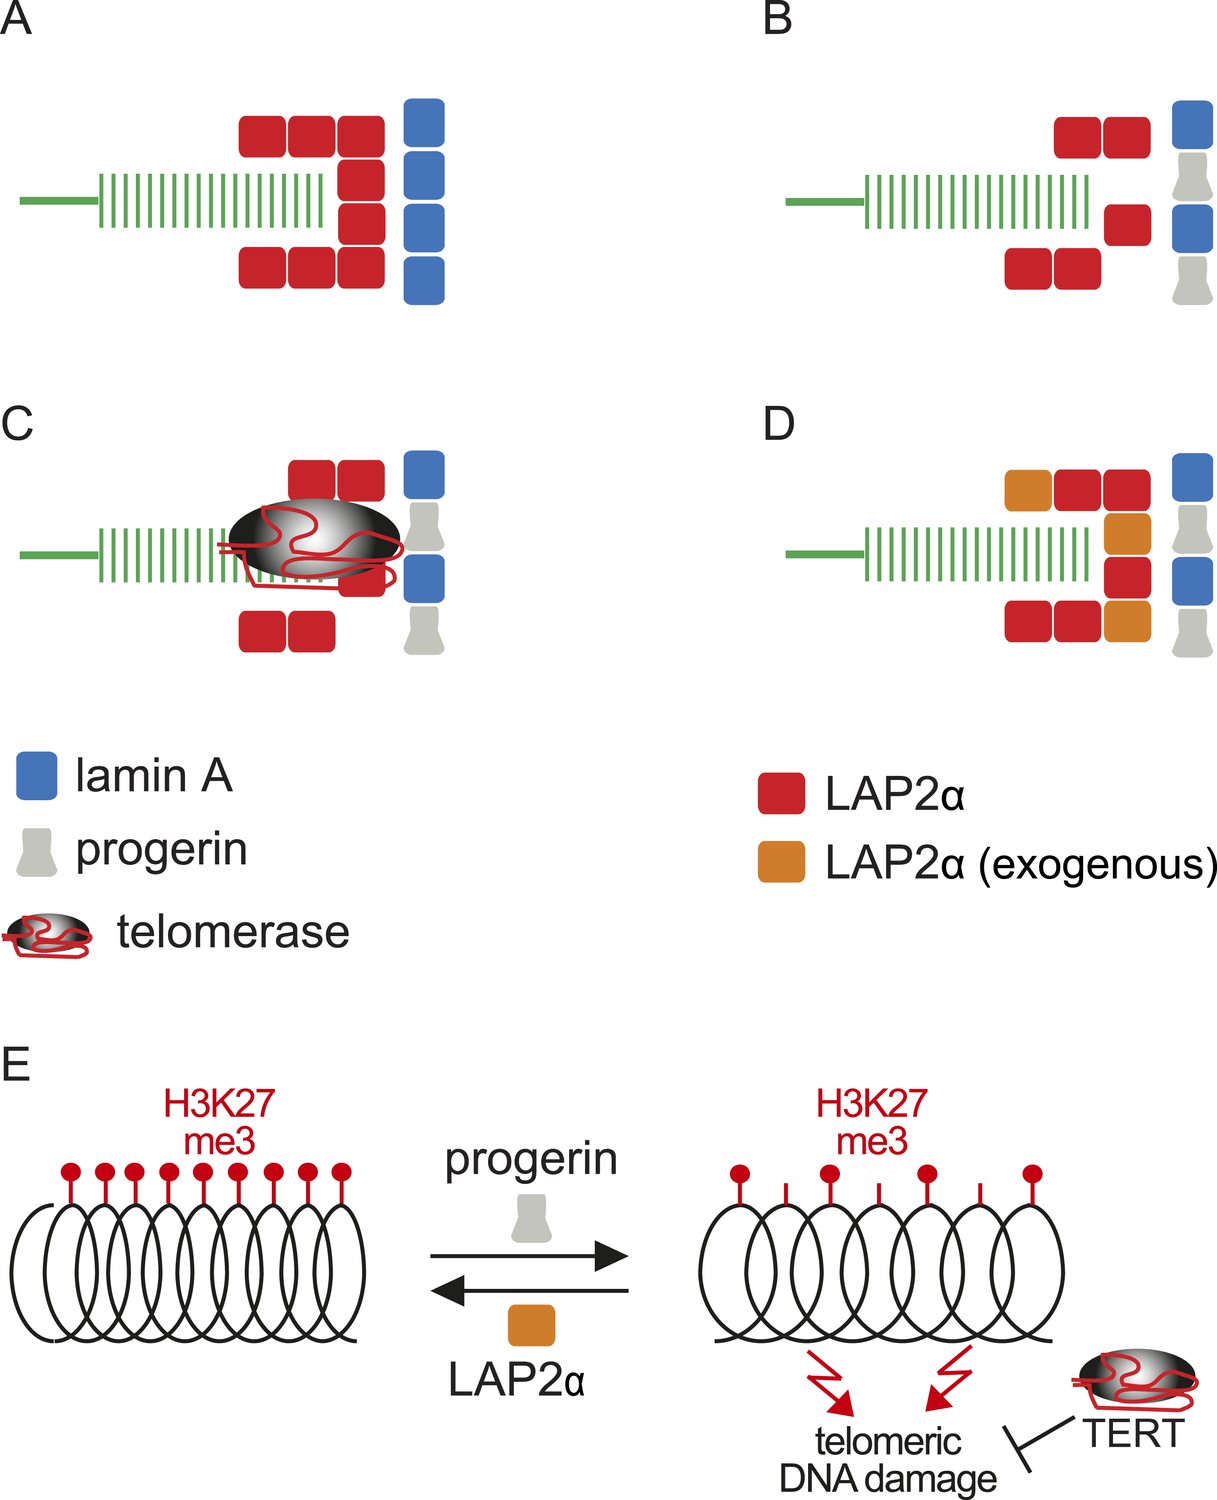
Putative model of lamin A/progerin::LAP2α interaction mechanism with telomeres.
(A) Normal formation of lamin A::LAP2 complexes allows proper positioning of LAP2α near telomeres (green). (B) Perturbed progerin::LAP2α interaction impairs LAP2α localization at telomeres. (C) Telomeric damage resulting from this impaired interaction can be rescued by expression of telomerase (gray) or (D) by supplementing cells with exogenous LAP2α (orange). (E) Progerin-induced H3K27me3 loss is prevented by ectopic LAP2α expression. TERT expression does not prevent progerin-induced loss of H3K27me3 but rescues telomere dysfunction by telomere elongation.
Author response image 1
Download links
A two-part list of links to download the article, or parts of the article, in various formats.
Downloads (link to download the article as PDF)
Open citations (links to open the citations from this article in various online reference manager services)
Cite this article (links to download the citations from this article in formats compatible with various reference manager tools)
Progerin reduces LAP2α-telomere association in Hutchinson-Gilford progeria
eLife 4:e07759.
https://doi.org/10.7554/eLife.07759


