Membrane properties specialize mammalian inner hair cells for frequency or intensity encoding
- University of Sheffield, United Kingdom
Figures
Figure 1
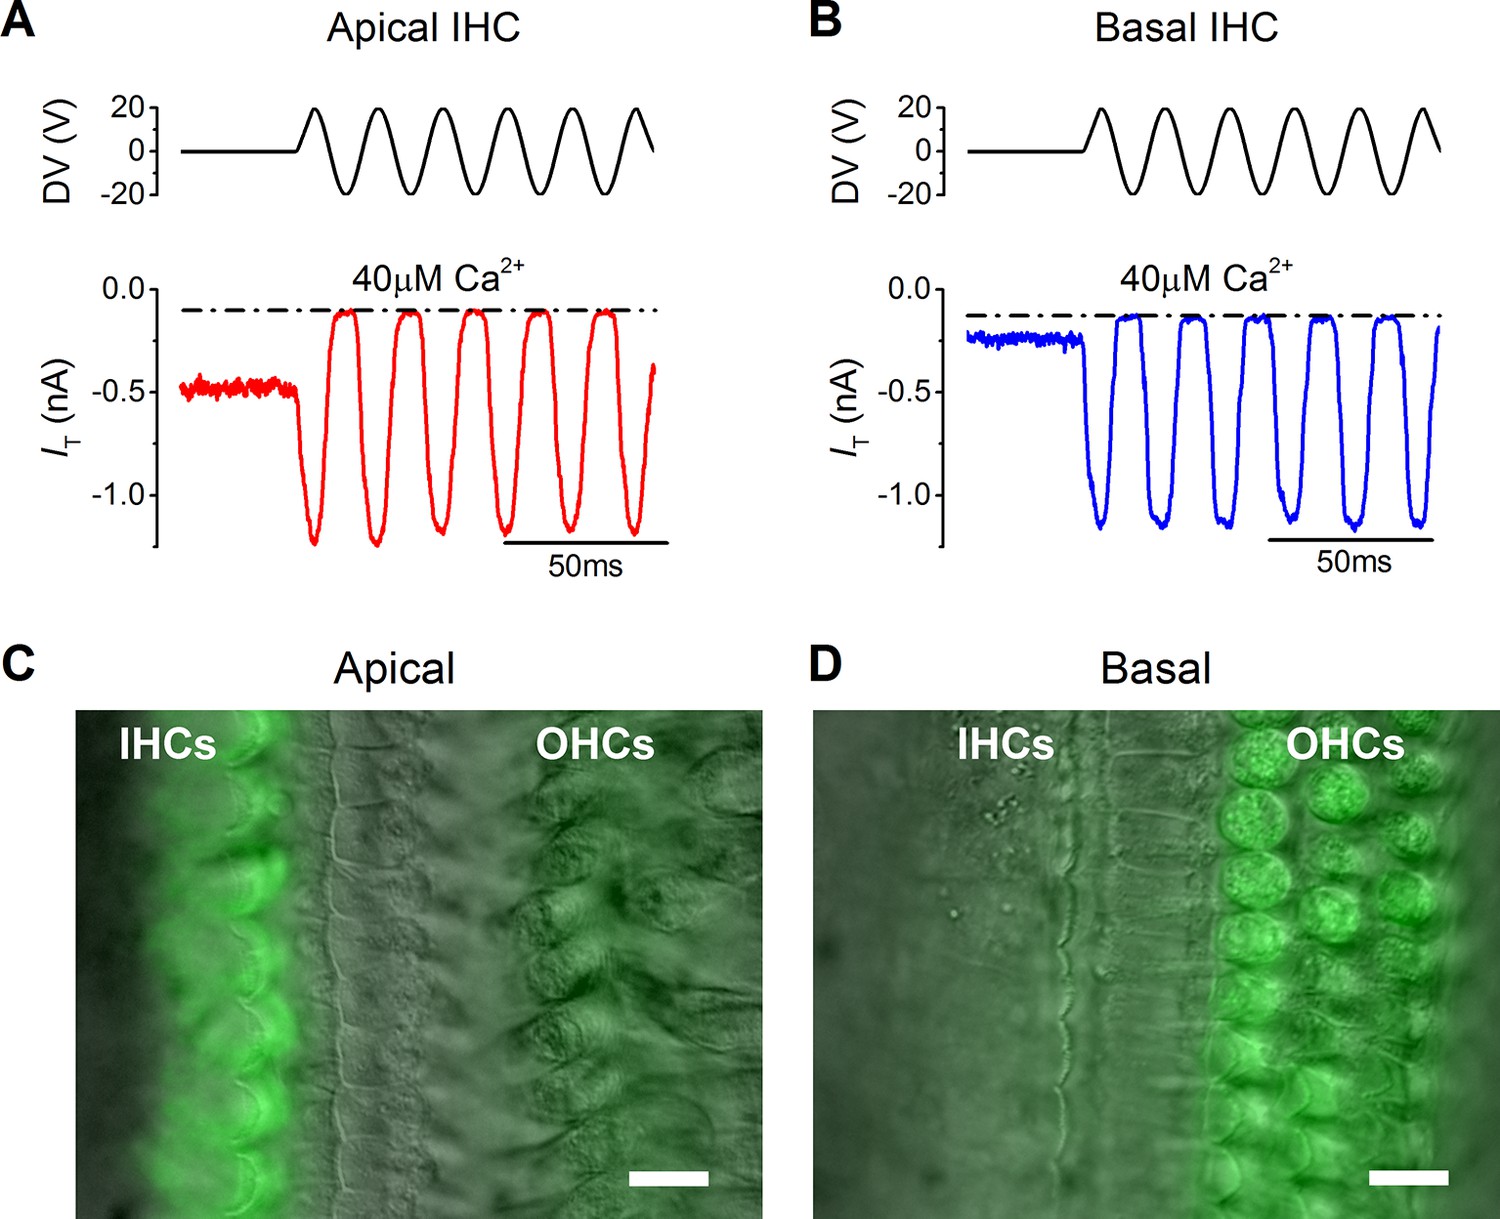
The resting mechanotransducer (MT) current in apical and basal inner hair cells (IHCs) from adult gerbils.
(A and B) Saturating MT currents recorded from an apical (A) and a basal IHC (B) by applying 50 Hz sinusoidal force stimuli to the hair bundles at the membrane potential of –84 mV. Recordings were carried out in the presence of a low-Ca2+ (40 µM) extracellular solution. The driver voltage (DV) signal of up to ± 20 V to the fluid jet is shown above the traces (positive deflections are excitatory). The dashed lines indicate the closure of the transducer channels and disappearance of the resting current during inhibitory bundle displacements. (C and D) FM1-43 fluorescence images of apical (C) and basal (D) gerbil cochlear sections (P18) with the differential interference contrast (DIC) image superimposed. Apical IHCs, and to a much less extent outer hair cells (OHCs), were labeled by the dye whereas the opposite pattern was seen in basal cells. Scale bar represents 10 μm.
Figure 2

The resting membrane potential in apical and basal inner hair cells (IHCs) from adult gerbils.
(A–C) Current clamp responses of apical (top panels) and basal (lower panels) IHCs from adult gerbils in response to 100 pA current steps from -100 pA to 900 pA from the cells’ resting potential (Vm). From left to right are responses in 1.3 mM extracellular Ca2+ (A), low-Ca2+ (40 µM) endolymph-like solution (B), and low-Ca2+ solution with 100 µM dihydrostreptomycin (DHS) (C). Traces are averages from all IHCs (apical: n = 12; basal: n = 11). (D) Average Vm values measured before the current steps in the different extracellular conditions as in (A–C), including the washout with 1.3 mM Ca2+, for apical (red) and basal (blue) IHCs. (E) Average peak (open symbols) and steady-state (closed symbols) Vm from apical and basal IHCs measured at different current injection levels from the current clamp recordings in low-Ca2+ in (B). The arrowheads/arrows in (B) indicate where the peak and steady state Vm were measured. Note that the voltage responses of basal cells to a sustained current step, similar to a high-frequency tone, are more clearly graded to the stimulus amplitude than those in apical cells in terms of the dynamic range of voltages covered. (F) Average onset of the initial Vm response to 100 pA current injection in 1.3 mM Ca2+ (left) and low-Ca2+ (right) for apical IHCs (top panels, n = 12) and basal IHCs (bottom panels, n = 11). The initial rise to peak was fit with a single exponential function. The average time constant (τ), obtained from fitting the individual cells, was (apical IHCs) 1.03 ± 0.11 ms in 1.3 mM Ca2+ and 0.44 ± 0.08 ms in low-Ca2+; (basal IHCs) 1.89 ± 0.19 ms (1.3 mM Ca2+) and 1.07 ± 0.13 (low-Ca2+).
Figure 3
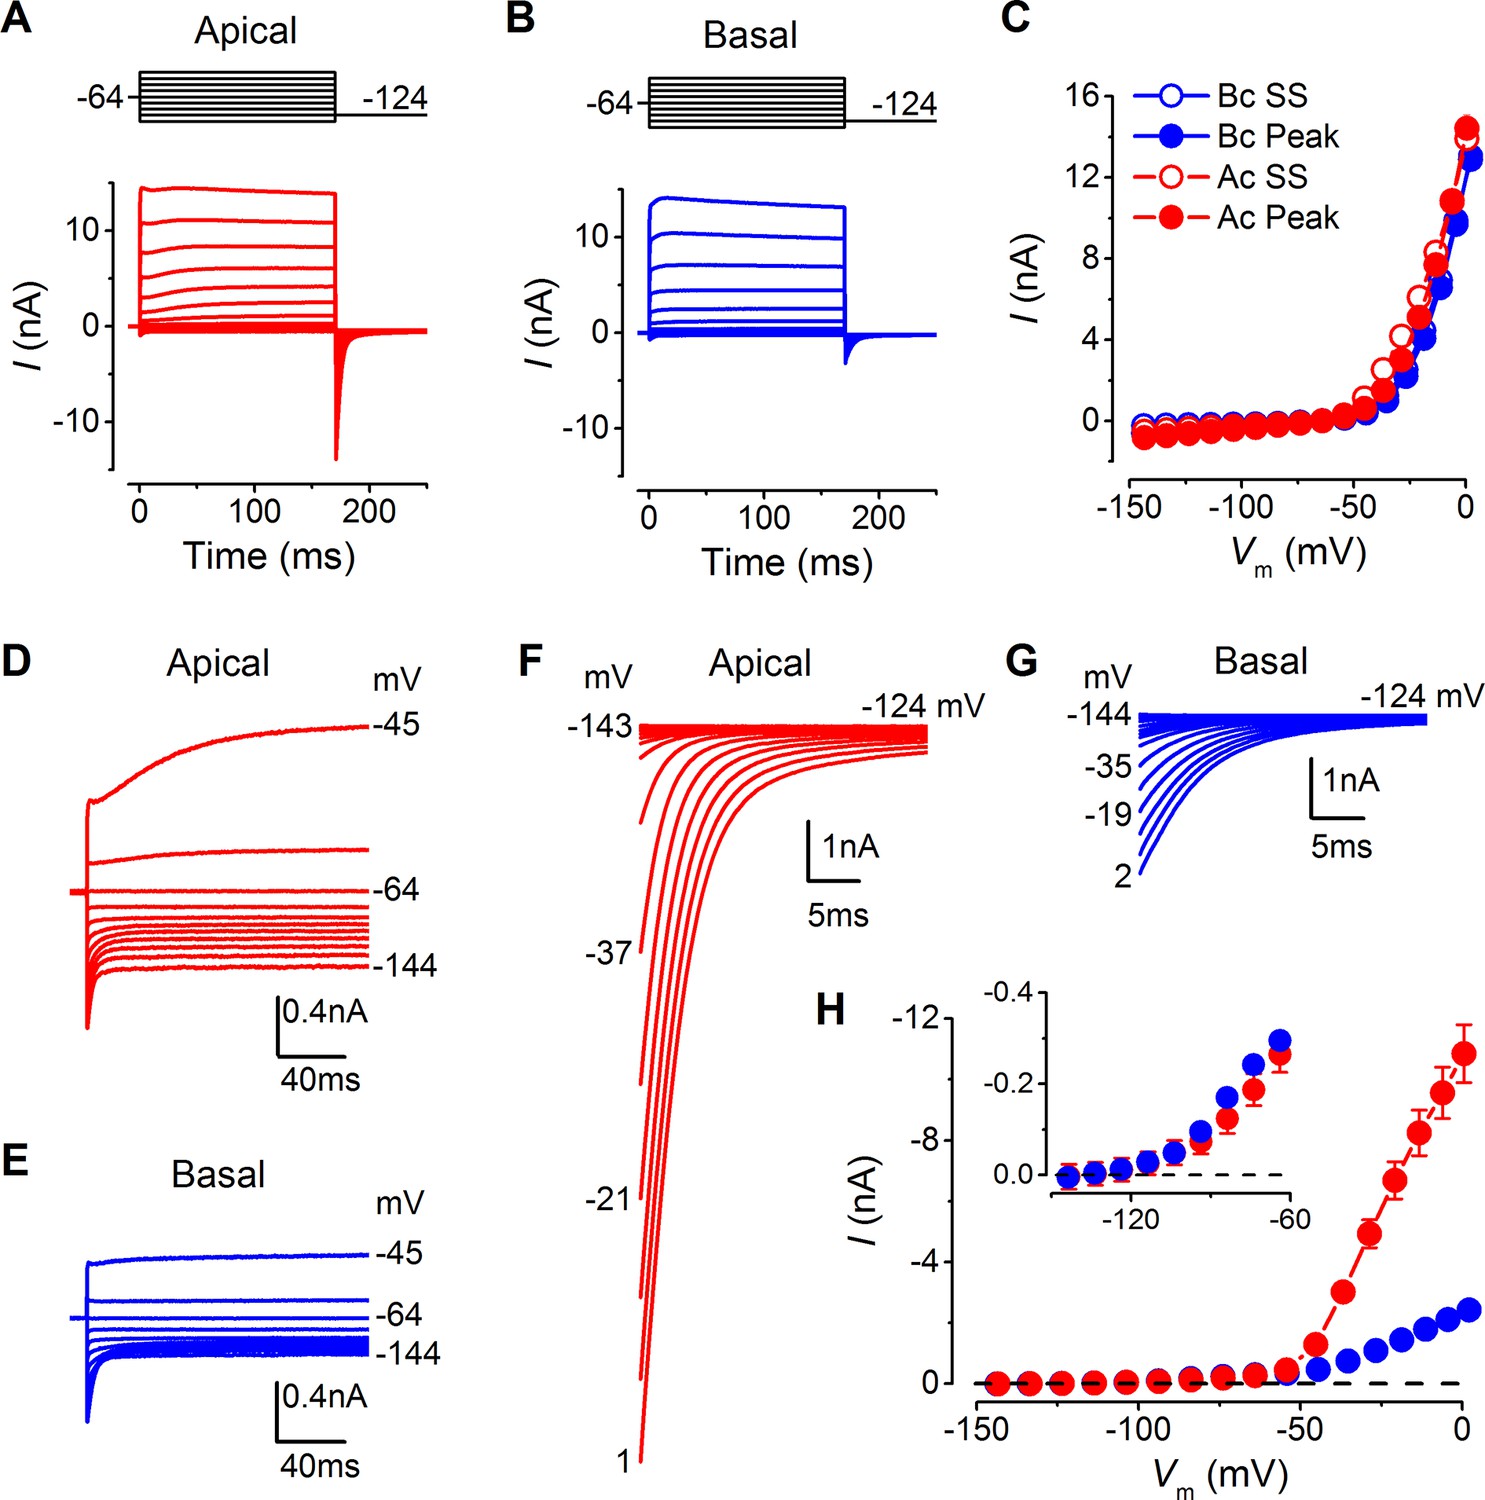
Differences in the basolateral membrane currents of apical and basal adult gerbil inner hair cells (IHCs).
(A and B) Basolateral membrane currents elicited from apical (A, red) and basal (B, blue) IHCs in response to depolarizing voltage steps in nominal 10 mV increments from –144 mV (holding potential: –64 mV). Tail currents were measured upon returning to –124 mV (protocol shown above the current traces). Traces are averages from 26 apical and 27 basal IHCs. (C) Average current-voltage (I-V) curves for apical and basal IHCs. Peak currents were measured at 2 ms from the onset of the test step and steady-state values were obtained at around 160 ms. (D and E) Average current traces as in (A) and (B), but on an expanded y-scale to show more clearly the time course of the currents at more negative membrane potentials. (F and G) Average tail currents from apical and basal IHCs, respectively, from the different test potentials shown by some of the traces (amplified from [A] and [B]). (H) Average activation curves for apical and basal IHCs made by plotting the instantaneous tail current amplitude against the preceding voltage step. The inset shows the activation of the K+ currents on an expanded scale.
Figure 4
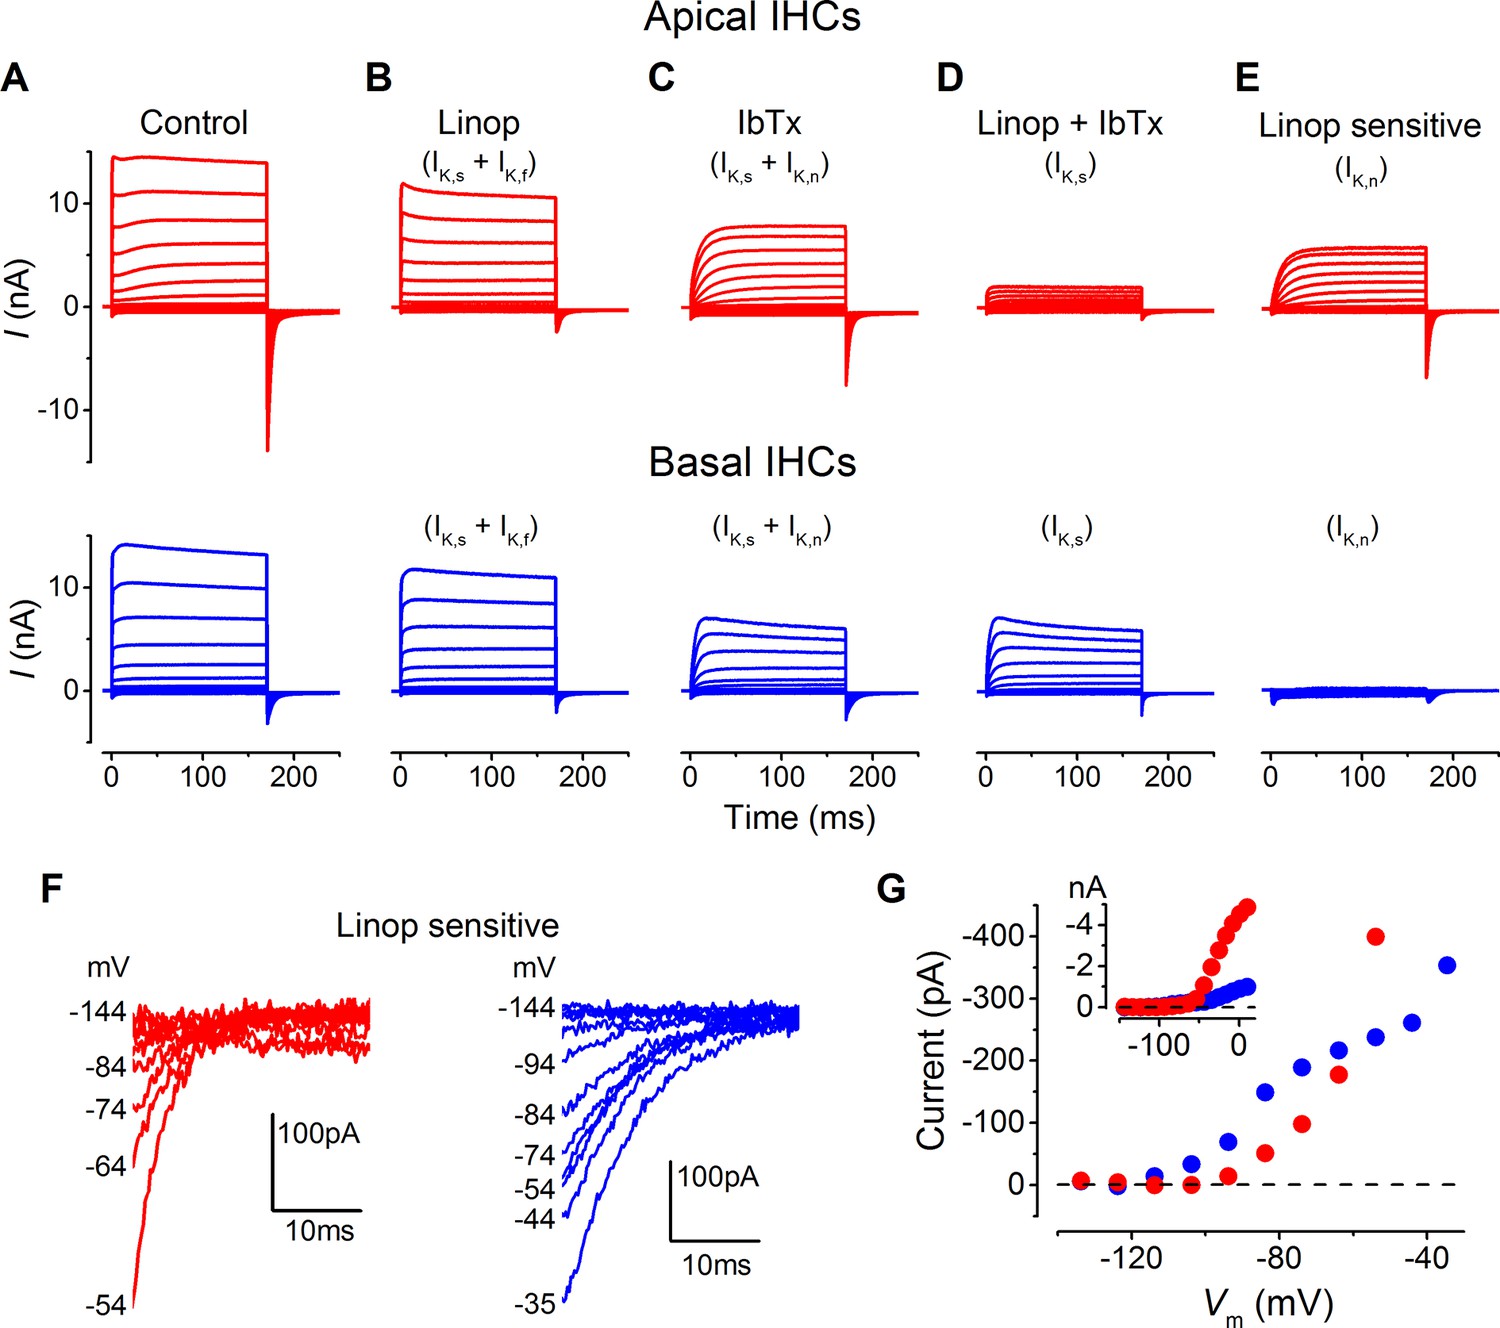
Differences in the K+ current components in apical and basal gerbil inner hair cells (IHCs).
(A–E) average basolateral currents elicited as in Figure 3 from apical (red) and basal (blue) IHCs in the presence of different K+ channel blockers to isolate the underlying current components. The control traces (A) are the same as those in Figure 3A and B. (B) The perfusion of linopirdine (80 µM) blocked the inward IK,n in both apical and basal IHCs leaving IK,s and IK,f (apical n = 5, basal n = 7). Linopirdine also removed the outward delayed component in apical cells but not in basal cells. (C) The perfusion of iberiotoxin (IbTx; 60 nM) was used to block the rapidly activating IK,f leaving a current composed of IK,s and IK,n (apical n = 4, basal n = 4). (D) The combination of linopirdine and iberiotoxin (Linop + IbTx) was used to isolate IK,s (apical n = 4, basal n = 4), which was small in apical cells but of a similar size to that in C for basal cells. (E) The isolated IK,n (Linop sensitive) was obtained by subtracting the current in the presence of both linopirdine and IbTx (D) from the current obtained in the presence of IbTx (C). (F) Average tail currents at –124 mV from the linopirdine sensitive current in E for apical and basal IHCs. Only the most negative traces are shown to emphasize the negatively activating component of the linopirdine-sensitive current. (G) Average activation curves for the negatively activating component of the linopirdine-sensitive current from the instantaneous tail current amplitudes in F for apical and basal cells. The inset shows the activation curves up to more positive voltages as in Figure 3H.
Figure 5

Endogenous Ca2+ buffering does not affect differences in basolateral membrane currents or the resting mechanotransducer (MT) current in apical and basal adult gerbil inner hair cells (IHCs).
(A and B) Basolateral membrane currents elicited from apical (A, red) and basal (B, blue) IHCs as in Figure 3A and B. (C) Average peak and steady-state current-voltage (I-V) curves for apical (n = 3) and basal (n = 4) IHCs. (D and E) Membrane currents covering a physiological range of IHC membrane potentials elicited from the holding potential of around -70 mV. The holding current is indicated in the first panel as IH. Recordings were made in standard 1.3 mM extracellular Ca2+ (left panels), 40 µM Ca2+ (middle panels), and 40 µM Ca2+ with 100 µM DHS (right panels). Low Ca2+ (40 µM) elicited a large inward holding current only in apical IHCs (asterisk) that was blocked by DHS.
Figure 6
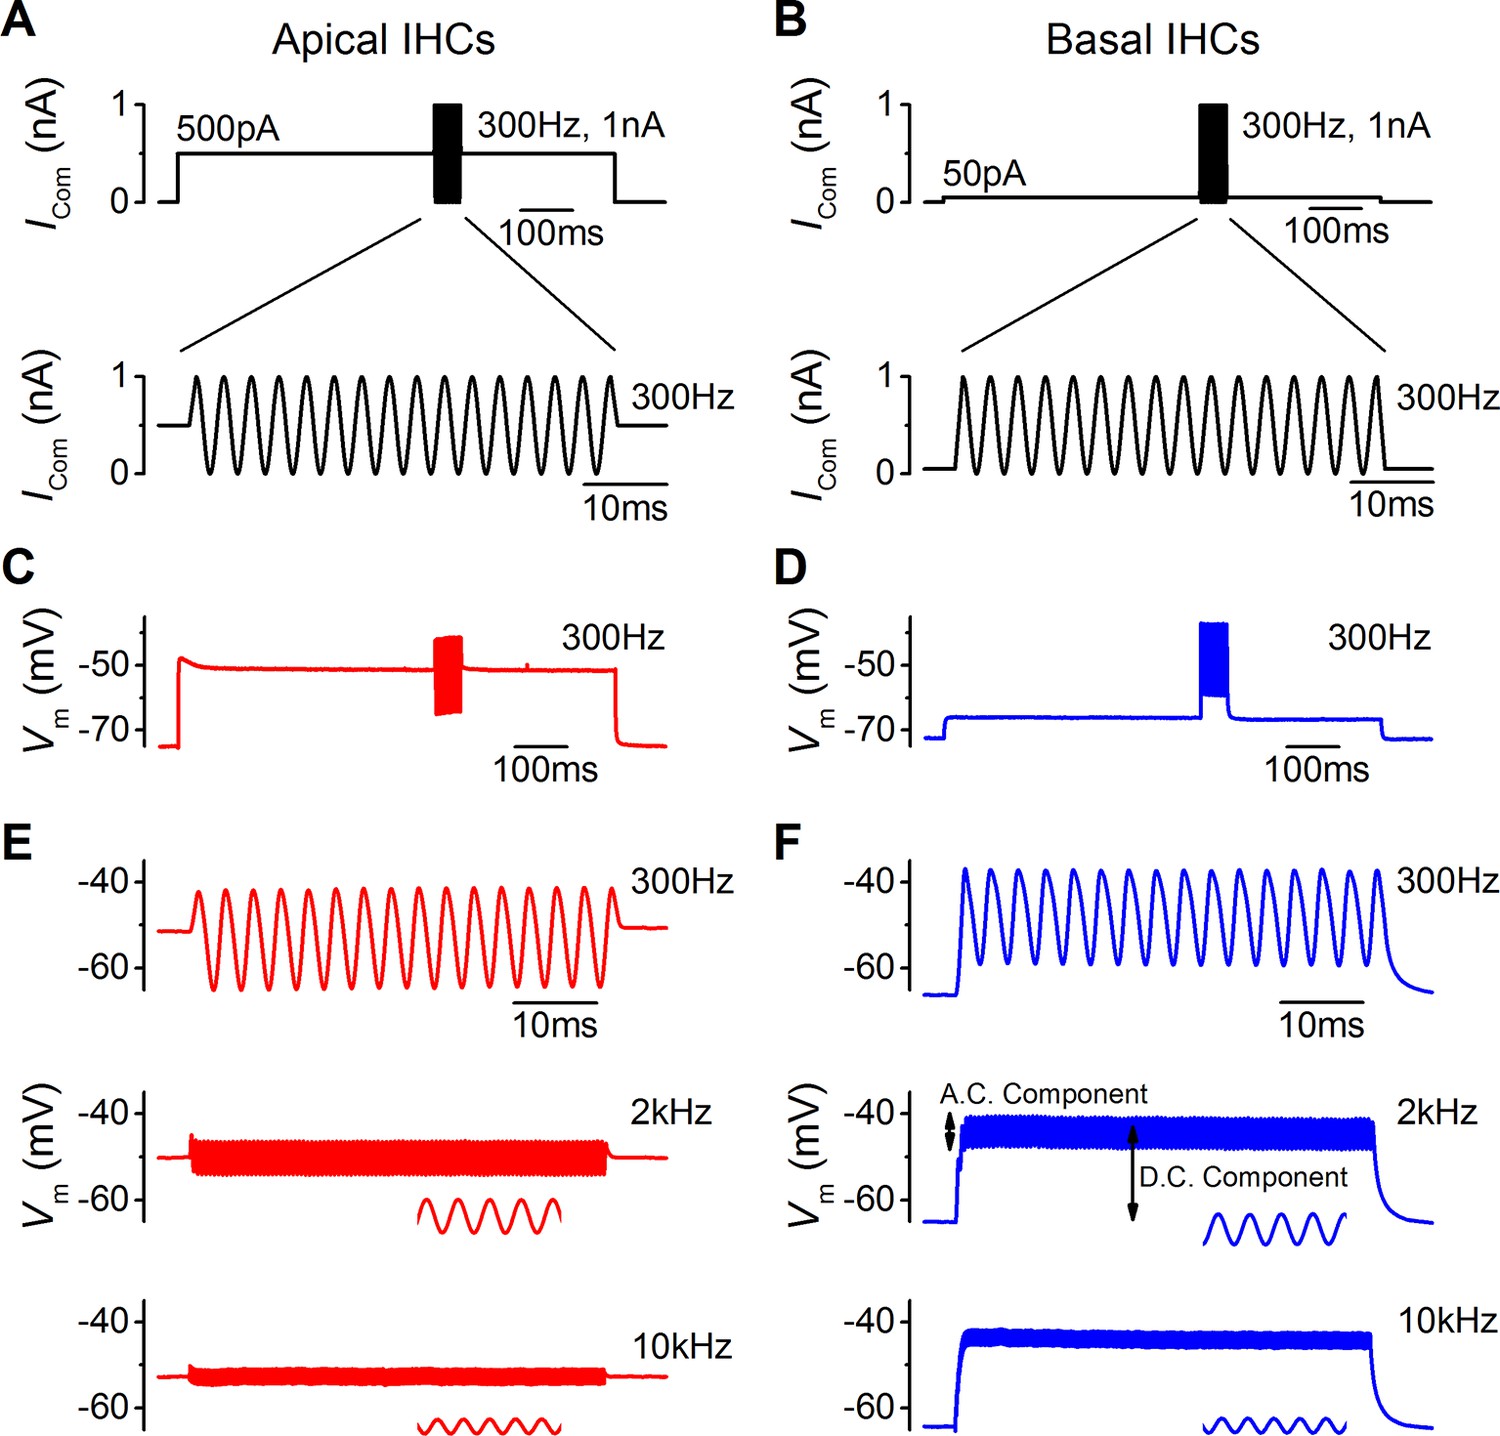
Sound-like stimulation of apical and basal adult gerbil inner hair cells (IHCs).
(A and B) Current clamp protocols used to mimic the in vivo sound-induced stimulation of apical (A) and basal (B) IHCs. A 300 Hz sinewave of 1 nA peak-to-peak amplitude was superimposed on a step current injection (apical: 500 pA; basal: 50 pA), which was used to depolarize lHCs to their predicted in vivo resting potential (see Results). Expanded versions of the sinewave stimulus (top) are shown below. (C and D) Average voltage responses from apical (n = 7) and basal (n = 6) IHCs in response to the whole stimulus shown in (A) and (B) (top). (E and F) Average voltage responses of apical (E) and basal (F) IHCs to a 300 Hz (top), 2 kHz (middle), and a 10 kHz (bottom) 1 nA sinewave. Only the sinewave portion of the responses is shown and the holding current levels were as in (A) and (B), respectively. An expanded portion of the 2 kHz and 10 kHz voltage responses is shown below the main trace in order to show some cycles of the sine wave. For the basal response at 2 kHz the predominantly phasic (AC) and predominantly sustained (DC) components are indicated. Apical cells showed only the AC component for 1 nA stimuli.
Figure 7
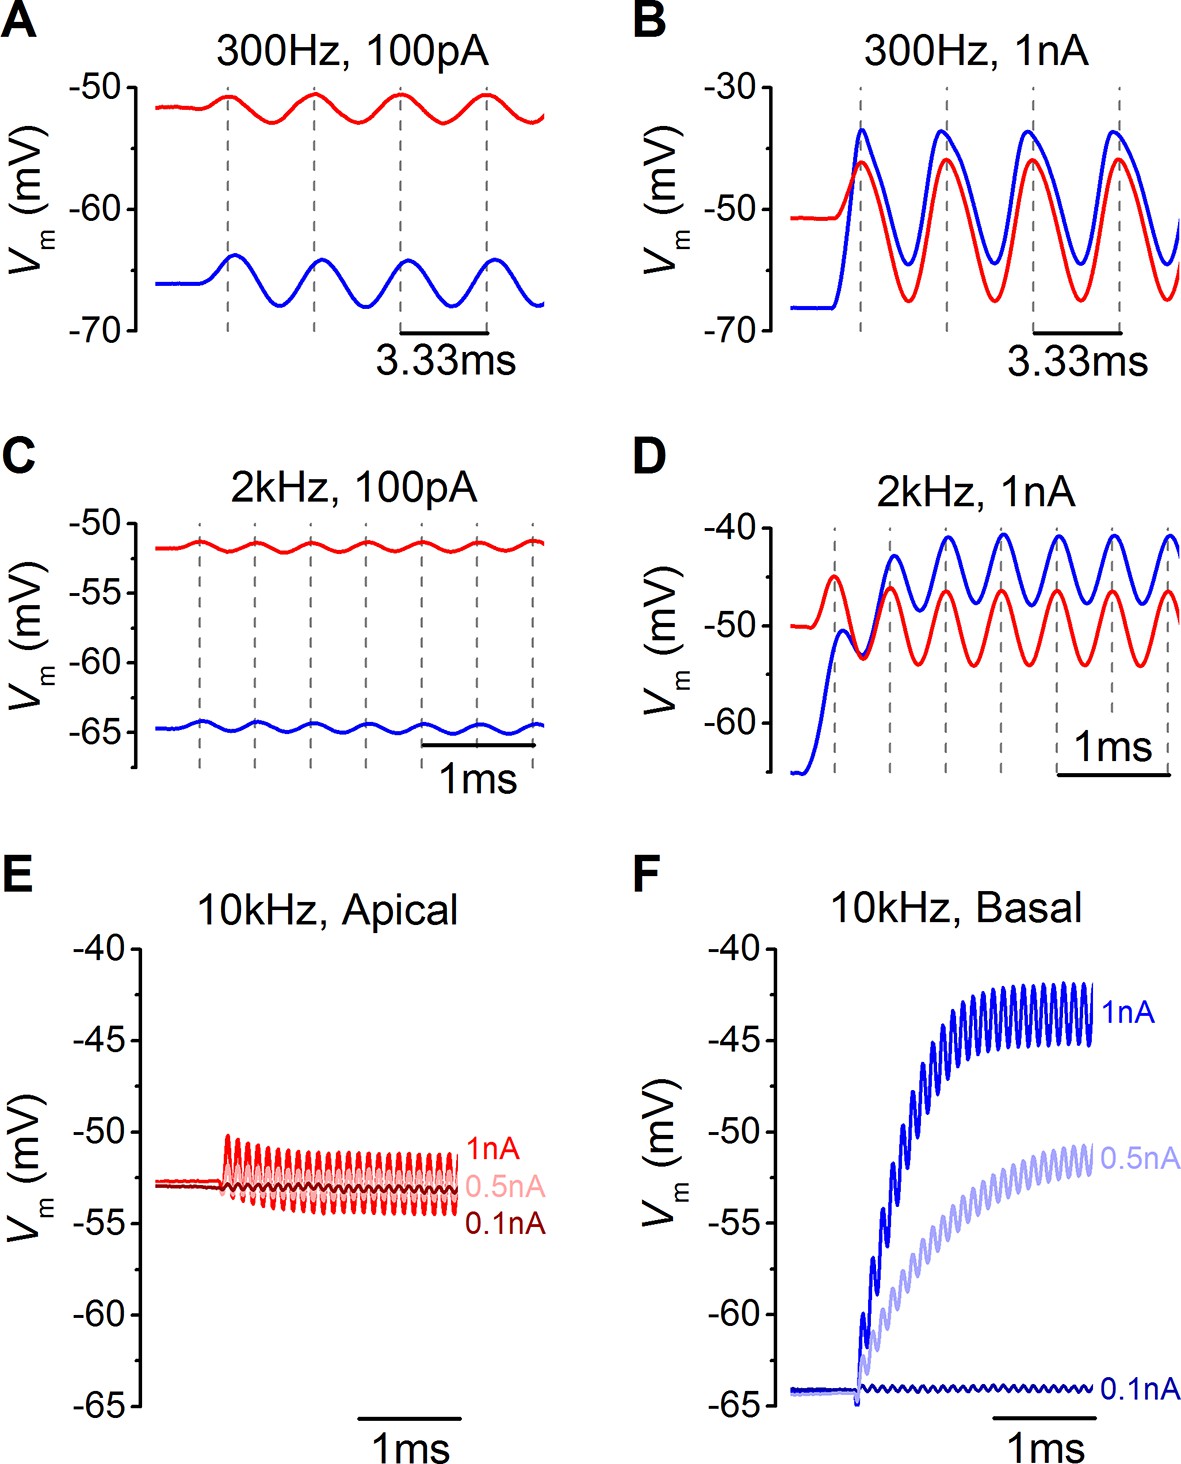
Voltage responses of apical and basal inner hair cells (IHCs) to sound-like stimulation of different intensity.
(A) Voltage responses of apical and basal IHCs to 100 pA, 300 Hz sinewave stimulation. Dashed vertical lines are spaced at 3.33 ms to represent one cycle at 300 Hz with the first being aligned to the initial peak of the apical response. Basal responses show a delay compared to the peaks in apical cells. (B) Voltage responses as in (A) but using a 1 nA, 300 Hz sinewave (only the initial four cycles are shown). Dashed vertical lines are aligned as in (A). Note the leftward leaning of the basal upper peaks following the initial one. (C) Responses to 100 pA, 2 kHz stimulation showing the initial few milliseconds. The dashed vertical lines are as in (A) but spaced to show cycles at 2 kHz. The responses of apical and basal IHCs are reduced in magnitude compared to those at 300 Hz (A), but the delay in the basal peaks was maintained. (D) Responses to 1 nA, 2 kHz stimulation with vertical lines as in (C). Note that the depolarization builds up in basal responses and that the peaks are delayed compared to those for apical cells. (E and F) The initial few ms of 10 kHz responses to three different amplitude stimuli, shown next to the traces for apical (E, n = 6) and basal cells (F, n = 6). While both apical and basal IHCs have a graded phasic (AC) response to the stimulus, basal cells show a pronounced graded (DC) response to the stimulus intensity.
Figure 8
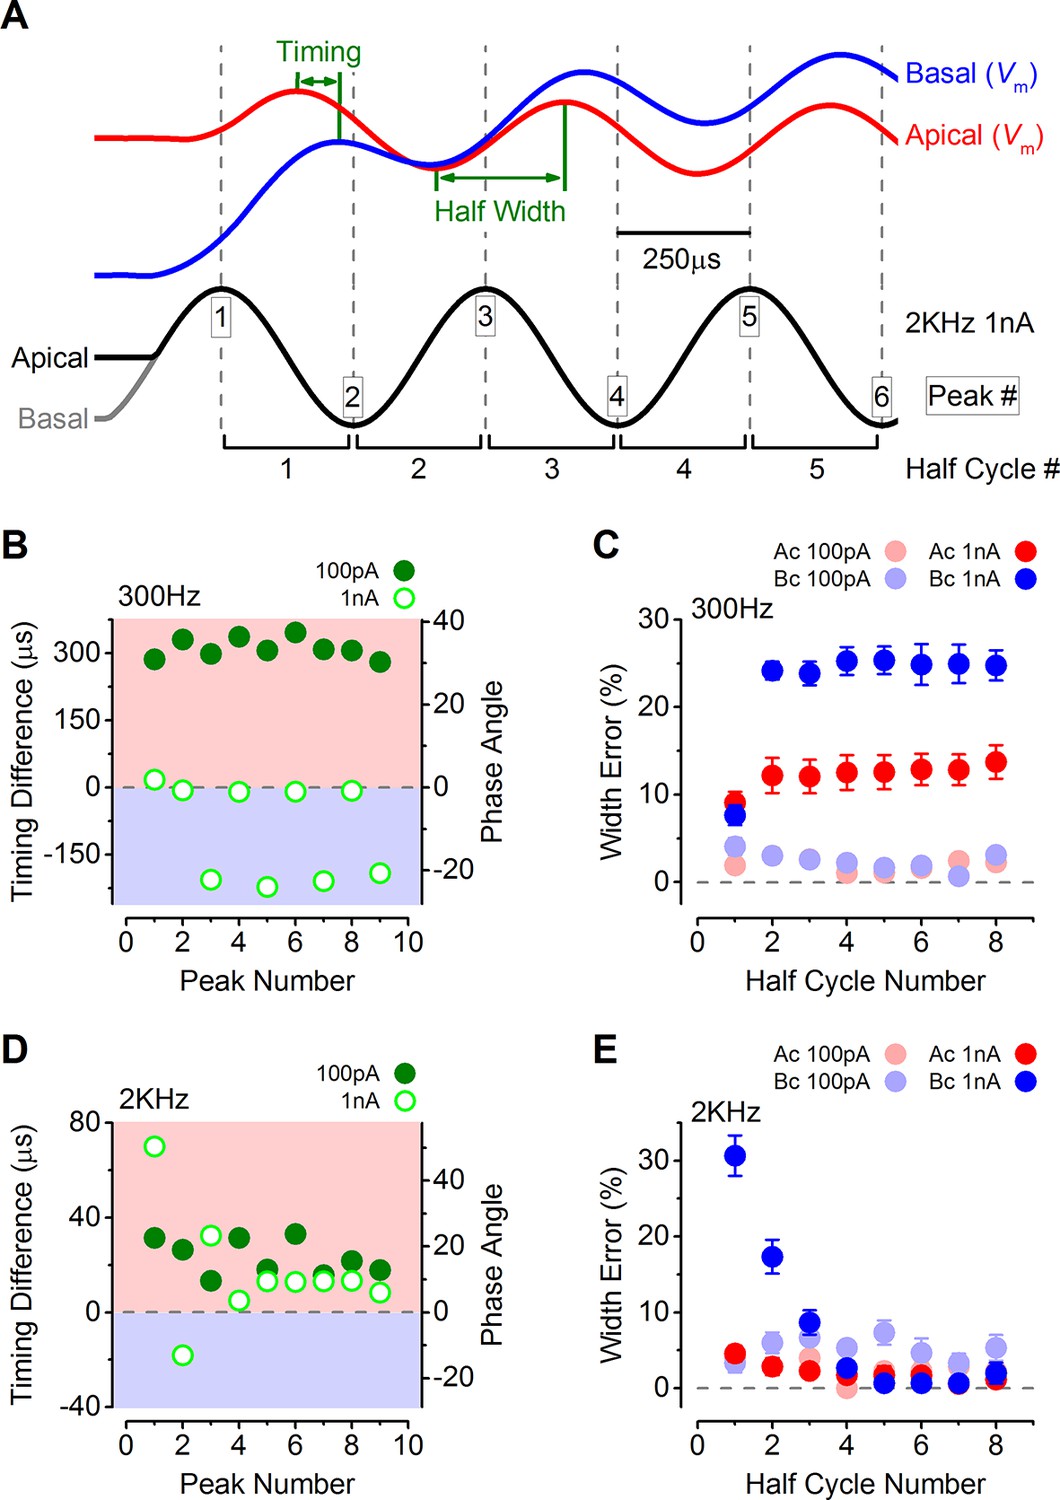
The timing of phasic responses to sound-like stimulation is faster and more accurate in apical inner hair cells (IHCs).
(A) IHC responses to a 1 nA, 2 kHz stimulus showing the relative timing shift between apical and basal cells (above) to the sinewave stimuli (below; apical black and basal grey). Dashed vertical lines delineate each half cycle of the 2 kHz stimulus with the half-cycle number shown. The numbers on the dashed vertical lines indicate the maxima and minima peak number used for subsequent analysis. Note that the responses of apical and basal IHCs are both delayed compared to the stimulus but the corresponding peaks and half cycles can be seen. The difference in timing between apical and basal traces is shown and was measured as the time delay between the occurrences of the equivalent peaks. The half widths were measured as the time between maximal and minimal peaks for each response half cycle. (B) The average timing difference between the arrival of the different peaks between apical and basal responses for 300 Hz stimuli (the symbols represent two stimulus amplitudes). Data points were obtained by subtracting the average apical value from that of basal cells. Therefore positive values (light red area) indicate an apical lead whereas negative values (light blue area) indicate a basal lead. The right-hand scale shows the corresponding shift in phase angle for the equivalent timing differences, calculated based on the size of the time difference and the stimulus frequency. (C) Average half-cycle width errors for apical and basal responses to 300 Hz stimuli of different amplitudes. Errors were calculated for each cell as the width of each half cycle in milliseconds divided by the actual half-cycle width of the stimulus (1.67 ms for 300 Hz) and converted to percentage. (D and E) Timing differences and half width errors, respectively, calculated as in (B) and (C) but for 2 kHz stimuli (half-cycle width of 0.25 ms).
Figure 9
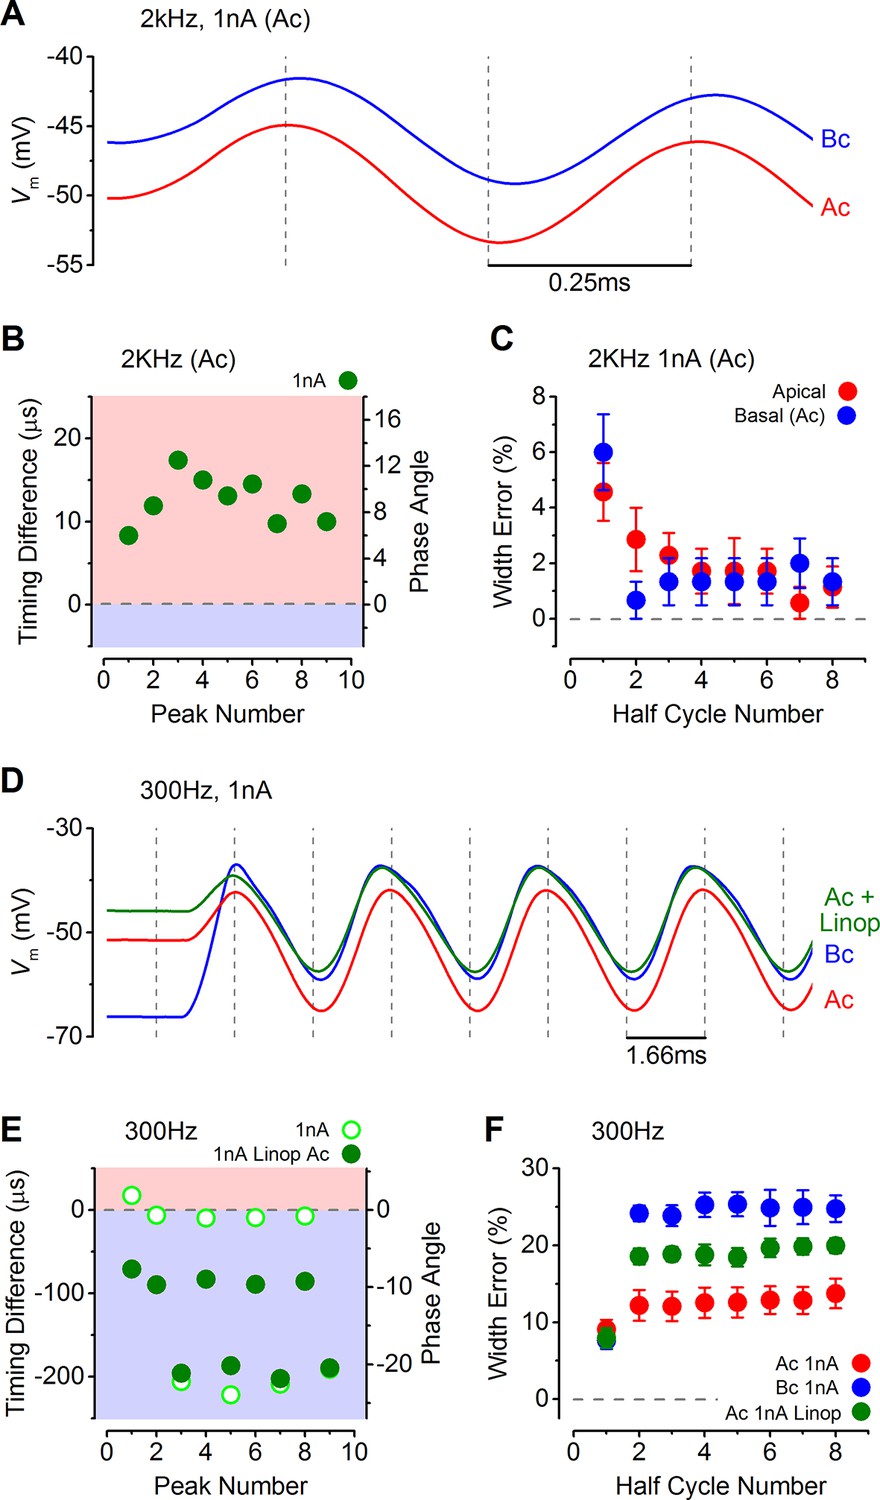
Response timing is determined by the intrinsic membrane properties of apical and basal inner hair cells (IHCs).
(A) Average voltage responses of apical (n = 7) and basal (n = 6) IHCs to a 2 kHz 1 nA current sinewave using a stimulus with a holding current of 500 pA for both apical and basal IHCs. The dashed vertical lines are spaced to the 2 kHz half cycle and aligned to the initial apical peak. Even though both IHC types were stimulated with the same protocol, basal cells maintained a delayed response compared to apical cells. (B) The average timing difference between the arrival of the different peaks between apical and basal voltage responses shown in (A). Data points were obtained by subtracting the average apical value from that of basal cells (as in Figure 8B). All positive values indicate an apical lead. (C) Average half width errors, calculated as in Figure 8C, for the apical and basal voltage responses in A. Blocking IK,n in apical IHCs makes their response timing and accuracy more basal-like. (D) Average voltage responses of apical IHCs in the presence of 80 µM linopirdine (Ac+Linop, n = 6) to a 1 nA, 300 Hz current sinewave using a holding current of 500 pA for apical cells. Voltage responses in apical (Ac) and basal (Bc) IHCs are as in Figure 7B (holding current of 500 pA for apical and 50 pA for basal cells). The dashed vertical lines are spaced to the 300 Hz half cycle and aligned to the initial apical peak (red trace). Note that when IK,n in apical cells was blocked by linopirdine their responses closely resembled those from basal cells with a similar leftward lean in the upper peaks following the initial one. Between –65 mV and –20 mV the IK,n represents a large component only in apical cells (Figure 3D and E and Figure 4E). (E) The average timing difference between the arrival of the different peaks between the voltage responses of apical and either basal or apical in linopirdine, shown in (D). (F) Average half width errors for the apical, apical in linopirdine and basal voltage responses in (D). The error values for apical cells in linopirdine were shifted towards those from basal values.
Figure 10
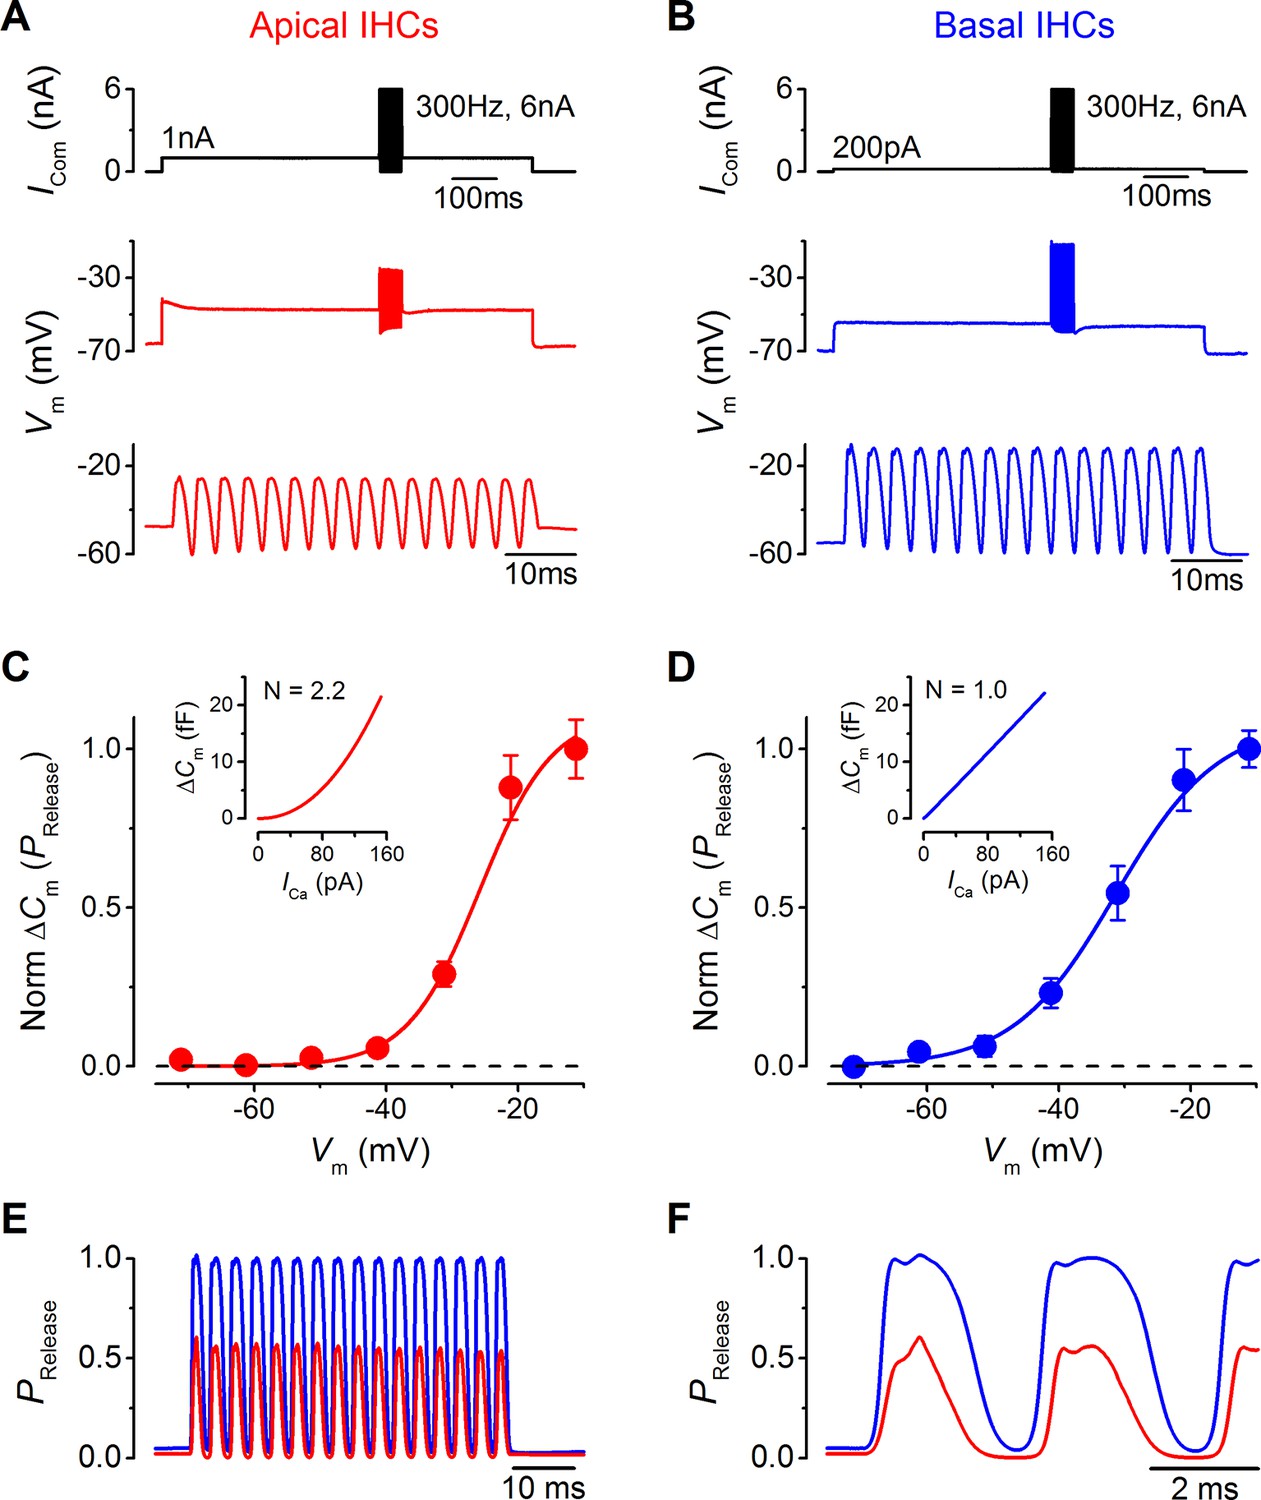
Maximal sound-like stimulation of apical and basal gerbil inner hair cells (IHCs) and predicted synaptic vesicle release probability suit phase-locking in apical cells.
(A and B) Current clamp protocols (top panels) applied to apical (A) and basal (B) IHCs as in Figure 6 but the holding currents and sinewave amplitudes have been increased to account for the contribution of the endocochlear potential (see Results). Average voltage responses from apical (n = 4) and basal (n = 3) IHCs are shown below with the sinewave region amplified in the lower panels. (C and D) Normalized average △Cm values plotted against membrane potential for apical (A) and basal (B) gerbil IHCs obtained from the synaptic transfer functions shown in the insets (from Johnson et al., 2008). The normalized △Cm approximates to a vesicle release probability (PRelease) and data points were fit with a Boltzmann curve with values of: apical IHCs Vhalf –25.8 mV and S 5.5 mV-1; basal IHCs Vhalf –31.4 mV and S 7.7 mV-1. (E) The average IHC voltage responses to maximal sound-like stimulation in (A) and (B) were transformed into PRelease using the functions shown in (C) and (D) for apical and basal cells, respectively. (F) Same traces as in (E) but on an expanded time scale to emphasize the cycle-by-cycle differences in PRelease between apical and basal cells, showing pronounced ‘on’ and ‘off’ responses to positive and negative phases of the sinusoidal currents, respectively.
Download links
A two-part list of links to download the article, or parts of the article, in various formats.
Downloads (link to download the article as PDF)
Open citations (links to open the citations from this article in various online reference manager services)
Cite this article (links to download the citations from this article in formats compatible with various reference manager tools)
Membrane properties specialize mammalian inner hair cells for frequency or intensity encoding
eLife 4:e08177.
https://doi.org/10.7554/eLife.08177


