Central neural circuitry mediating courtship song perception in male Drosophila
- Janelia Research Campus, Howard Hughes Medical Institute, United States
- Cold Spring Harbor Laboratory, United States
Figures
Figure 1

Intersectional labeling of auditory neurons.
(A) Intersectional labeling of male aPN1 neurons using three independent GAL4 lines shown registered onto a standard brain (R21B12-GAL4 in green, R22B11-GAL4 in magenta, and R49F09-GAL4 in yellow). White region is a result of overlapping between different color channels. (B) Intersectional labeling of male ventrolateral protocerebrum Projection Neuron 1 (vPN1) neurons using R72E10-GAL4 (green) and R46F09-GAL4 (magenta). (C) Co-registration of male aPN1 neurons (green) and vPN1 neurons (magenta) onto the standard brain shows significant overlap in WED. aPN1 and vPN1 neurons are labeled by R49F09-GAL4 ∩ fruLexA and R72E10-GAL4 ∩ fruLexA, respectively. (D–F) aPN1 neurons are present in both male (D) and female (E) brains of LexAop2-FLP/+; fruLexA, UAS>stop>myr::GFP/49F09-GAL4 flies. (F) Merge of (D) and (E). (G–I) vPN1 neurons are present in male (G) but absent in female (H) brains of LexAop2-FLP/+; fruLexA, UAS>stop>myr::GFP/72E10-GAL4 flies. (I) Merge of (G) and (H). (J) Schematic drawing of GAL4/LexA intersection for labeling subsets of fruM+ neurons. FLP expression induced by fruLexA will remove the stop cassette to allow GFP reporter expression only in neurons expressing both fruLexA and the CRM-GAL4. Scale bars, 50 μm. All images were aligned and registered onto a standard brain.
-
Figure 1—source data 1
Quantification of aPN1 or VPN1 neurons labeled by intersectional drivers.
- https://doi.org/10.7554/eLife.08477.004
Figure 2
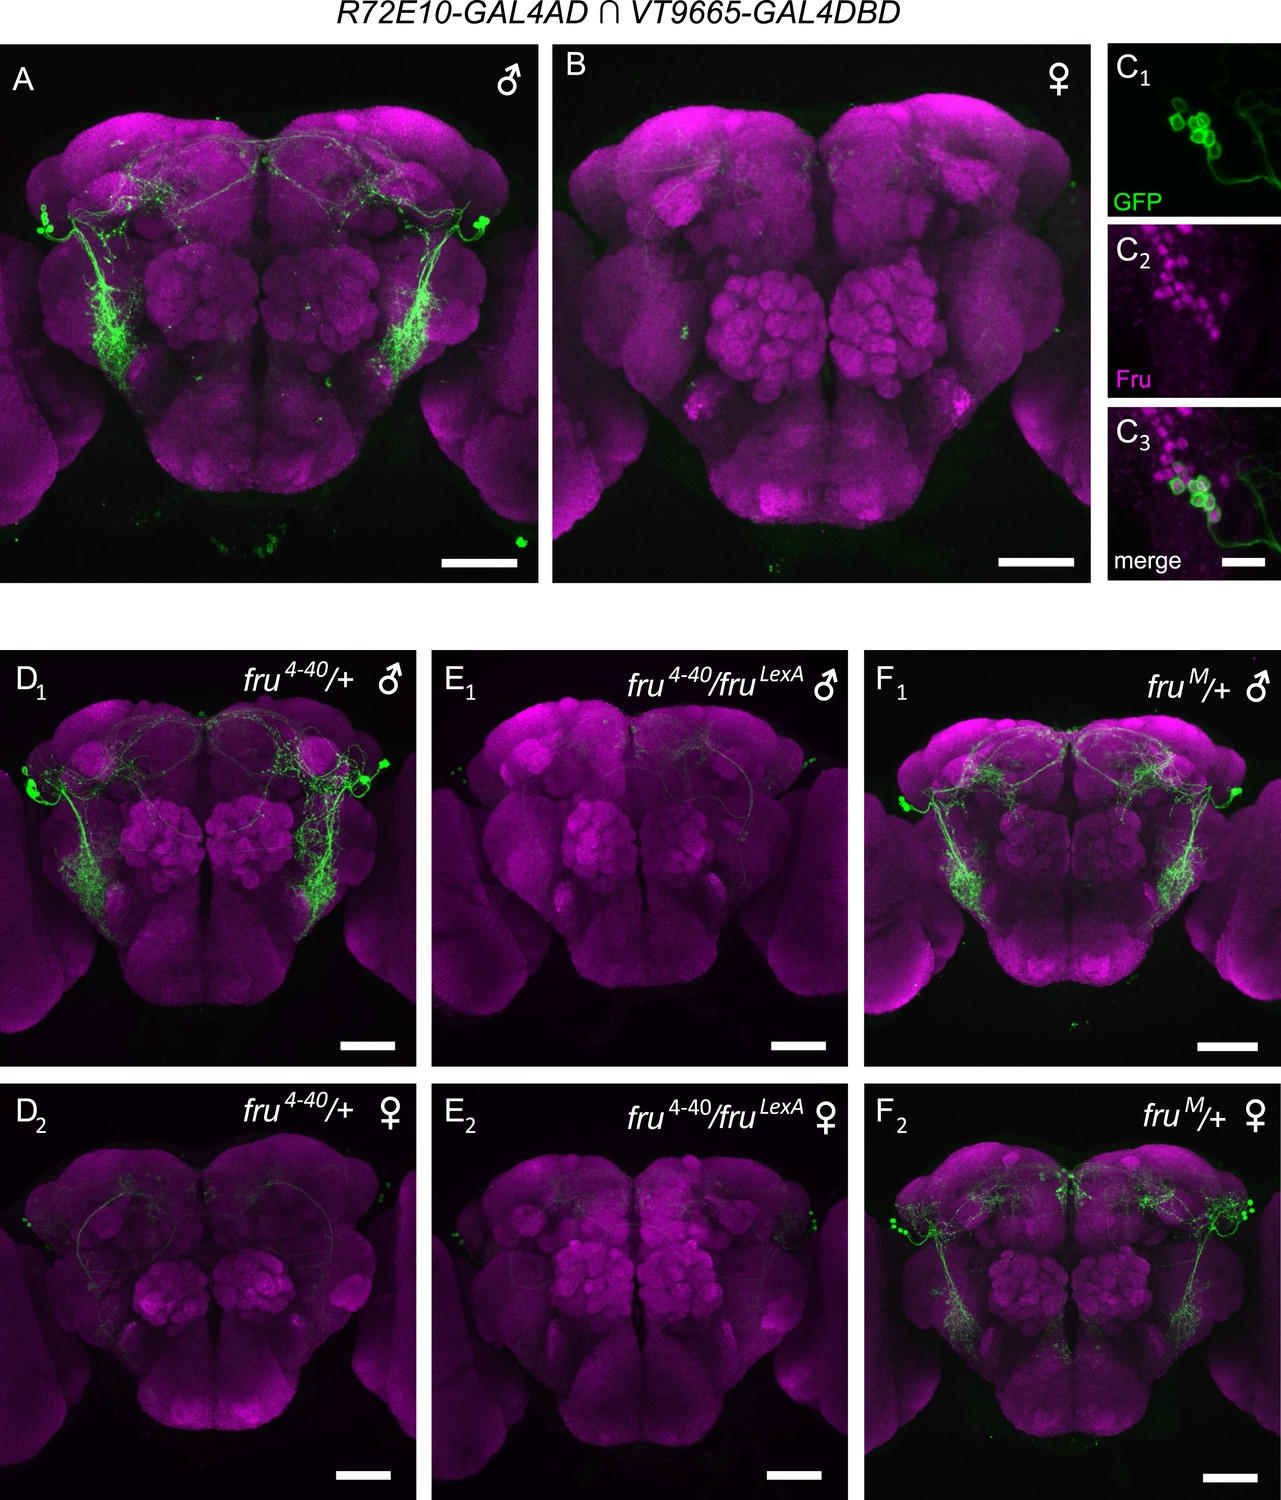
fru is necessary and sufficient for specifying male-specific vPN1 neurons.
(A, B) GFP expression (green) in the male (A) or female (B) brain of R72E10-GAL4AD/UAS-mCD8GFP; VT9665-GAL4DBD/+ flies counter-stained by nc82 antibody (magenta). vPN1 neurons with VLP projections were labeled in the male but not female brain. (C) vPN1 neurons (C1) in the male brain of R72E10-GAL4AD/UAS-mCD8GFP; VT9665-GAL4DBD/+ flies co-stained with FruM antibody (C2). (C3) is a merge of (C1) and (C2). (D) vPN1 neurons are present in the male brain (D1) but not female brain (D2) of fru4–40/+ flies. Genotype is: R72E10-GAL4AD/UAS-mCD8GFP; VT9665-GAL4DBD, fru4–40/+. (E) vPN1 neurons are absent in both the male brain (E1) and female brain (E2) of null mutant fru4–40/fruLexA. Genotype is: R72E10-GAL4AD/UAS-mCD8GFP; VT9665-GAL4DBD, fru4–40/fruLexA. (F) vPN1 neurons are present in both the male brain (F1) and female brain (F2) of fruM mutant flies where FruM is expressed in both males and females. Genotype is: R72E10-GAL4AD/UAS-mCD8GFP; VT9665-GAL4DBD, fruM/+.
Figure 3 with 1 supplement
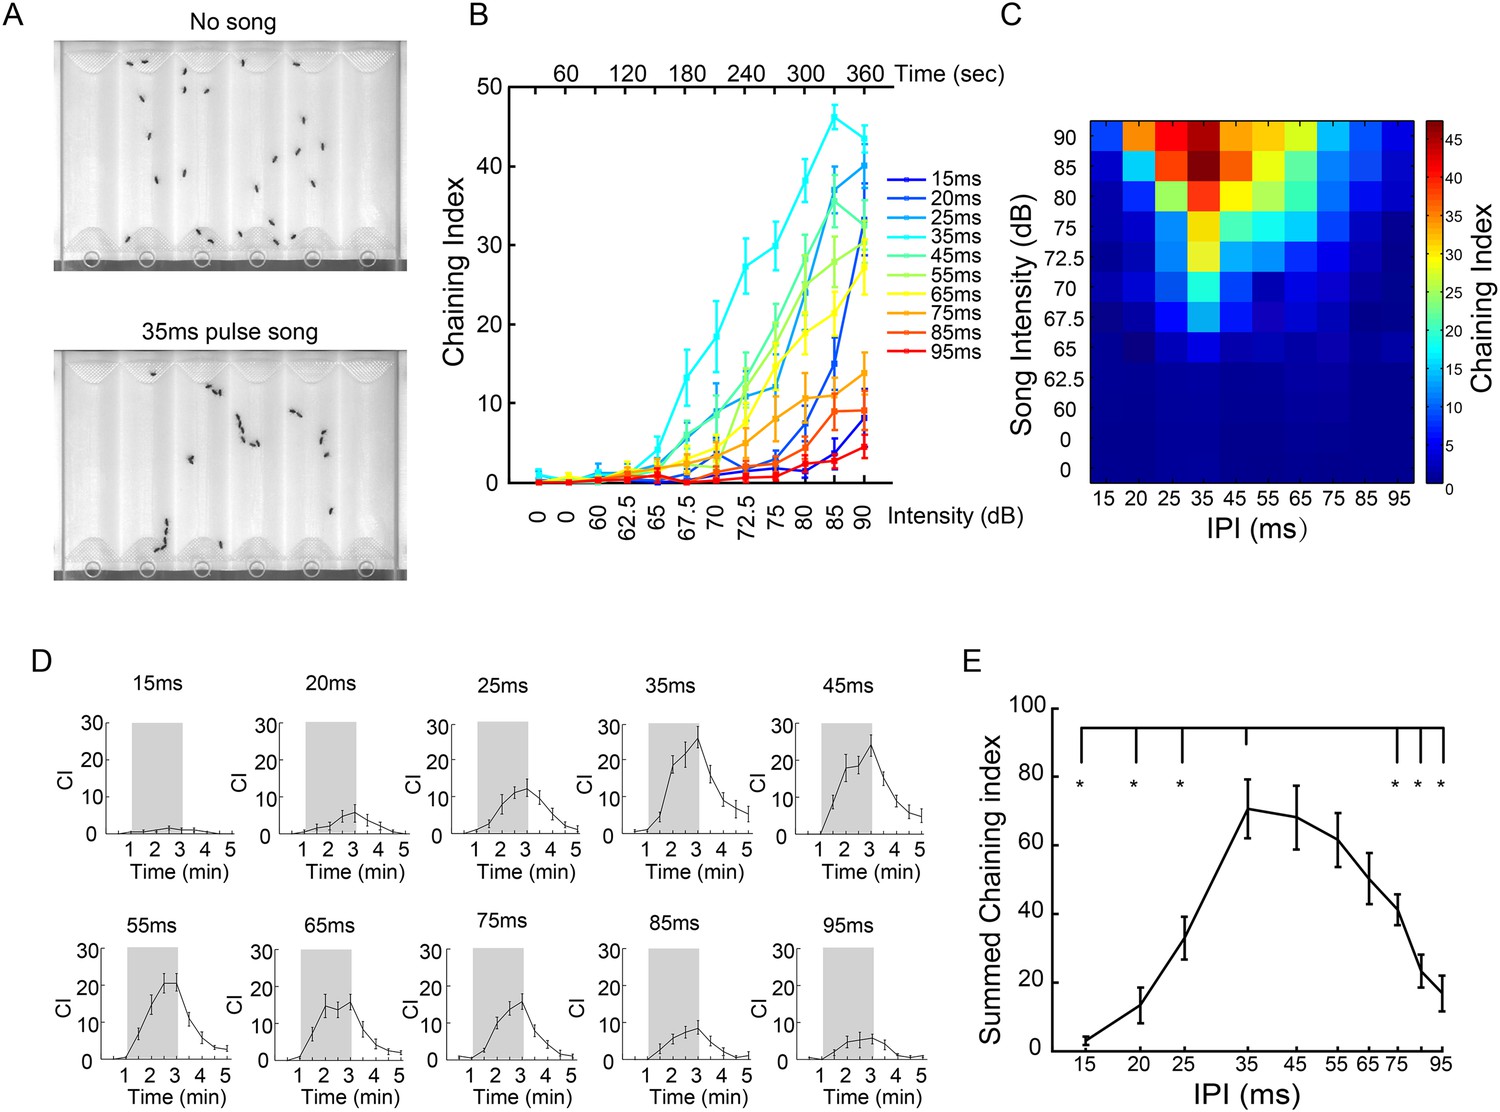
IPI tuning of song-induced male-chaining behavior.
(A) Song-induced chaining assay. Males court each other when exposed to pulse song with a 35-ms inter-pulse interval (IPI) and robustly form courtship chains (bottom). (B) Chaining indices (CIs) of wild-type males in response to different IPIs. After 60 s of silence, continuous pulse songs were played back with a ramping sound intensity from 60 dB to 90 dB. The intensity was increased every 30 s. n = 14 for all groups. Error bars represent SEM. (C) Heat map visualization of chaining responses in (B). Each cell represents the chaining index at a given IPI and song intensity. (D) CIs of wild-type males in response to intermittent pulse songs with different IPIs at 80 dB. A train of 40 pulses was delivered every five seconds so that the number of pulses was the same for different IPIs. After one minute of silence, two minutes of intermittent pulse song stimuli were presented (indicated by shadowed box), and then followed by two minutes of silence. Chaining persisted and gradually decreased after song presentation. n = 15 for all groups. (E) CIs during the song presentation period in (D) were summed up and plotted as a function of IPIs. Error bars represent SEM. *p < 0.05 when chaining responses at 35-ms IPI were compared to those at 15-, 20-, 25-, 75-, 85-, and 95-ms IPIs (Wilcoxon rank-sum test).
Figure 3—figure supplement 1

Song-induced chaining setup.
(A–C) Schematic drawing of chaining chamber design. A 30° sloped wall was made to reduce the probability that flies occlude each other. Flies were introduced through the holes in the slipping acrylic cover on the top of the chamber. (D–F) The chaining chamber was assembled and mounted on an acrylic holder, which was placed at the side of an external speaker. Front light was delivered by two regular fluorescent bulbs from the top.
Figure 4
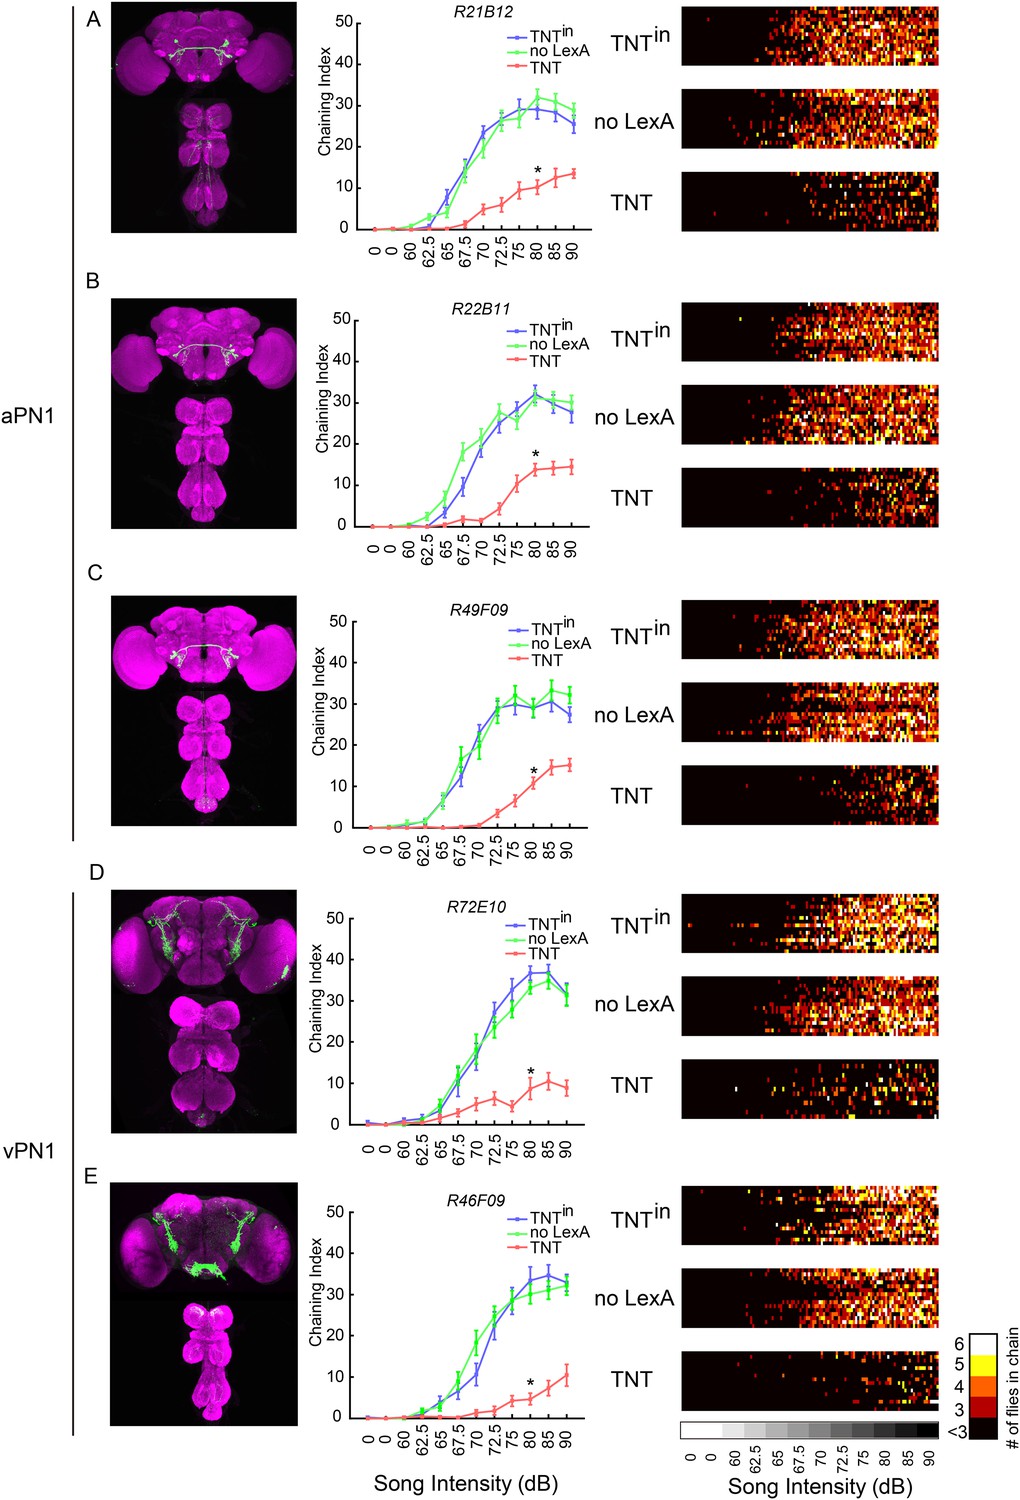
Inactivation of second- and third-order auditory neurons reduced chaining responses to pulse song.
(A–C) Silencing aPN1 neurons decreased song-induced chaining responses. aPN1 drivers R21B12-GAL4 (A), R22B11-GAL4 (B), or R49F09-GAL4 (C) were crossed to UAS>stop>TNT; fruLexA, LexAop2-FLP (TNT group), UAS>stop>TNTin; fruLexA, LexAop2-FLP (TNTin group), or UAS>stop>TNT; LexAop2-FLP (no LexA group). (D, E) Silencing vPN1 neurons decreased song-induced chaining responses. vPN1 drivers R72E10-GAL4 (D), R46F09-GAL4 (E) were crossed to UAS>stop>TNT; fruLexA, LexAop2-FLP (TNT group), UAS>stop>TNTin; fruLexA, LexAop2-FLP (TNTin group), or UAS>stop>TNT; LexAop2-FLP (no LexA group). n = 13–16 for each condition. *p < 0.0001 compared to both controls at 80 dB, Wilcoxon rank-sum test. Shown in the left panel is GFP expression of each intersectional driver. In the right panel, a heat map summary shows chaining intensities across the testing time course. Each row corresponds to a group of six flies. Colors represent the number of flies in chain.
Figure 5 with 1 supplement
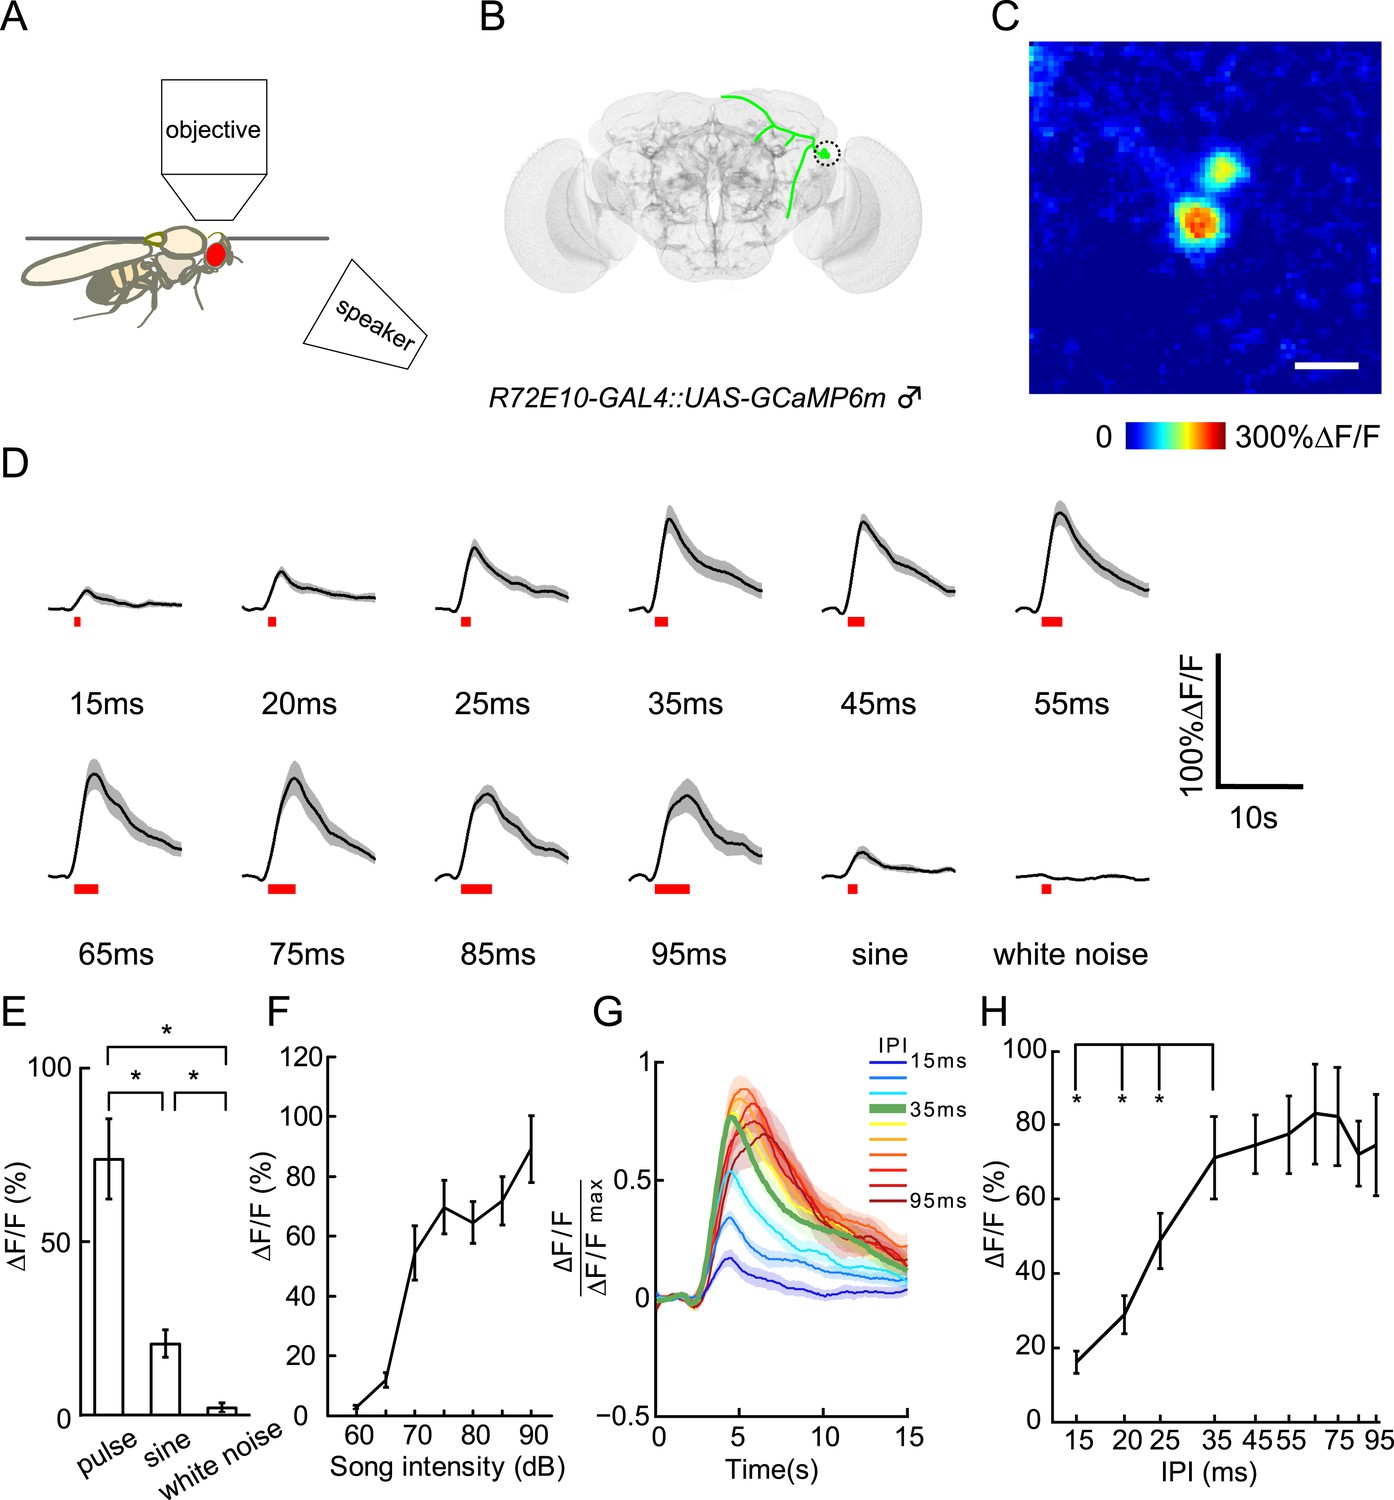
Calcium responses of vPN1 neurons to courtship song.
(A) Diagram of imaging setup in which a speaker was located 20-cm away from the recorded male fly. (B) Diagram of vPN1 neurons labeled with R72E10-GAL4 driving expression of GCaMP6. Cell bodies are circled. (C) Calcium imaging of R72E10-GAL4 driven GCaMP6 expression in vPN1 cell bodies. Heat map of a sample frame shows ∆F/F changes in two vPN1 cell bodies. Scale bar, 10 μm. (D) Calcium responses of vPN1 neurons to a train of 40 pulses at different IPIs, sine song, and white noise at 80 dB. Black lines represent means. Gray envelopes indicate SEM. Song stimulus durations are indicated as red bars below. (E) Peak ∆F/F changes of vPN1 neurons stimulated with pulse song (35-ms IPI, 40 pulses), sine song (140 Hz, 1.4 s), and white noise (1.4 s) at 80 dB. *p < 0.01, Wilcoxon rank-sum test. n = 10 for all the groups. (F) Peak ∆F/F of vPN1 neurons in response to pulse song (35-ms IPI, 40 pulses) at different sound intensities. n = 14 trials for each sound level. (G) Normalized calcium traces of vPN1 neurons at different IPIs. Each ∆F/F was normalized by the maximum ∆F/F. (H) Peak ∆F/F of vPN1 neurons in response to different IPIs at 80 dB (40 pulses). n = 10 for all groups. *p < 0.01, Wilcoxon signed-rank test.
Figure 5—figure supplement 1
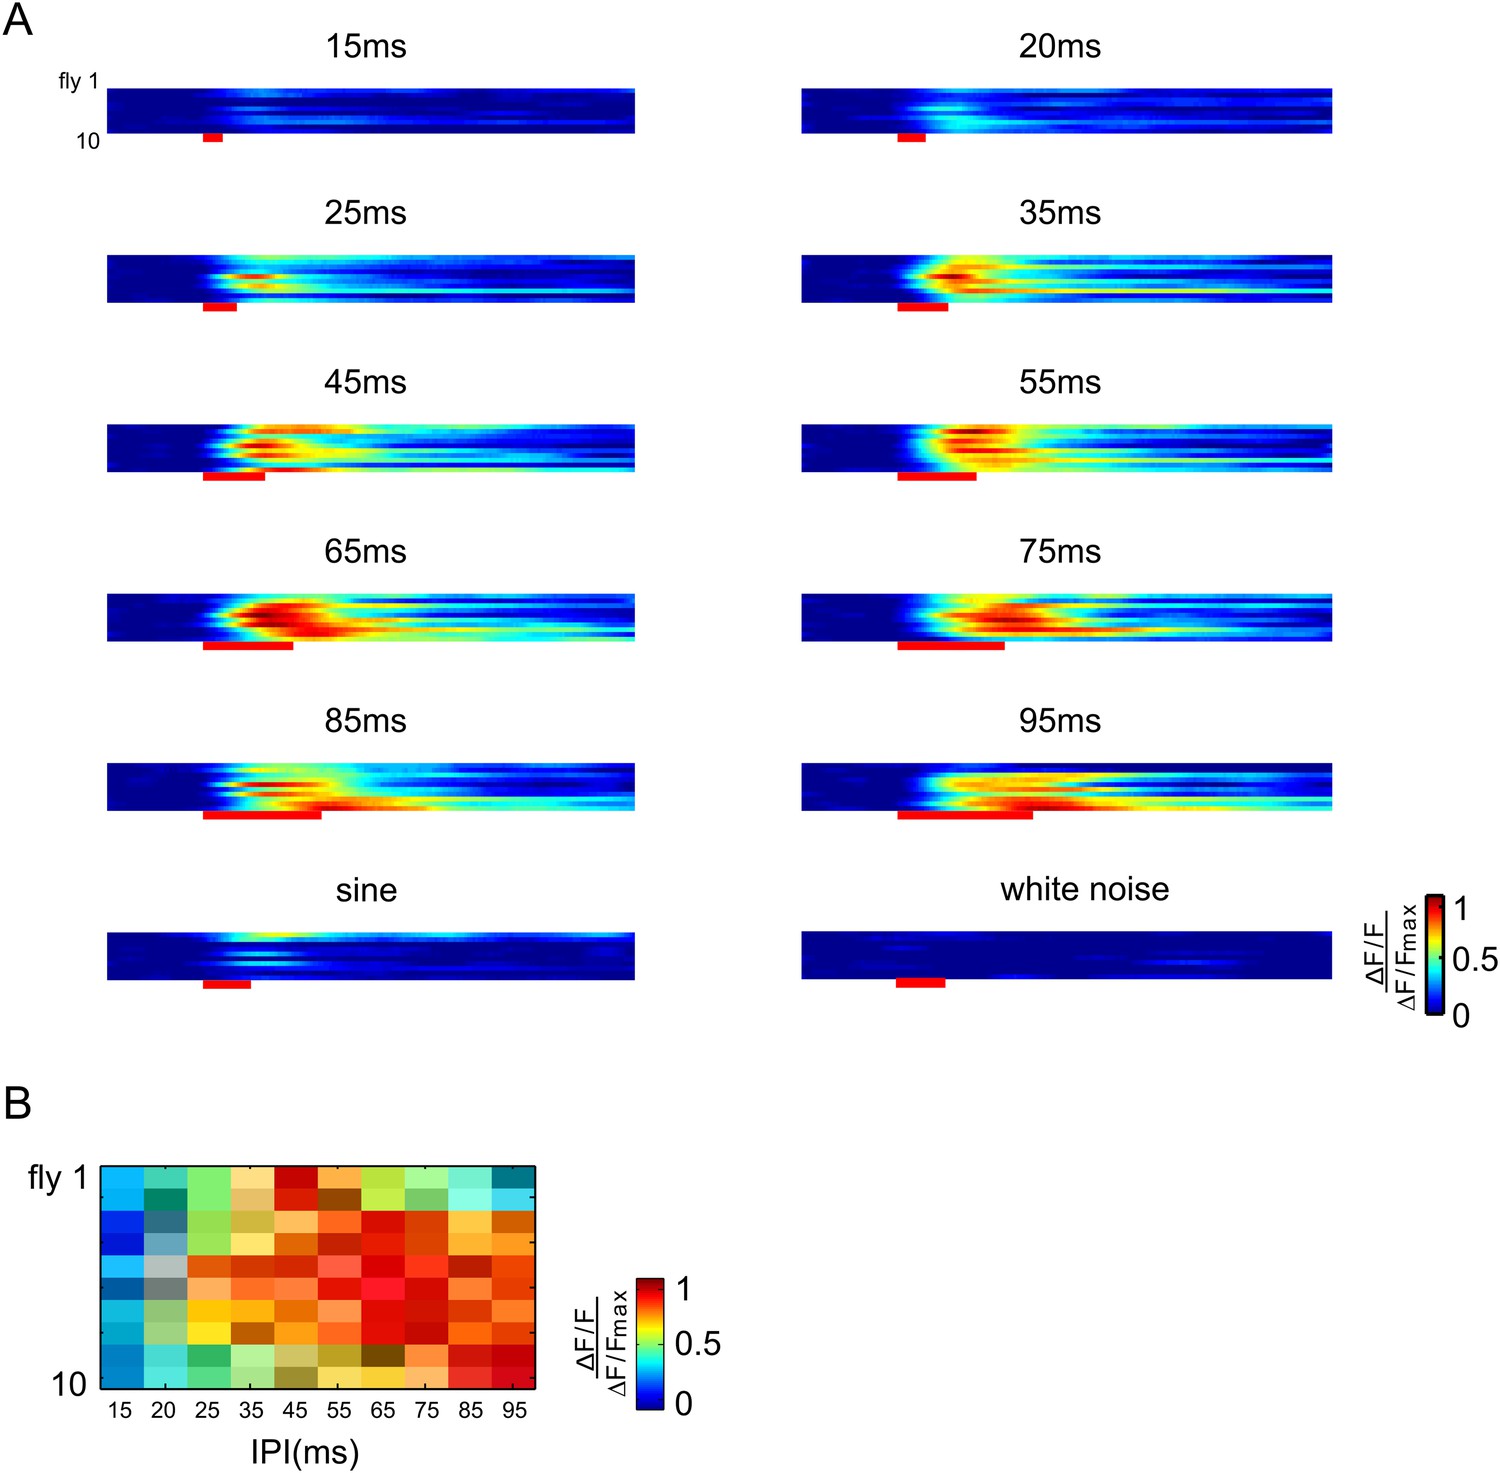
Raster plots of vPN1 neurons in individual flies.
(A) Raster plots of ∆F/F during presentation of different song stimuli. Each row represents calcium responses from one male fly. (B) Raster plots of peak ∆F/F during presentation of different song stimuli. Each row represents calcium responses from one male fly while each column represents a different IPI. All the responses from an individual fly are normalized by the maximum response from that fly.
Figure 6 with 3 supplements
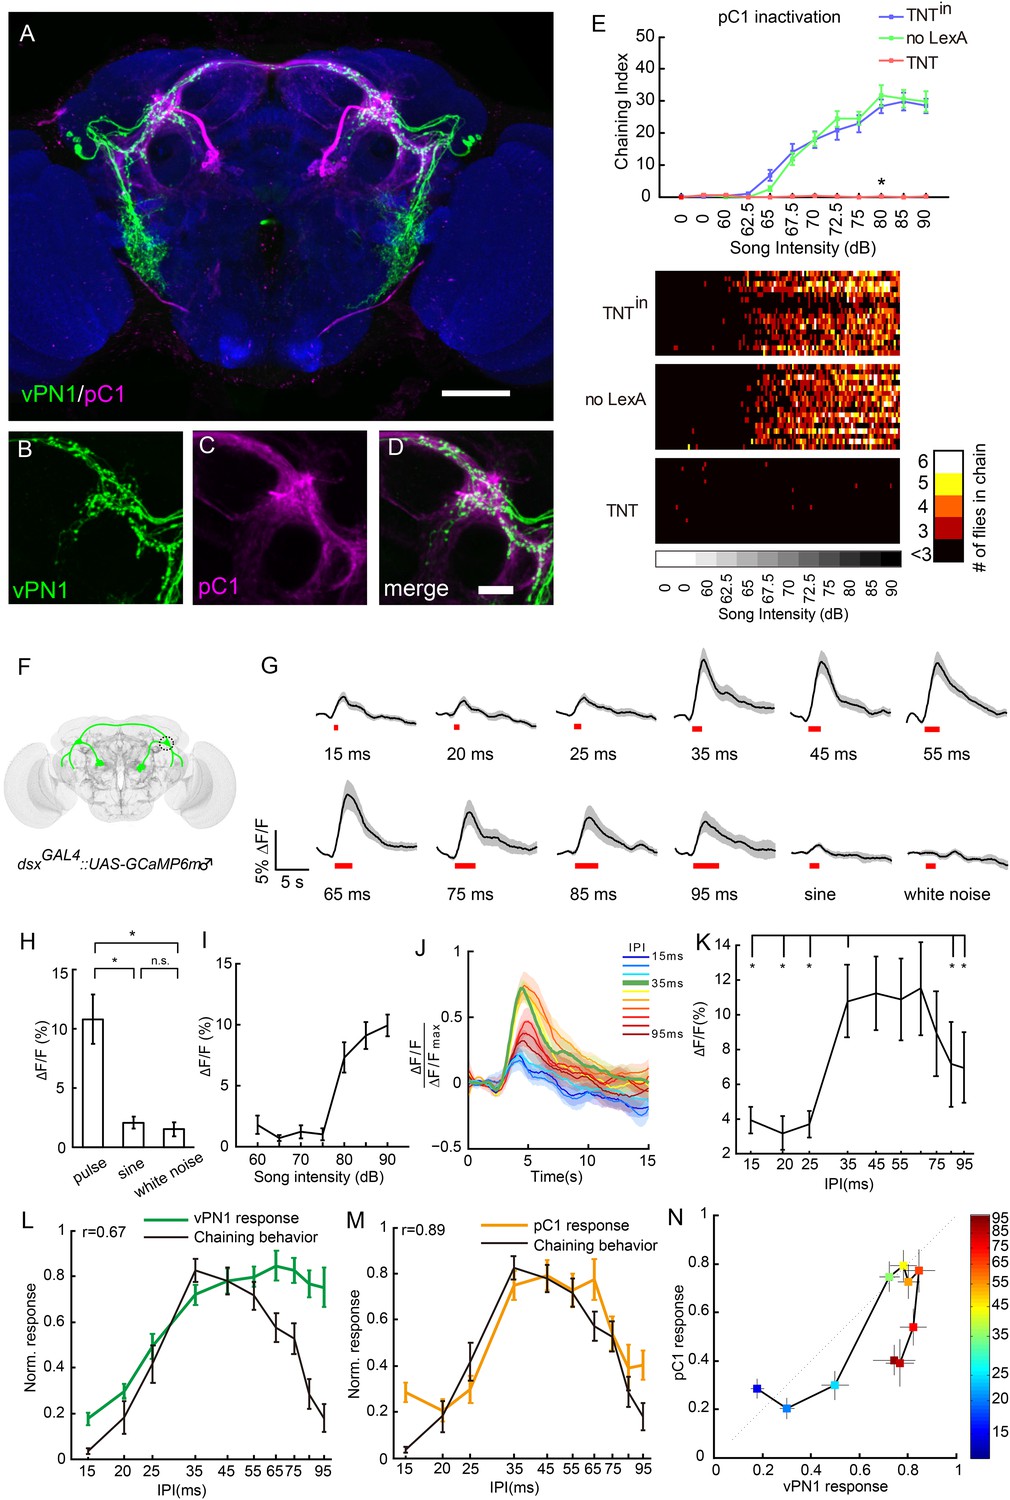
Anatomical, behavioral, and physiological characterization of dsx+ pC1 neurons in auditory sensation.
(A–D) Co-registration of vPN1(green) and pC1(magenta) neurons onto the standard brain. Genotype for labeling vPN1 neurons: LexAop2-FLP/+; fruLexA, UAS>stop>myr::GFP/R72E10-GAL4. Genotype for labeling vPN1 neurons: R71G01-LexA/UAS>stop>myr::GFP; dsxGAL4, LexAop2-FLP/+. vPN1 processes (B) and pC1 (C) processes overlap in the region of lateral protocerebral complex (LPC). (D) Merge of (B) and (C). Scale bars, (A) 100 μm and (D) 20 μm. (E) Song-induced chaining response was impaired by inactivation of pC1 neurons. Genotypes: UAS>stop>TNTin/71G01-LexA; dsxGAL4, LexAop2-FLP/+ (TNTin), UAS>stop>TNT/+; dsxGAL4, LexAop2-FLP/+ (no LexA), UAS>stop>TNT/71G01-LexA; dsxGAL4, LexAop2-FLP/+ (TNT). n = 16 for all the conditions. *p < 0.0001 when comparing TNT group to both controls at 80 dB, Wilcoxon rank-sum test. Bottom, heat map analysis of chaining events for individual groups of flies. (F) Diagram of pC1 neurons labeled with dsxGAL4 driving expression of GCaMP6. Neurites innervating the LPC are circled. (G) Calcium responses of pC1 neurons responding to different IPIs, sine song, and white noise at 80 dB. Pulse song stimuli consist of a train of 40 pulses. Black lines indicate mean values, while gray areas indicate SEM. Song stimulus durations are indicated as red bars. (H) Peak ∆F/F values of pC1 neurons stimulated with pulse song (35-ms IPI, 40 pulses), sine song (140 Hz, 1.4 s), and white noise (1.4 s) at 80 dB. *p < 0.01, Wilcoxon rank-sum test. No significance was observed for sine vs white noise. n = 12 for all the groups. (I) Peak ∆F/F values of pC1 neurons stimulated with pulse song (35-ms IPI, 40 pulses) from 60 dB to 90 dB. pC1 neurons are only sensitive to pulse song stimuli above 80 dB. n = 9 trials for each sound level. (J) Normalized calcium traces of pC1 neurons at different IPIs. Each ∆F/F was normalized by the maximum ∆F/F. (K) Peak ∆F/F of pC1 neurons stimulated with different IPIs at 80 dB (40 pulses). n = 12 for all groups. *p < 0.01, Wilcoxon signed-rank test. (L) Comparison between the calcium response (peak ∆F/F) of vPN1 neurons and chaining responses to different IPIs shown in Figure 3E (R = 0.67; p < 0.017, permutation test). Both calcium responses and chaining responses are normalized to their respective maximum responses. (M) Comparison between the calcium response (peak ∆F/F) of pC1 neurons and chaining responses to different IPIs shown in Figure 3E (R = 0.89; p < 0.001, permutation test). Both calcium responses and chaining responses are normalized to their respective maximum responses. (N) Comparison between normalized vPN1 responses and pC1 responses. Each colored square represents a different IPI indicated by the heat map. Error bars represent SEM in all panels.
Figure 6—figure supplement 1

Raster plots of pC1 neurons in individual flies.
(A) Raster plots of ∆F/F during presentation of different song stimuli. Each row represents calcium responses from one male fly. (B) Raster plots of peak ∆F/F during presentation of different song stimuli. Each row represents calcium responses from one male fly while each column represents a different IPI. All the responses from an individual fly are normalized by the maximum response from that fly.
Figure 6—figure supplement 2
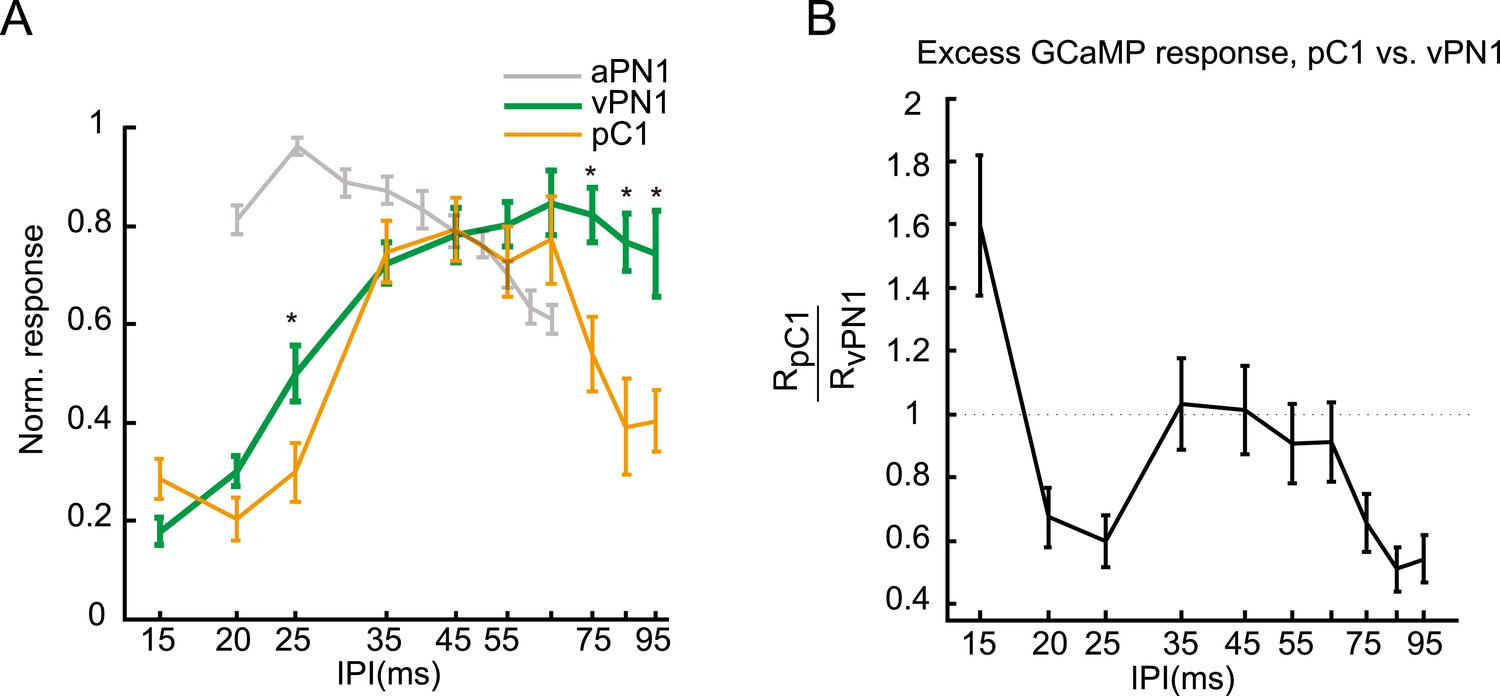
Transfer function between vPN1 and pC1 responses to IPIs of the pulse song.
(A) Normalized peak ∆F/Fs for the calcium responses of vPN1 (green) and pC1 (yellow) neurons to different IPIs. The tuning curve of aPN1 neurons (gray) is reported previously (Vaughan et al., 2014) and superimposed for comparison. *p < 0.05 between vPN1 and pC1 responses, One-sided Wilcoxon rank-sum test. (B) A transfer function was calculated by dividing pC1 responses by vPN1 responses. This transfer function resembles a band-pass filter. The SEM of the transfer function was estimated using standard error propagation.
Figure 6—figure supplement 3

Comparison of synthetic courtship song and natural courtship song with a particle-velocity microphone.
(A) Synthetic pulse song (top) and sine song (bottom) measured by a particle-velocity microphone. Pulse song train at 80 dB sound pressure level corresponds to particle velocity of ∼2 mm/s, while sine song at 80 dB corresponds to ∼0.35 mm/s. (B) Natural courtship song recorded by a particle-velocity microphone located ∼2 mm above a pair of male and female Canton S flies. Pulse songs from a courting male can reach up to ∼7.5 mm/s, and sine songs can reach up to ∼1 mm/s in this setup.
Figure 7
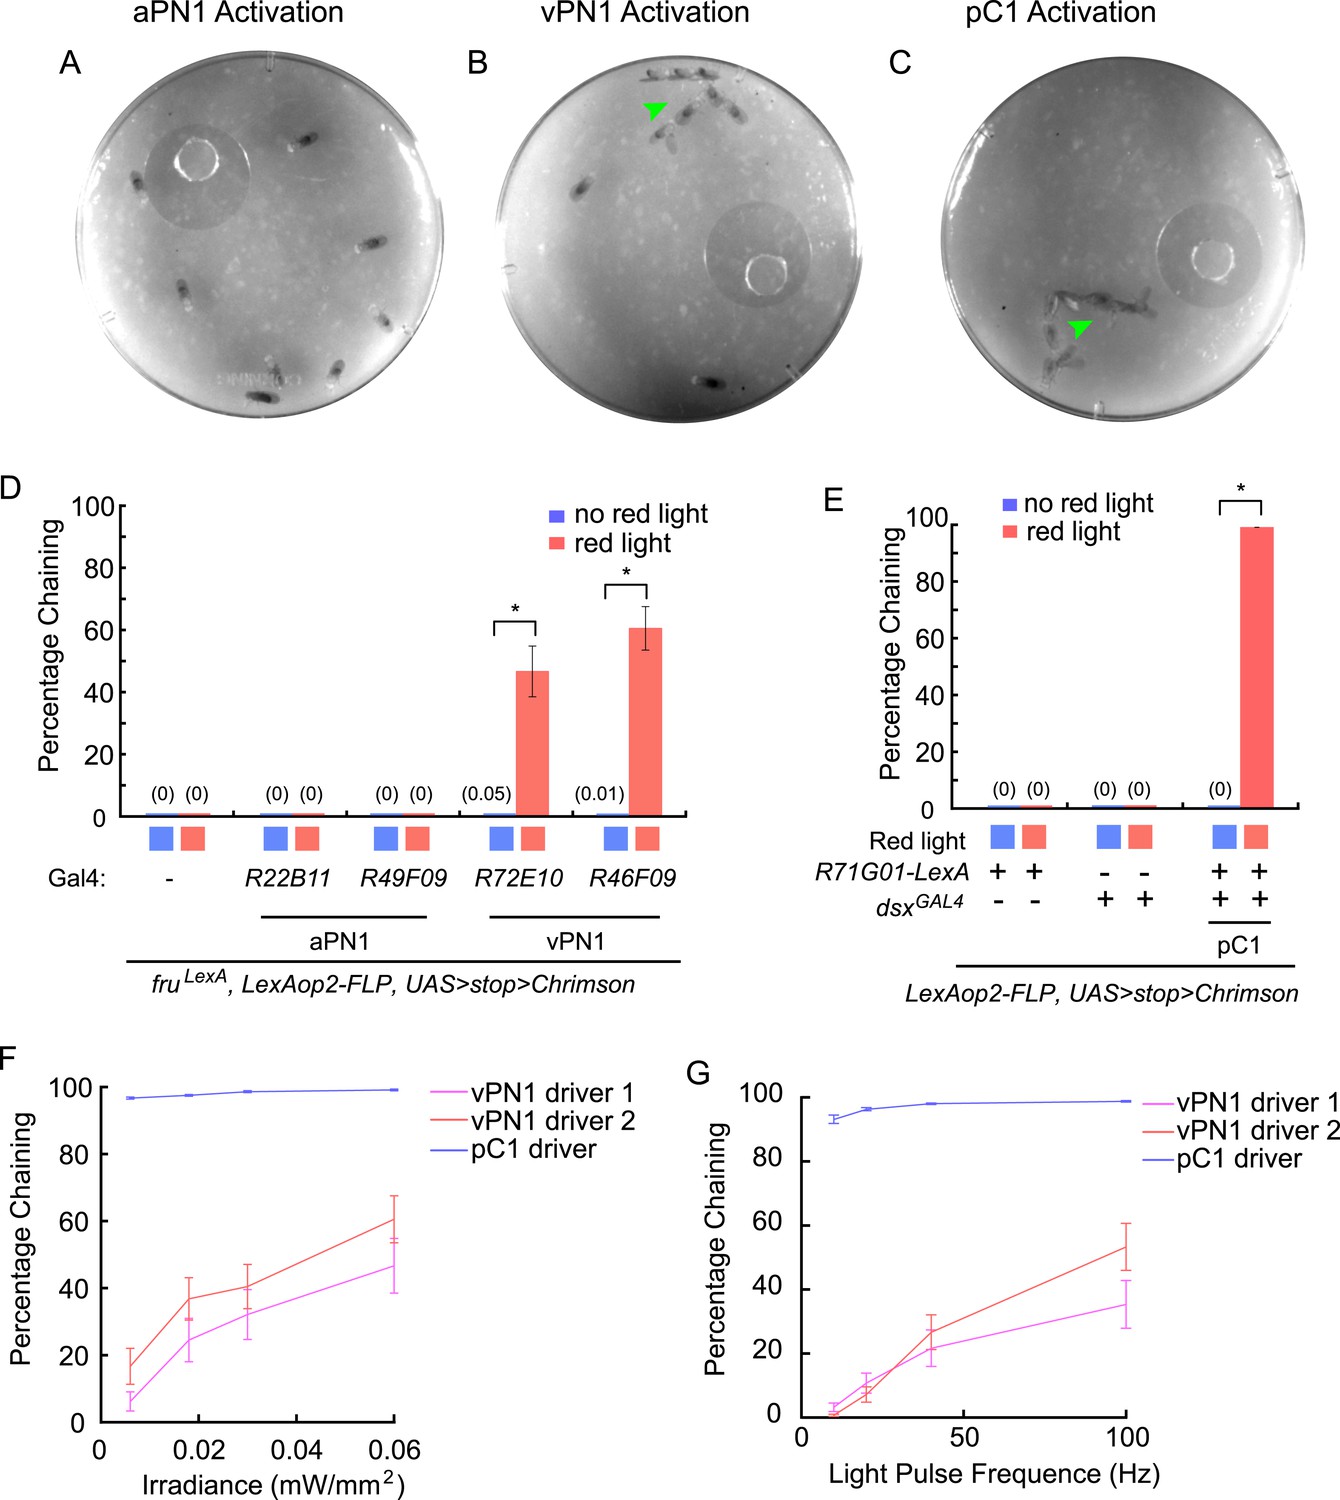
Optogenetic activation of auditory neurons.
(A–C) Optogenetic activation of vPN1 neurons (B) or pC1 neurons (C) induced male chaining, as evidenced by males courting each other on food (green arrow head), while activation of aPN1 neurons did not (A). CsChrimson activation was achieved with constant 655-nm light (0.06 mW/mm2). R22B11-GAL4 ∩ fruLexA, R72E10-GAL4 ∩ fruLexA, or R71G01-LexA ∩ dsxGAL4 was used to drive CsChrimson expression in aPN1 (A), vPN1 (B), or pC1 (C). (D) Male-chaining behavior was induced by CsChrimson-mediated activation of vPN1 neurons but not aPN1 neurons. *p < 0.0001 (Student's t-test). n = 14–18 for all the genotypes. (E) Male-chaining behavior was induced by CsChrimson-mediated activation of pC1 neurons. *p < 0.0001 (Student's t-test). n = 16–18 for all the genotypes. (F, G) Male-chaining behavior induced by CsChrimson-mediated activation of either vPN1 or pC1 neurons when stimulated with constant red light at 0.006, 0.018, 0.03, 0.06 mW/mm2 (F) or stimulated with 5-ms light pulses at 10, 25, 50, and 100 Hz (G). vPN1 driver 1 is R72E10-GAL4 ∩ fruLexA; vPN1 driver 2 is R46F09-GAL4 ∩ fruLexA, pC1 driver is R71G01-LexA ∩ dsxGAL4. n = 16–28 for all the genotypes.
Figure 8 with 1 supplement
Directionality and functional connectivity of the auditory pathway.
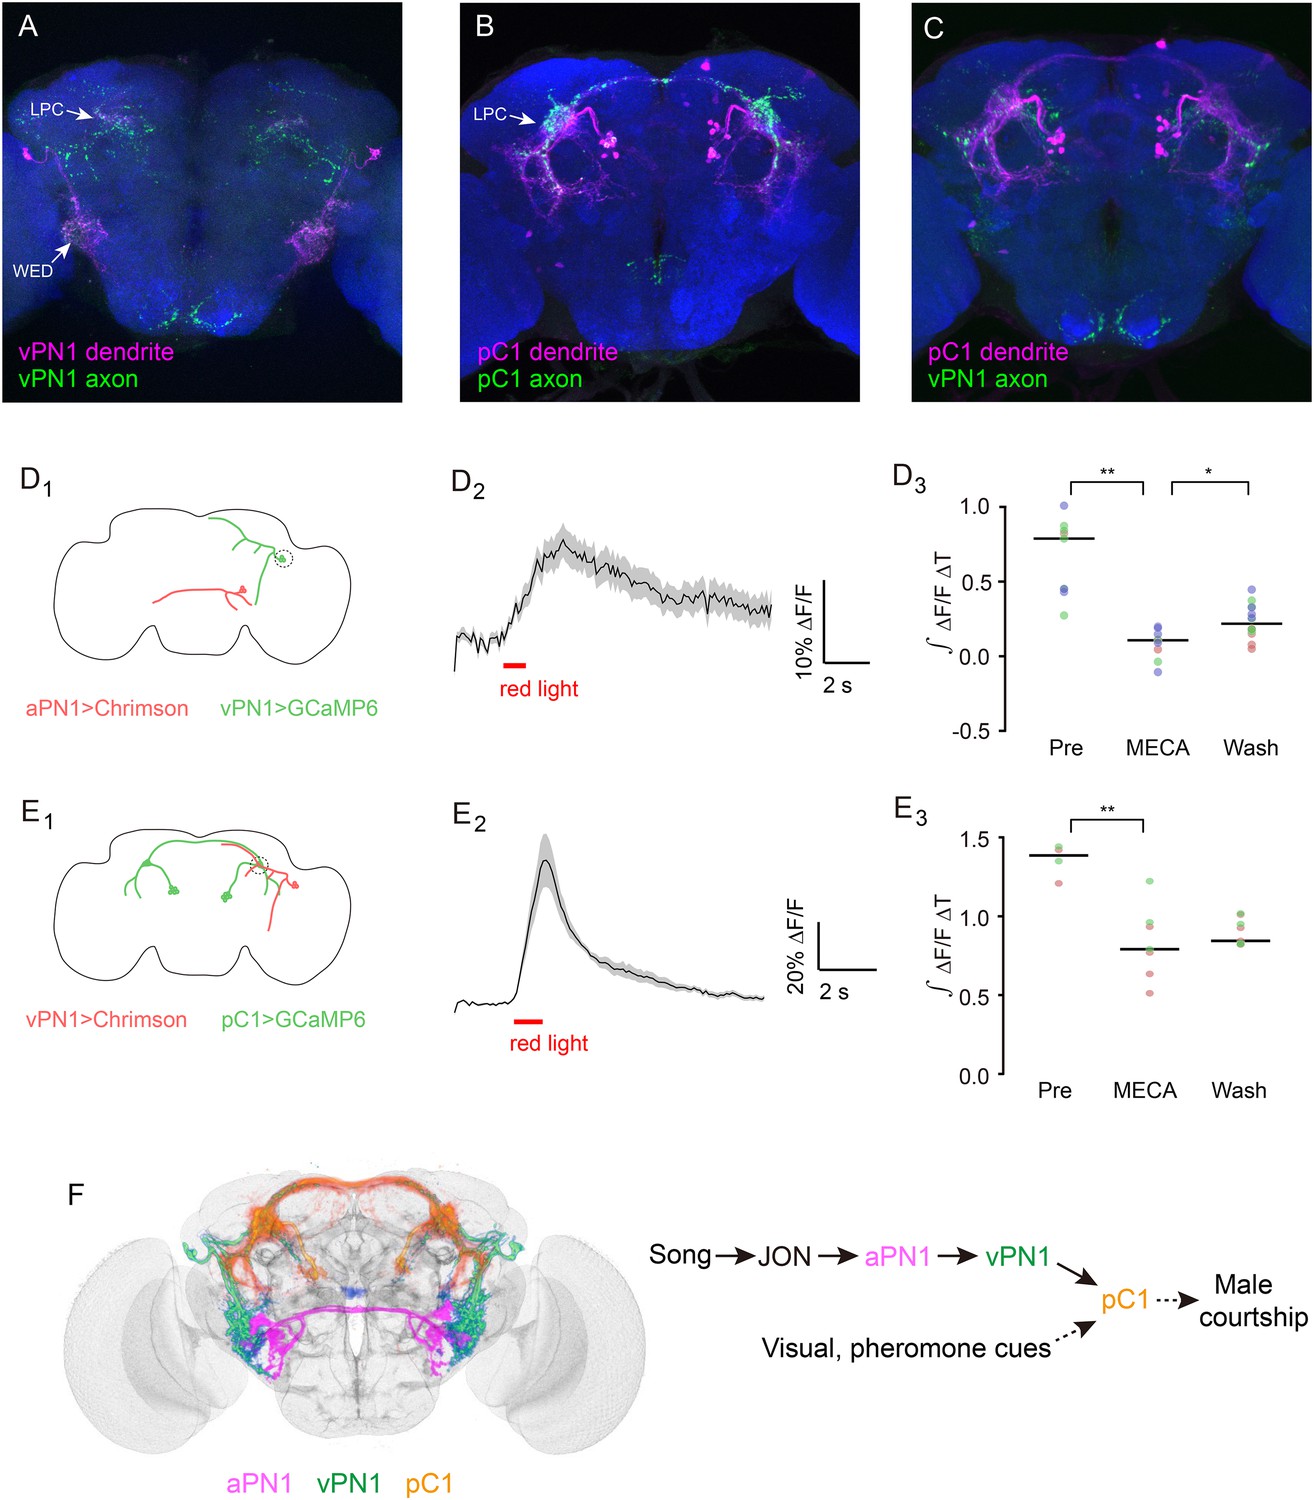
(A–C) Labeling of dendrites and axons by expression of the dendritic marker DenMark (magenta) and axonal marker Syt::GFP (green) in (A) vPN1 neurons (labeled with split GAL4 driver R72E10-GAL4AD ∩ VT009665-GAL4DBD) and (B) pC1 neurons (labeled with split GAL4 driver R71G01-GAL4AD ∩ R15A01-GAL4DBD). (C) Co-registration of vPN1 axons (green) and pC1 dendrites (magenta) onto a standard brain. (D) Activation of aPN1 neurons induced calcium responses in vPN1 neurons. (D1) CsChrimson was expressed in aPN1 neurons with 59C10-LexA, while GCaMP6 was expressed in vPN1 neurons with R72E10-GAL4. Dashed circle indicates the location of the recording site. (D2) aPN1 CsChrimson-mediated activation induced calcium responses in vPN1 neurons. Black line indicates mean while gray envelope indicates SEM. n = 46 from 6 flies. (D3) This effect is suppressed by the acetylcholine receptor antagonist mecamylamine (**p < 0.001, Student's t-test), and partially restored by washing out the antagonist (*p < 0.01, Student's t-test). Dots with the same color represent experiments performed on the same individual. Black lines indicate mean values. n = 9–14 (depending on the drug condition) from 3 flies. (E) Activation of vPN1 neurons induced pC1 calcium responses. (E1) CsChrimson was expressed in vPN1 neurons with a vPN1 split-GAL4 driver while GCaMP6 was expressed in pC1 neurons with dsxLexA. Dashed circle indicates the location of the recording site. (E2) pC1 neurons respond to CsChrimson activation of vPN1 neurons. Black line indicates mean while gray envelope indicates SEM. n = 13 from 3 flies. (E3) Mecamylamine causes a mild reduction in the pC1 responses (**p < 0.001, Student's t-test). Black lines indicate mean values. n = 4–9 from 2 flies. (F) Left panel shows co-registration of aPN1 (magenta), vPN1 (green), and pC1 (yellow) neurons onto a standard brain. The anatomical overlap between them suggests a potentially interconnected circuit mediating courtship song detection in the male brain. We propose that courtship song is relayed through aPN1 and vPN1 neurons to pC1 neurons, and that the pC1 neurons integrate song signals with other sensory cues to initiate courtship.
Figure 8—figure supplement 1
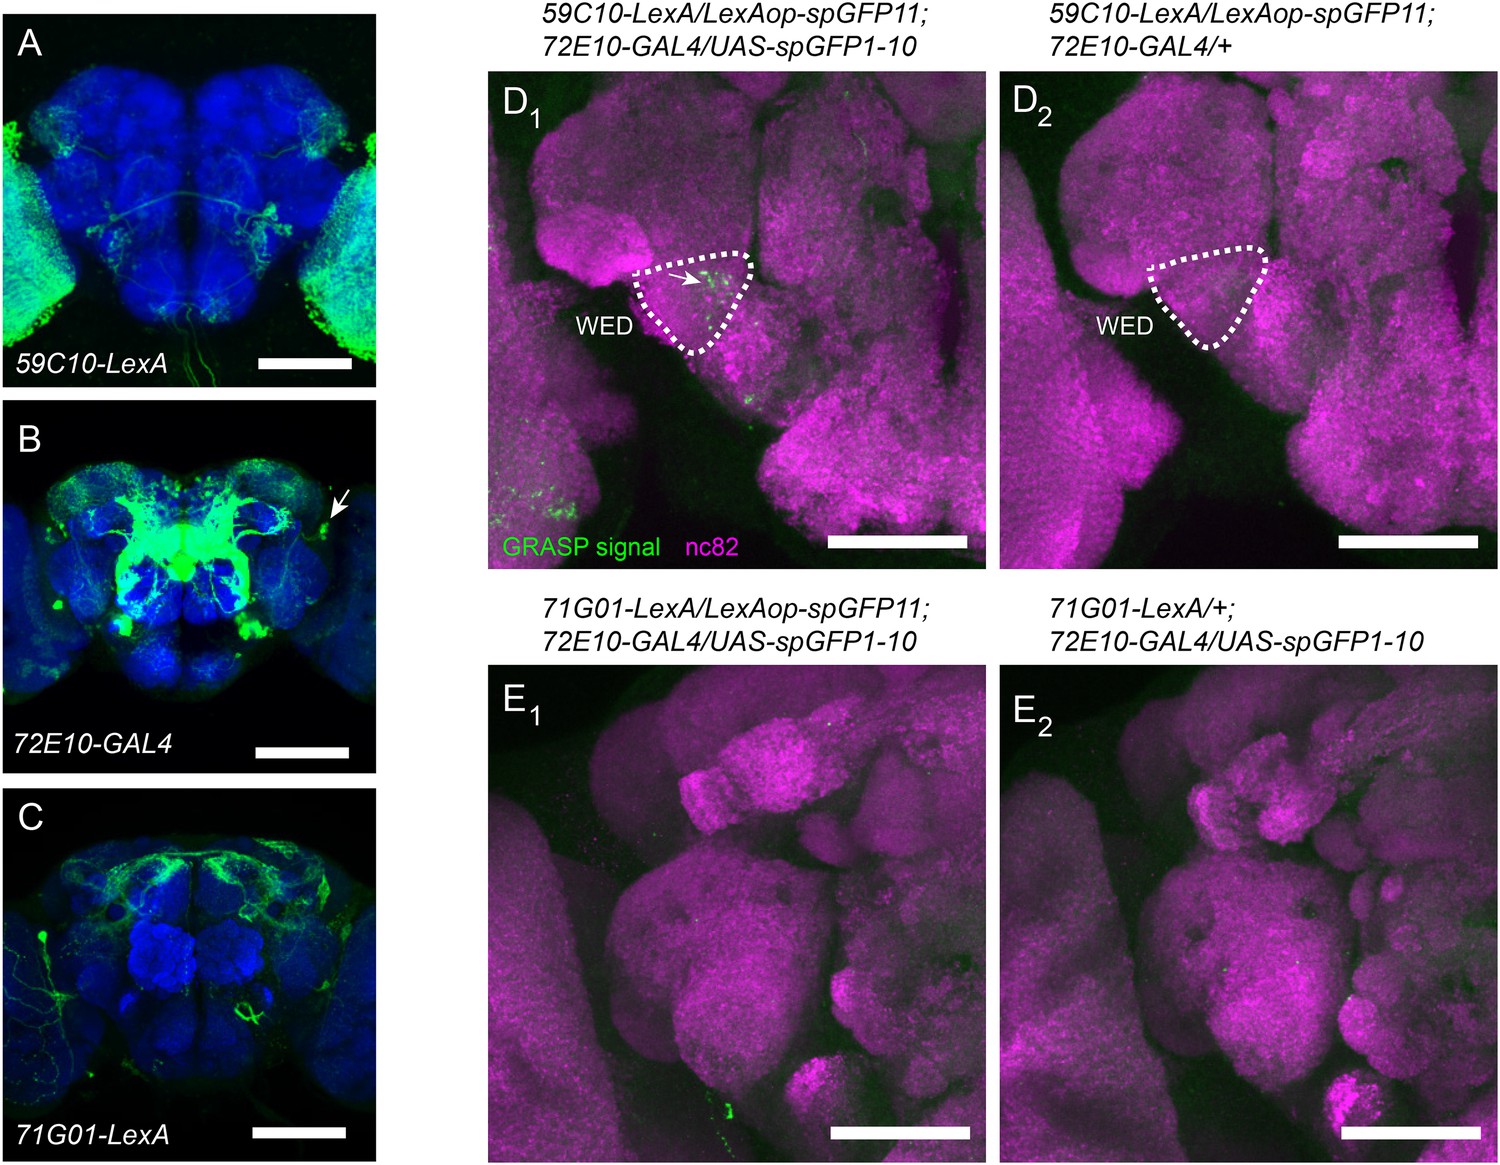
Characterization of synaptic connections in the aPN1-vPN1-pC1 pathway with GFP reconstitution across synaptic partners (GRASP) method.
(A–C) GFP Expression (green) in aPN1 (A), vPN1 (B), and pC1 (C) driven by 59C10-LexA, 72E10-GAL4 and 71G01-LexA and counter-stained by nc82 antibody (blue). Arrow in (B) indicates the cell bodies of vPN1 neurons. Scale bars, 100 μm. (D) Pattern of reconstituted GFP signal (green, indicated by arrow in D1) between aPN1 and vPN1 neurons in the WED region. Neuropil is labeled by nc82 antibody staining (magenta). GRASP signal was not observed in control flies (D2). Scale bars, 50 μm. (E) GRASP signal was barely detected between vPN1 neurons and pC1 neurons (E1). (E2) is the control for (E1). Scale bars, 50 μm.
Videos
Video 1
CsChrimson activation of vPN1 neurons induced chaining behavior in LexAop2-FLP/+; UAS>dsFRT>CsChrimson-mVenus, fruLexA/72E10-GAL4 male flies.
https://doi.org/10.7554/eLife.08477.018
Video 2
CsChrimson activation of pC1 neurons induced chaining behavior in LexAop2-FLP/71G01-LexA; UAS>dsFRT>CsChrimson-mVenus/dsxGAL4 male flies.
https://doi.org/10.7554/eLife.08477.019
Video 3
3D segmentation and co-registration of aPN1, vPN1, and pC1 neurons.
https://doi.org/10.7554/eLife.08477.022Additional files
-
Source code 1
A Matlab GUI for synchronized video-taping and song stimulation in Figure 3.
- https://doi.org/10.7554/eLife.08477.007
-
Source code 2
A Matlab GUI for processing and analyzing the calcium-imaging data in Figure 5.
- https://doi.org/10.7554/eLife.08477.011
Download links
A two-part list of links to download the article, or parts of the article, in various formats.
Downloads (link to download the article as PDF)
Open citations (links to open the citations from this article in various online reference manager services)
Cite this article (links to download the citations from this article in formats compatible with various reference manager tools)
Central neural circuitry mediating courtship song perception in male Drosophila
eLife 4:e08477.
https://doi.org/10.7554/eLife.08477


