Morphine disinhibits glutamatergic input to VTA dopamine neurons and promotes dopamine neuron excitation
- Fudan Univeristy, China
Figures
Figure 1
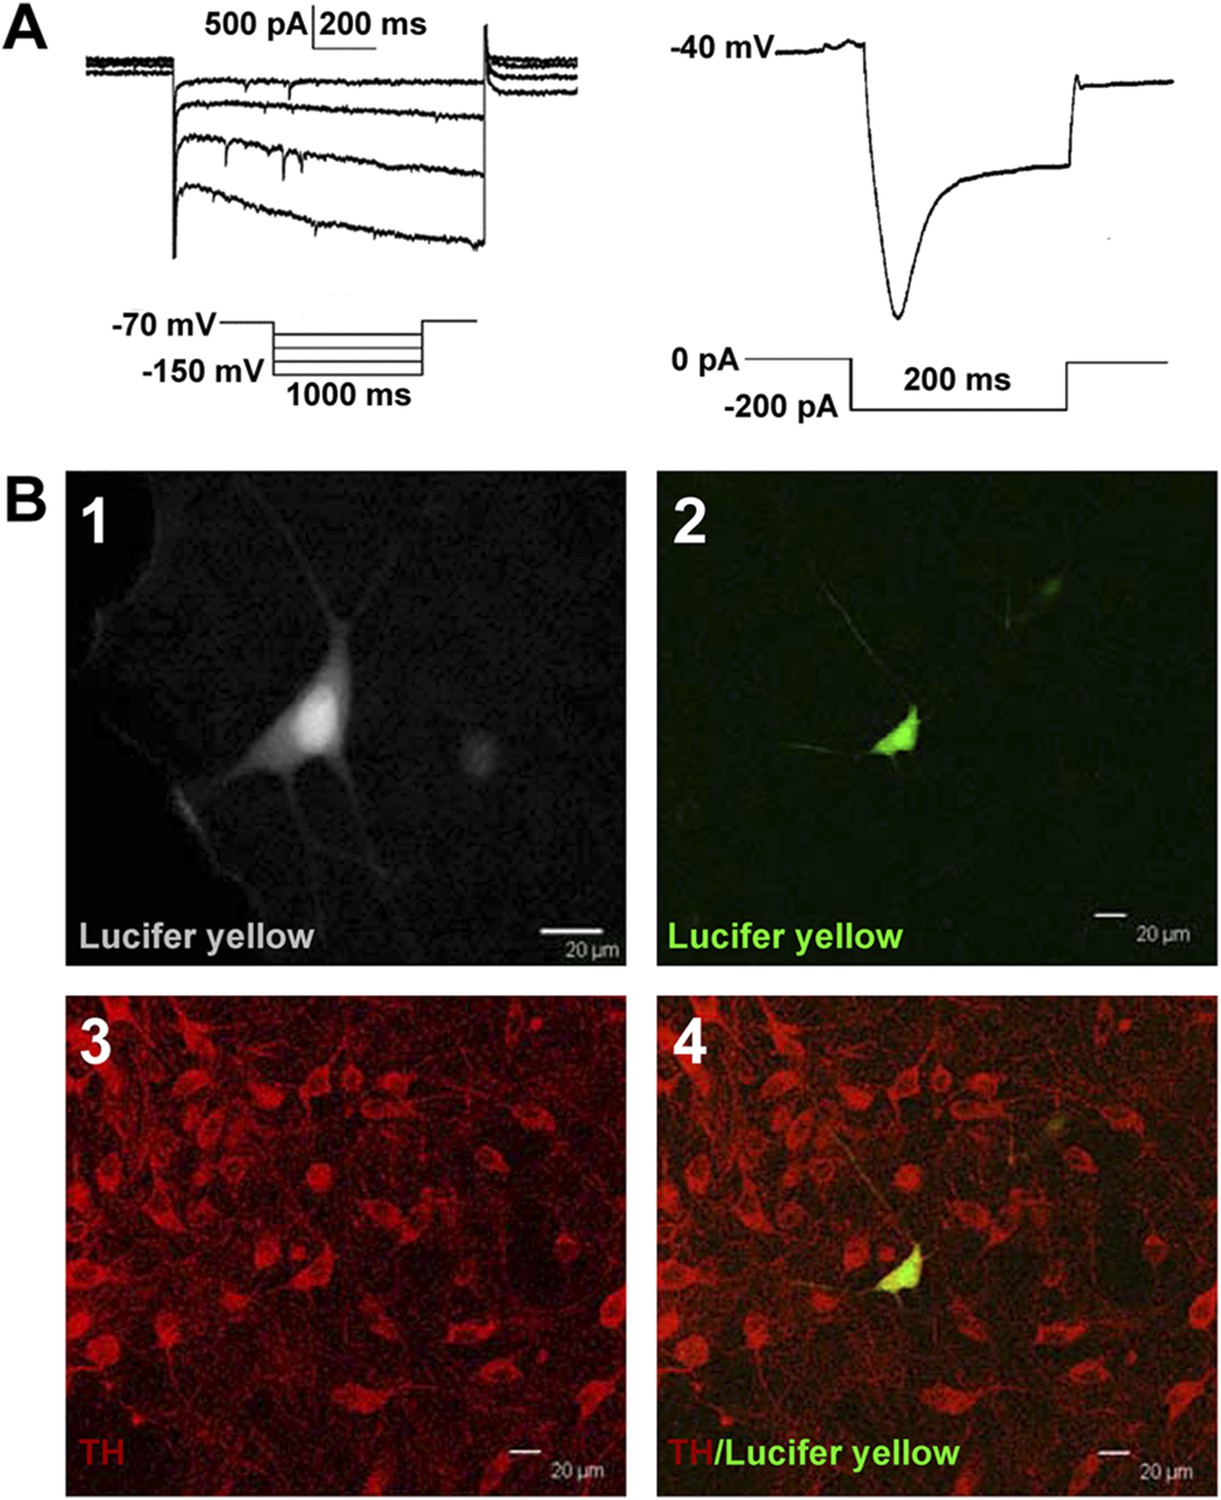
Identification of VTA-DA neurons in rats.
(A) Electrophysiological properties of VTA-DA neurons. Left panel: representative traces showing a large hyperpolarization-activated current (Ih) in whole-cell voltage-clamp recording. Holding potential: −70 mV. Right panel: representative traces showing a large voltage ‘sag’ when hyperpolarized in whole-cell current-clamp recording. Holding current: 0 pA. (B) Immunohistochemical labeling of identified VTA-DA neurons. Panel 1: images of a Lucifer yellow-labeled neuron from the ventral tegmental area (VTA) after whole-cell patch-clamp recording under infrared differential interference contrast and fluorescent microscopy. Panel 2: the same neuron labeled with Lucifer yellow (green color) under confocal microscopy. Panel 3: VTA images showing tyrosine hydroxylase (TH)-positive neurons after immunostaining. Panel 4: Lucifer yellow-filled neuron co-labeled with TH. Scale bar: 20 μm.
Figure 2
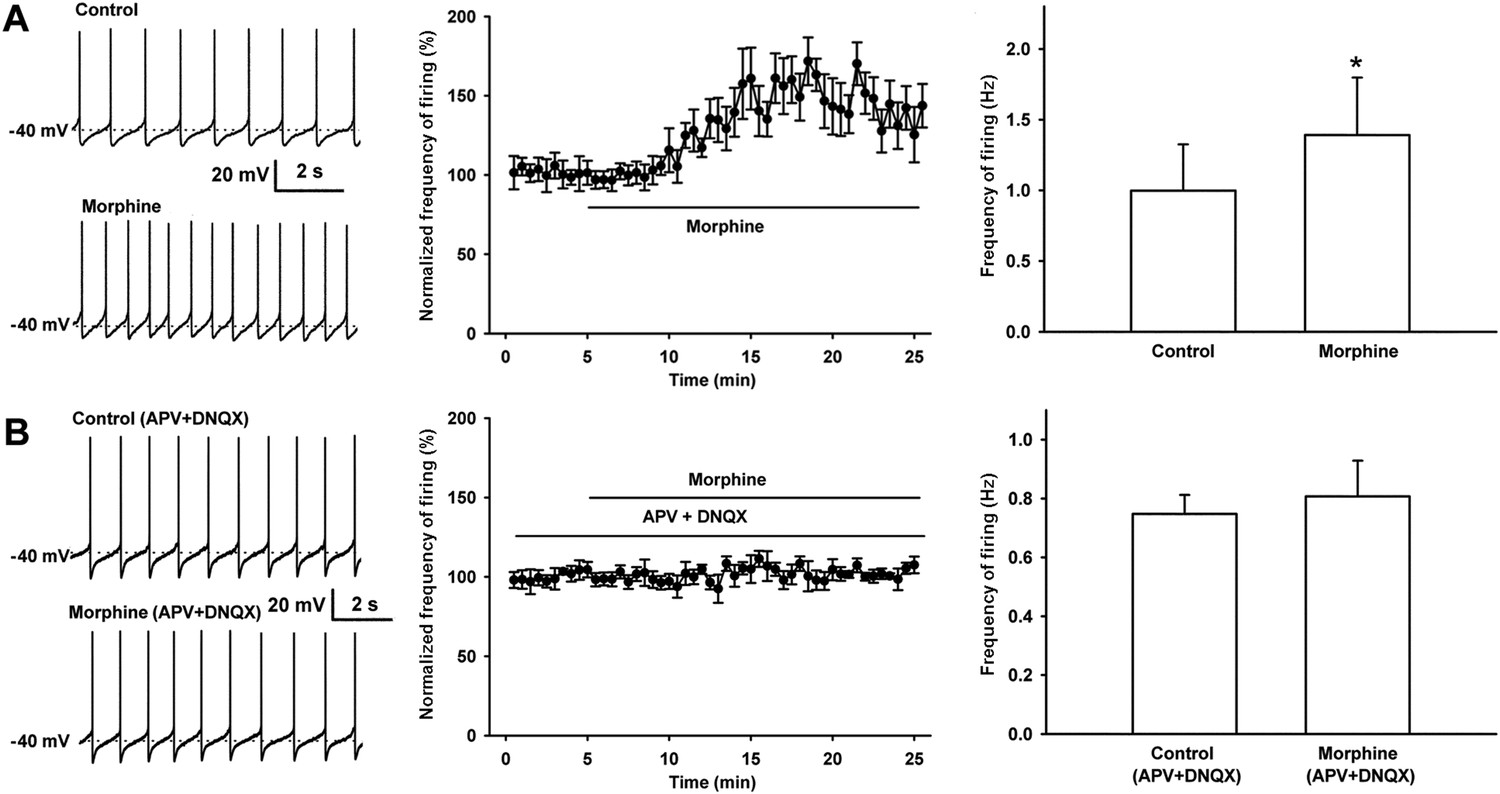
Effect of morphine on spontaneous firing of VTA-DA neurons in rats and the influence of the NMDA receptor antagonist APV and the AMPA receptor antagonist DNQX on the effect of morphine on spontaneous firing of VTA-DA neurons in rats.
(A) Effect of morphine on spontaneous firing of VTA-DA neurons. Left panel: representative spontaneous firing traces before and after morphine (10 μM). Middle panel: time course of spontaneous firing before and after morphine (10 μM) (n = 6 cells from five rats). Right panel: average frequency of spontaneous firing before and after morphine (n = 6 cells from five rats, p < 0.05, compared to control before morphine). (B) Influence of the NMDA receptor antagonist APV and the AMPA receptor antagonist DNQX on the effect of morphine on spontaneous firing in VTA-DA neurons. Left panel: representative spontaneous firing traces before and after morphine (10 μM) in the presence of APV (50 μM) and DNQX (10 μM). Middle panel: time course of spontaneous firing before and after morphine in the presence of APV (50 μM) and DNQX (10 μM) (n = 6 cells from five rats). Right panel: average frequency of spontaneous firing before and after morphine in the presence of APV (50 μM) and DNQX (10 μM) (n = 6 cells from five rats, p = 0.34). Data are shown as the mean ±s.e.m. *p < 0.05.
Figure 3
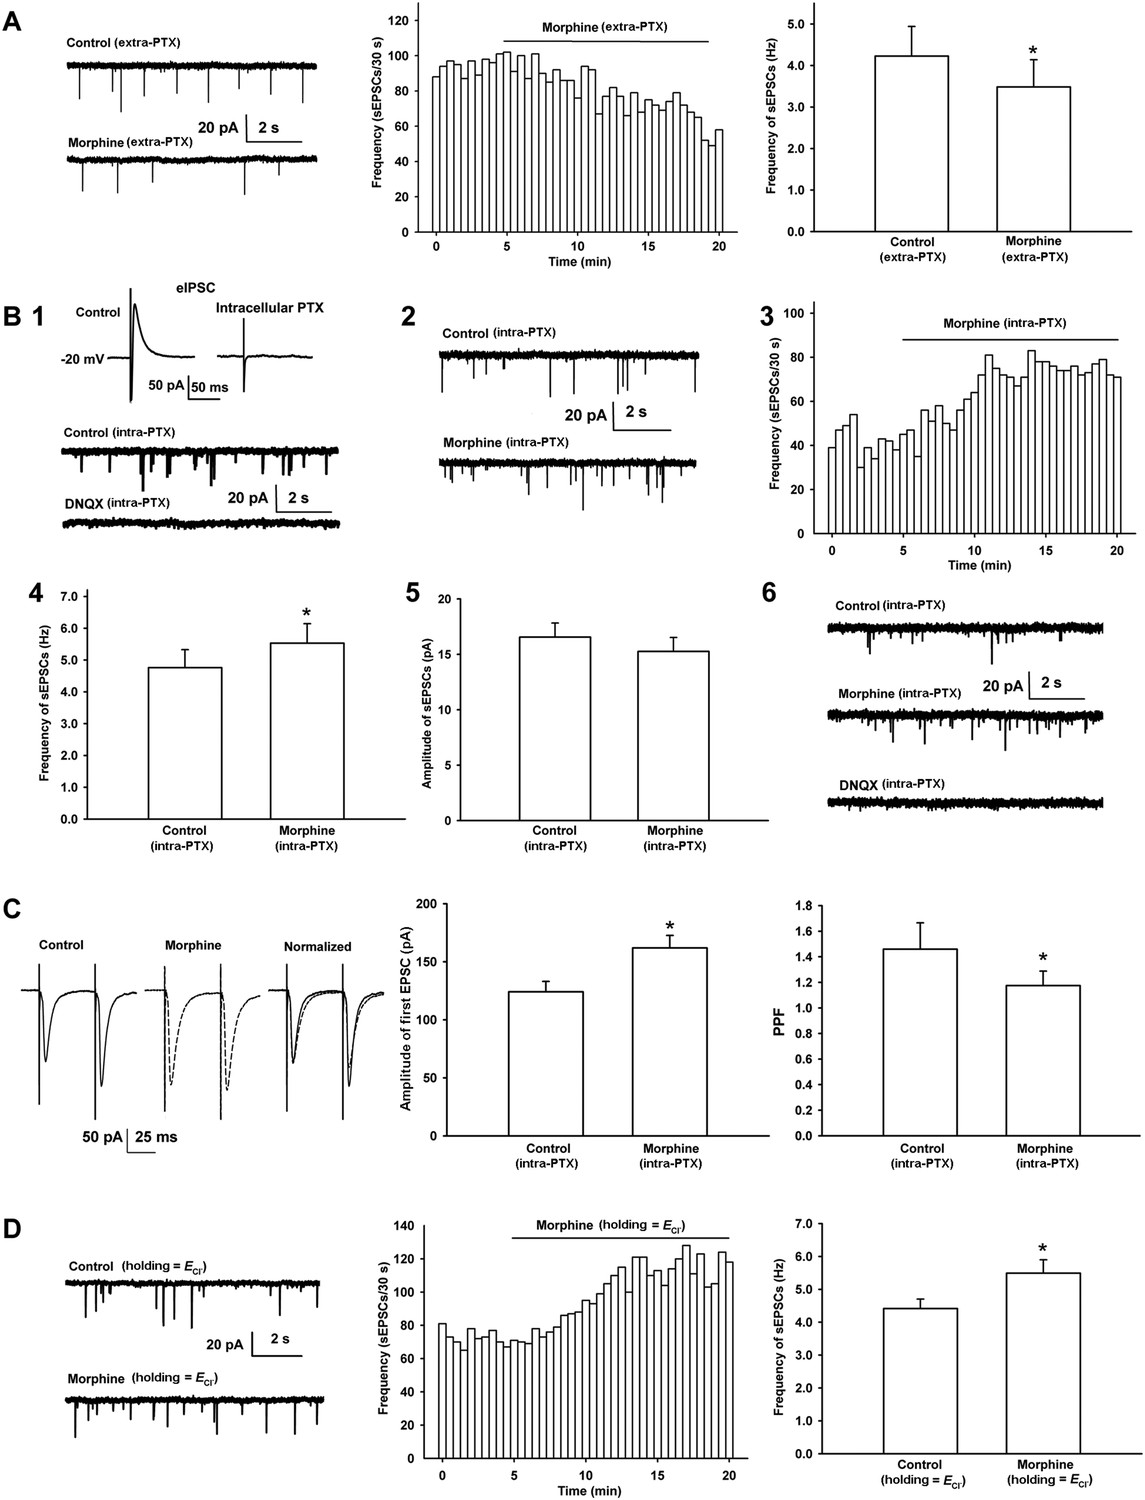
Effects of morphine on the frequency of spontaneous excitatory postsynaptic currents (sEPSCs) and paired pulse facilitation (PPF) of VTA-DA neurons in rats.
(A) Effects of morphine on the frequency of sEPSCs in the presence of extracellularly applied picrotoxin (PTX) in VTA-DA neurons. Left panel: typical current traces of sEPSCs before and after morphine (10 μM) in the presence of extracellularly applied PTX. Middle panel: typical time course of the frequency of sEPSCs before and after morphine (10 μM) in the presence of extracellularly applied PTX. Right panel: average frequency of sEPSCs before and after morphine (10 μM) in the presence of extracellularly applied PTX (n = 6 cells from four rats, p < 0.05, compared to control before morphine). (B) Effects of morphine on sEPSCs in the presence of intracellularly applied PTX in VTA-DA neurons. Top of panel 1: inhibitory postsynaptic currents (IPSCs) in the normal intracellular recording solution and the presence of intracellularly applied PTX. Bottom of panel 1: typical current traces of sEPSCs before and after DNQX (10 μM) in the presence of intracellularly applied PTX. Panel 2: typical current traces of sEPSCs before and after morphine (10 μM) in the presence of intracellularly applied PTX. Panel 3: typical time course of the frequency of sEPSCs before and after morphine (10 μM) in the presence of intracellularly applied PTX. Panel 4: average frequency of sEPSCs before and after morphine (10 μM) in the presence of intracellularly applied PTX (n = 8 cells from five rats, p < 0.05, compared to control before morphine). Panel 5: average amplitude of sEPSCs before and after morphine (10 μM) in the presence of intracellularly applied PTX (n = 8 cells from five rats, p = 0.24, compared to control before morphine). Panel 6: typical current traces of sEPSCs before and after DNQX (10 μM) in the presence of intracellularly applied PTX and morphine. (C) Effects of morphine on the PPF in VTA-DA neurons. Left panel: representative traces of the PPF before and after morphine (10 μM), and superimposition of the two traces normalized to the first excitatory postsynaptic current (EPSC) before and after morphine (10 μM) in the presence of intracellularly applied PTX. Middle panel: average amplitude of the first EPSC in control and morphine (10 μM) in the presence of intracellularly applied PTX (n = 6 cells from four rats, p < 0.05, compared to control before morphine). Right panel: average PPF before and after morphine (10 μM) in the presence of intracellularly applied PTX (n = 6 cells from four rats, p < 0.05, compared to control before morphine). (D) Effects of morphine on the frequency of sEPSCs when VTA-DA neurons were clamped the membrane potential at the reversal potential of Cl− channels in VTA-DA neurons. Left panel: typical current traces of sEPSCs before and after morphine (10 μM) when DA neurons was clamped the membrane potential at the reversal potential of Cl− channels. Middle panel: typical time course of the frequency of sEPSCs before and after morphine (10 μM) when DA neurons was clamped the membrane potential at the reversal potential of Cl− channels. Right panel: average frequency of sEPSCs before and after morphine (10 μM) when DA neurons was clamped the membrane potential at the reversal potential of Cl− channels (n = 6 cells from four rats, p < 0.05, compared to control before morphine). Data are shown as the mean ±s.e.m. *p < 0.05.
Figure 4
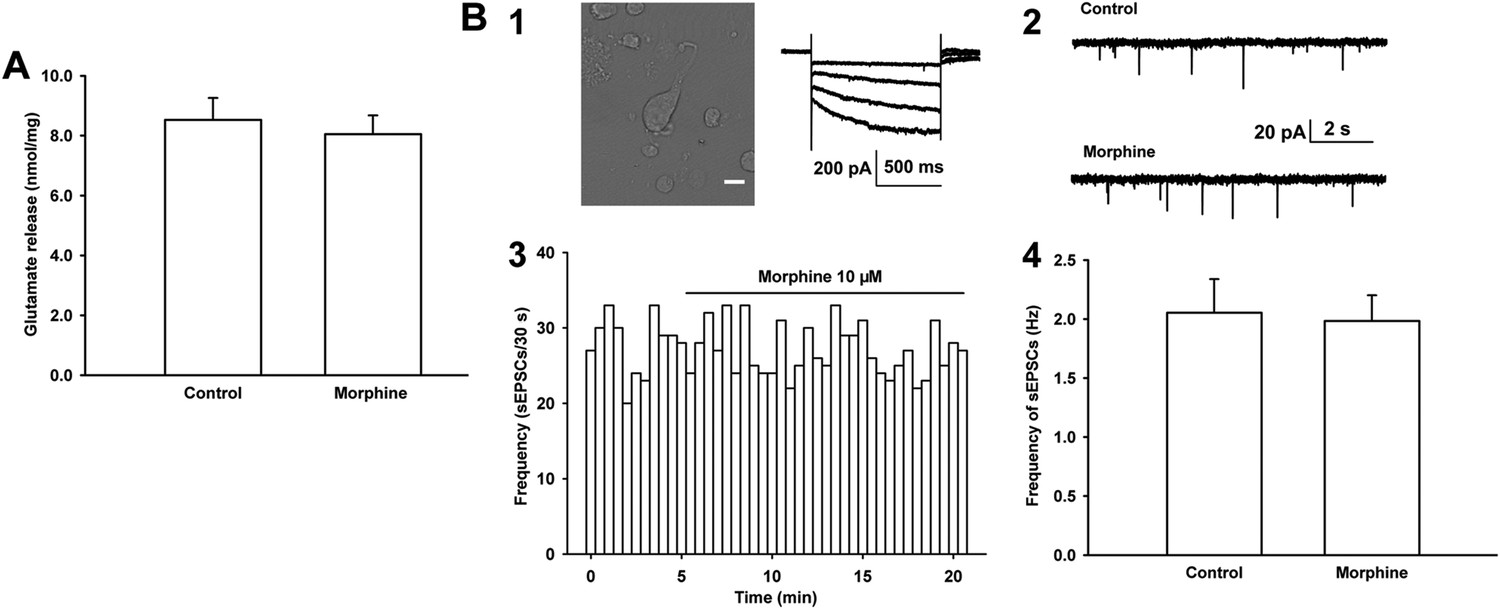
Effects of morphine on glutamate release from the ventral tegmental area (VTA) synaptosomes of rats and the frequency of sEPSCs in mechanically dissociated VTA-DA neurons from rats.
(A) Effects of morphine on glutamate release from VTA synaptosomes. Average concentration of glutamate release before and after application of morphine (10 μM) from VTA synaptosomes (n = 6 samples from eight rats, p = 0.46). (B) Effects of morphine on the frequency of sEPSCs in mechanically dissociated VTA-DA neurons. Panel 1, left: images of an acutely dissociated single neuron from the VTA under phase contrast microscopy. Scale bar: 10 μm. Panel 1, right: representative current traces showing a large hyperpolarization-activated current (Ih) in whole-cell voltage-clamp recording. Holding potential: −70 mV. Panel 2: typical current traces of sEPSC before and after morphine (10 μM) in the presence of intracellularly applied PTX. Panel 3: typical time course of the frequency of sEPSCs before and after morphine (10 μM) in the presence of intracellularly applied PTX. Panel 4: Average frequency of sEPSCs before and after morphine (10 μM) in the presence of intracellularly applied PTX (n = 6 cells from six rats, p = 0.65). Data are shown as the mean ±s.e.m. *p < 0.05.
Figure 5
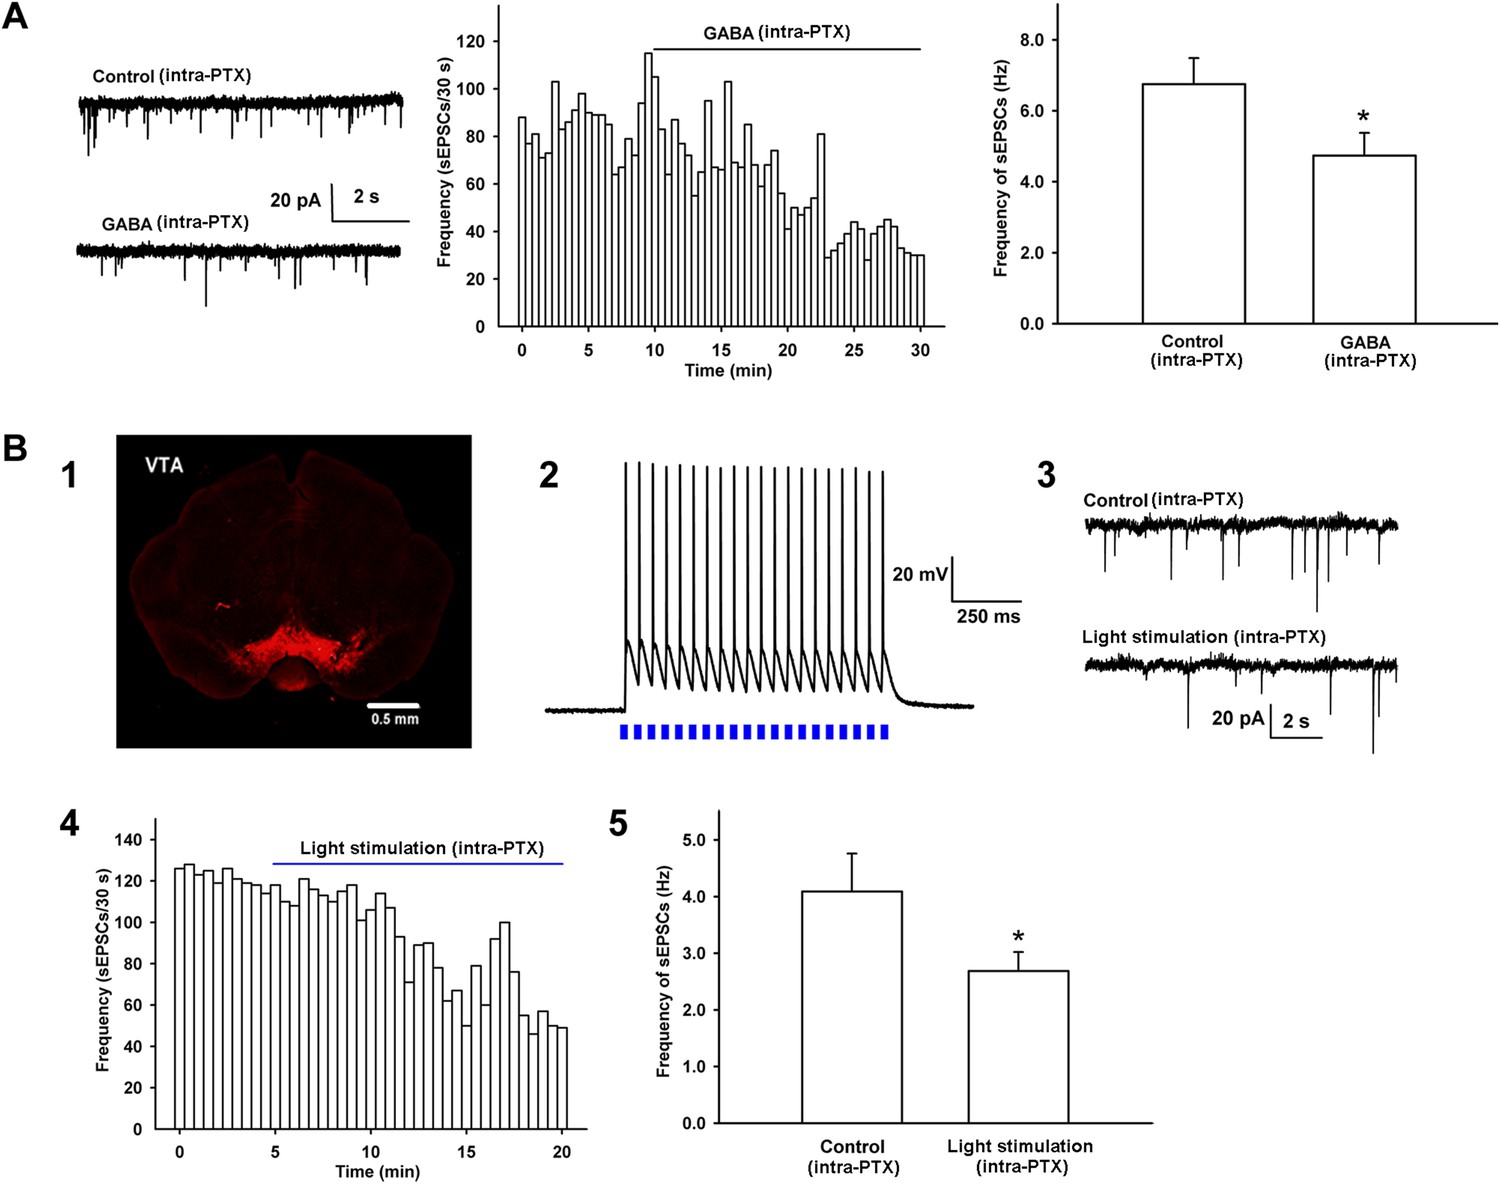
Effect of exogenous application of GABA and 470 nm light stimulation on the frequency of sEPSCs in the presence of intracellularly applied PTX in VTA-DA neurons.
(A) Effect of exogenous application of GABA on the frequency of sEPSCs of VTA-DA neurons in rats. Left panel: typical current traces of sEPSCs before and after GABA (10 μM) in the presence of intracellularly applied PTX. Middle panel: typical time course of the frequency of sEPSCs before and after GABA (10 μM) in the presence of intracellularly applied PTX. Right panel: average frequency of sEPSCs before and after GABA (10 μM) in the presence of intracellularly applied PTX (n = 6 cells from four rats, p < 0.05, compared to control before GABA). (B) Effect of 470 nm light stimulation on the frequency of sEPSCs of VTA-DA neurons in mice. Panel 1: coronal image showing the expression of ChR2-mCherry (red) following injection of the viral construct bilaterally into the ventral tegmental area (VTA) of GADcre+ mice. Scale bar: 500 µm. Panel 2: 470 nm light (20 Hz)-induced firing of VTA GABA neurons in current-clamp mode. Panel 3: typical current traces of sEPSCs before and after blue light (470 nm) stimulation in the presence of intracellularly applied PTX. Panel 4: typical time course of the frequency of sEPSCs before and after blue light (470 nm) stimulation in the presence of intracellularly applied PTX. Panel 5: average frequency of sEPSCs before and after blue light (470 nm) stimulation in the presence of intracellularly applied PTX (n = 6 cells from five mice, p < 0.05, compared to control before light stimulation). Data are shown as the mean ±s.e.m. *p < 0.05.
Figure 6
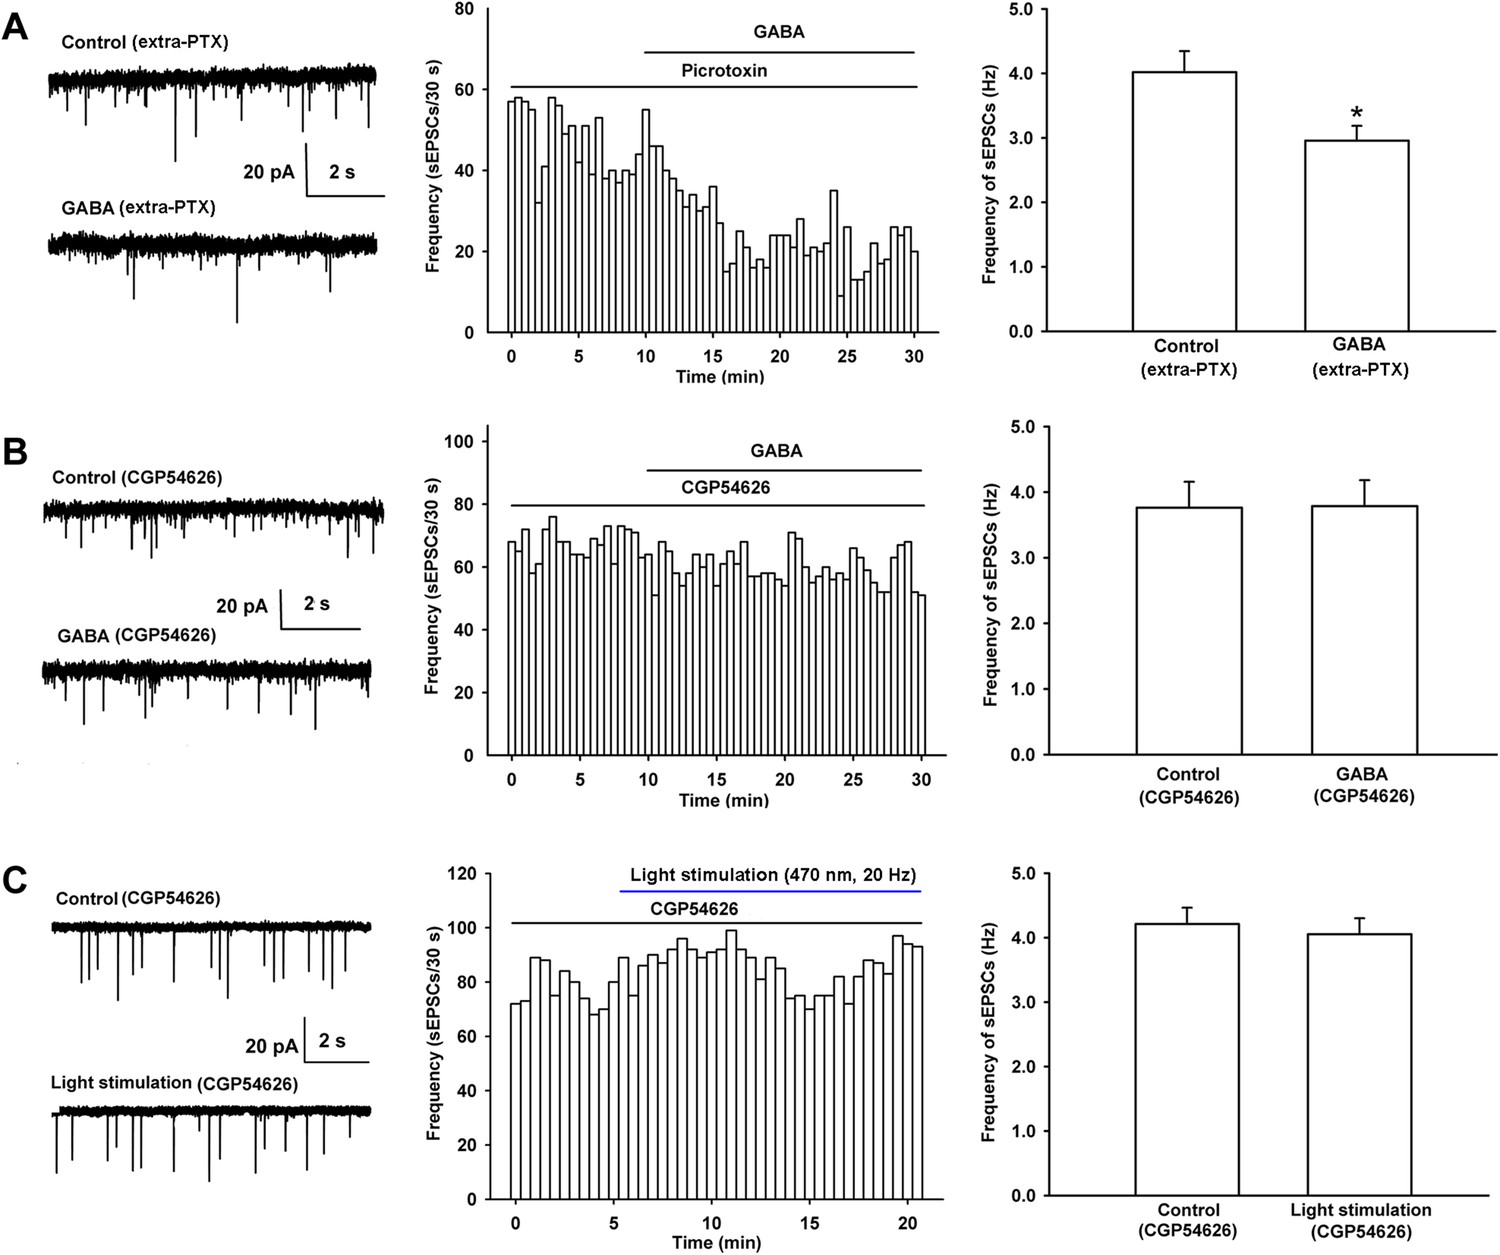
Influence of the GABAA receptor antagonist PTX and the GABAB receptor antagonist CGP54626 on the effect of exogenous application of GABA as well as the influence of the GABAB receptor antagonist CGP54626 on 470 nm light-induced inhibition of the frequency of sEPSCs in VTA-DA neurons.
(A) Influence of the GABAA receptor antagonist PTX on the effect of exogenous application of GABA of VTA-DA neurons in rats. Left panel: typical current traces of sEPSC before and after GABA (10 μM) in the presence of PTX (100 μM). Middle panel: typical time course of the frequency of sEPSCs before and after GABA (10 μM) in the presence of PTX (100 μM). Right panel: average frequency of sEPSCs before and after GABA (10 μM) in the presence of PTX (100 μM) (n = 6 cells from four rats, p < 0.05, compared to PTX before GABA). (B) Influence of the GABAB receptor antagonist CGP54626 on the effect of exogenous application of GABA of VTA-DA neurons in rats. Left panel: typical current traces of sEPSC before and after GABA (10 μM) in the presence of CGP54626 (2 μM). Middle panel: typical time course of the frequency of sEPSCs before and after GABA (10 μM) in the presence of CGP54626 (2 μM). Right panel: average frequency of sEPSCs before and after GABA (10 μM) in the presence of CGP54626 (2 μM) (n = 6 cells from four rats, p = 0.87). (C) Influence of the GABAB receptor antagonist CGP54626 on 470 nm light-induced inhibition of the frequency of sEPSCs of VTA-DA neurons in mice. Left panel: typical current traces of sEPSCs before and after blue light (470 nm) stimulation in the presence of CGP54626 (2 μM). Middle panel: typical time course of the frequency of sEPSCs before and after blue light (470 nm) stimulation in the presence of CGP54626 (2 μM). Right panel: average frequency of sEPSCs before and after blue light (470 nm) stimulation in the presence of CGP54626 (2 μM) (n = 6 cells from five mice, p = 0.21). Data are shown as the mean ±s.e.m. *p < 0.05.
Figure 7
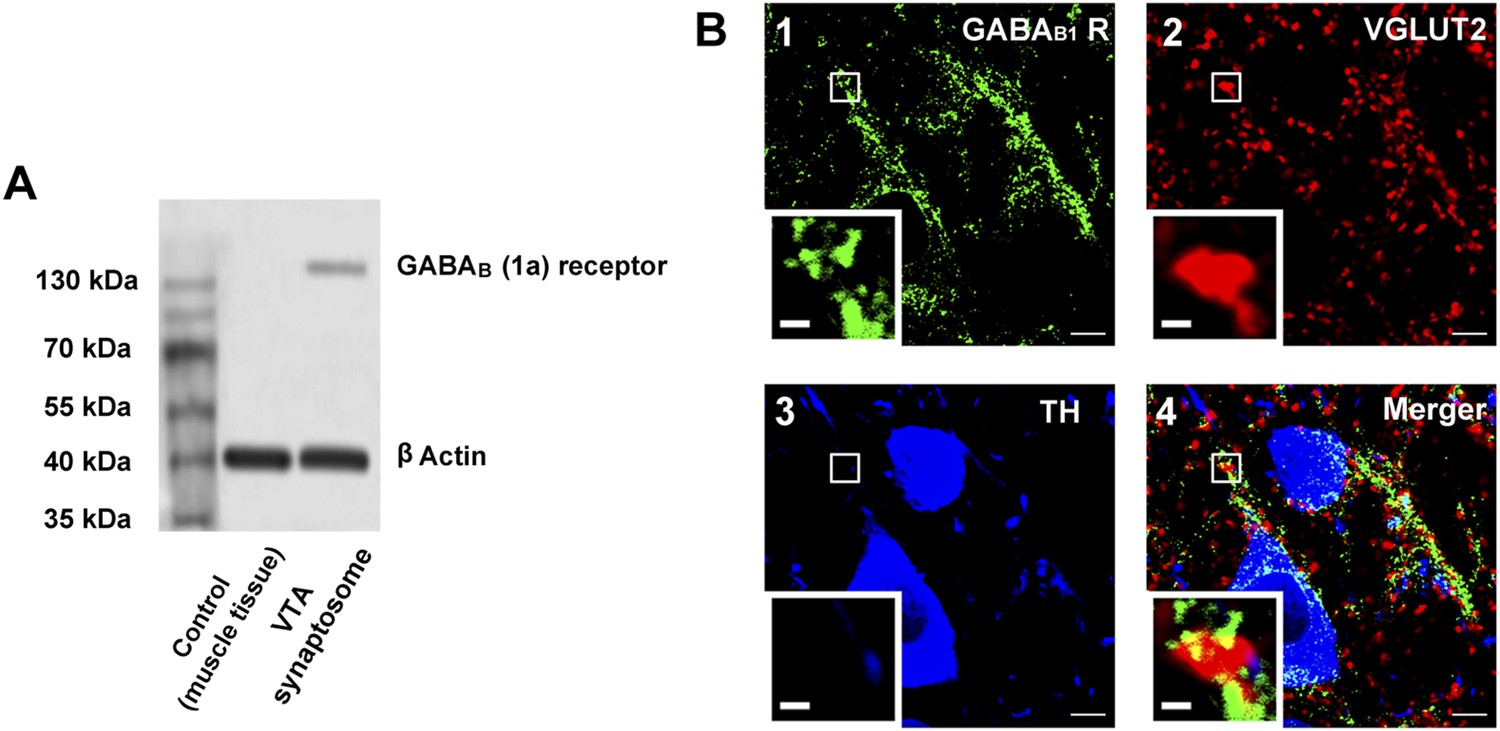
The presence of GABAB receptors in the presynaptic glutamatergic terminals of the ventral tegmental area (VTA) in rats.
(A) GABAB receptor expression in the synaptosomes from the VTA. A representative Western blot shows GABAB receptor expression in the synaptosomes from the VTA. (B) GABAB receptor expression in the VTA shown using the triple-immunofluorescence method. Panel 1: GABAB receptor immunolabeling (green-colored) in the VTA. Panel 2: VGLUT2-labeled axon terminals (red-colored) in the VTA. Panel 3: DA neuron labeled with TH (blue-colored) in the VTA. Panel 4: Merged image (yellow-colored) of GABAB receptors and VGLUT2 in the VTA. The insets marked with small white rectangles in panels 1–4 are magnified views. Scale bars: 5 µm (in panels 1–4); 1 µm (in the insets in panels 1–4).
Figure 8

Effect of the GABAB receptor antagonist CGP54626 and the GABAA receptor antagonist PTX on the frequency of sEPSCs of VTA-DA neurons in rats.
(A) Effect of the GABAB receptor antagonist CGP54626 on the frequency of sEPSCs in VTA-DA neurons. Left panel: typical current traces of sEPSCs before and after CGP54626 (2 μM). Middle panel: typical time course of the frequency of sEPSCs in DA neurons before and after CGP54626 (2 μM). Right panel: average frequency of sEPSCs before and after CGP54626 (2 μM) (n = 6 cells from four rats, p < 0.05, compared to control before CGP54626). (B) Effect of the GABAA receptor antagonist PTX on the frequency of sEPSCs in VTA-DA neurons. Left panel: typical current traces of sEPSCs before and after PTX (100 μM). Middle panel: typical time course of the frequency of sEPSCs before and after PTX (100 μM). Right panel: average frequency of sEPSCs before and after PTX (100 μM) (n = 6 cells from four rats, p = 0.29). Data are shown as the mean ±s.e.m. *p < 0.05.
Figure 9
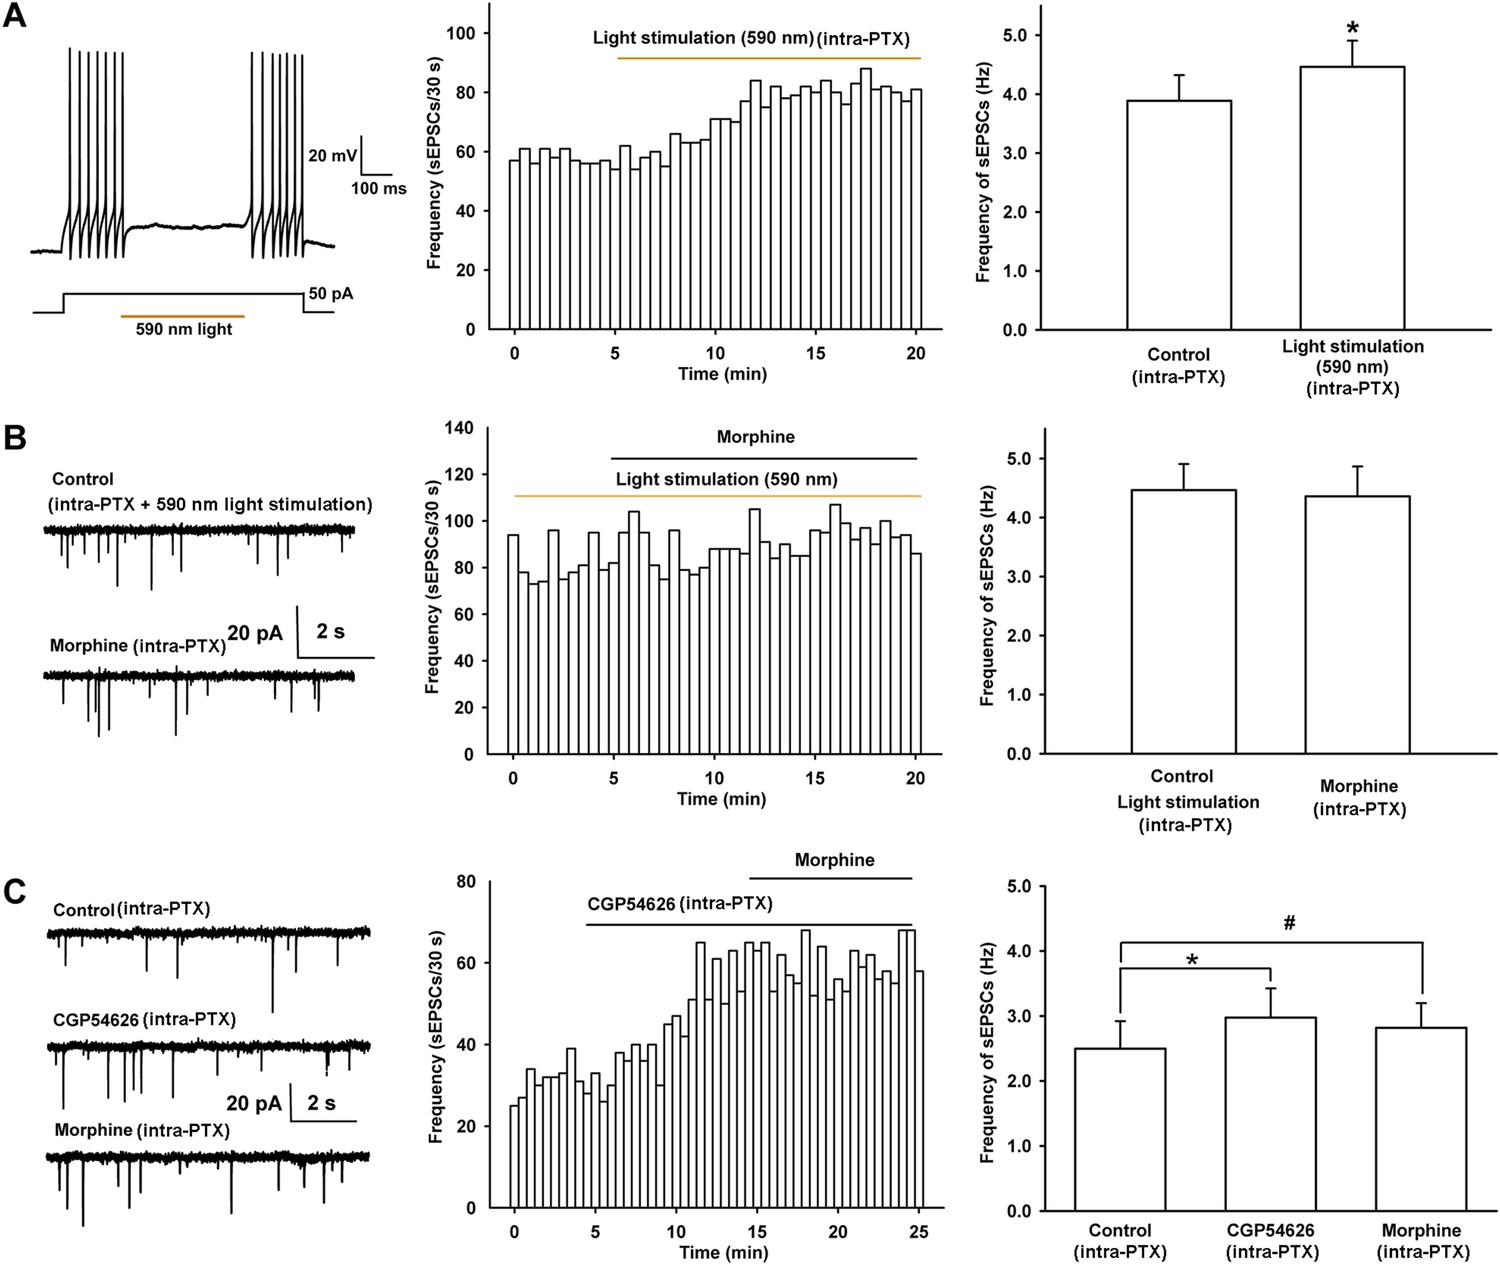
Effect of 590 nm light stimulation on the frequency of sEPSCs and influence of light-induced disinhibition of glutamatergic input and the GABAB receptor antagonist CGP54626 on the effect of morphine on the frequency of sEPSCs in VTA-DA neurons.
(A) Effect of 590 nm light stimulation on the frequency of sEPSCs of VTA-DA neurons in mice. Left panel: 590 nm light inhibits current injection-induced firing of action potentials in VTA GABA neurons. Middle panel: typical time course of the frequency of sEPSCs before and after yellow light (590 nm) stimulation. Right panel: average frequency of sEPSCs before and after yellow light (590 nm) stimulation (n = 6 cells from five mice, p < 0.05, compared to control before light stimulation). (B) Influence of light-induced disinhibition of glutamatergic input on the effect of morphine on the frequency of sEPSCs of VTA-DA neurons in mice. Left panel: typical current traces of sEPSC before and after morphine (10 μM) in the presence of yellow light (590 nm) stimulation. Middle panel: typical time course of the frequency of sEPSCs before and after morphine (10 μM) in the presence of yellow light (590 nm) stimulation. Right panel: average frequency of sEPSCs before and after morphine in the presence of yellow light (590 nm) stimulation (n = 6 cells from five mice, p = 0.78). (C) Influence of the GABAB receptor antagonist CGP54626 on the effect of morphine on the frequency of sEPSCs of VTA-DA neurons in rats. Left panel: typical current traces of sEPSCs before and after morphine (10 μM) in the presence of CGP54626 (2 μM). Middle panel: typical time course of the frequency of sEPSCs before and after morphine (10 μM) in the presence of CGP54626 (2 μM). Right panel: plots of the average frequency of sEPSCs in control, in CGP54626 (2 μM), and in morphine (10 μM) (n = 6 cells from four rats; p < 0.05, CGP54626 compared to control, p < 0.05, morphine compared to control). Data are shown as the mean ±s.e.m. *p < 0.05, #p < 0.05.
Figure 10
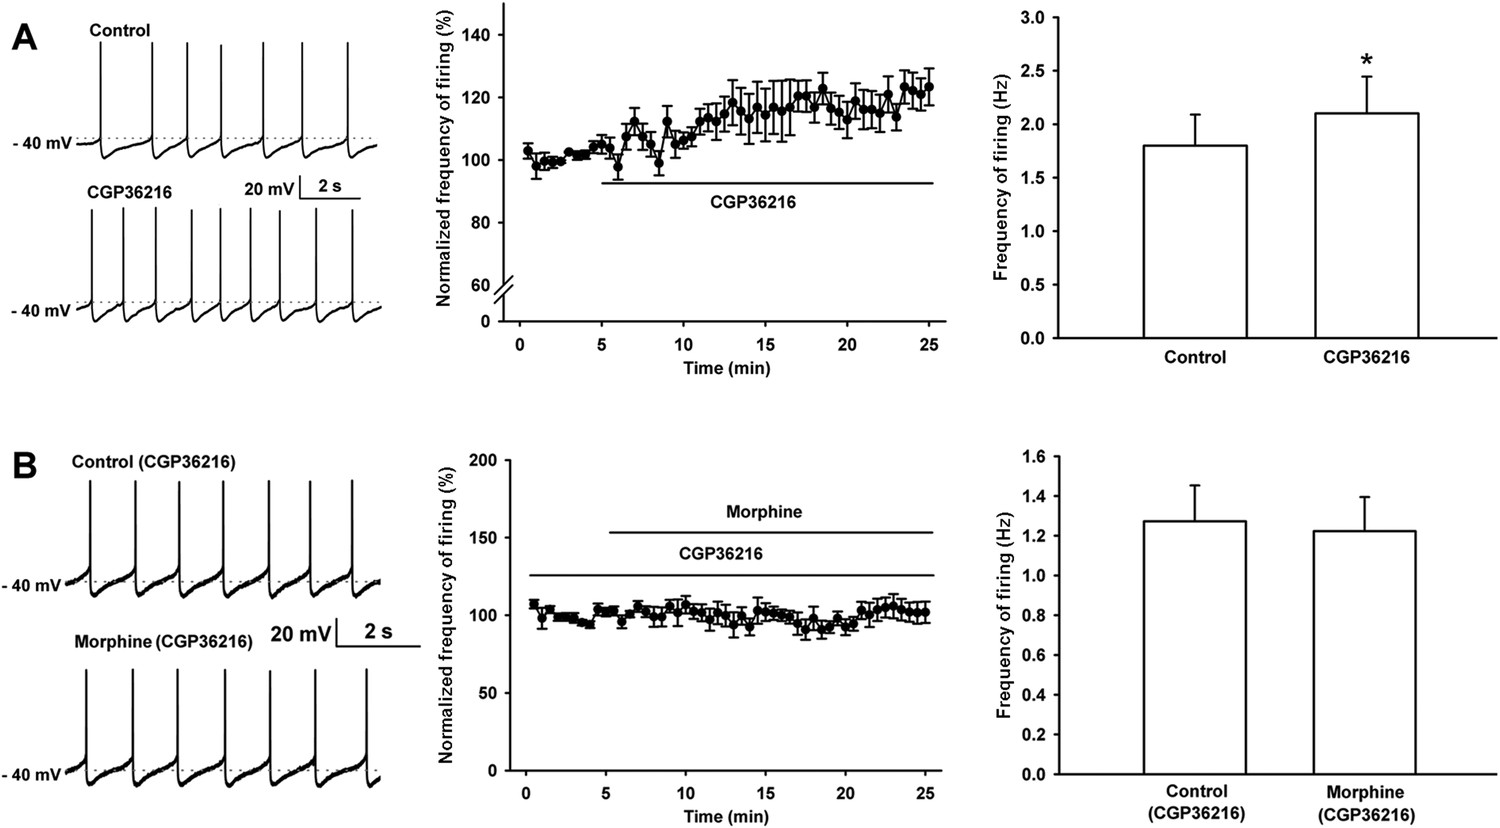
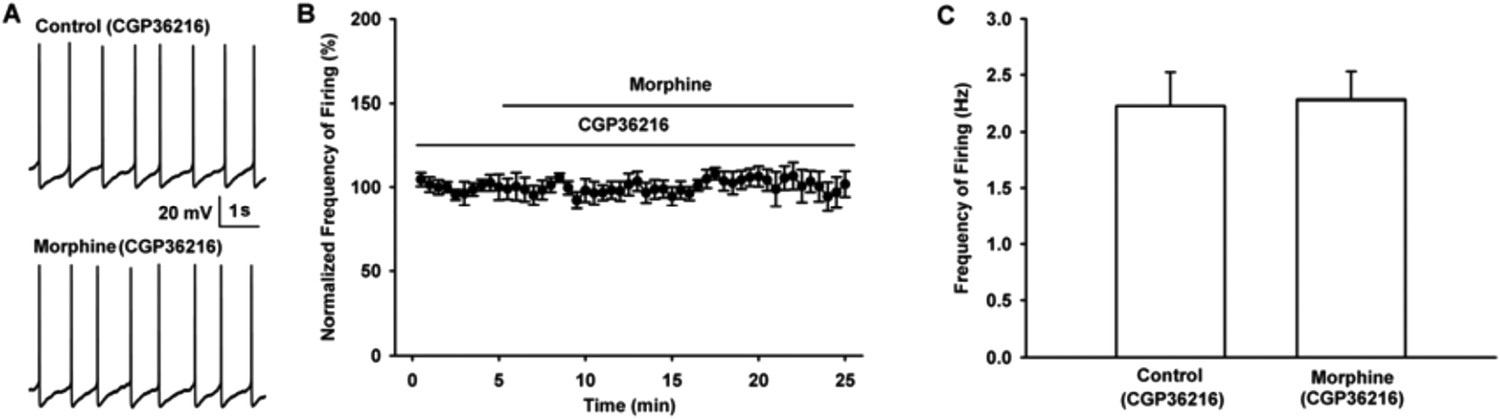
Effect of the selective presynaptic GABAB receptor antagonist CGP36216 on spontaneous firing and the influence of the selective presynaptic GABAB receptor antagonist CGP36216 on the effect of morphine on spontaneous firing of VTA-DA neurons in rats.
(A) Effect of the selective presynaptic GABAB receptor antagonist CGP36216 on spontaneous firing in VTA-DA neurons. Left panel: representative spontaneous firing traces before and after CGP36216 (100 μM). Middle panel: time course of spontaneous firing before and after CGP36216 (100 μM) (n = 6 cells from four rats). Right panel: average frequency of spontaneous firing before and after CGP36216 (100 μM) (n = 6 cells from four rats, p < 0.05, compared to control before CGP36216). (B) Influence of the selective presynaptic GABAB receptor antagonist CGP36216 on the effect of morphine on spontaneous firing in VTA-DA neurons. Left panel: representative spontaneous firing traces before and after morphine (10 μM) in the presence of CGP36216 (100 μM). Middle panel: time course of spontaneous firing before and after morphine (10 μM) in the presence of CGP36216 (100 μM) (n = 6 cells from four rats). Right panel: average frequency of spontaneous firing before and after morphine (10 μM) in the presence of CGP36216 (100 μM) (n = 6 cells from four rats, p = 0.35, compared to CGP36216 before morphine). Data are shown as the mean ±s.e.m. *p < 0.05.
Figure 11
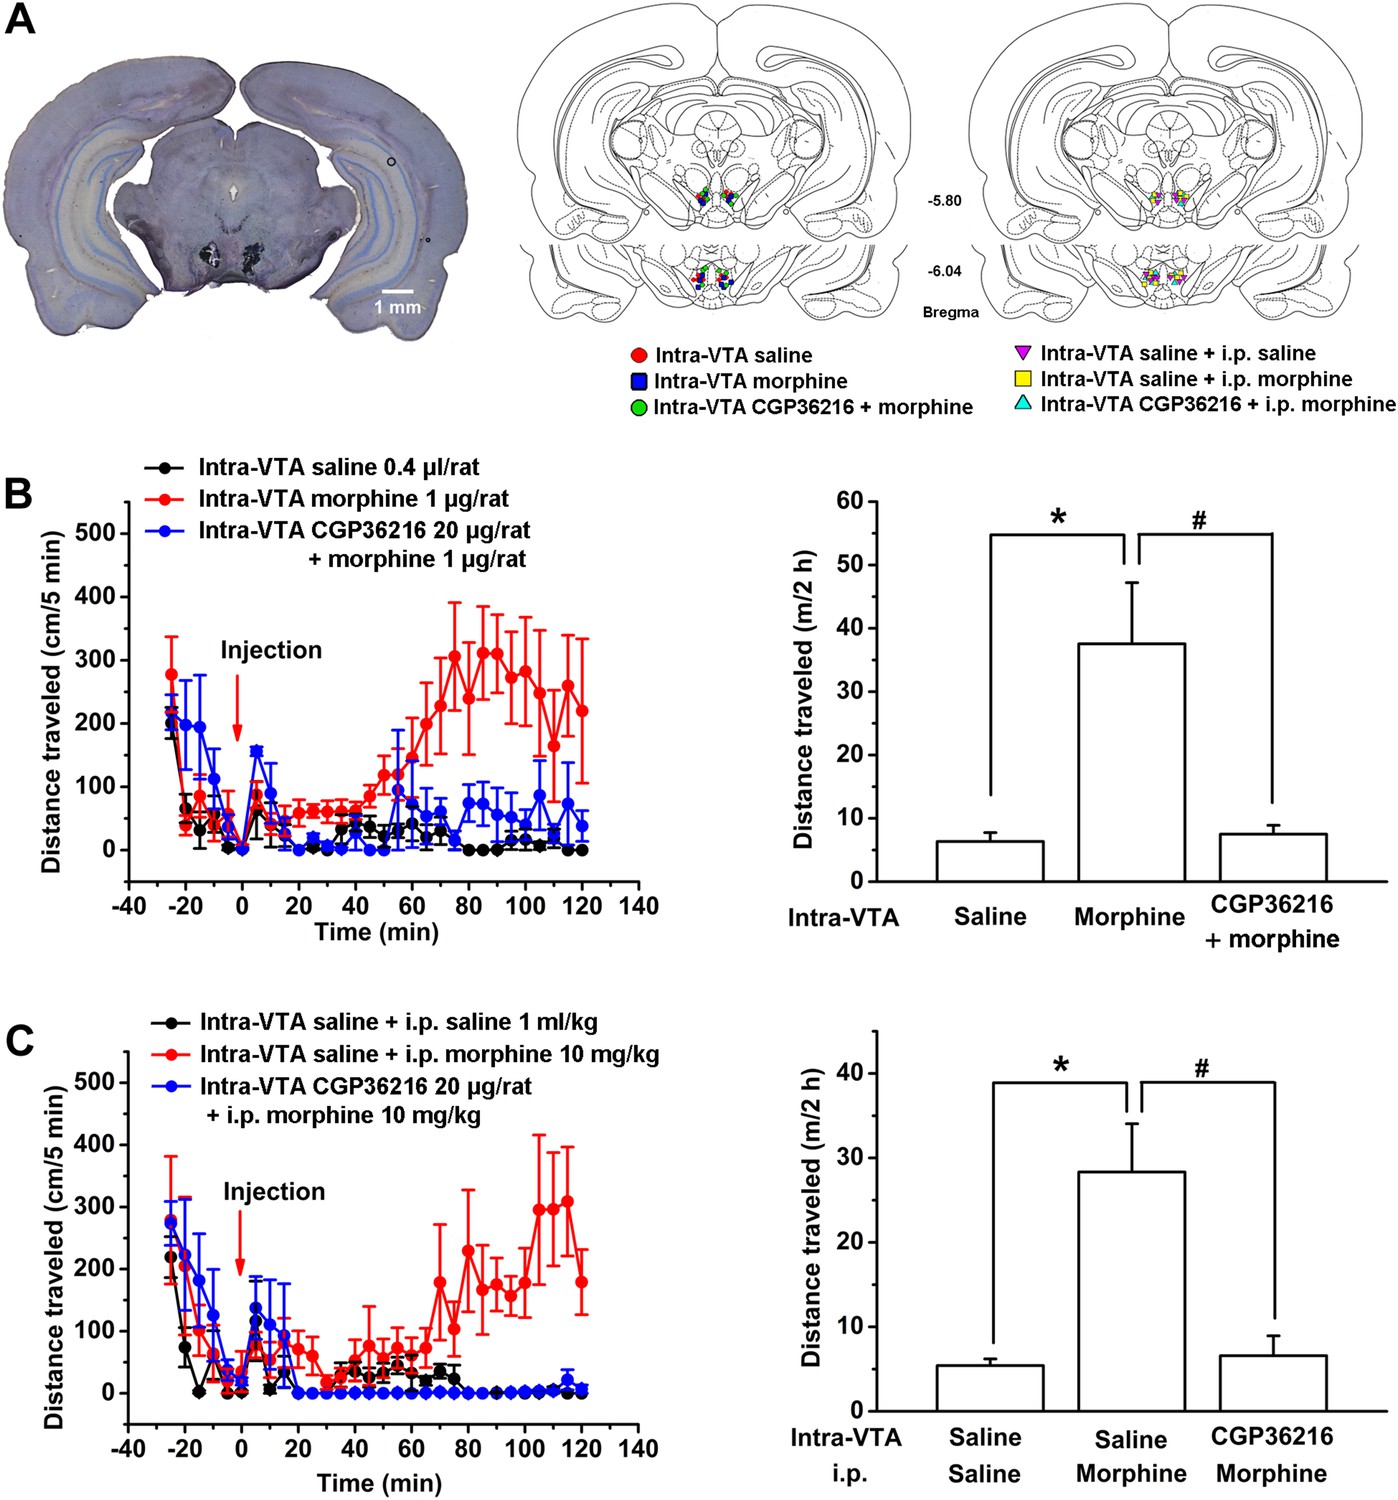
Influence of intra-ventral tegmental area (VTA) injection of the presynaptic GABAB receptor antagonist CGP36216 on morphine-induced increase in locomotor activity in rats.
(A) Injection sites were verified under light microscope. Left panel: Representative Nissl-stained photomicrograph of cannula tracts terminating in the VTA. Right panel: location of the injection cannula tips in the VTA of rats used in data analyses. Numbers indicate coordinates relative to bregma. (B) Influence of intra-VTA injection of the presynaptic GABAB receptor antagonist CGP36216 on intra-VTA injection of morphine inducing an increase in locomotor activity. Left panel: time course of locomotor activity before and after intra-VTA injection of saline or morphine (1 μg/rat), or morphine (1 μg/rat) with CGP36216 (20 µg/rat) (n = 6 rats). Right panel: average distance traveled by rats during 120 min after treatment with an intra-VTA injection of saline or morphine (1 μg/rat), or morphine (1 μg/rat) with CGP36216 (20 µg/rat) (n = 6 rats; *p < 0.05, compared with intra-VTA injection of saline, #p < 0.05, compared with intra-VTA injection of morphine. (C) Influence of intra-VTA injection of the presynaptic GABAB receptor antagonist CGP36216 on intraperitoneal (i.p.) morphine-induced increase in locomotor activity. Left panel: time course of locomotor activity before and after intra-VTA injection of saline co-administered with either i.p. saline (1 ml/kg) or morphine (10 mg/kg), and i.p. morphine (10 mg/kg) with intra-VTA injection of CGP36216 (20 μg/rat) (n = 6 rats). Right panel: average distance traveled by rats during 120 min after treatment with intra-VTA injection of saline co-administered with either i.p. saline (1 ml/kg) or morphine (10 mg/kg), and i.p. morphine (10 mg/kg) with intra-VTA injection of CGP36216 (20 μg/rat) (n = 6; *p < 0.05, compared with intra-VTA injection of saline co-administered with i.p. saline, #p < 0.05, compared with intra-VTA injection of saline co-administered with i.p. morphine). Data are shown as the mean ±s.e.m.
Figure 12
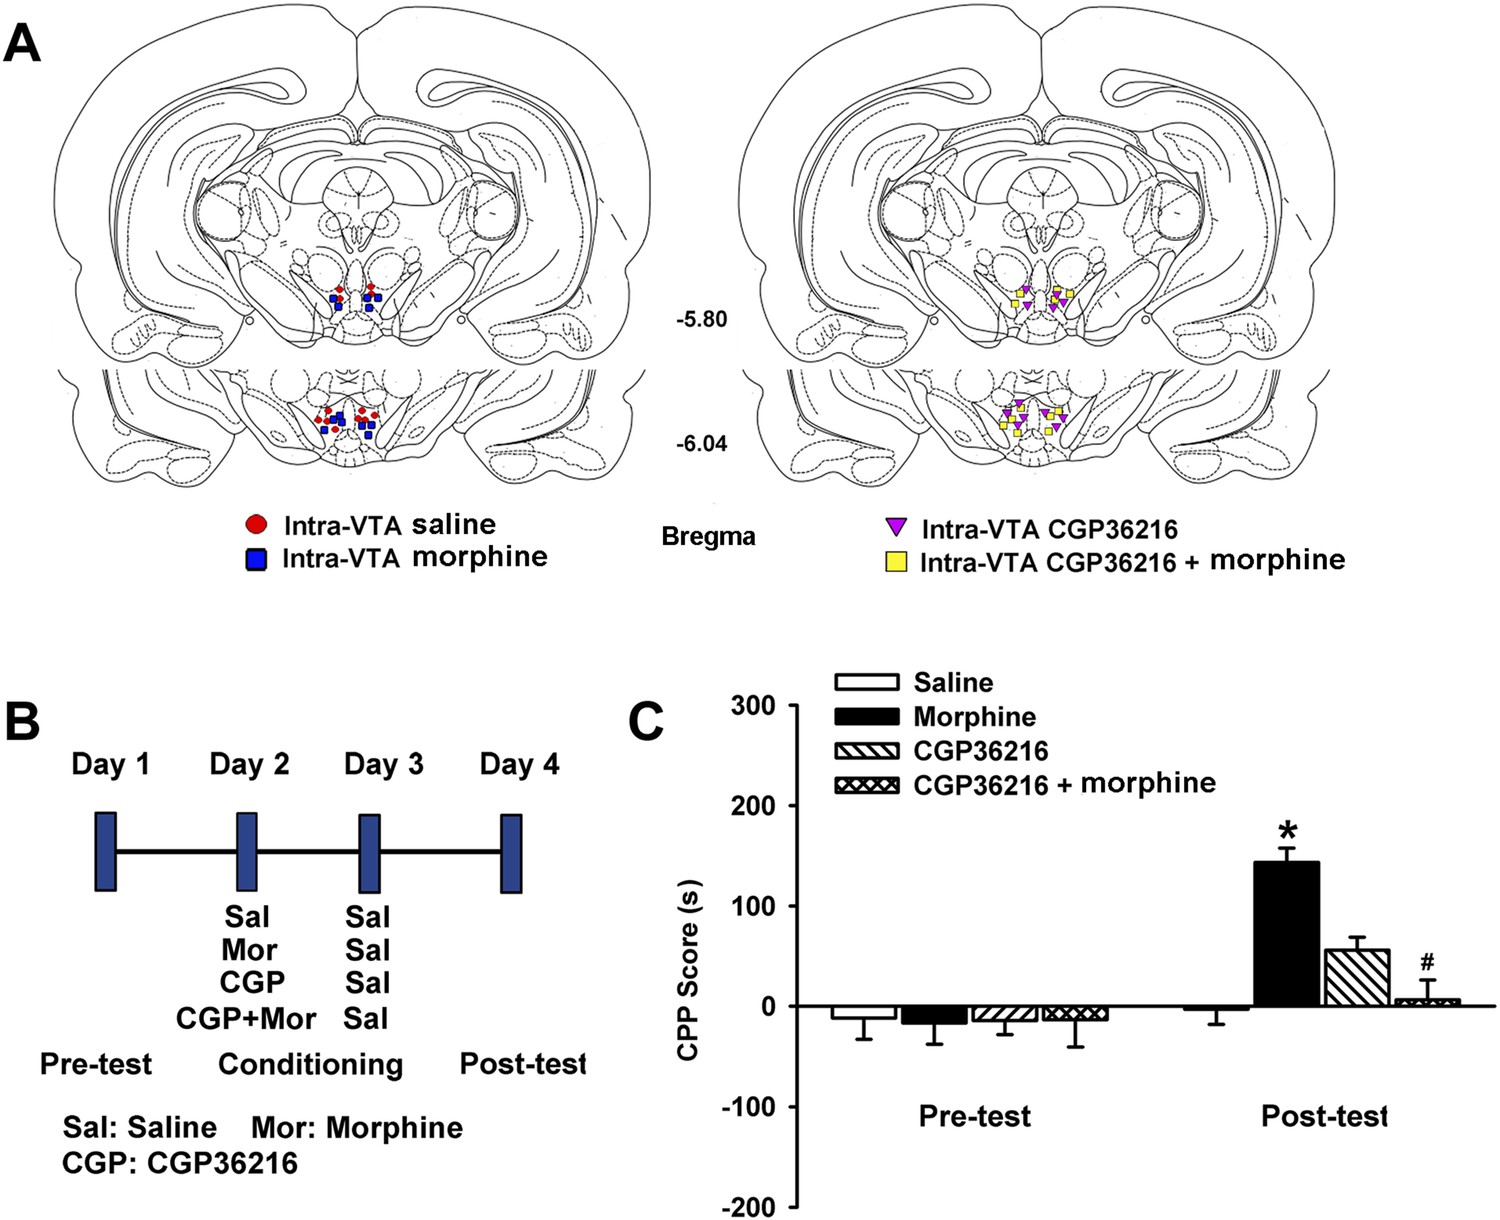
Influence of intra-ventral tegmental area (VTA) injection of the presynaptic GABAB receptor antagonist CGP36216 on intra-VTA injected morphine-induced conditioned place preference (CPP) in rats.
(A) Schematic representations of injection cannula tips in the VTA of rats used in data analyses. Numbers indicate coordinates relative to bregma. (B) A schematic of the experimental design for CPP and administration of drugs. (C) Influence of the presynaptic GABAB receptor antagonist CGP36216 on morphine-induced CPP in rats. Averaged CPP score of preconditioning and postconditioning in different groups (n = 6 rats in the every group; *p < 0.05, intra-VTA injection of morphine group compared with intra-VTA injection of saline group, #p < 0.05, intra-VTA injection of morphine plus CGP36216 group compared with intra-VTA injection of morphine group). Data are shown as the mean ±s.e.m.
Author response image 1

Effect of GABA on the frequency of sEPSCs and the influence of GABAB receptor antagonist CGP54626 on the effect of GABA on the frequency of sEPSCs in VTA-DA neurons of mice.
(A) Effect of GABA on the frequency of sEPSCs in VTA-DA neurons. Left panel: Typical current traces of sEPSC before and after GABA (10 μM). Middle panel: Time course of the frequency of sEPSCs before and after GABA (10 μM). Right panel: Average frequency of sEPSCs before and after GABA (10 μM) (n = 6, P < 0.05, compared to control before GABA). (B) Influence of GABAB receptor antagonist CGP54626 on the effect of GABA. Left panel: Typical current traces of sEPSC before and after GABA (10 μM) in the presence of CGP54626 (2 μM). Middle panel: Time course of the frequency of sEPSCs before and after GABA (10 μM) in the presence of CGP54626 (2 μM). Right panel: Average frequency of sEPSCs before and after GABA (10 μM) in the presence of CGP54626 (2 μM) (n = 6, P > 0.05, compared to CGP54626 before GABA).
Author response image 2
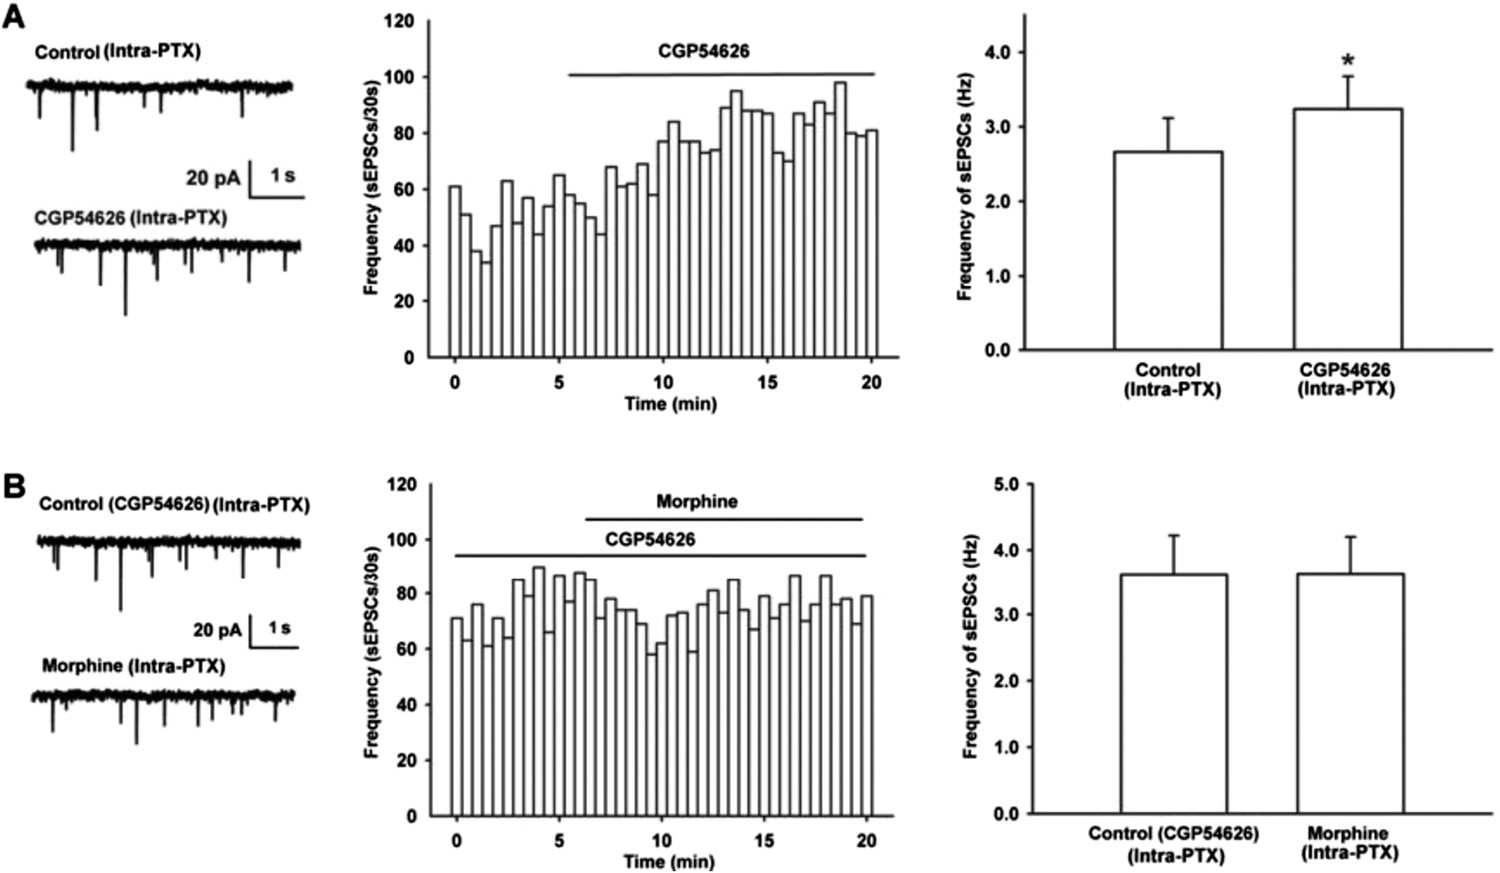
Effect of GABAB receptor antagonist CGP54626 on the frequency of sEPSCs and its influence of on the effect of morphine on the frequency of sEPSCs in VTA-DA neurons of mice.
(A) Effect of GABAB receptor antagonist CGP54626 on the frequency of sEPSCs in VTA-DA neurons. Left panel: Typical current traces of sEPSC before and after CGP54626 (2 μM). Middle panel: Time course of the frequency of sEPSCs before and after CGP54626 (2 μM). Right panel: Average frequency of sEPSCs before and after CGP54626 (2 μM) (n = 6, P < 0.05, compared to control before CGP54626). (B) Influence of GABAB receptor antagonist CGP54626 on the effect of morphine on the frequency of sEPSCs in VTA-DA neurons. Left panel: Typical current traces of sEPSC before and after morphine (10 μM) in the presence of CGP54626 (2 μM). Middle panel: Time course of the frequency of sEPSCs before and after morphine (10 μM) in the presence of CGP54626 (2 μM). Right panel: Average frequency of sEPSCs before and after morphine (10 μM) in the presence of CGP54626 (2 μM) (n = 6, P > 0.05, compared to CGP54626 before morphine).
Author response image 3
Influence of selective presynaptic GABAB receptor antagonist CGP36216 on the effect of morphine on the firing in VTA-DA neurons of mice.
(A) Representative spontaneous firing traces recorded before and after morphine (10 μM) in the presence of CGP36216 (100 μM). (B) Time course of spontaneous firing before and after morphine in the presence of CGP36216 (100 μM) (n = 6). (C) Average frequency of spontaneous firing before and after morphine (10 μM) in the presence of CGP36216 (100 μM) (n = 6, P > 0.05, compared to CGP36216 before morphine).
Download links
A two-part list of links to download the article, or parts of the article, in various formats.
Downloads (link to download the article as PDF)
Open citations (links to open the citations from this article in various online reference manager services)
Cite this article (links to download the citations from this article in formats compatible with various reference manager tools)
Morphine disinhibits glutamatergic input to VTA dopamine neurons and promotes dopamine neuron excitation
eLife 4:e09275.
https://doi.org/10.7554/eLife.09275


