Sequential selection of economic good and action in medial frontal cortex of macaques during value-based decisions
- Johns Hopkins University, United States
- Johns Hopkins University School of Medicine, United States
Figures
Figure 1

Architecture of different decision models.
(A, B) Goods- and action-based models envision the important selection step during value-based decisions to be either at the value (A) or action (B) representation stage. (C, D) The other two models presume that important selection processes occur at both the value and the action representation stage. However, they differ in their underlying architecture and in the resulting pattern of activity across the network as it unfolds in time. (C) The distributed consensus model assumes reciprocal interactions between the value and the action representation. These reciprocal interactions allow the action selection to influence the simultaneous ongoing value selection. The selection of the chosen good and action proceeds therefore in parallel. (D) In contrast, the sequential model assumes that there are no meaningful functional reciprocal connections from the action to the value representation. Because of this the action value representations cannot influence the value selection process, which has to finish first, before the action selection can begin. Thus, this decision architecture by necessity implies a sequential decision process. Red arrows indicate excitatory connections. Green buttons indicate inhibitory connections. Thickness of the connection indicates relative strength of the neural activity.
Figure 2 with 1 supplement
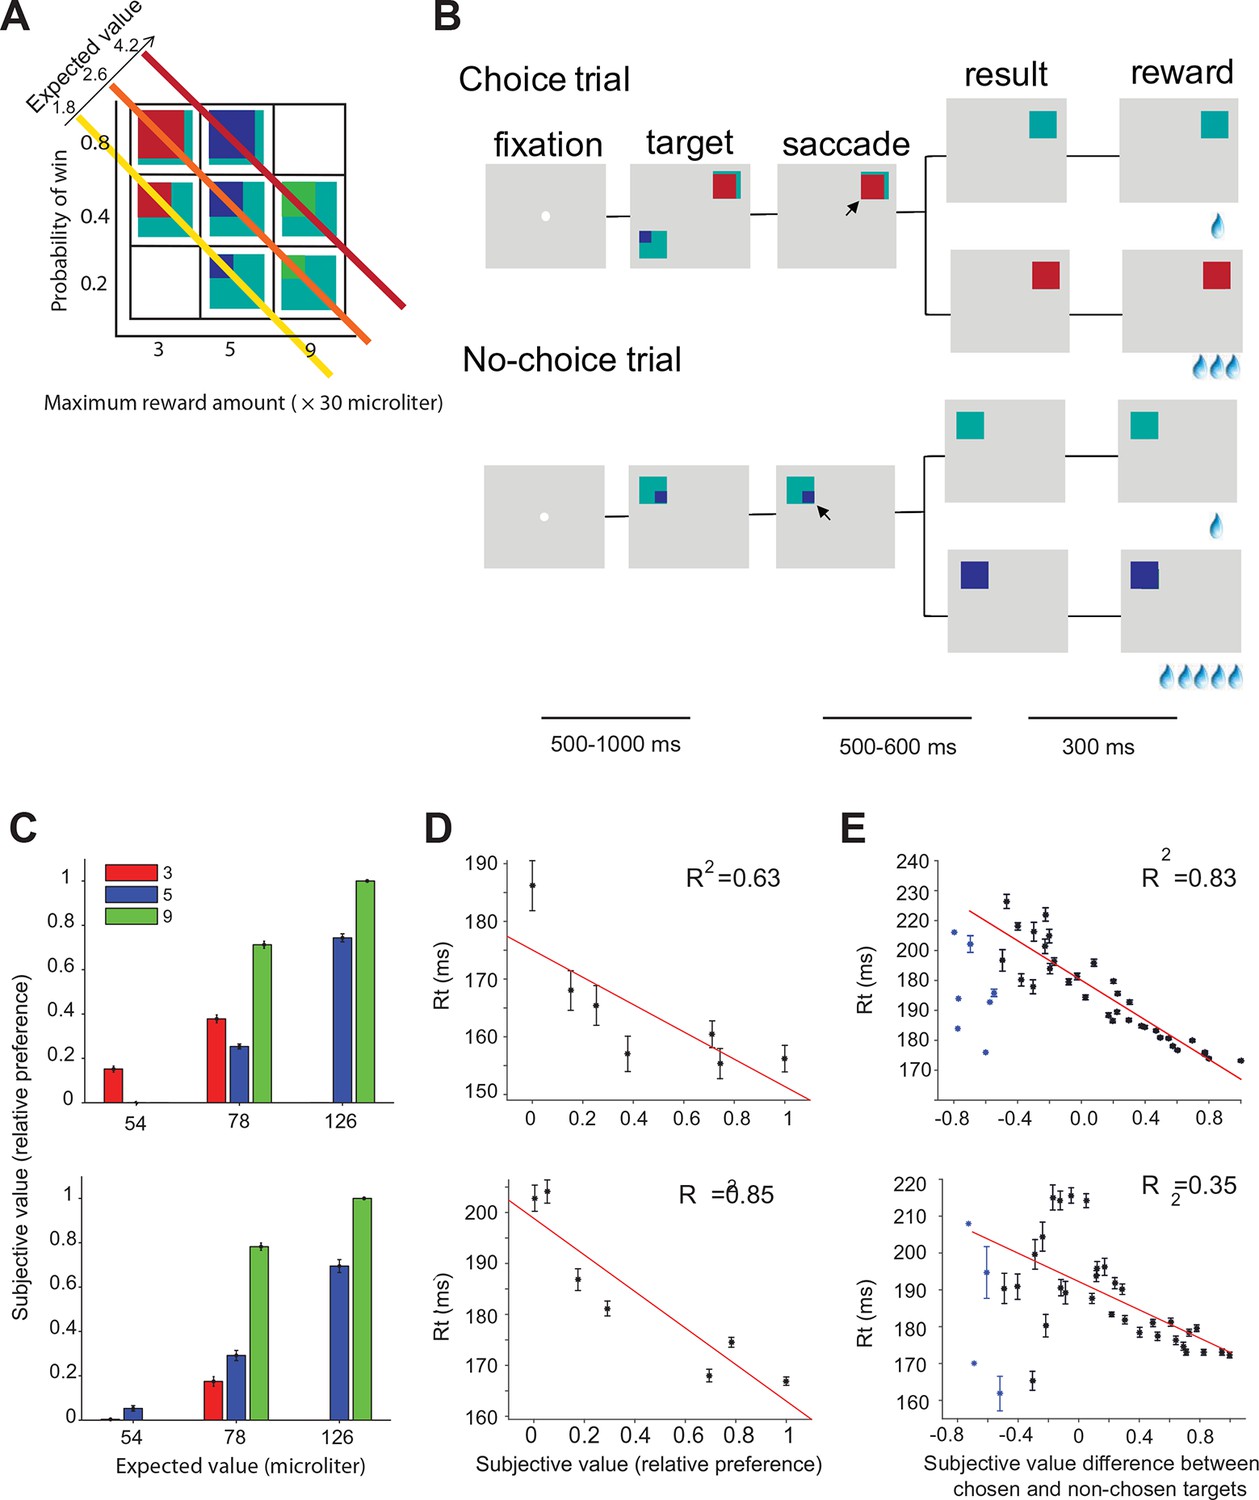
Oculomotor gambling task and behavioral results.
(A) Visual cues used in the gambling task. Four different colors (cyan, red, blue, and green) indicated four different reward amounts (increasing from 1, 3, 5 to 9 units of water, where 1 unit equaled 30 µl). The expected value of the gamble targets along the diagonal axis was the same. For example, the expected value of the bottom right green/cyan target is: 9 units (maximum reward) x 0.2 (maximum reward probability) + 1 unit (minimum reward) x 0.8 (minimum reward probability) = 2.6 units. (B) Sequence of events during choice trials (top) and no-choice trials (bottom). The lines below indicate the duration of various time periods in the gambling task. The black arrow is not part of the visual display; it indicates the monkeys' choices. (C–E) Behavioral results for monkey A (top) and monkey I (bottom). (C) The mean subjective value of the seven gamble options is plotted as a function of expected value. Different colors indicate different amounts of maximum reward. (D) The mean reaction times in no-choice trial as a function of subjective value. (E) The mean reaction times in choice trial as a function of subjective value differences between chosen and non-chosen targets.
Figure 2—figure supplement 1
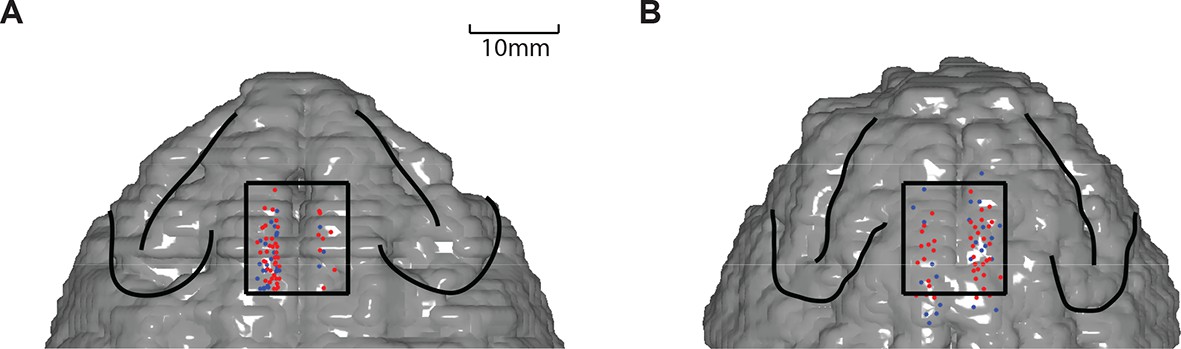
Recording locations in SEF.
Red dots indicate the locations in which neurons showed task related activity before saccade onset. Blue dots indicate the locations in which neurons were not modulated by task before saccade onset. (A) Recording sites in monkey A. (B) Recording sites in monkey I. SEF, supplementary eye field.
Figure 3 with 1 supplement
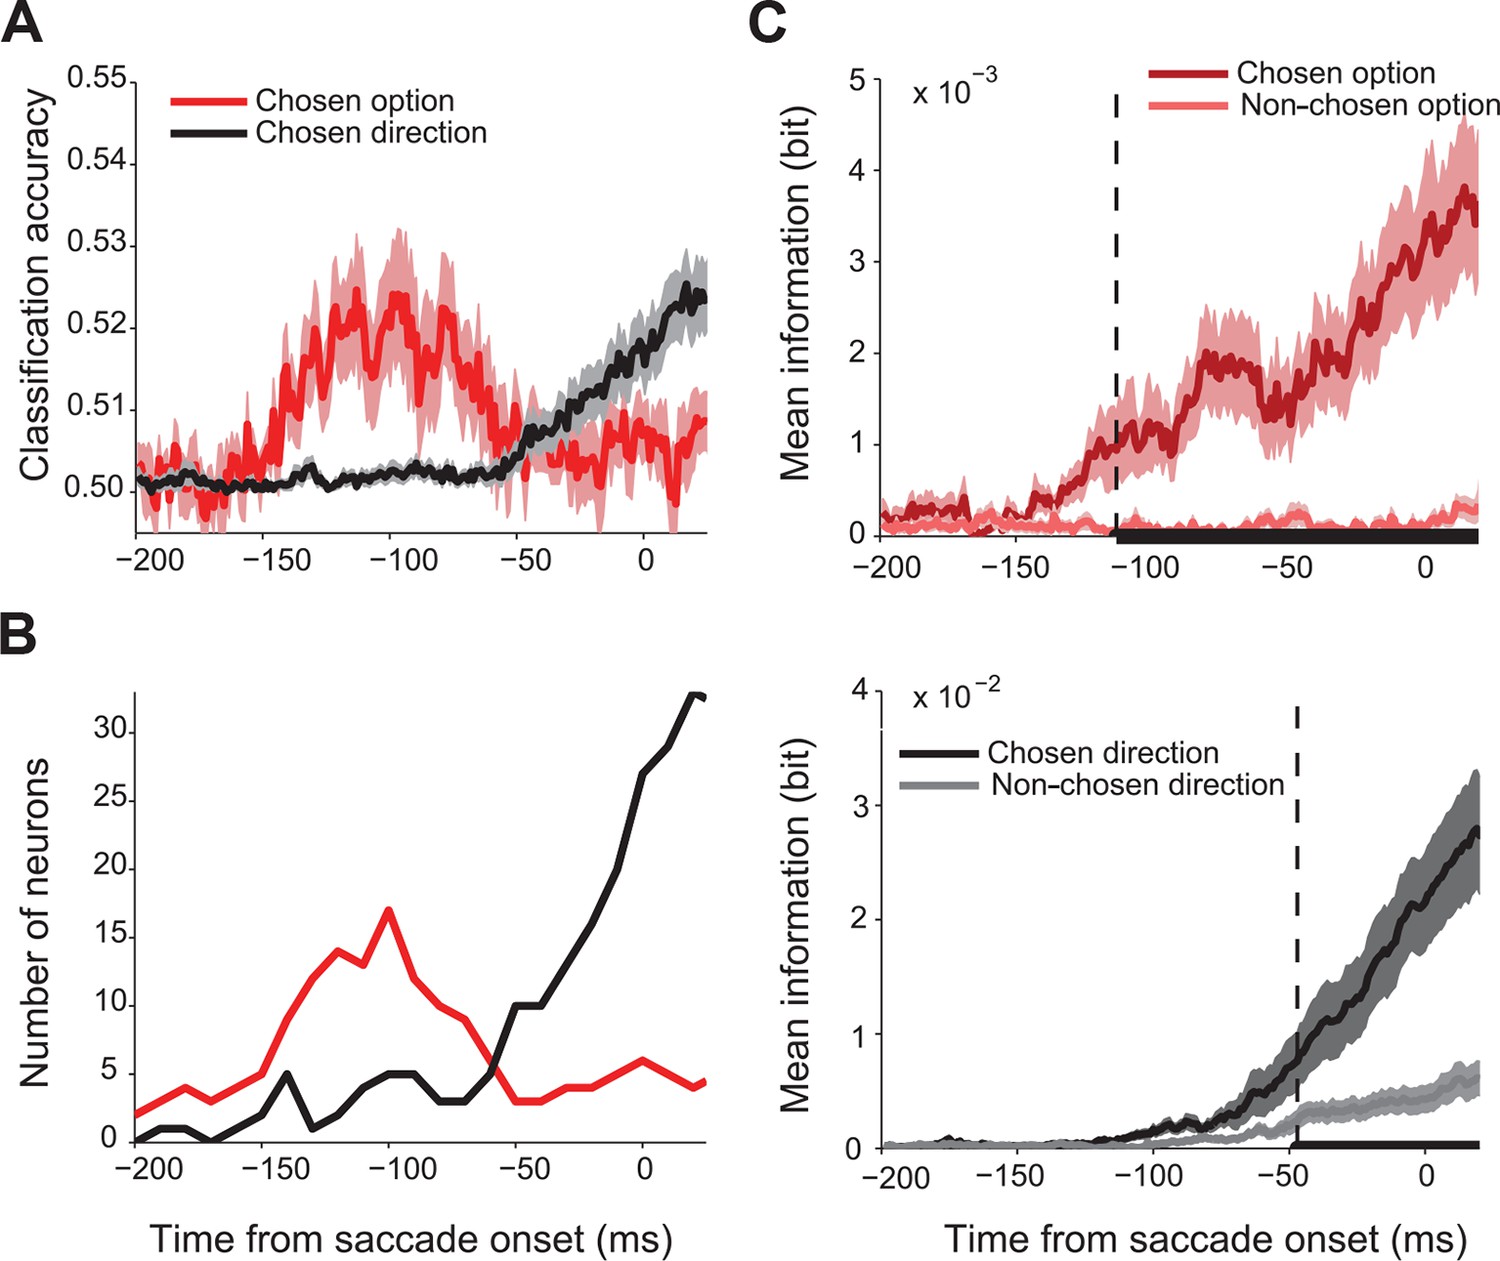
Time course of chosen gamble option and saccade direction representation in SEF.
(A) Significant classification accuracy for chosen gamble option (red) and chosen saccade direction (black) across 128 neurons. We excluded values that were not significantly different from chance (permutation test; p≤0.05). (B) Number of neurons showing significant classification accuracy for chosen gamble option (red) and chosen saccade direction (black). (C) Average mutual information between SEF activity and chosen and non-chosen gamble option (top panel; dark and light red) and saccade direction (bottom panel; dark and light grey). The time period when the amount of information about chosen and non-chosen option/direction was significantly different (paired t-test adjusted for multiple comparisons, p≤0.05) are indicated by the thick black line at the bottom of the plots. The onset of a significant difference is indicated by the vertical dashed line. SEF, supplementary eye field.
Figure 3—figure supplement 1
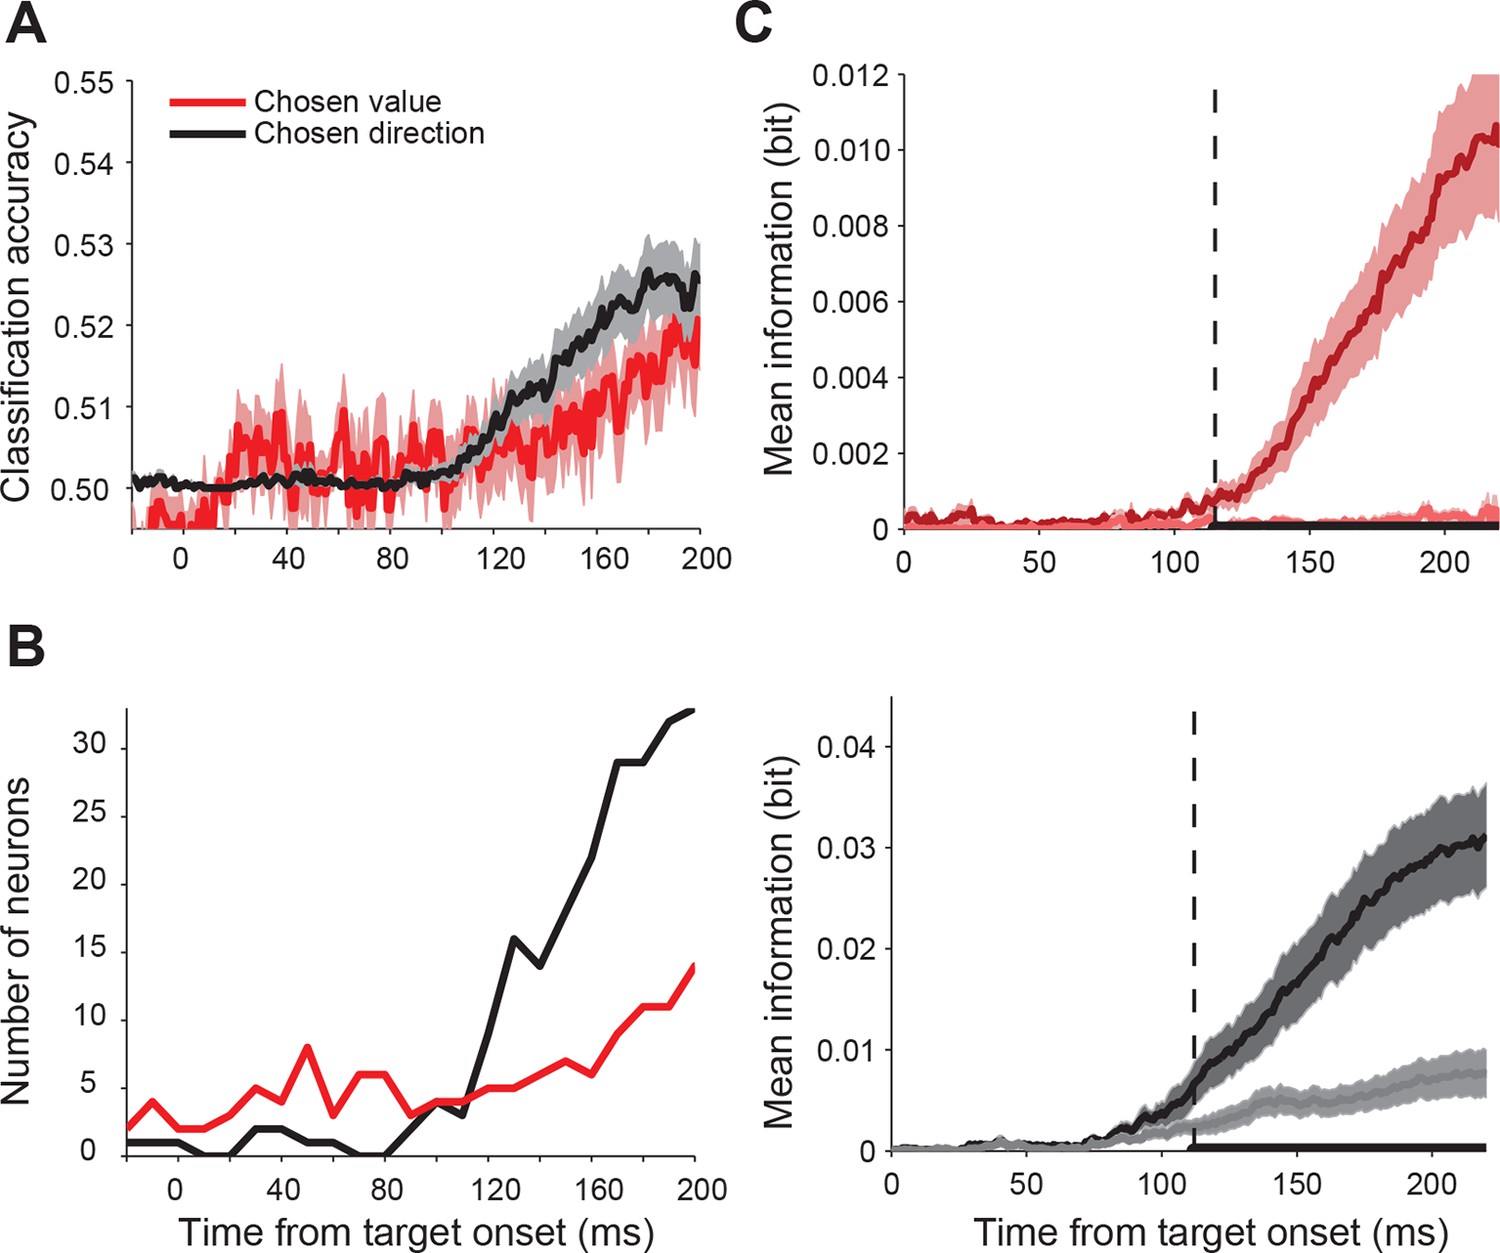
Time course of value and saccade direction representation in SEF aligned on target onset.
In our gamble task, the monkey was free to indicate his choice as soon as he was ready. Because of this design feature, the saccade onset is likely to be closer aligned with the conclusion of the decision process than target onset. The fact that reaction time reflected chosen value and non-chosen value difference (i.e. choice difficulty), as indicated in Figure 2, further confirms this idea. In the main text, we analyzed therefore the neural activity aligned on movement onset, because it likely reflects the dynamic of the decision process more accurately. The analysis of the neural activity aligned on target onset further confirms this conclusion. (A) Average significant classification accuracy for chosen value (red) and chosen direction (black) across 128 neurons. The decoding analysis shows that the SEF activity predicts chosen value early in the trial, but only weakly and over a widely spread out time period. Only late in the trial did the prediction accuracy of the chosen value increase. At this stage, the prediction of the saccade direction had already begun to increase. (B) Number of neurons showing significant classification accuracy for chosen value (red) and chosen direction (black). The time course of the number of neurons with significant predictions shows a similar pattern, which likely reflects the variable relationship between target onset and decision making. (C) Average mutual information between SEF activity and chosen and non-chosen value (top panel; dark and light red) and saccade direction (bottom panel; dark and light grey). Note that the onset of significant levels of chosen value and direction signals in the population are both late relative to target onset and nearly simultaneous. The time period when the amount of information about chosen and non-chosen direction/value was significantly different are indicated by the thick black line at the bottom of the plots. The onset of a significant difference is indicated by the vertical dashed line. The shaded areas represent SEM. Compare this figure with Figure 3 in the main text. SEF, supplementary eye field.
Figure 4 with 4 supplements
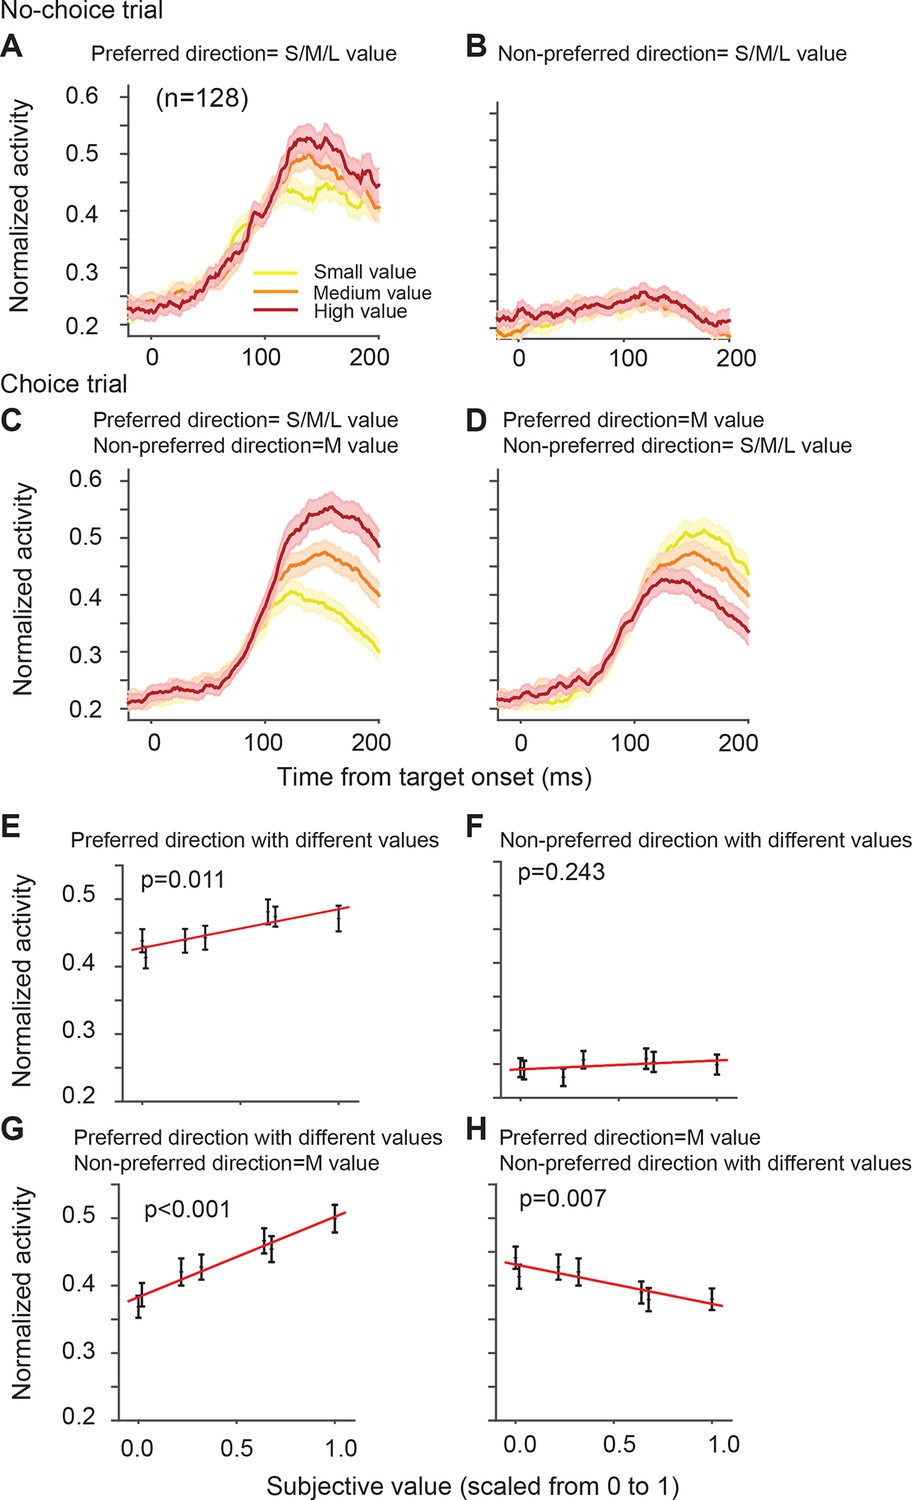
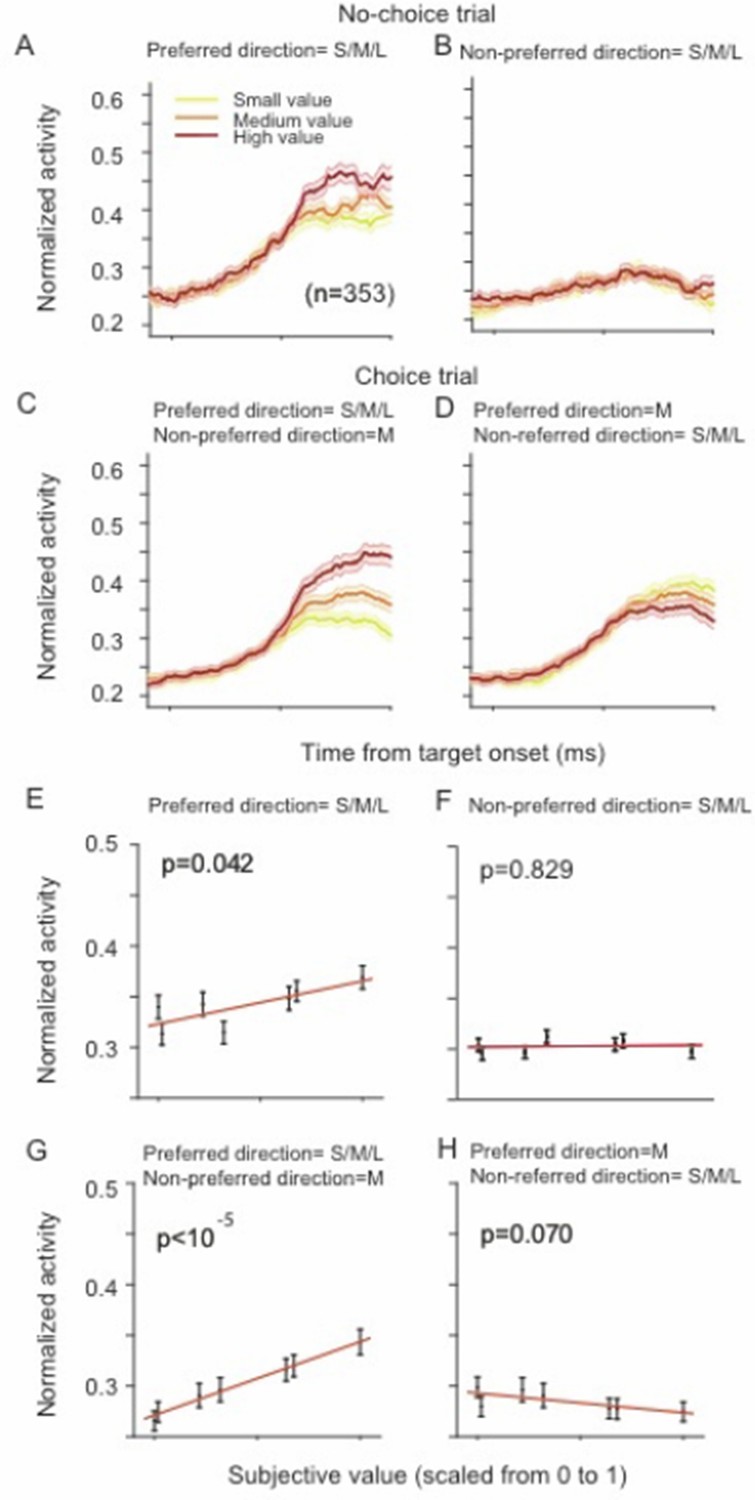
SEF neurons represent the difference in action value associated with targets in the preferred and non-preferred direction.
The neural activity of 128 directionally tuned SEF neurons was normalized and compared across trials with different values of targets in the preferred or non-preferred direction. (A) The neural activity in no-choice trials, when the target was in the preferred direction. (B) The neural activity in no-choice trials, when the target was in the non-preferred direction. (C, D) The neural activity in choice trials. To visualize the contrasting effect of targets in the preferred or non-preferred direction on neural activity, the value of one of the targets was held constant, while the value of the other target was varied. Activity was sorted by target value, but not by saccade choice. (C) The neural activity, when the value of the target in the preferred direction varied, while the value of the target in the non-preferred direction was held constant at a medium value. (D) The neural activity, when the value of the target in the non-preferred direction varied, while the value of the target in the preferred direction was held constant at a medium value. The color of the spike density histograms indicates the target value [high value = 6–7 units (red line); medium value = 3–5 units (orange line); low value = 1–2 units (yellow line)]. (E-H) The regression analysis corresponding to (A-D). A t-test was used to determine whether the regression coefficients were significantly different from 0. The regression coefficients, confidence intervals, t-values, and p-values are listed in Table 1. SEF, supplementary eye field.
Figure 4—figure supplement 1
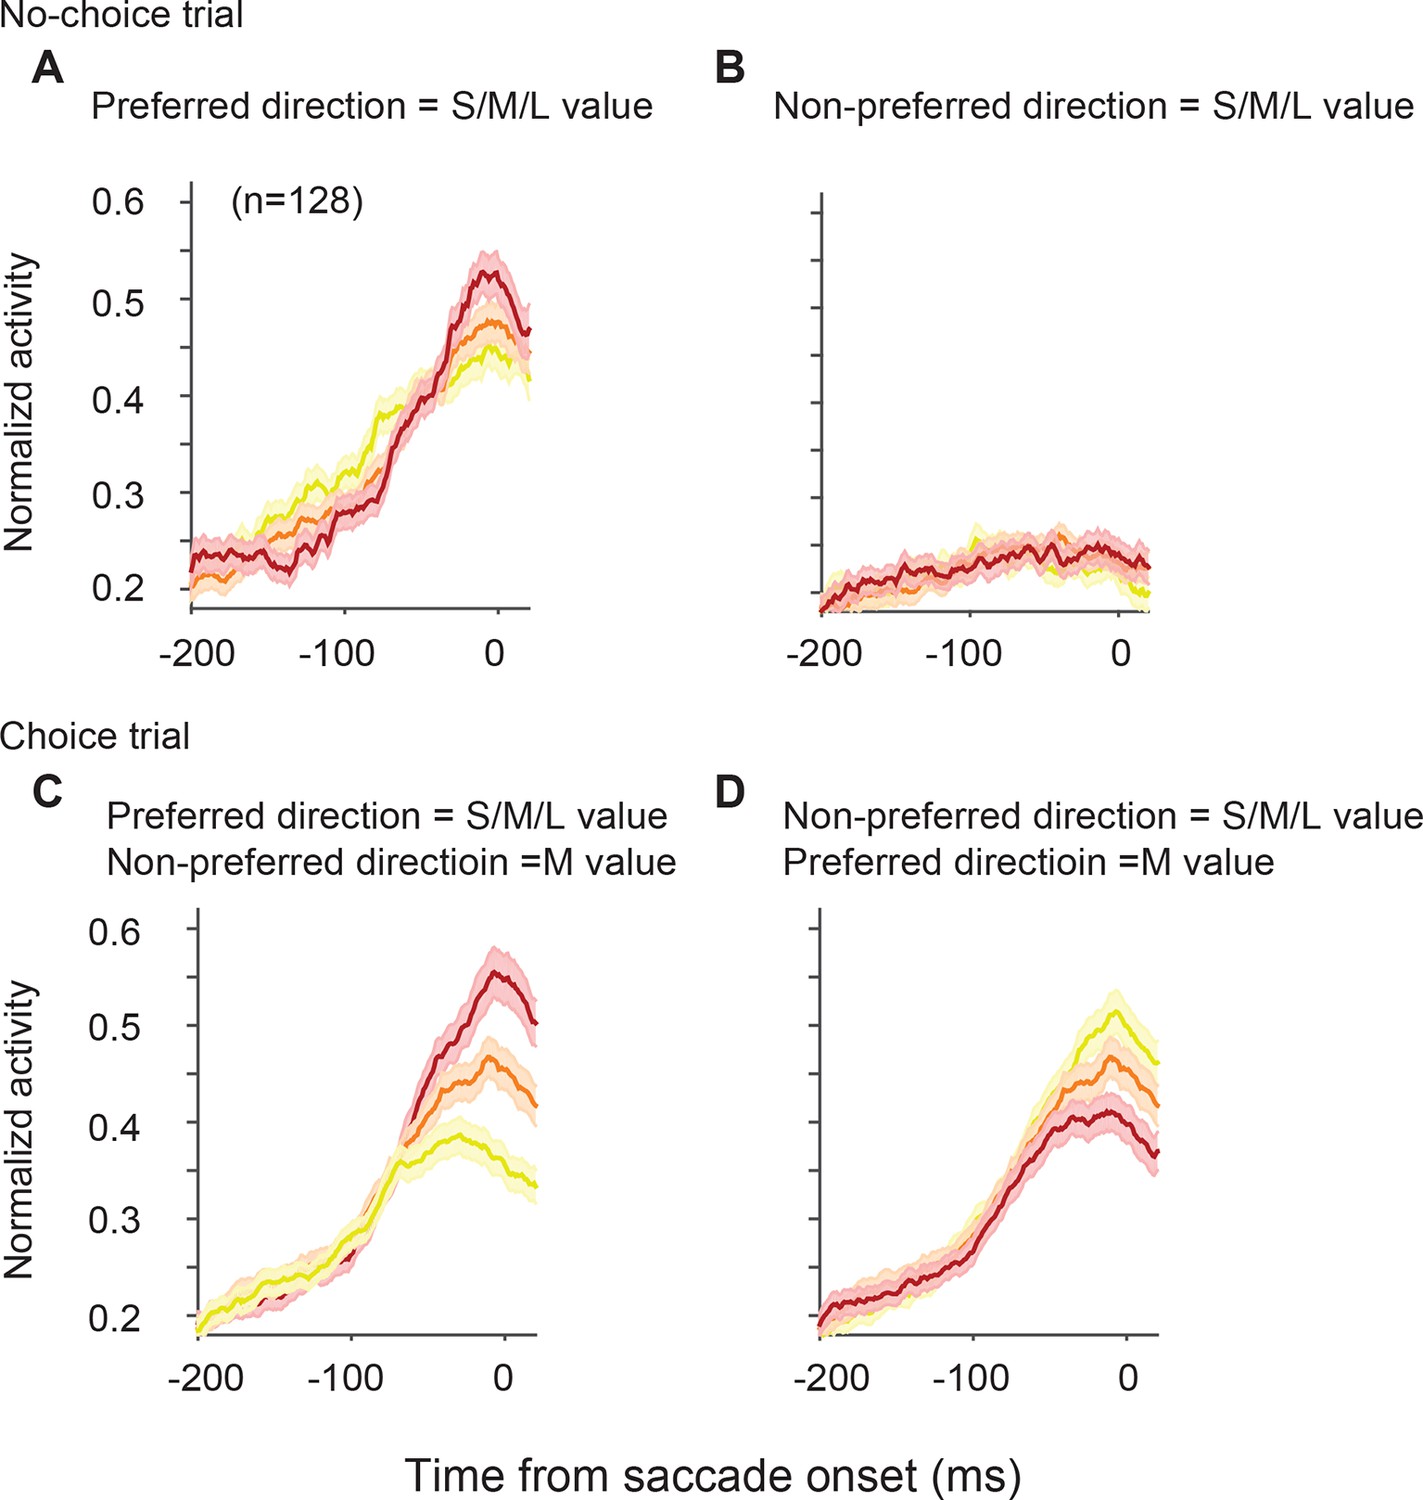
SEF neurons represent the difference in value of targets in the preferred and non-preferred direction.
All activity is aligned on saccade onset. (A) The neural activity in no-choice trials, when the target was in the preferred direction. (B) The neural activity in no-choice trials, when the target was in the non-preferred direction. (C, D) The neural activity in choice trials. To visualize the contrasting effect of targets in the preferred or non-preferred direction on neural activity, the value of one of the targets was held constant, while the value of the other target was varied. Activity was sorted by target value, but not by saccade choice. (C) The neural activity, when the value of the target in the preferred direction varied, while the value of the target in the non-preferred direction was held constant at a medium value. (D) The neural activity, when the value of the target in the non-preferred direction varied, while the value of the target in the preferred direction was held constant at a medium value. The color of the spike density histograms indicates the target value [high value = 6–7 units (red line); medium value = 3–5 units (orange line); low value = 1–2 units (yellow line)]. SEF, supplementary eye field.
Figure 4—figure supplement 2
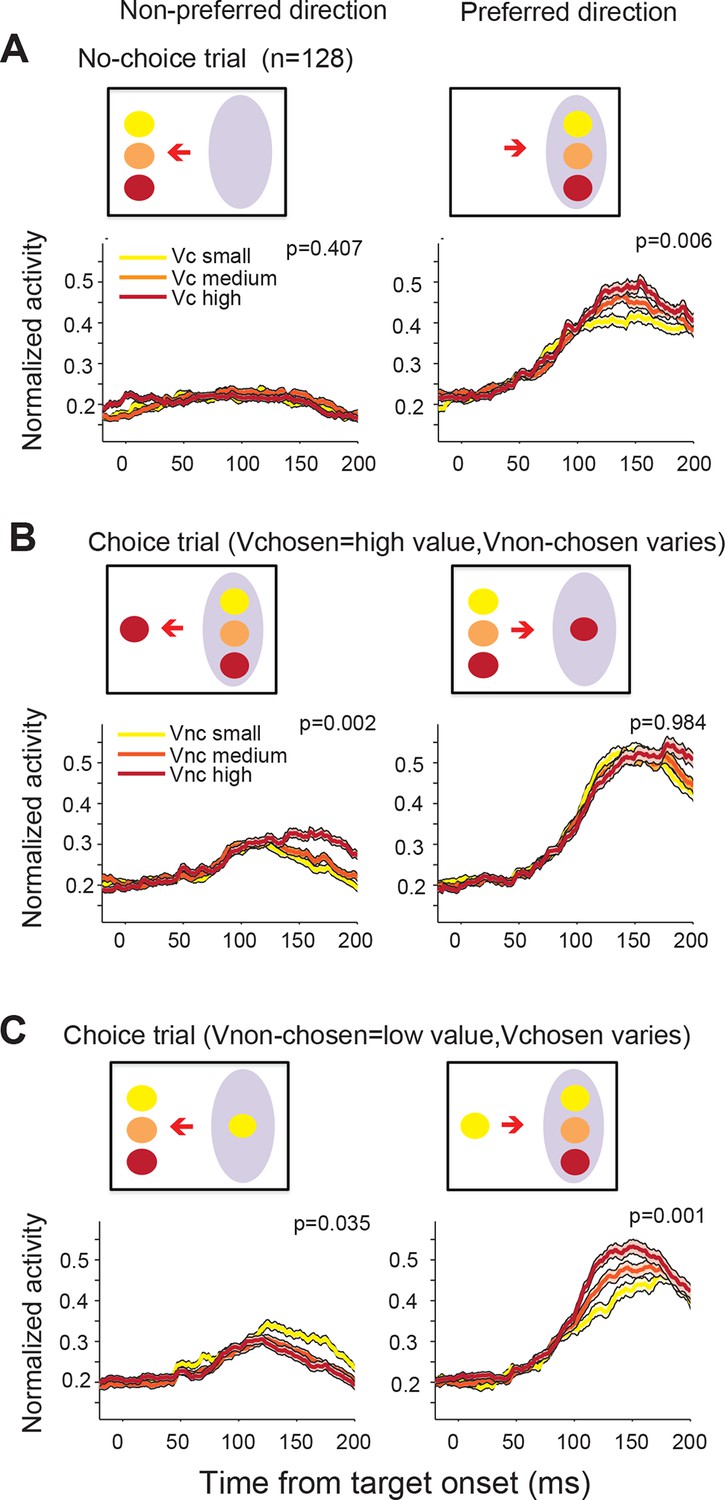
SEF neurons represent the difference in value of targets in the preferred (PD) and non-preferred direction (NPD) independent of the chosen saccade direction.
This figure shows the normalized activity of SEF neurons sorted by chosen saccade direction (PD: right; NPD: left) and value of the chosen or non-chosen target. We grouped the subjective value of the reward options into three groups (red: high value; orange: medium value; yellow: low value). The inset above the histograms indicates the location and value of the targets in the trials shown in the histograms below. The grey oval indicates the location of the preferred direction of the neuron, while the arrow indicates the chosen saccade direction. The p-values indicate the significance of a regression using all seven individual target values without grouping. The shaded areas represent standard error of the mean (SEM). (A) The neural activity in no-choice trials. The color of the spike density histograms indicates the target value. As shown in Figure 4A,B, the neurons reflect the value of the PD target, but not of the NPD target. (B) The neural activity in those choice trials, in which the chosen target had the highest possible value (7 units). We chose this reference point, instead of a medium value (as in Figure 4D), because it allowed us to a comparison with the widest possible range of non-chosen target values (indicated by the color of the spike density histograms: high value = 5–6 units; medium value = 3–4 units; low value = 1–2 units). (C) The neural activity in those choice trials, in which the non-chosen target had the lowest possible value (1 unit). Again, this reference point allowed for the widest possible range of chosen target values (indicated by the color of the spike density histograms: high value = 6–7 units; medium value = 4–5 units; low value = 2–3 units). Consistent with Figure 4 in the main text, we can observe that increasing PD target value increases neuronal activity (B: left panel; C: right panel), while increasing NPD target value decreases neuronal activity (C: left panel). This is true, whether the PD or the NPD target is chosen. However, the value of the chosen target has a stronger influence than the non-chosen one, and in the extreme case, when the PD target has the highest possible value and is chosen, the NPD value has no longer a significant effect on the neural activity (B: right panel).
Figure 4—figure supplement 3
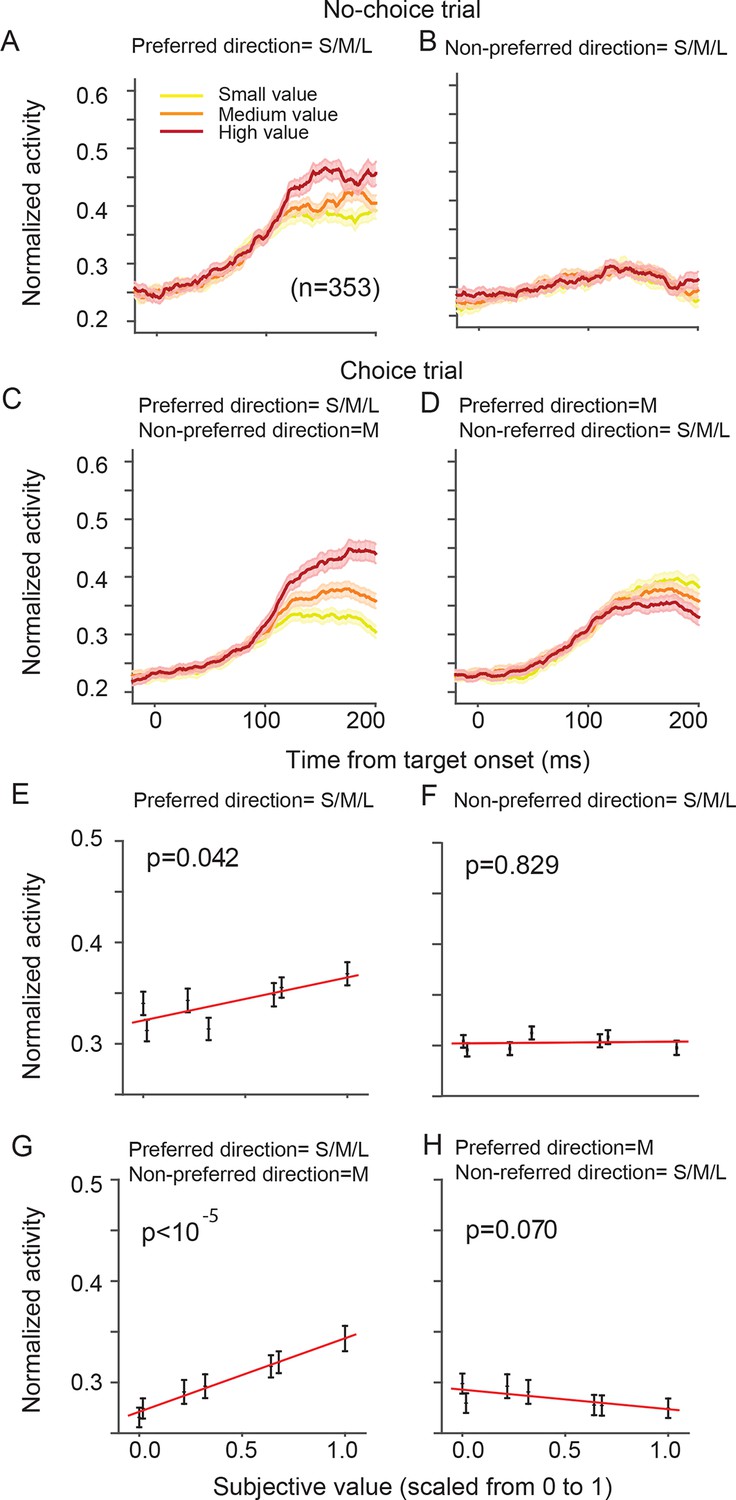
SEF neurons represent the difference in action value associated with targets in the preferred and non-preferred direction.
This analysis is the exact equivalent of the one shown in Figure 4, but here we analyzed the neural activity of all 353 task-related SEF neurons. The neuronal activity was normalized and compared across trials with different values of targets in the preferred or non-preferred direction. (A) The neural activity in no-choice trials, when the target was in the preferred direction. (B) The neural activity in no-choice trials, when the target was in the non-preferred direction. (C) The neural activity, when the value of the target in the preferred direction varied, while the value of the target in the non-preferred direction was held constant at a medium value. (D) The neural activity, when the value of the target in the non-preferred direction varied, while the value of the target in the preferred direction was held constant at a medium value. The color of the spike density histograms indicates the target value [high value = 6–7 units (red line); medium value = 3–5 units (orange line); low value = 1–2 units (yellow line)]. (E-H) The regression analysis corresponding to (A-D). A t-test was used to determine whether the regression coefficients were significantly different from 0. SEF, supplementary eye field.
Figure 4—figure supplement 4
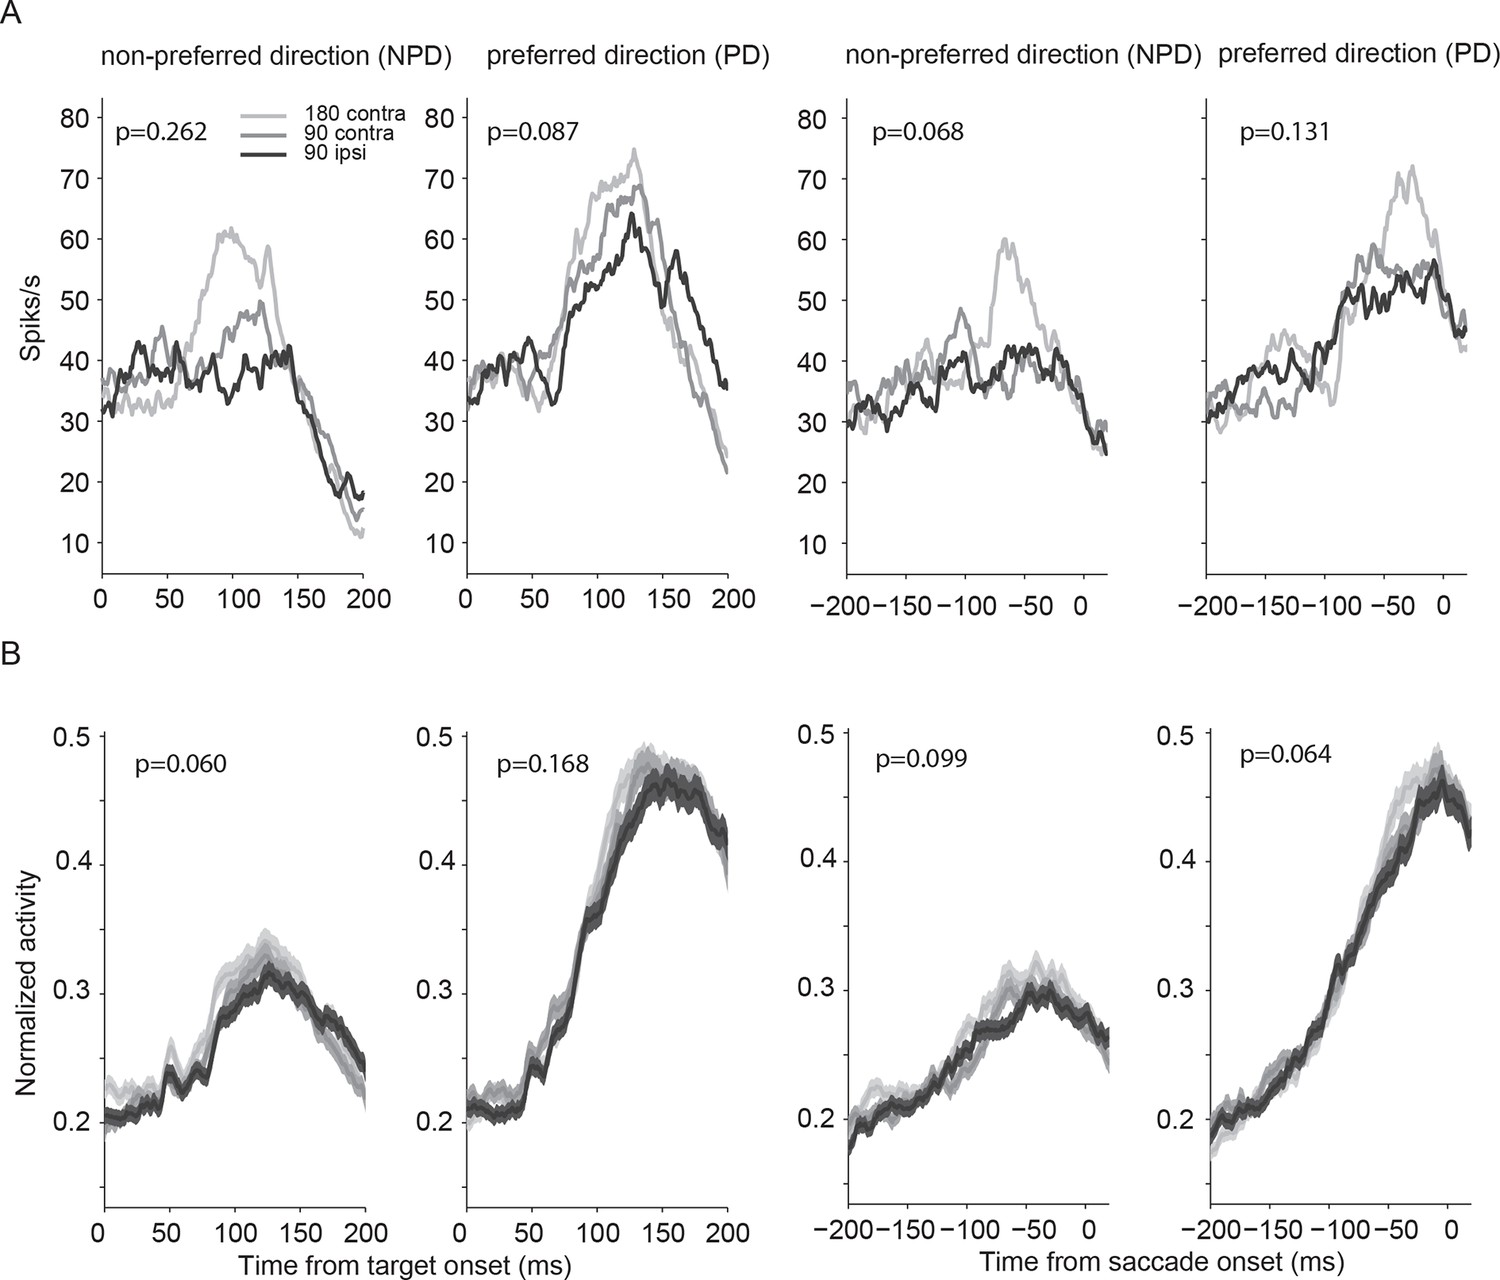
Neural activity modulated by the relative angle and position of the two targets.
(A) The activity of a representative neuron aligned on target (two left columns) and saccade onset (two right columns) averaged over all possible pairs of target values. The first column and third column show the conditions when the non-preferred direction was chosen, the second and forth column show the conditions when the preferred direction was chosen. The color of the lines indicate the angle between the targets and their relative position in the visual field. Independent of whether the chosen saccade is into the preferred or non-preferred direction, the neural activity is least affected by targets that are far away (light gray; 180° apart). However, for alternative targets that are closer to the location of the chosen target, the neuron shows reduced activity (medium gray; 90° apart, contralateral hemifield), in particular when the target is in the same hemi-field (black; 90° apart, ipsilateral hemi-field). This indicates that spatially distinct targets evoke inhibitory interactions among SEF neurons that become stronger the closer the targets are to each other, independent of their value. (B) Average neural activity across 128 neurons. The plots show the same inhibitory effect as the representative neuron. The shaded areas represent SEM. SEF, supplementary eye field; SEM, standard error of the mean.
Figure 5
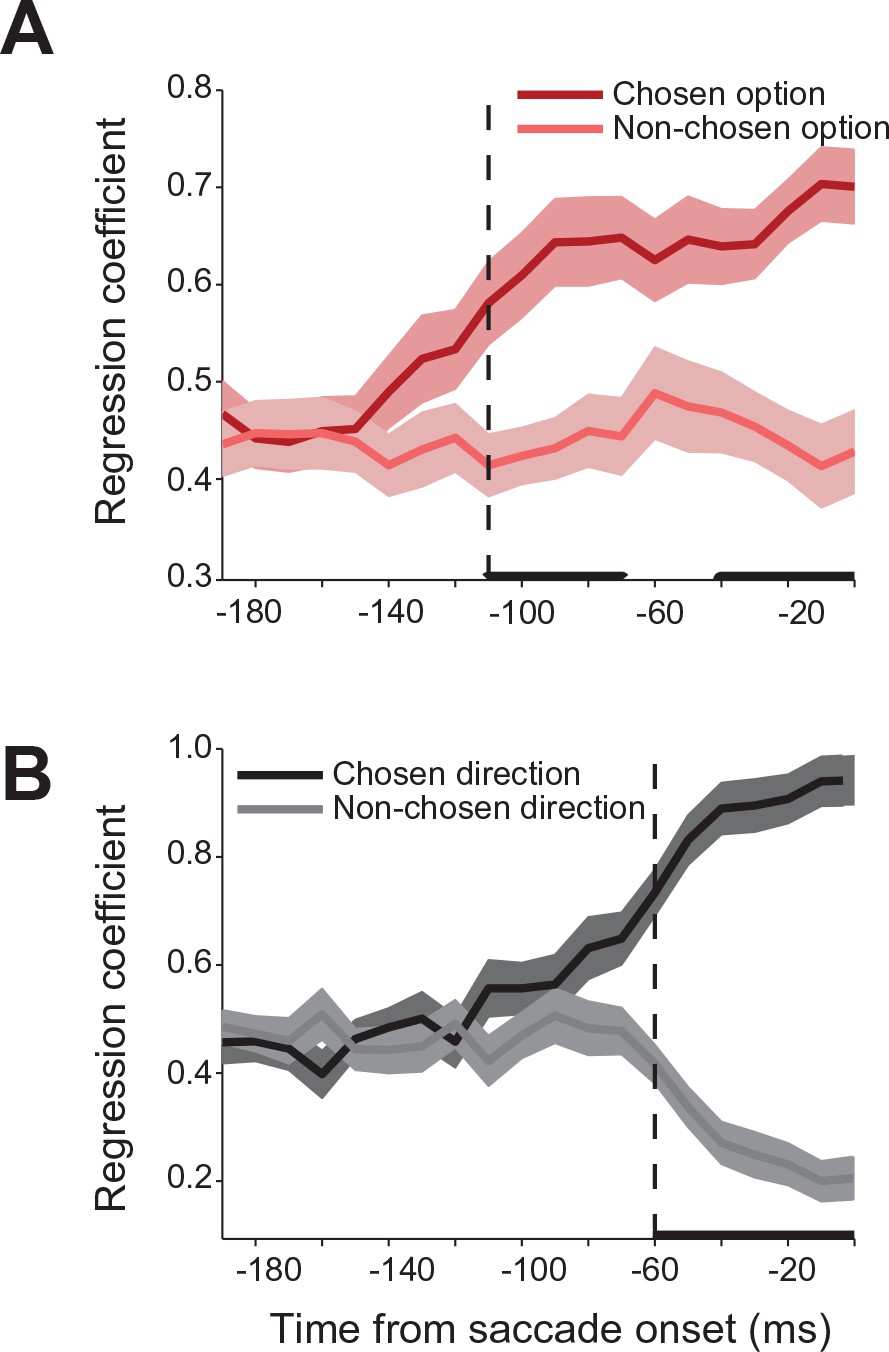
Relative influence of chosen and non-chosen target on SEF activity.
(A) Regression coefficients for chosen and non-chosen gamble options (dark and light red). (B) Regression coefficients for chosen and non-chosen saccade directions (dark and light grey). Time periods in which the regression coefficients for chosen and non-chosen option/direction are significantly different (paired t-test adjusted for multiple comparisons, p0.05) are indicated by a thick black line. The onset of a significant difference is indicated by a vertical dashed line. All panels are aligned on saccade onset. The shaded areas represent SEM. SEF, supplementary eye field; SEM, standard error of the mean.
Figure 6 with 1 supplement
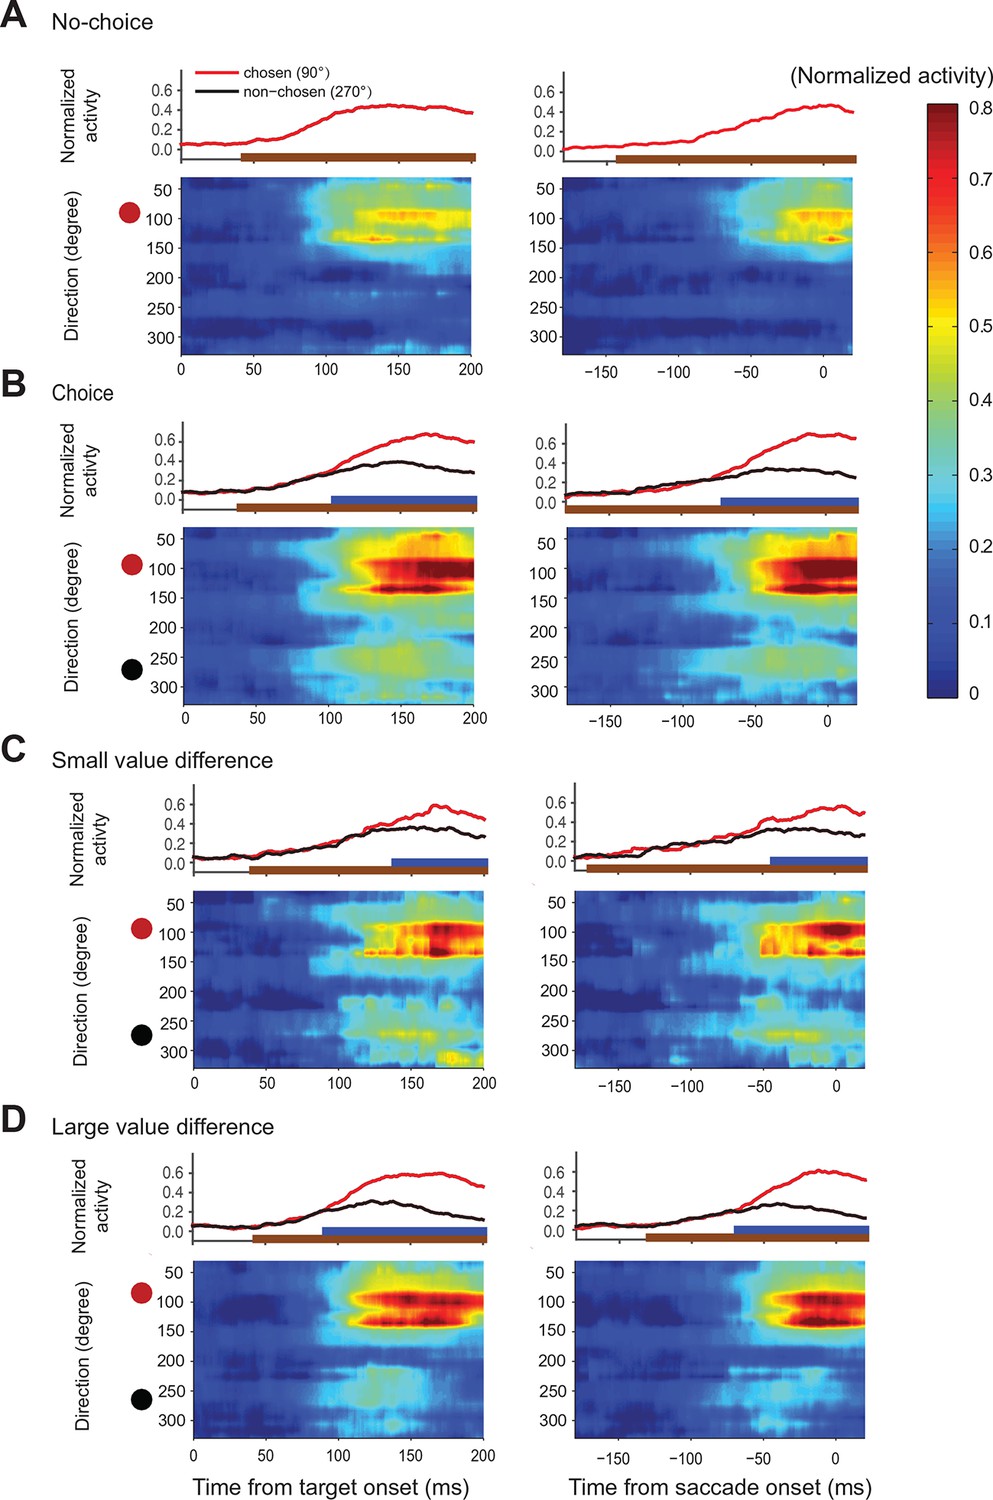
Action value maps showing population activity in SEF during decision making.
Each neuron’s activity was normalized across all trial conditions. The maps in the left column are aligned on target onset and the panels in the right column on saccade onset. In each map, horizontal rows represent the average activity of cells whose preferred direction lies at a given angle relative to the chosen target (red circle on left). Color indicates change in normalized firing rate relative to the background firing rate (scale on the right). (A) Population activity during no-choice (A) and choice trials (B). Population activity in choice trials divided into trials with small (C) and (D) large value differences between the reward options. The subplots above the action value maps show the time course of the neural activity associated with the chosen (45–135°) and non-chosen (225–315°) target. The brown lines underneath show the time when population activities were significantly different than the baseline (permutation test adjusted for multiple comparisons). The blue lines underneath show the time when the neural activities associated with the chosen target were significantly different from those associated with the non-chosen target (permutation test adjusted for multiple comparisons). SEF, supplementary eye field.
Figure 6—figure supplement 1
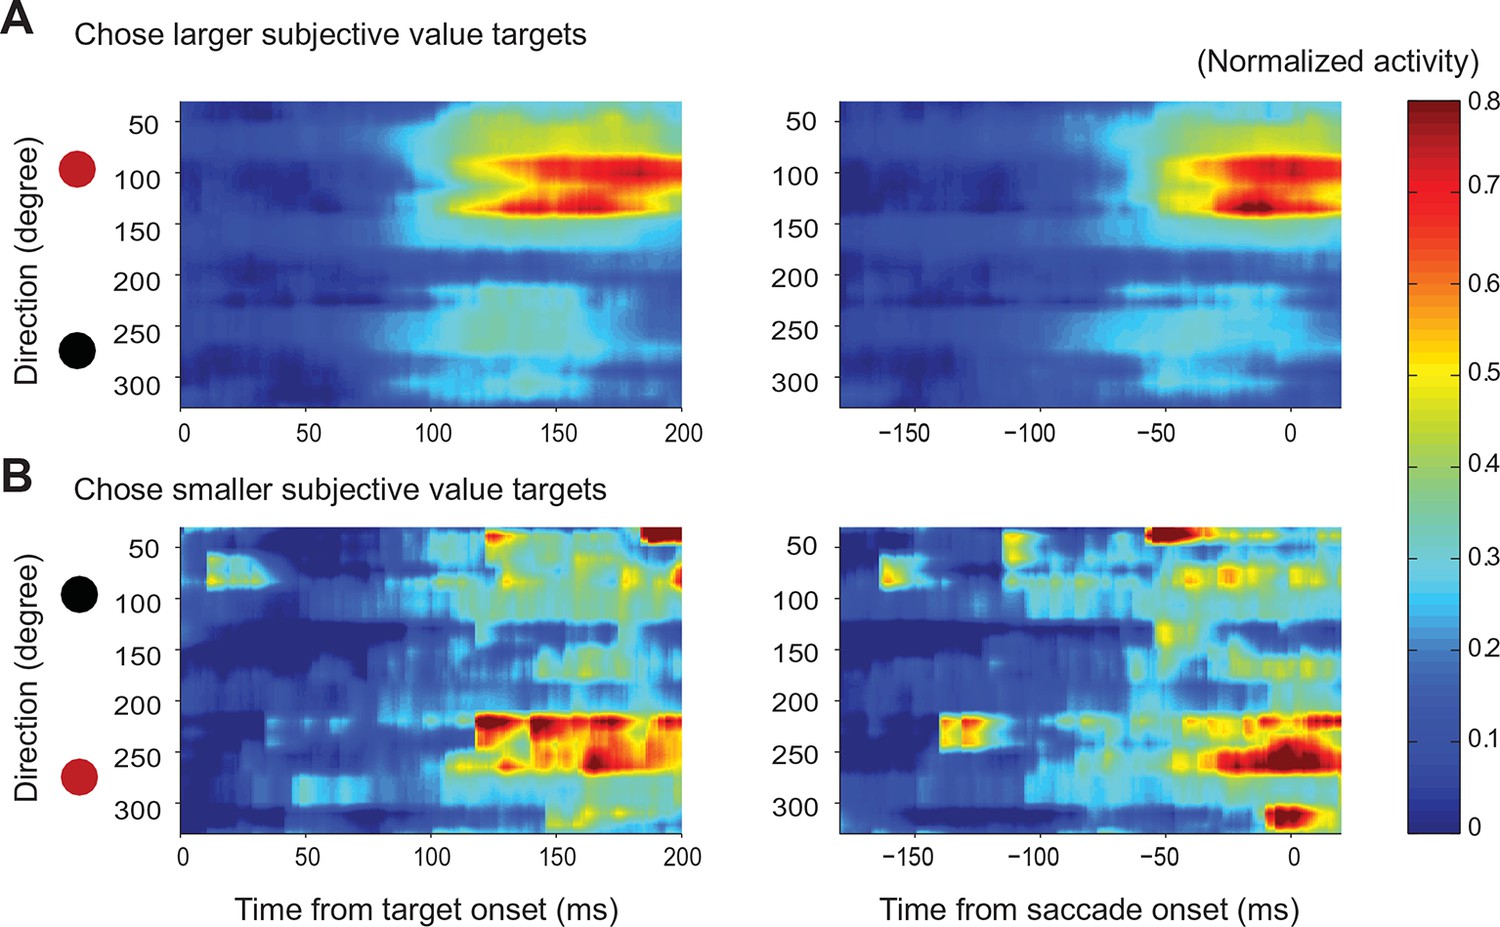
Action value maps for trials with variable choices.
SEF population activity for the option pairs in which the monkeys chose different options across trials. The circle on top indicates the position of the target with the higher average value, while the circle below indicates the position of the target with the lower average value. The red circle indicates the chosen target, while the black circle indicates the non-chosen target. The time-direction maps are aligned on target (left panels) and saccade (right panels) onset. (A) SEF population activity on trials, in which the monkey chose the more valuable target. (B) SEF population activity on trials, in which the monkey chose the less valuable target. The SEF neurons whose preferred direction coincided with the chosen target location strongly increased their activity, irrespective of the target’s value. This indicates that SEF neurons not only encode the relative action value of a saccade in their preferred direction, but also the saccade choice. SEF, supplementary eye field.
Figure 7 with 2 supplements
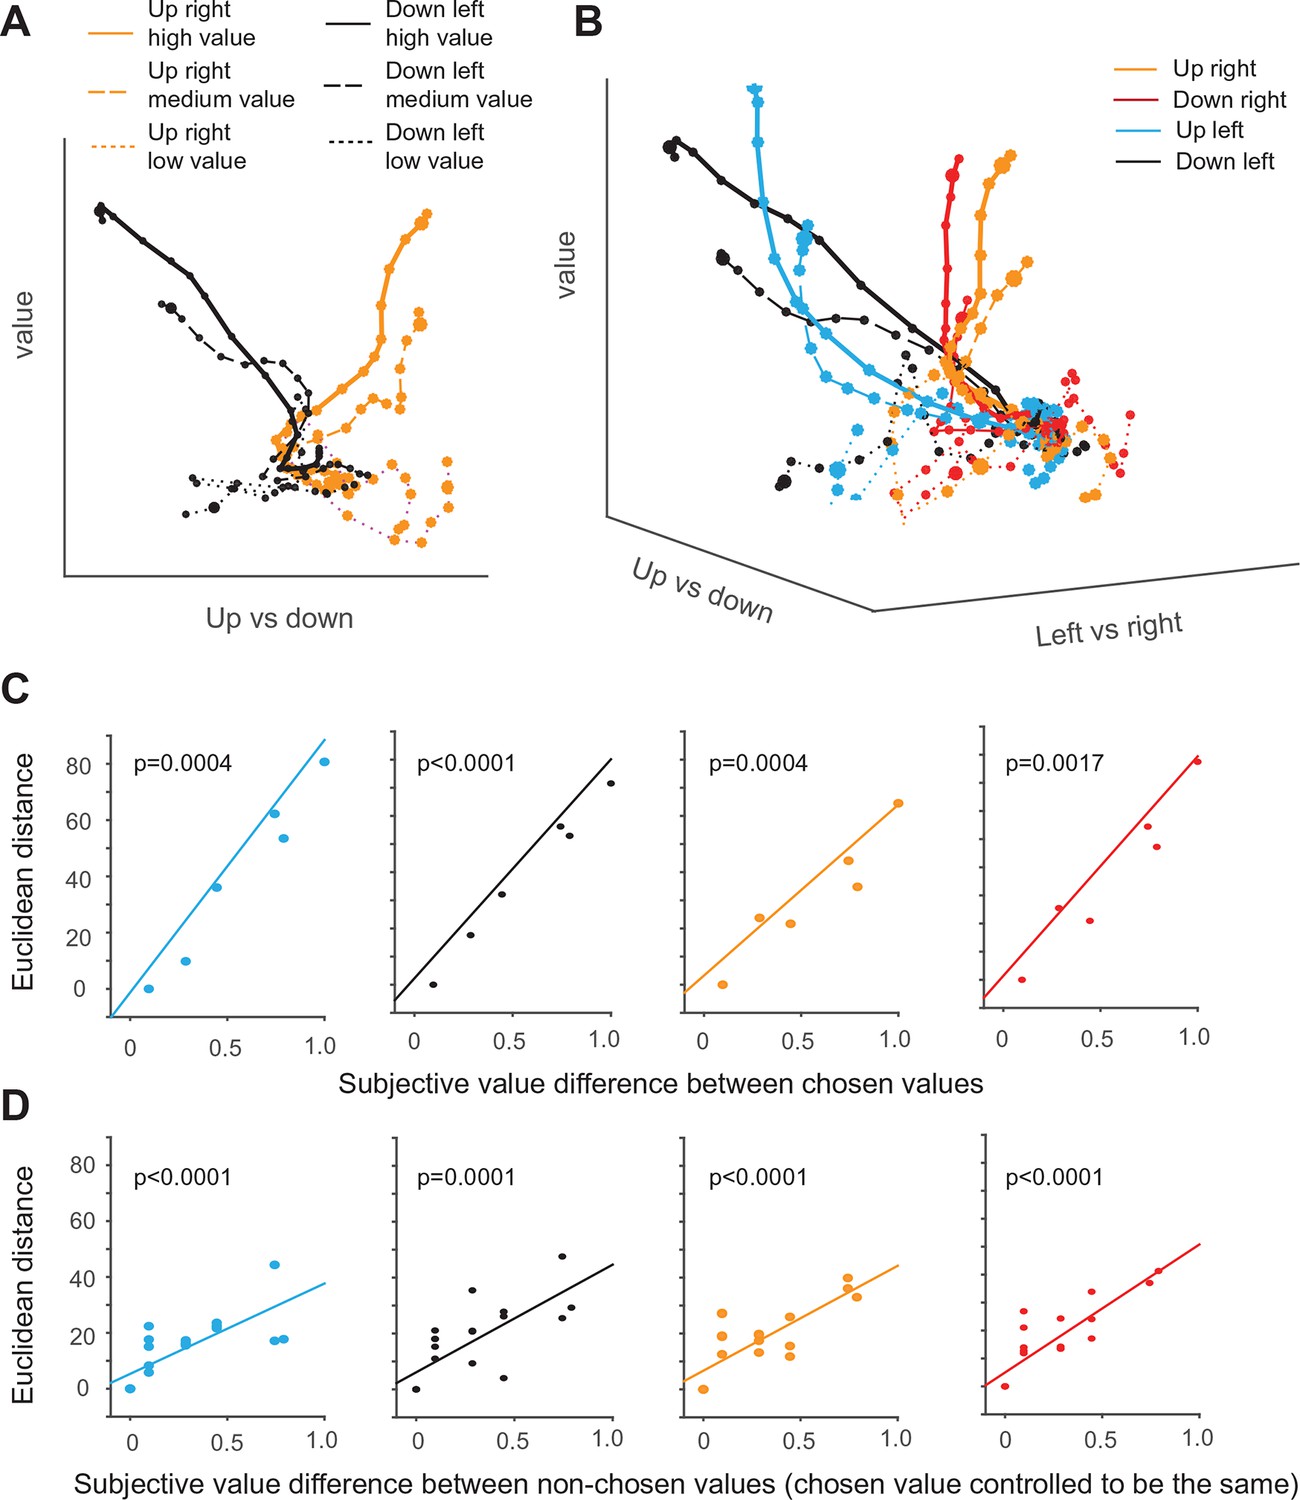
Dynamics of SEF population activity trajectories in state space during decision making.
The average population response for a given condition and time period (10 ms) is represented as a point in state space. Responses are shown from 200 ms before to 10 after saccade onset. The time of saccade initiation is indicated by the larger dot. The four different chosen saccade directions are indicated by different colors (up right: red; down right: orange: up left: black; down left: blue) and the value of the chosen target by line style (high value (value>=0.7): solid line, medium value (value<0.7 and value >0.3): dashed line, low value dotted line). (A) Trajectories of up-left and down-right movement in value and horizontal (left/right) subspace for three different values. (B) Trajectories of movements in value and action subspace. (C) The effect of the chosen option value on the state space trajectory at saccade onset. The subjective value of each chosen option was measured relative to the option with the smallest chosen value. The Euclidian distance in 3-D task space between the state vectors of each pair of chosen options increased as a function of their difference in subjective value. The significance of the relationship between difference in Euclidian distance and value was tested using a regression analysis (t-test; the p-value indicates the probability that the regression slope is significantly different from zero). (D) The effect of the non-chosen option value on the state space trajectory at saccade onset. For trajectories with fixed saccade direction and chosen option value, the difference in Euclidian distance increased as a function of difference in subjective value of each non-chosen option relative to the option with the largest non-chosen value. SEF, supplementary eye field.
Figure 7—figure supplement 1
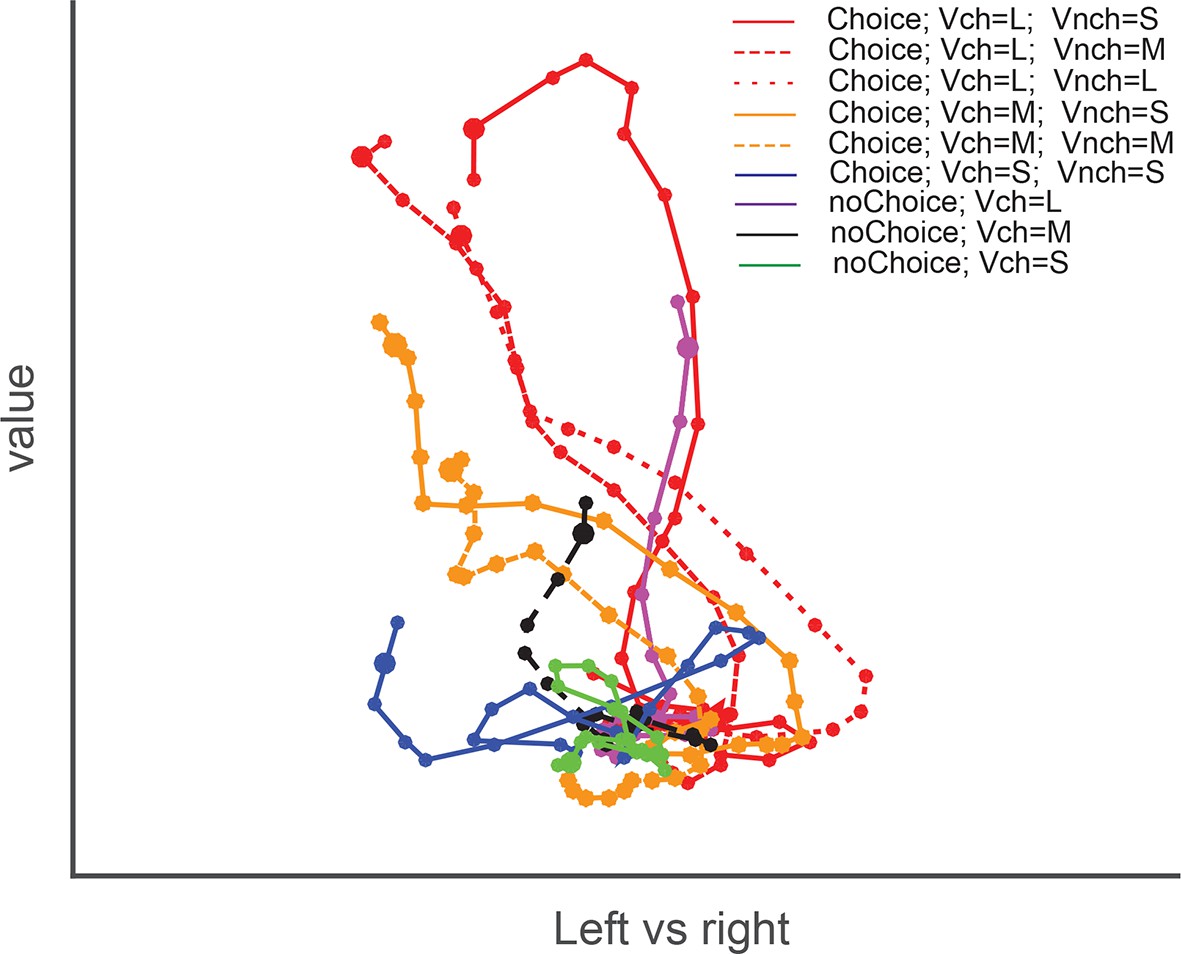
Dynamics of SEF population activity trajectories in state space for choices of the down-left target.
The trajectories show the population neuronal activity when down-left targets of varying value were chosen. The average population response for a given condition and time period (10 ms) is represented as a point in state space. Responses are shown from 200 ms before to 10 after saccade onset. The time of saccade initiation is indicated by the larger dot. The trajectories are grouped according to both chosen and non-chosen values. The red, orange and blue colors indicate the large (L), medium (M), and small (S) chosen values in choice trials. Solid, dash, and dotted lines indicate the small, medium, and large non-chosen values, repectively. There are fewer trajectories when the chosen target was less valuable, because it was chosen less often. The trajectories for choice trials were influenced by both chosen and non-chosen values. Specifically, given a chosen value (indicating by color), the trajectories were slightly lower along the value axis if the non-chosen value was larger (indicating by line patterns). Thus, the neuronal population as a whole represents a relative action value signal. For comparison, purple, black, and green colors indicate the large, medium, and small chosen value in no-choice trials, repectively. If no-choice trials simply represent a situation that is similar to the choice trials, but in which the non-chosen value is simply zero, the trajectories for no-choice trial should be similar to the ones on choice trials with small non-chosen value. However, that is not the case. Instead, the trajectories for no-choice trials always reach an end point that is less extended along both the value and direction axis than the respective trajectories for choice trials. Thus, the neural population responds differently on choice and no-choice trials. SEF, supplementary eye field.
Figure 7—figure supplement 2
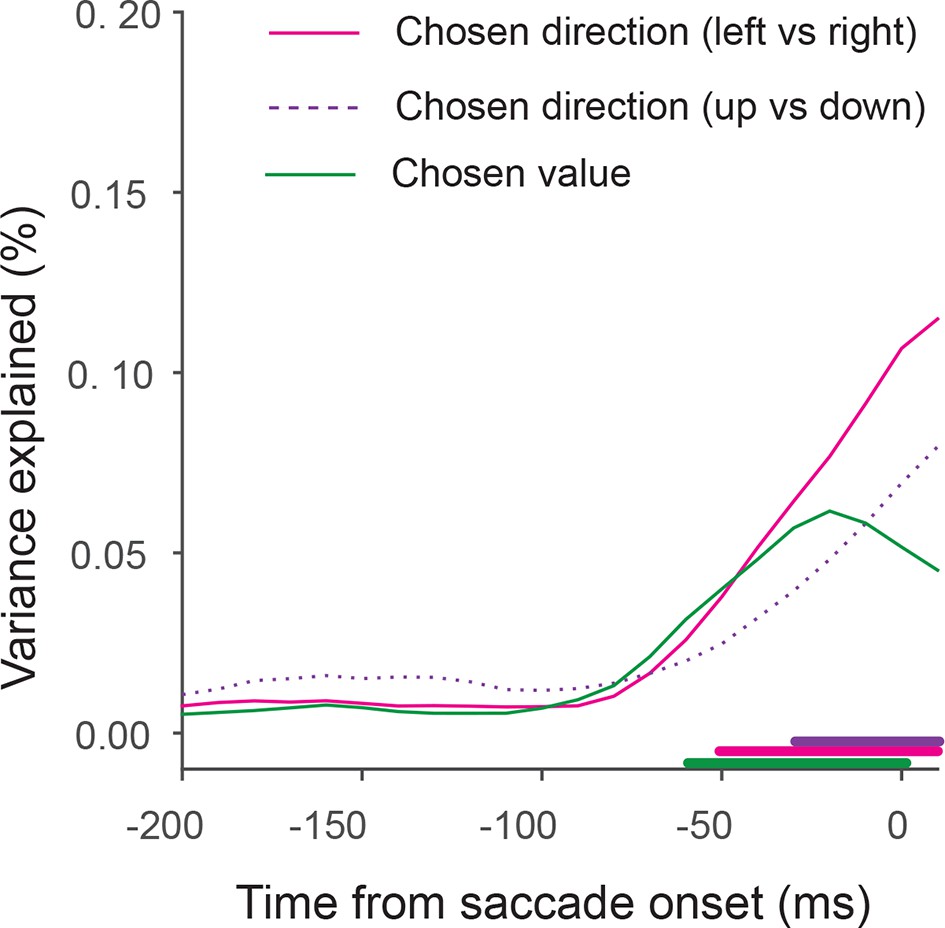
Fraction of variance in state vector position explained by task-related axes of chosen direction (pink and purple) and chosen value (green).
The lines underneath show when the fraction of variance explained is different from random (permutation test, p<=0.05).
Author response image 1
SEF neurons represent the difference in action value of saccades in the preferred and non-preferred direction.
The neural activity of 353 directionally tuned SEF neurons was normalized and compared across trials with different values of the preferred direction or non-preferred direction target. (A–B) The neural activity in no-choice trials when the saccade in the preferred direction (A) and non-preferred direction (B) was performed. (C–D) The neural activity in choice trials. To visualize the contrasting effect of the preferred and non-preferred target on neural activity, the value of one of the targets was held constant, while the value of the other target was varied he value of the preferred target varied, while the value of the non-preferred target was held at a medium value. Alternatively, the value of the non-preferred target varied, while the value of target was held at a medium value. The color of the spike density histograms indicates the target value [high value=6-7 units (red line); medium value=3-5 units (orange line); low value=1-2 units (yellow line)]. (E–H) The regression analysis corresponding to (A–D). A t-test was used to determine whether the regression coefficients were significantly different from 0.
Tables
Table 1
Average value effect on neural activity across all directional SEF neurons. The upper two rows show the effect of preferred and non-preferred direction target value on normalized neuronal activity in no-choice trials, and the lower two rows show their effect in choice trials. Within each set, the upper row (VPD) shows the effect of the preferred direction target value on normalized neural activity, whereas the lower row shows the effect of the non-preferred direction target value on normalized neural activity. Significance was calculated using a t-test, which shows whether the regression coefficient is significant difference from zero. The analysis corresponds to the results presented in Figure 4.
| All neurons (n = 128) | Regression coefficient | Lower confidence bound | Upper confidence bound | t(5) | p | |
|---|---|---|---|---|---|---|
| No-choice | VPD | 0.057 | 0.020 | 0.095 | 3.945 | 0.011 |
| VNPD | 0.013 | -0.012 | 0.039 | 1.324 | 0.243 | |
| Choice | VPD | 0.119 | 0.090 | 0.148 | 10.629 | <0.001 |
| VNPD | -0.058 | -0.093 | -0.0238 | -4.345 | 0.007 | |
-
SEF, supplementary eye field.
Table 2
The onset times in time-direction maps. The first main column shows the onset time calculated from trials aligned on target onset and the second main column shows the onset time calculated from trials aligned on saccade onset. Within each main column, the first minor column shows the time when the neural activity was significantly different from background activity (-20 to 0 before target onset). The second minor column shows the time when the neural activity represented the choice. In no-choice trials, this corresponds to the time when the activity of neurons with a preferred direction within ± 30° of the target was significantly different from the activity of neurons where no target was presented (the neurons with preferred direction within 240–300°). For choice trial, it corresponds to the time when the activity for the chosen target was significant different form the activity for the non-chosen target (in both cases the neurons with preferred direction within ± 30° of their respective target). A permutation test with multiple comparison correction was used to calculate the onset times.
| Time from target onset | Time from saccade onset | |||
|---|---|---|---|---|
| Activity vs background | Chosen vs non-chosen | Activity vs background | Chosen vs non-chosen | |
| No-choice | 44 ms | -141 ms | ||
| Choice | 40 ms | 105 ms | -185 ms | -70 ms |
| Choice (dV>=0.4) | 44 ms | 92 ms | -129 ms | -68 ms |
| Choice (dV<0.4) | 41 ms | 139 ms | -169 ms | -42 ms |
Download links
A two-part list of links to download the article, or parts of the article, in various formats.
Downloads (link to download the article as PDF)
Open citations (links to open the citations from this article in various online reference manager services)
Cite this article (links to download the citations from this article in formats compatible with various reference manager tools)
Sequential selection of economic good and action in medial frontal cortex of macaques during value-based decisions
eLife 4:e09418.
https://doi.org/10.7554/eLife.09418


