Munc18-1-regulated stage-wise SNARE assembly underlying synaptic exocytosis
- Yale School of Medicine, United States
- Yale University, United States
- Wenzhou University, China
Figures
Figure 1 with 5 supplements
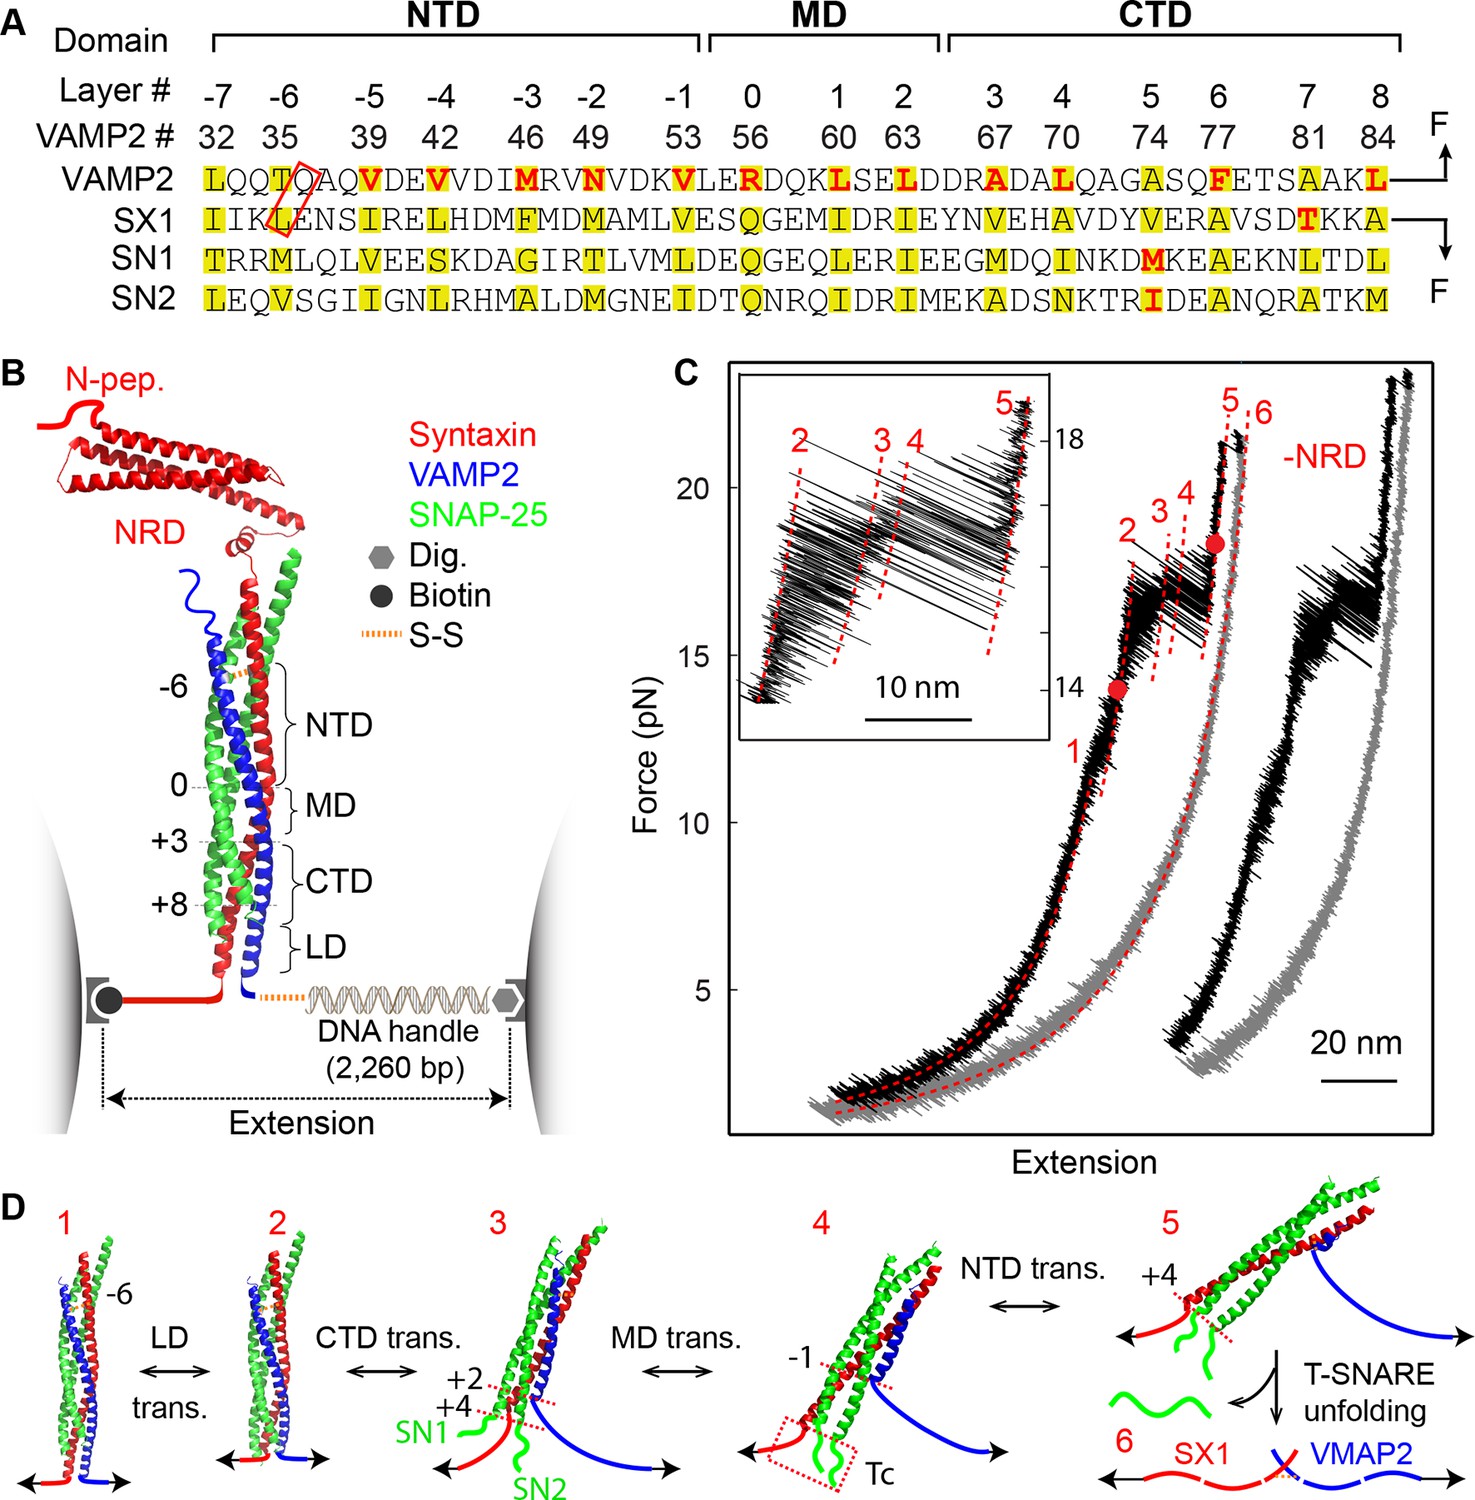
Four distinct stages of SNARE assembly.
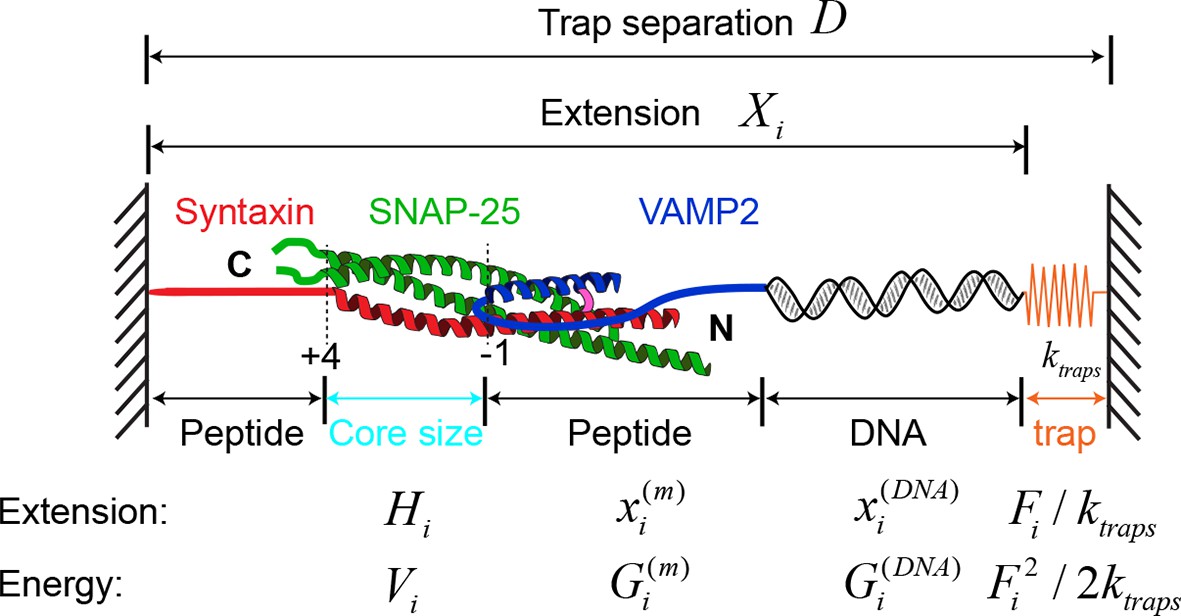
(A) Sequences and domain structures of SNARE motifs in VAMP2, syntaxin 1A (SX1), and SNAP-25B (SN1 and SN2). The amino acids in different layers are highlighted in yellow, with the corresponding layer numbers and VAMP2 amino acid numbers labeled. The two amino acids in the red rectangle were mutated to cysteine and crosslinked by a disulfide bridge. The layer amino acids mutated in this study are highlighted in red. (B) Diagram of the experimental setup (Gao et al., 2012; Cecconi et al., 2005). Different functional domains of the SNARE complex are indicated, including the N-terminal domain (NTD), the middle domain (MD), the C-terminal domain (CTD), the linker domain (LD), as well as the N-terminal regulatory domain (NRD) in syntaxin. The positions of four bordering layers are indicated by their layer numbers. (C) Force-extension curves (FECs) of a single SNARE complex with or without (-NRD) the NRD obtained by pulling (black) and then relaxing (gray) the complex. The FECs of the two complexes generally overlap but were shifted along x-axis for clarity. The continuous regions of the FECs corresponding to different assembly states (marked by red numbers, see D) were fitted by the worm-like chain model (red lines). The inset shows a close-up view of the region marked by two red dots. Throughout this work, the time-dependent extension and force were mean-filtered using a time window of 5 ms and plotted in the FECs shown, if not otherwise specified. (D) Six different SNARE assembly states. The states are numbered the same throughout the text (in red). Black numbers indicate different layers. The disordered t-SNARE C-terminus (Tc) in all partially zippered and unzipped SNARE complexes is marked by a dashed rectangle in state 4. The NRD minimally affects intrinsic SNARE assembly and is omitted in the SNARE structures depicted here.
Figure 1—figure supplement 1
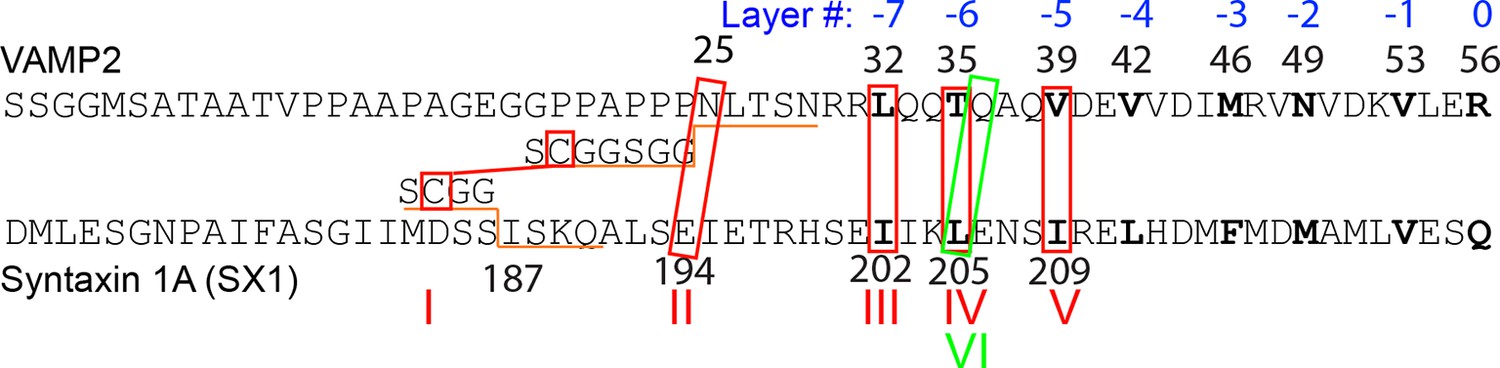
N-terminal amino acid sequences of rat VAMP 2 and syntaxin-1A showing their different crosslinking sites (marked by red or green boxes) in the SNARE complexes tested.
The amino acids in these sites were substituted with cysteine for crosslinking. In construct I, truncated VAMP2 25-92 and syntaxin-1A (187-265) were crosslinked via the short spacer sequences shown, whereas in other constructs, full cytoplasmic VAMP2 (a.a. 1-96) and syntaxin-1A (a.a. 1-265) were used. Rat SNAP-25 molecules used in all these SNARE complexes had their intrinsic cysteine residues mutated to serine residues. The green box marks the crosslinking site in construct VI used in most of the studies in this work (Figure 1B).
Figure 1—figure supplement 2
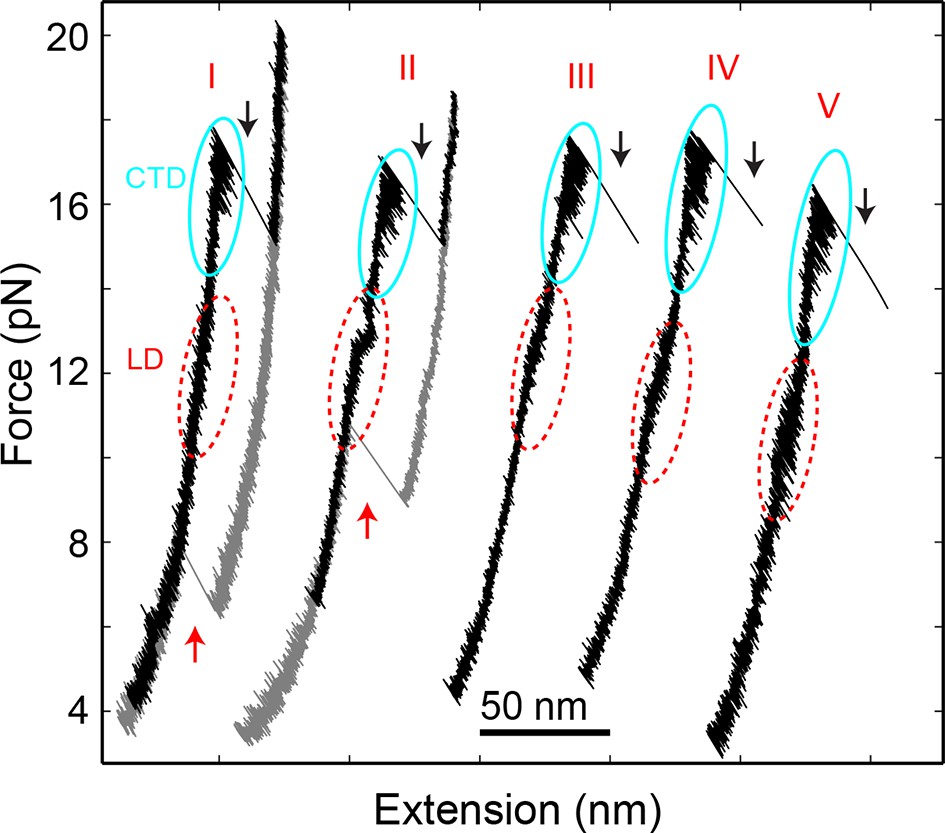
Force-extension curves (FECs) of the SNARE complexes crosslinked at different sites shown in Figure 1—figure supplement 1.
All SNARE complexes show similar fast and reversible transitions in the linker domain (LD, red dashed ovals) and in the C-terminal domain (CTD, cyan solid ovals). Whereas constructs I and II exhibit NTD unfolding at high forces (black arrows) and SNARE reassembly at low forces (red arrows), other constructs (III, IV, and V) generally do not crosslink well at the N-terminal sites, leading to tether rupture upon NTD dissociation. NTD, N-terminal domain.
Figure 1—figure supplement 3
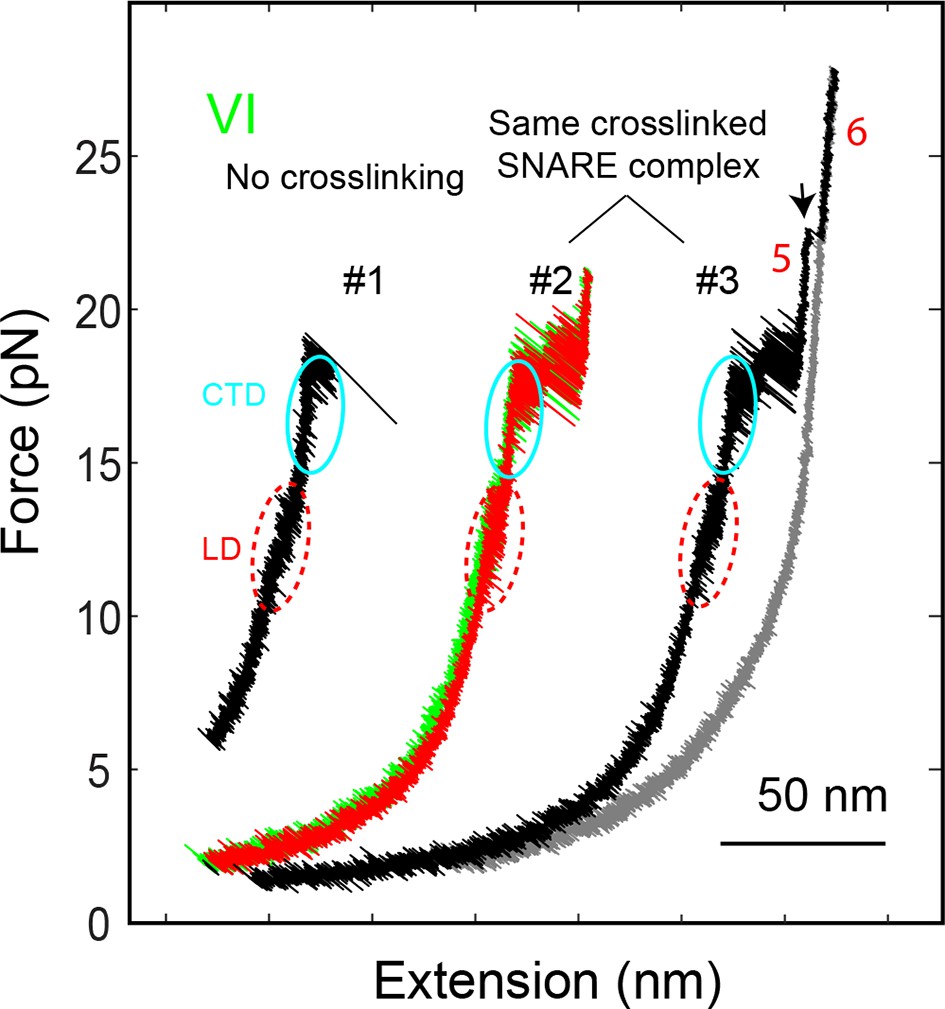
FECs of the SNARE complex showing reversible and irreversible transitions and effects of crosslinking near the -6 layer.
The comparison of FEC #1 and FEC #2 reveals that the LD and CTD transitions were not affected by the crosslinking. The SNARE transitions were completely reversible if the SNARE complex was relaxed before the t-SNARE complex was unfolded (FEC #2), as is indicated by overlapping FECs obtained by pulling (green) and then relaxing (red) the SNARE complex. However, after t-SNARE unfolding (black arrow) the same SNARE complex failed to reassemble when relaxed to a force down to 1 pN (FEC #3). CTD, C-terminal domain; FECs, force-extension curves; LD, linker domain.
Figure 1—figure supplement 4
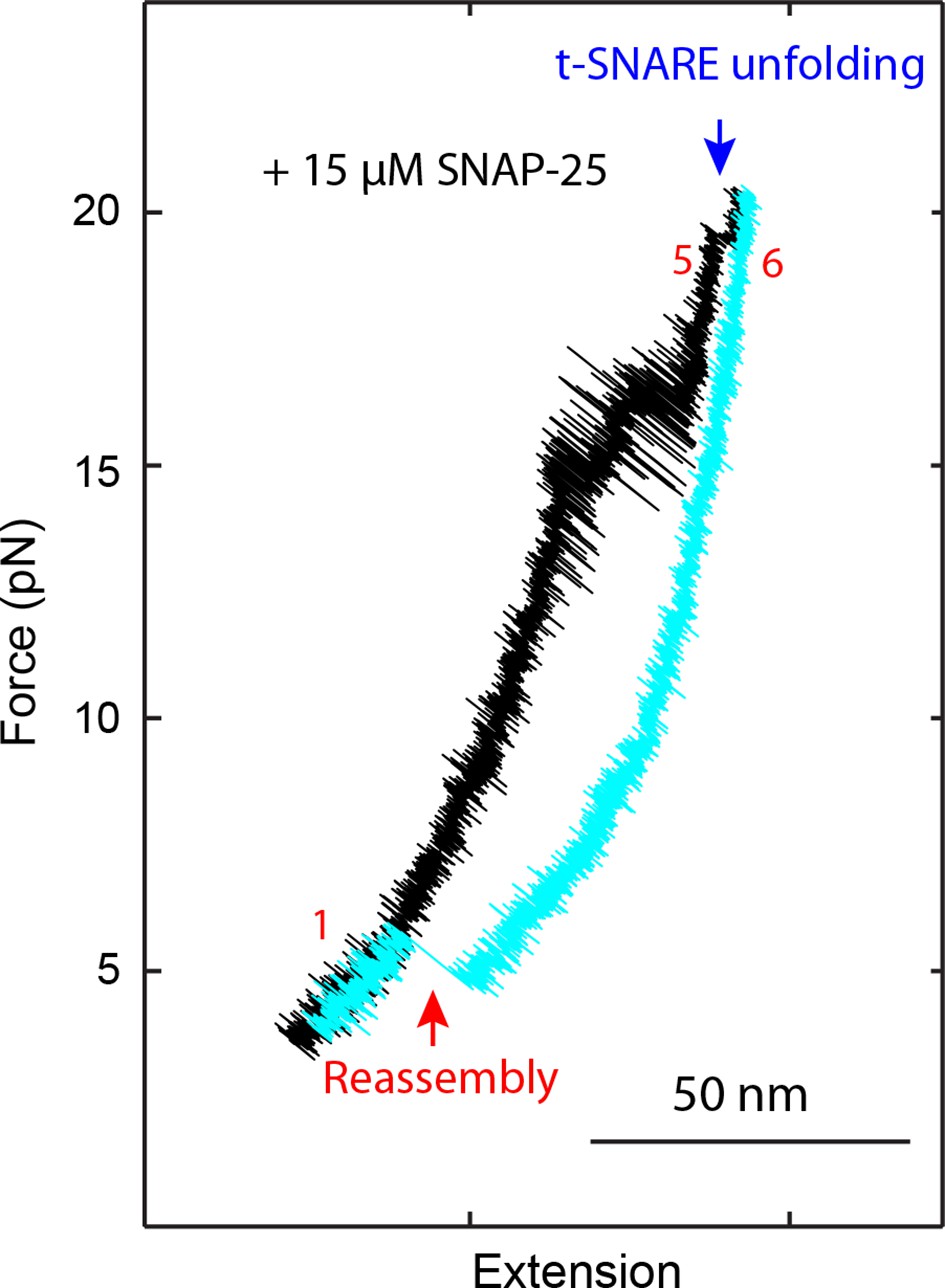
FECs of a single SNARE complex obtained in the presence 15 µM SNAP-25 in the solution showed that SNAP-25 was required for SNARE assembly.
A single SNARE complex was pulled to high force (FEC in black) to unfold the t-SNARE complex at ~18 pN (rip indicated by the blue arrow) and then relaxed to a low force (FEC in cyan) to observe SNARE re-assembly (red arrow). FECs, force-extension curves.
Figure 1—figure supplement 5
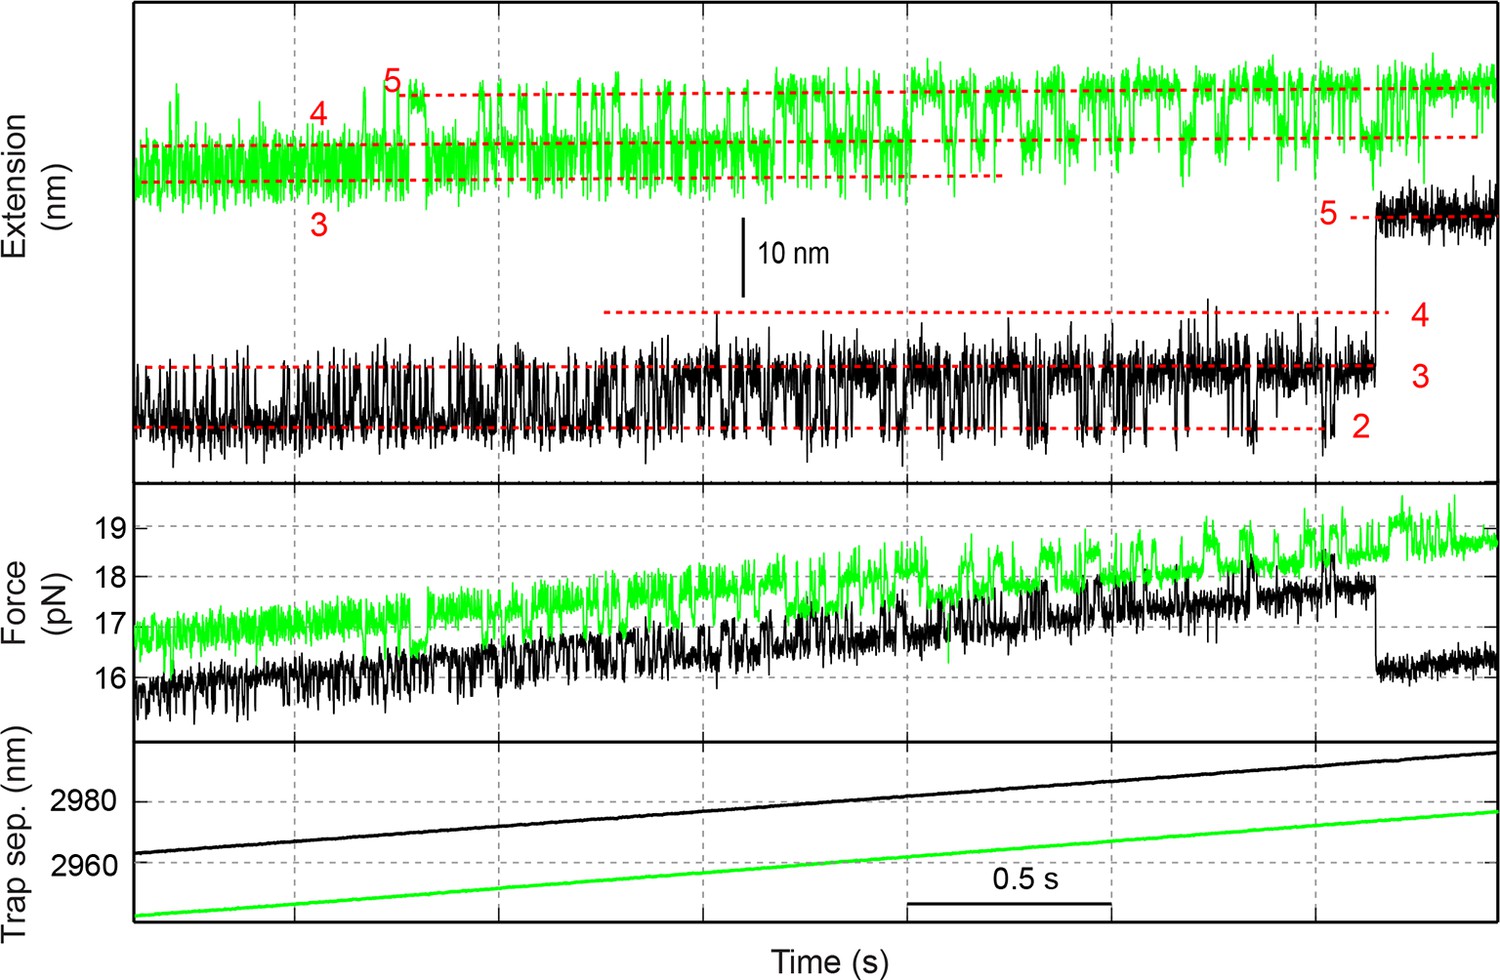
Time-dependent extension (top), instantaneous force (middle), and trap separation (bottom) of the SNARE construct VI (green) or I (black) as the SNARE complex was being pulled by increasing the trap separation at a speed of 10 nm/s.
The different SNARE folding states are marked by red dashed lines and their corresponding state numbers (Figure 1D): 2, the LD-unfolded state; 3, the CTD-unfolded state; 4, the MD-unfolded state; and 5, the NTD-unfolded state. Traces shown here are mean-filtered to 1000 Hz. CTD, C-terminal domain; LD, linker domain; MD, middle domain; NTD, N-terminal domain.
Figure 2 with 3 supplements
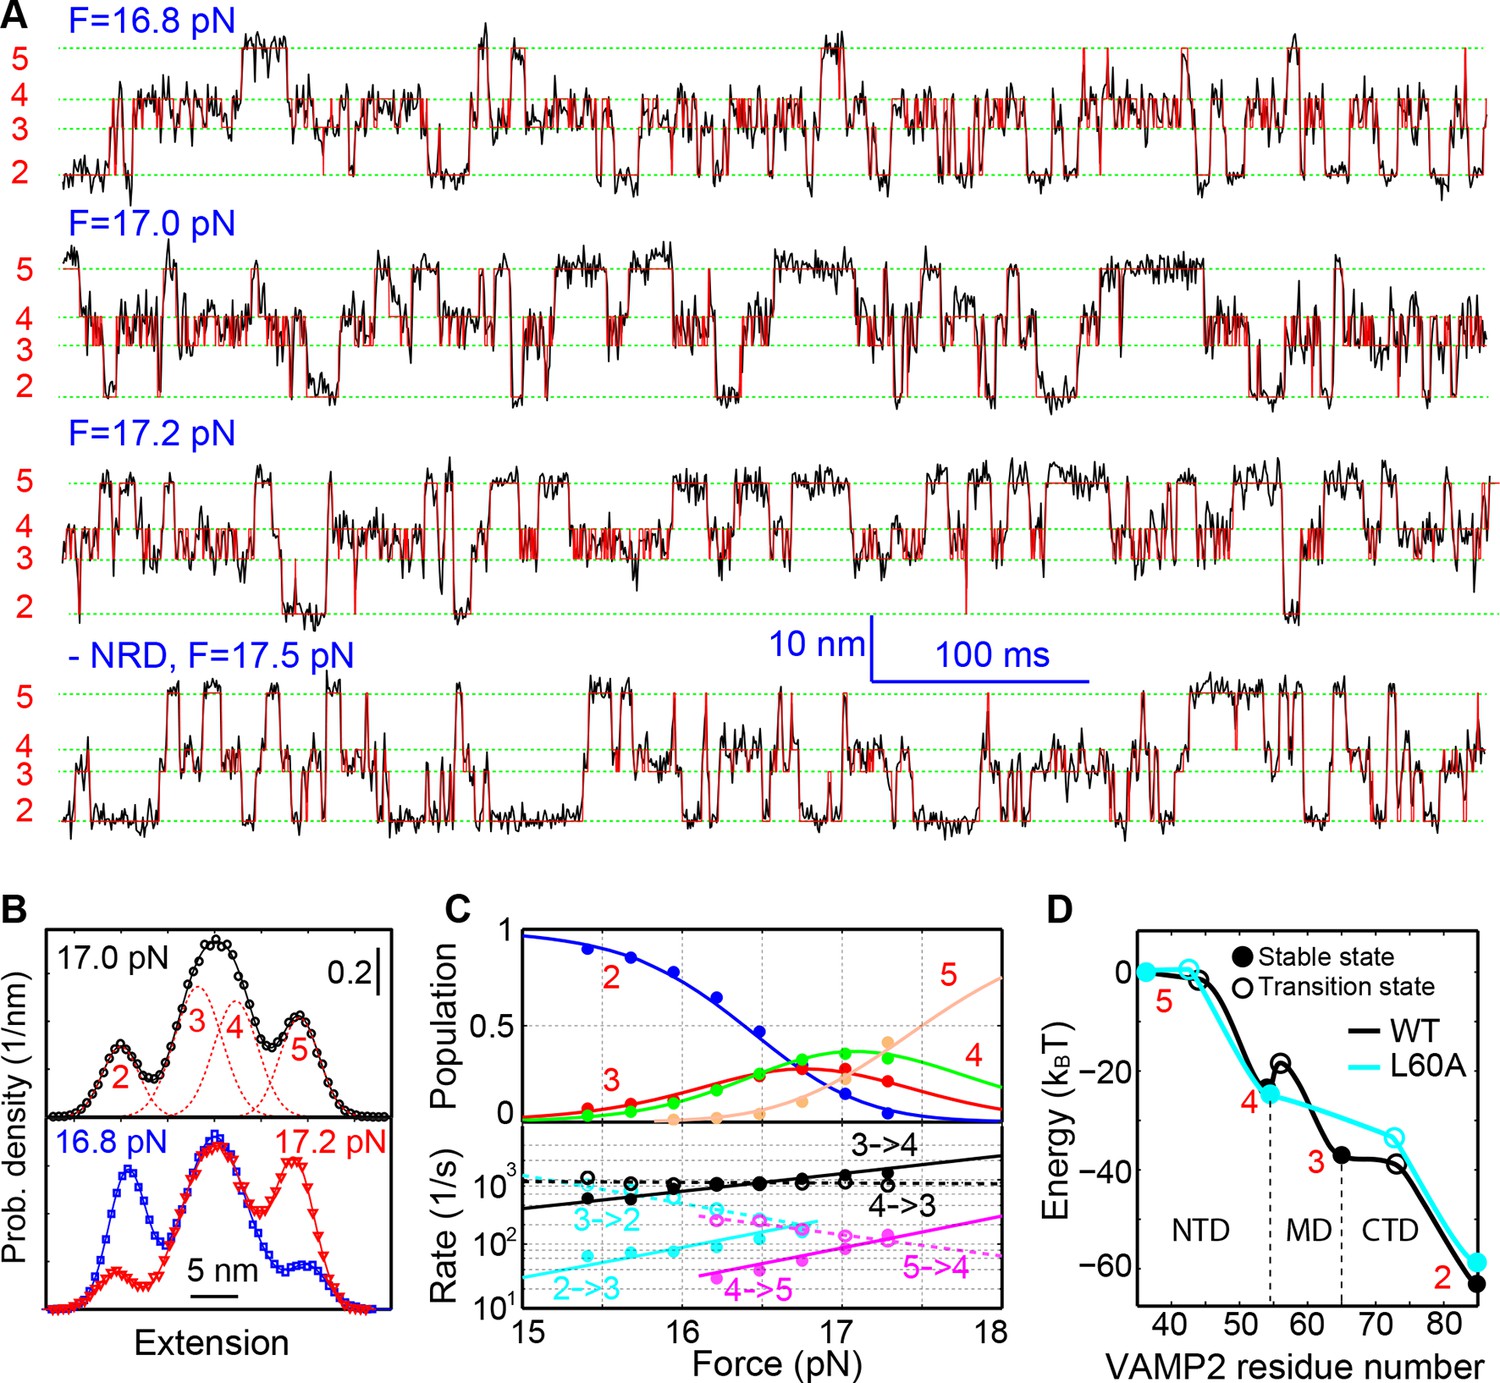
Energetics and kinetics of SNARE assembly.
(A) Extension-time trajectories of a single SNARE complex under the indicated constant mean forces. The idealized state transitions derived from hidden-Markov modeling (HMM) are shown as red lines. The positions of different states (red numbers) are marked by green dashed lines. Data were mean-filtered using a time window of 0.2 ms and shown. (B) Probability density distributions of the extensions corresponding to the first three traces in A and their best fits by a sum of four Gaussian functions (lines). (C) HMM-derived state populations (upper panel, symbols) and transition rates (lower panel, symbols) are shown as a function of the mean forces. The unfolding and folding rates are shown as solid and hollow symbols, respectively. Their best model fits are shown as lines (‘Materials and methods’). (D) Simplified folding energy landscapes of the wild-type (WT) and the mutant (L60A) SNARE complexes. The abscissa denotes the VAMP2 residue number bordering the structured and unstructured polypeptide regions in the corresponding folding state. All stable states (solid) and transition states (hollow) are defined in the presence of forces.
Figure 2—figure supplement 1
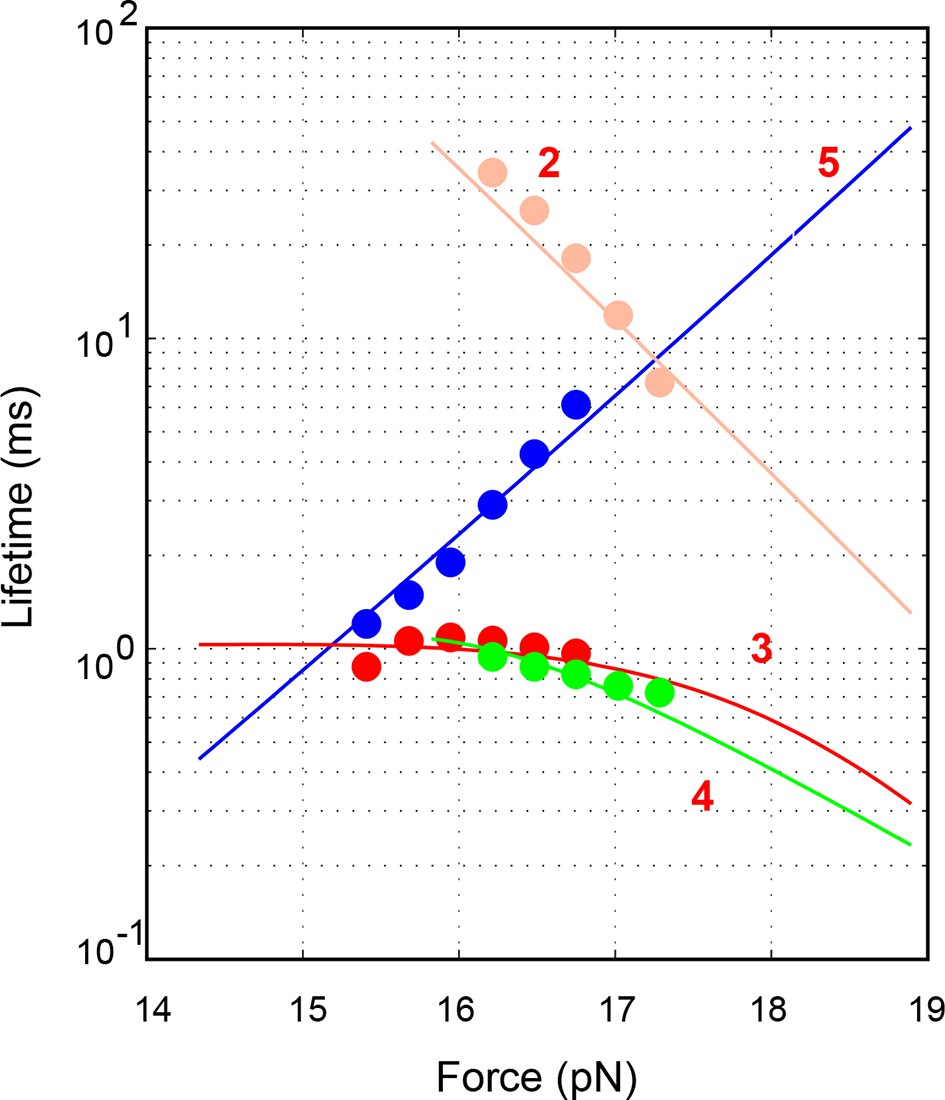
Force-dependent average lifetimes of the four states 2–5 involved in the SNARE assembly (symbols) and their best fits (lines).
See ‘Materials and methods’ for details.
Figure 2—figure supplement 2
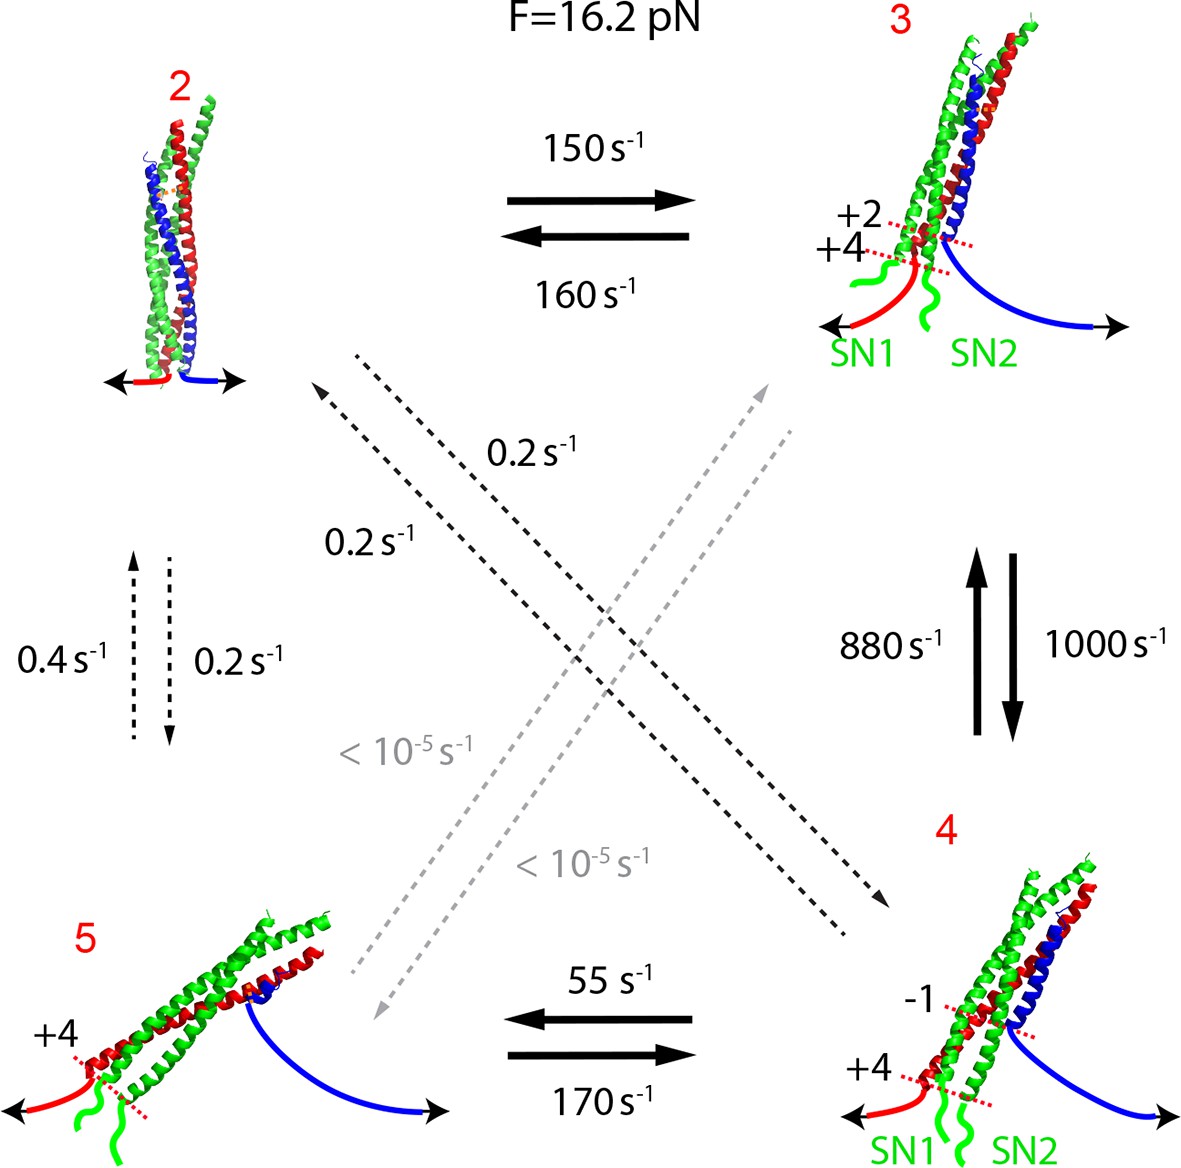
Transition rates determined by hidden-Markov modeling (HMM) shows that the t- and v-SNAREs sequentially assemble like a molecular zipper.
The rates of non-sequential transitions were negligible compared to those of sequential transitions.
Figure 2—figure supplement 3
Modeling SNARE assembly observed in optical traps using the crystal structure of the SNARE complex and a simplified energy landscape.
The total extension of the protein-DNA tether and the total energy of detection system could be calculated from the model and fit to the experimental measurements to derive the folding energies and kinetics of the SNARE complex at zero force (see ‘Materials and methods’ for details).
Figure 3
Vc peptide induces a coil-to-helix transition in the t-SNARE C-terminus (Tc).
(A) Extension-time trajectory showing changes in SNARE folding kinetics caused by binding of the Vc peptide to the t-SNARE in the SNARE complex. The Vc-bound region is colored in cyan. The positions of different states are marked by red dashed lines and the corresponding state numbers. Data were filtered using a time window of 1 ms. (B) Close-up view of the region in A marked by a rectangle. Data were filtered using a time window of 0.6 ms. (C) Probability density distributions of the extensions in A before (black) and after (cyan) Vc binding. (D) Diagram illustrating the Vc-induced conformational transitions. The extension changes averaged over eight Vc-binding events are indicated.
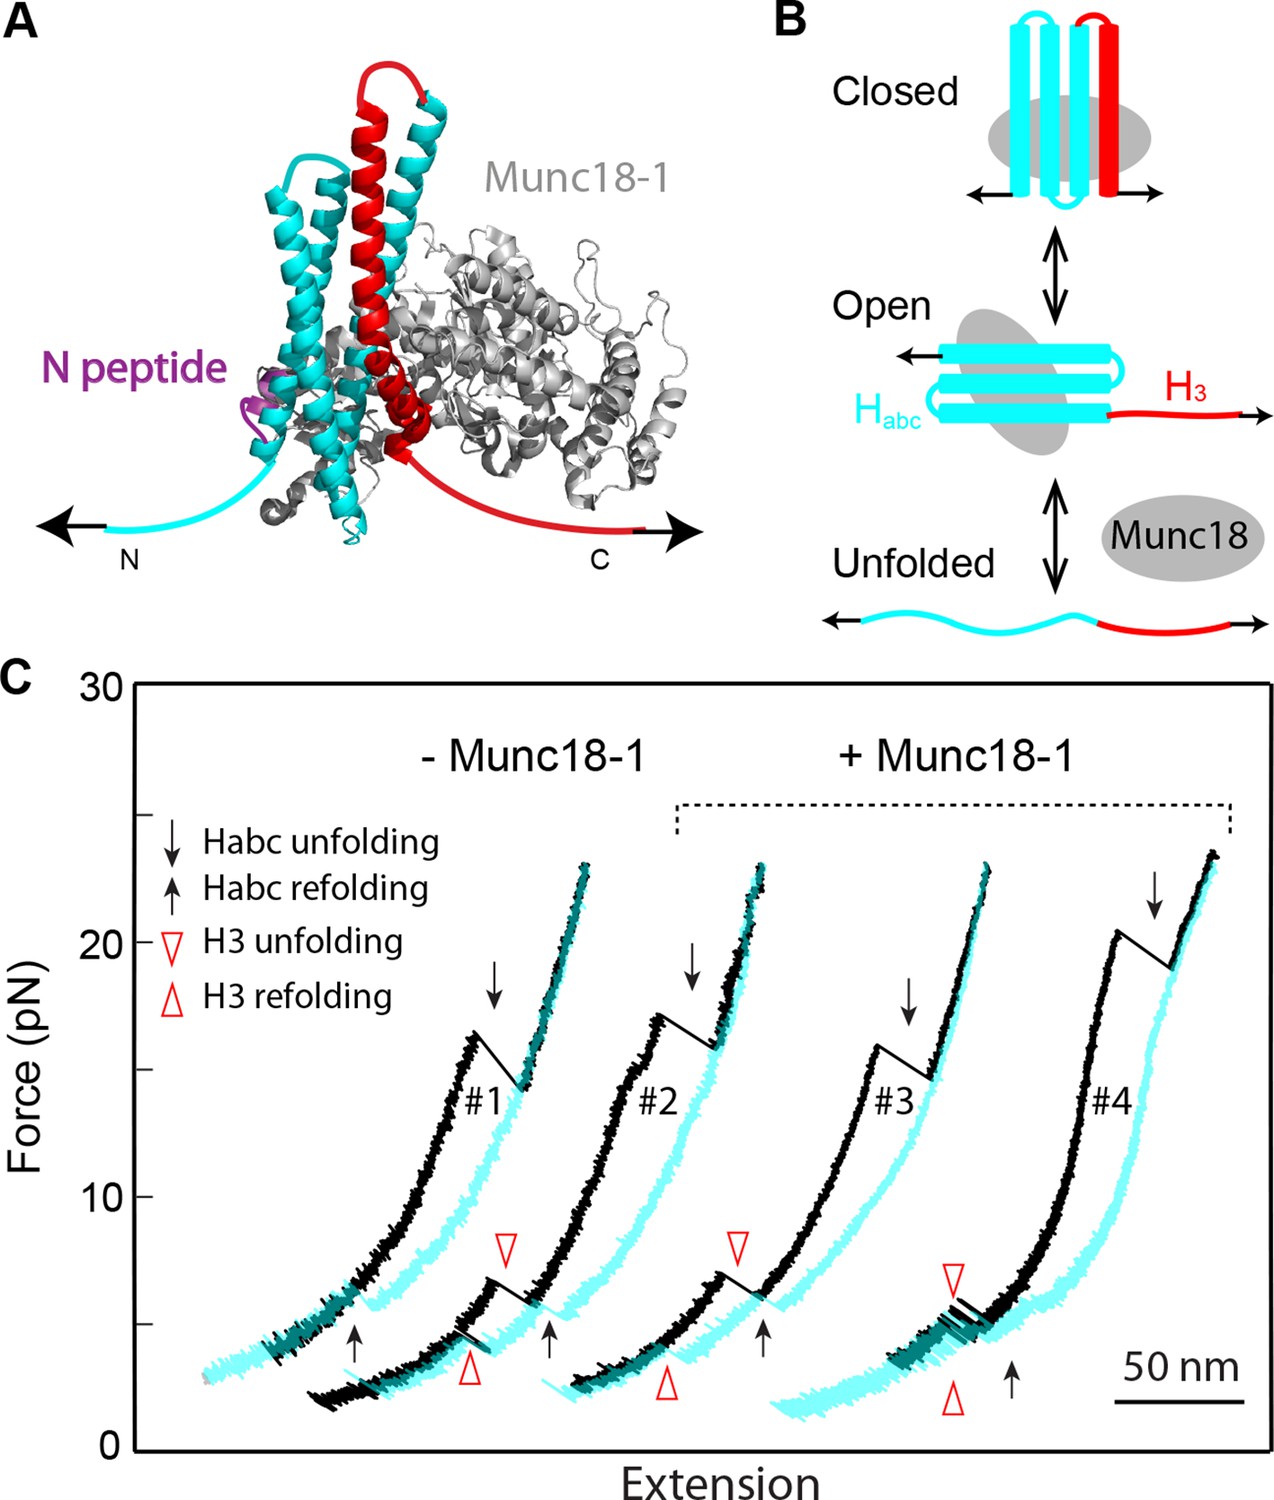
Figure 4 with 1 supplement
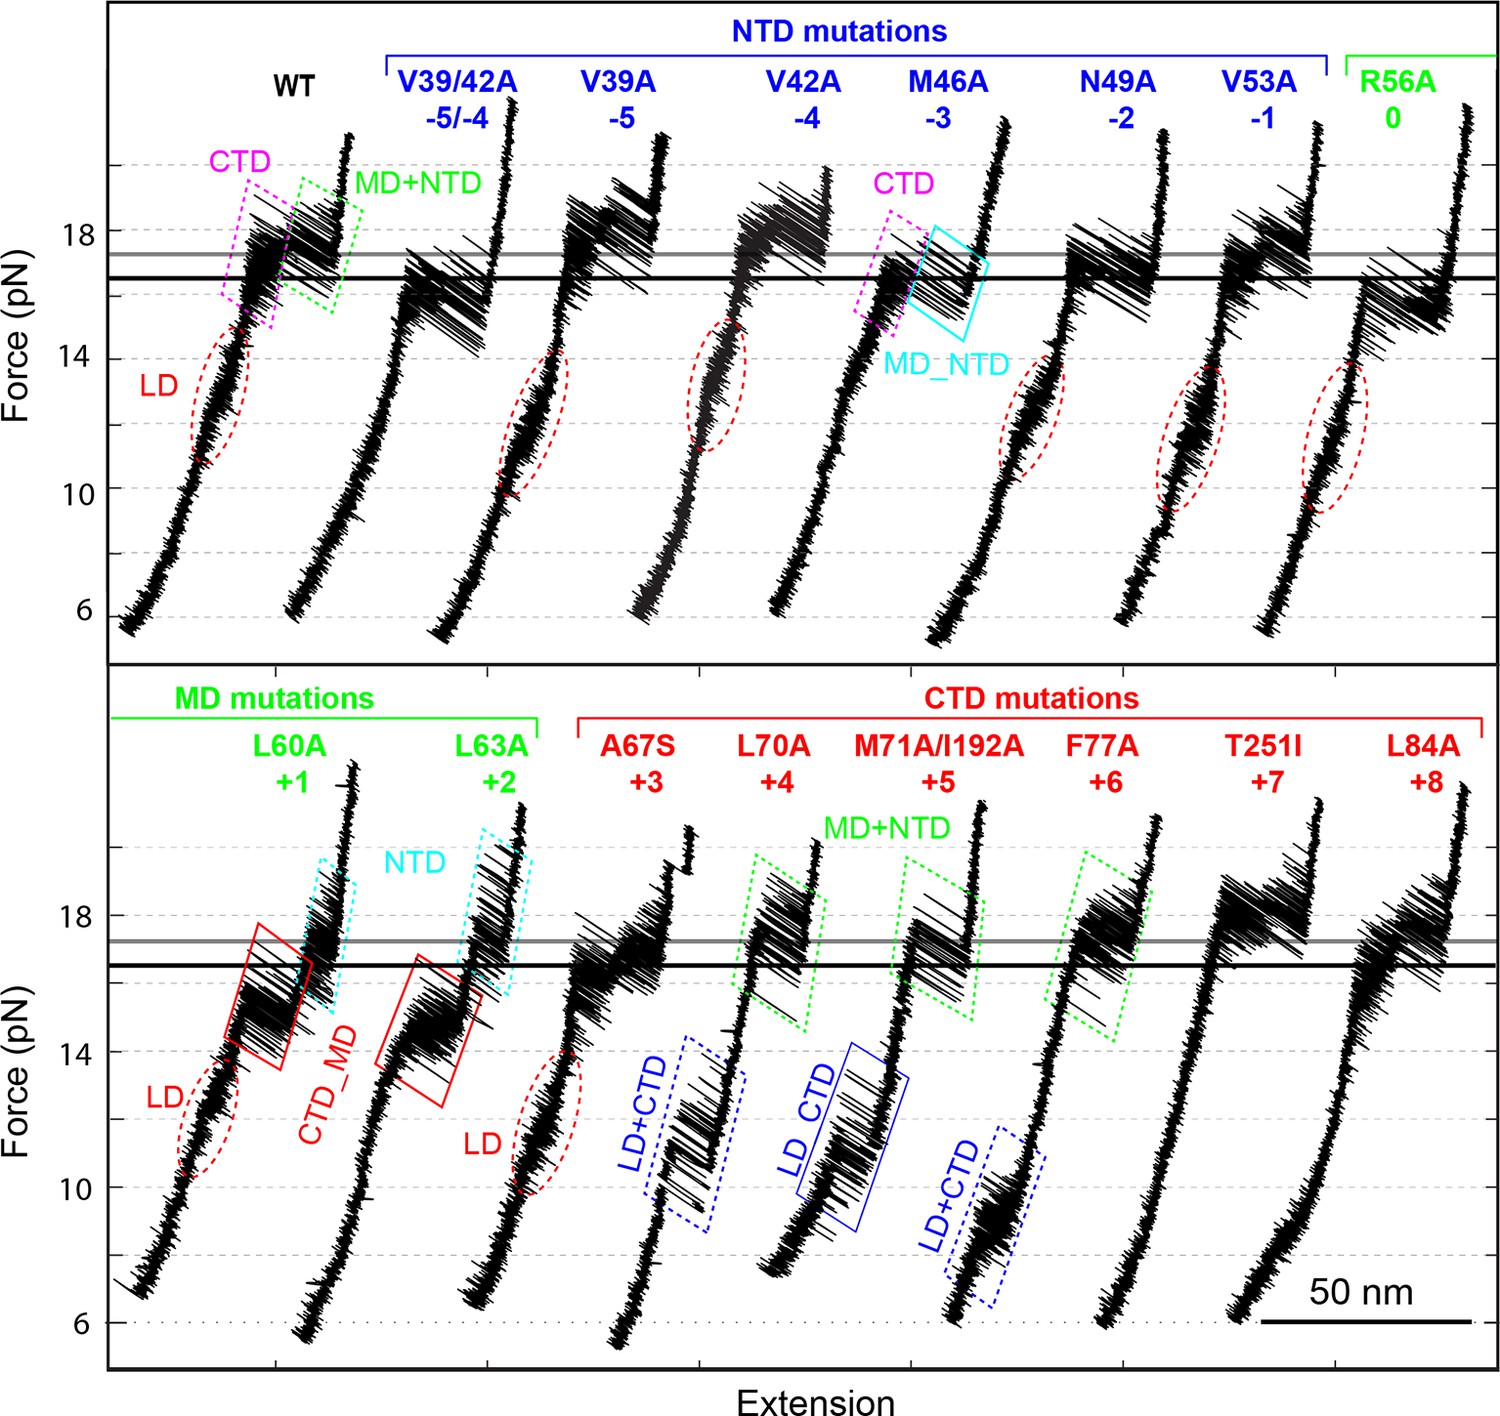
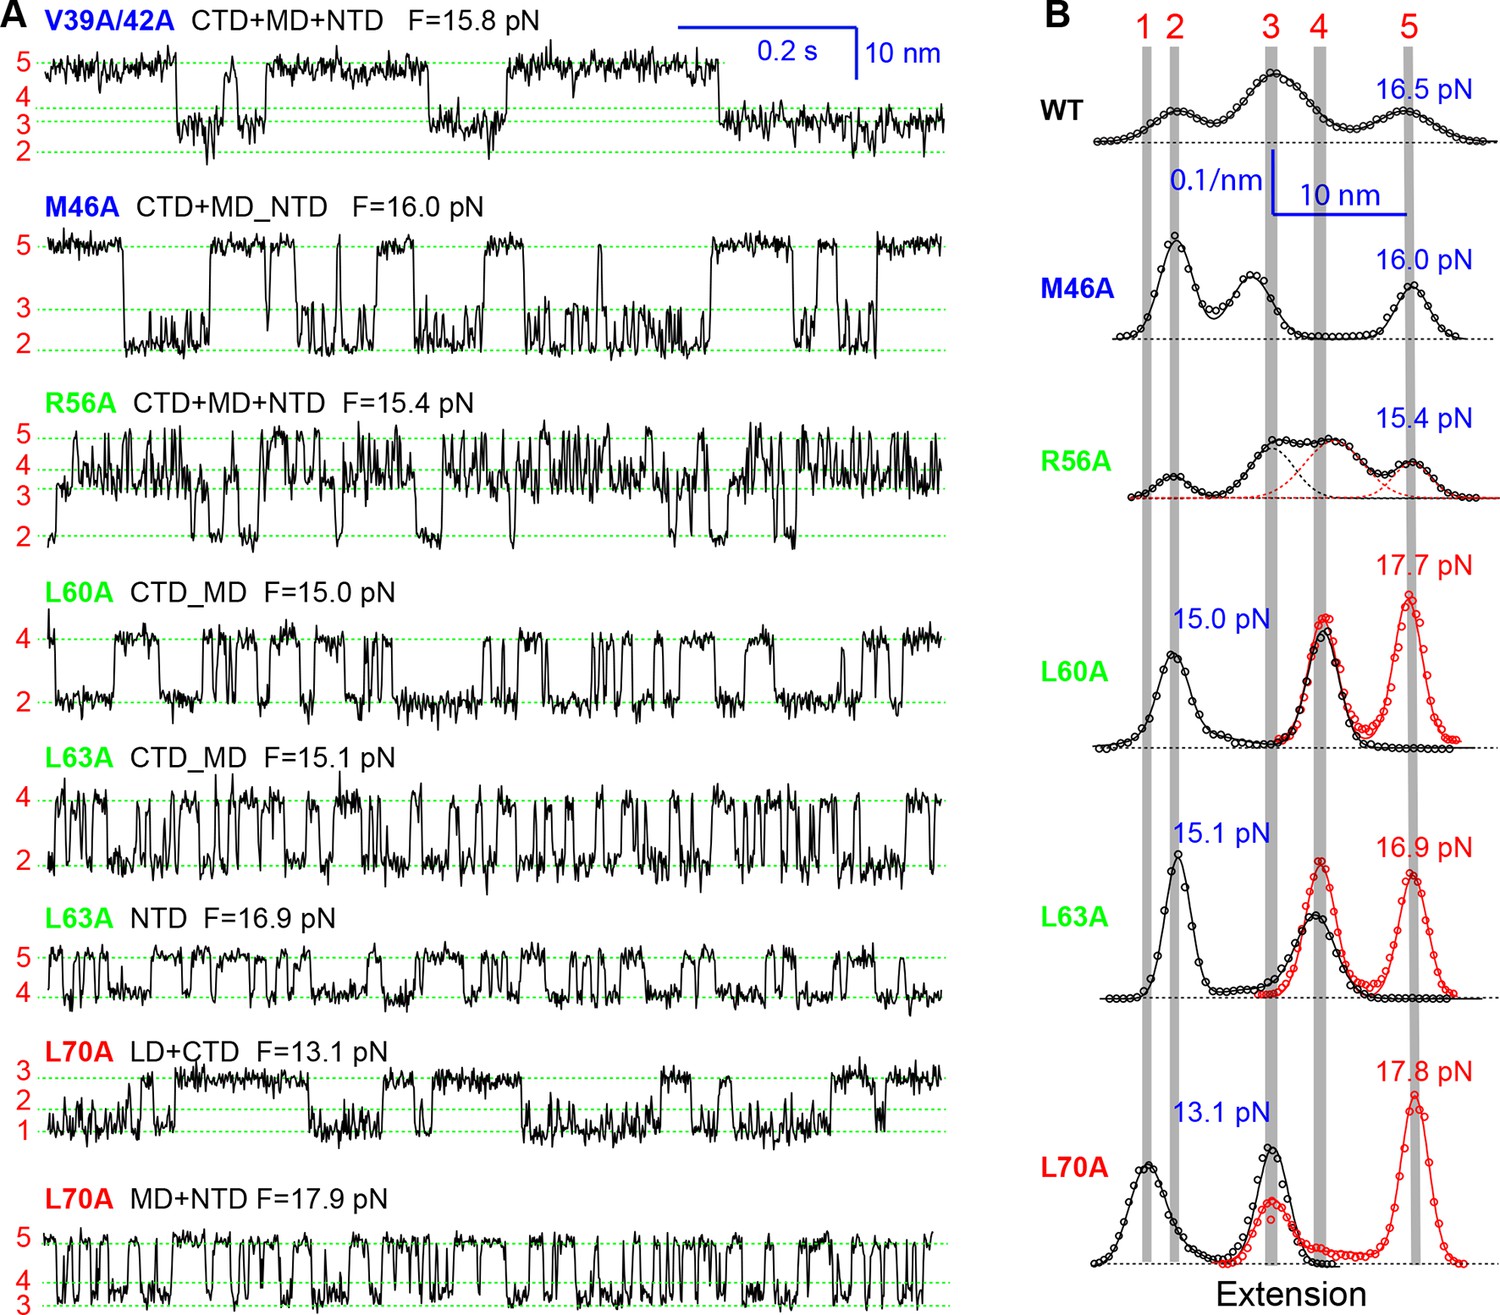
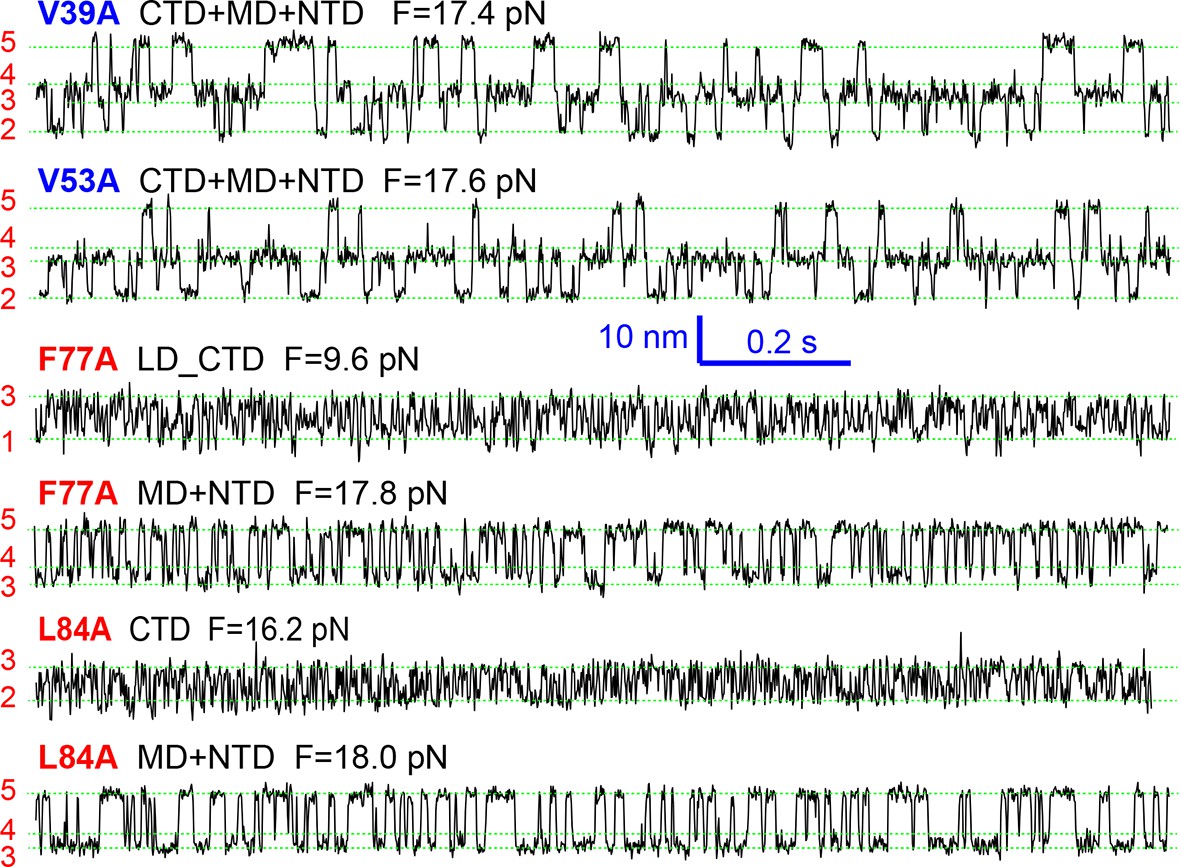
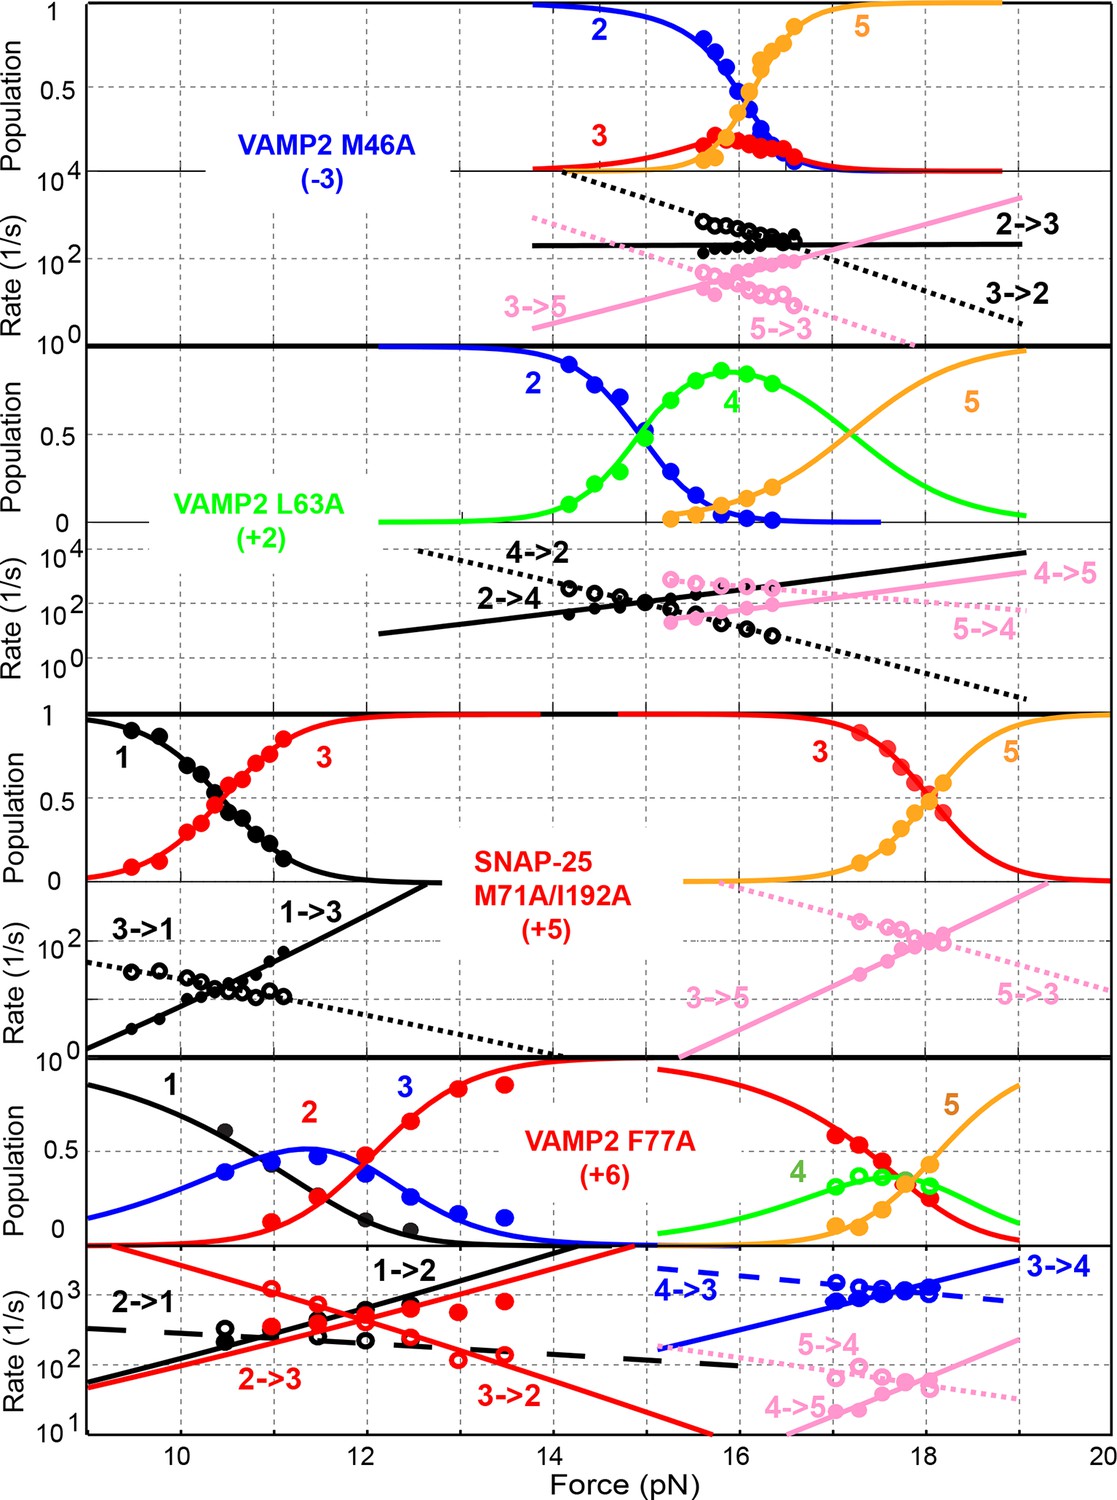
Position-dependent effects of layer mutations on SNARE assembly shown by the FECs of the wild-type and mutant SNARE complexes.
The SNARE mutations and their layer numbers are colored based on their associated domains: blue for NTD, green for MD, and red for CTD. While most mutants assemble sequentially as the wild type (WT), some mutants exhibit altered folding pathways, in which two neighboring domains fold and unfold cooperatively as combined domains. Throughout the text, two-state transitions of these new domains are marked by their associated subdomains connected by “_” (Figure 4—figure supplement 1). By comparison, overlapping sequential transitions are indicated by their associated domains linked by “+”. Different folding domains are marked by unique colored ovals or rectangles. Folding energies of the same domain in different SNARE complexes can be compared by the equilibrium forces of the domain transition. The black and gray horizontal lines indicate the average equilibrium forces of CTD (16.5 ± 0.8 pN) and MD+NTD (17.2 ± 0.8 pN), respectively, of the wild-type SNARE complex. CTD, C-terminal domain; FECs, Force-extensioncurves; MD, middle domain; NTD, N-terminal domain.
Figure 4—figure supplement 1
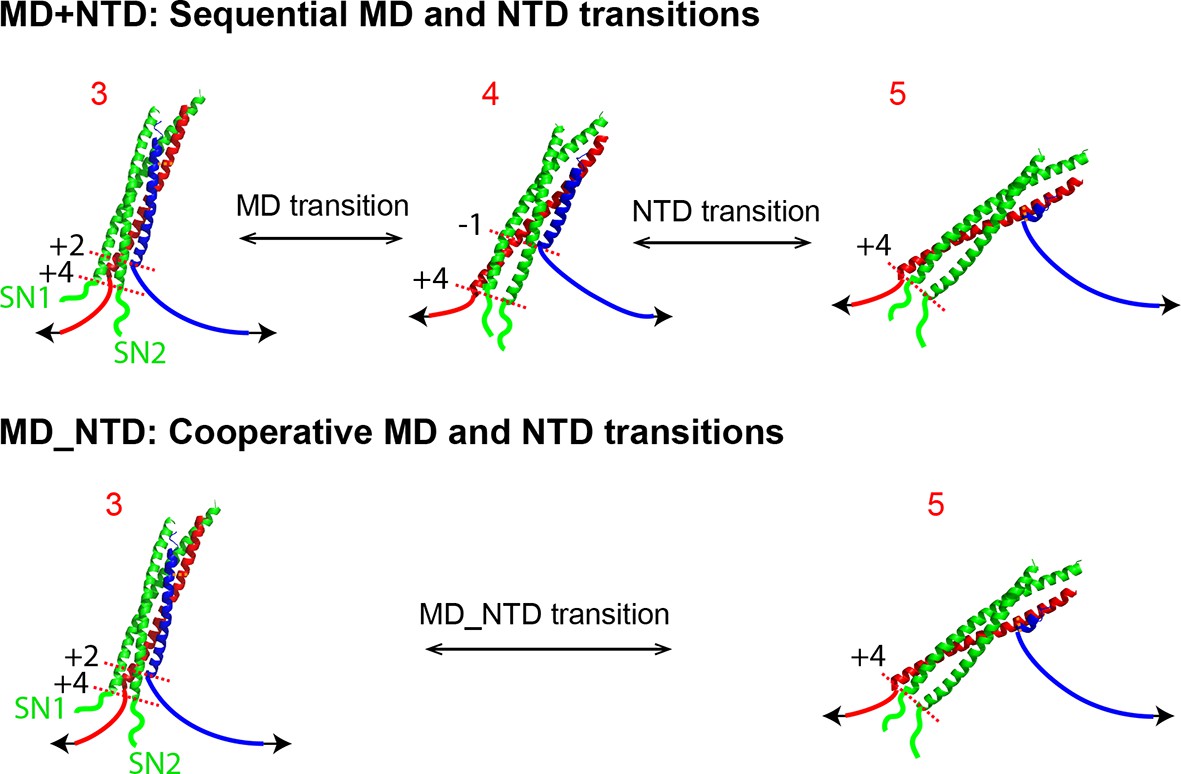
Comparison of sequential and cooperative domain transitions, using MD and NTD as an example.
The wild type SNARE complex sequentially unfolds in the order of LD, CTD, MD, and NTD and folds in the reverse order, which is caused by the increasing mechanical stabilities of domains from LD to NTD. However, a SNARE mutation may preferentially alter the mechanical stability of the domain in which the mutation resides, changing the order of the domain stabilities. As a consequence, we found that the SNARE mutations often led to combinations of two neighboring domains into new domains that cooperatively folded and unfolded as single units. Throughout the text, these new domains are designated by their associated sub-domains linked by “_”. All neighboring domain combinations were observed, including LD_CTD in SNAP-25 mutant M71A/I192A (Figures 4 and 6), CTD_MD in VAMP2 mutants L60A and L63, and MD_NTD in VAMP2 mutant M46A (Figures 4 and 5). By comparison, two or more sequential transitions in an overlapping force region are designed by their associated domains linked by “+”. For example, the transitions shown in Figure 2A can be indicated by “CTD+MD+NTD”. CTD, C-terminal domain; LD, linker domain; MD, middle domain; NTD, N-terminal domain.
Figure 5 with 2 supplements
Extension-time trajectories of the mutant SNARE complexes under constant forces showing effects of mutations on the transition kinetics of different SNARE domains.
(A) Extension-time trajectories. The domains involved in the observed transitions and the mean forces (F) are indicated following the colored mutation names in bold (Figure 4—figure supplement 1). Positions of different states are marked by green dashed lines. (B) Probability density distributions of the extensions under the indicated constant forces (symbols) revealing structural changes in the intermediates of SNARE assembly. The distributions could be fitted by 2-4 Gaussian functions (solid lines), and were horizontally shifted to align the peaks corresponding to different states (indicated by the vertical shaded bars).
Figure 5—figure supplement 1
Extension-time trajectories of mutant SNARE complexes showing indicated domain transitions under constant mean forces.
Data were mean-filtered using a time window of 1 ms and plotted.
Figure 5—figure supplement 2
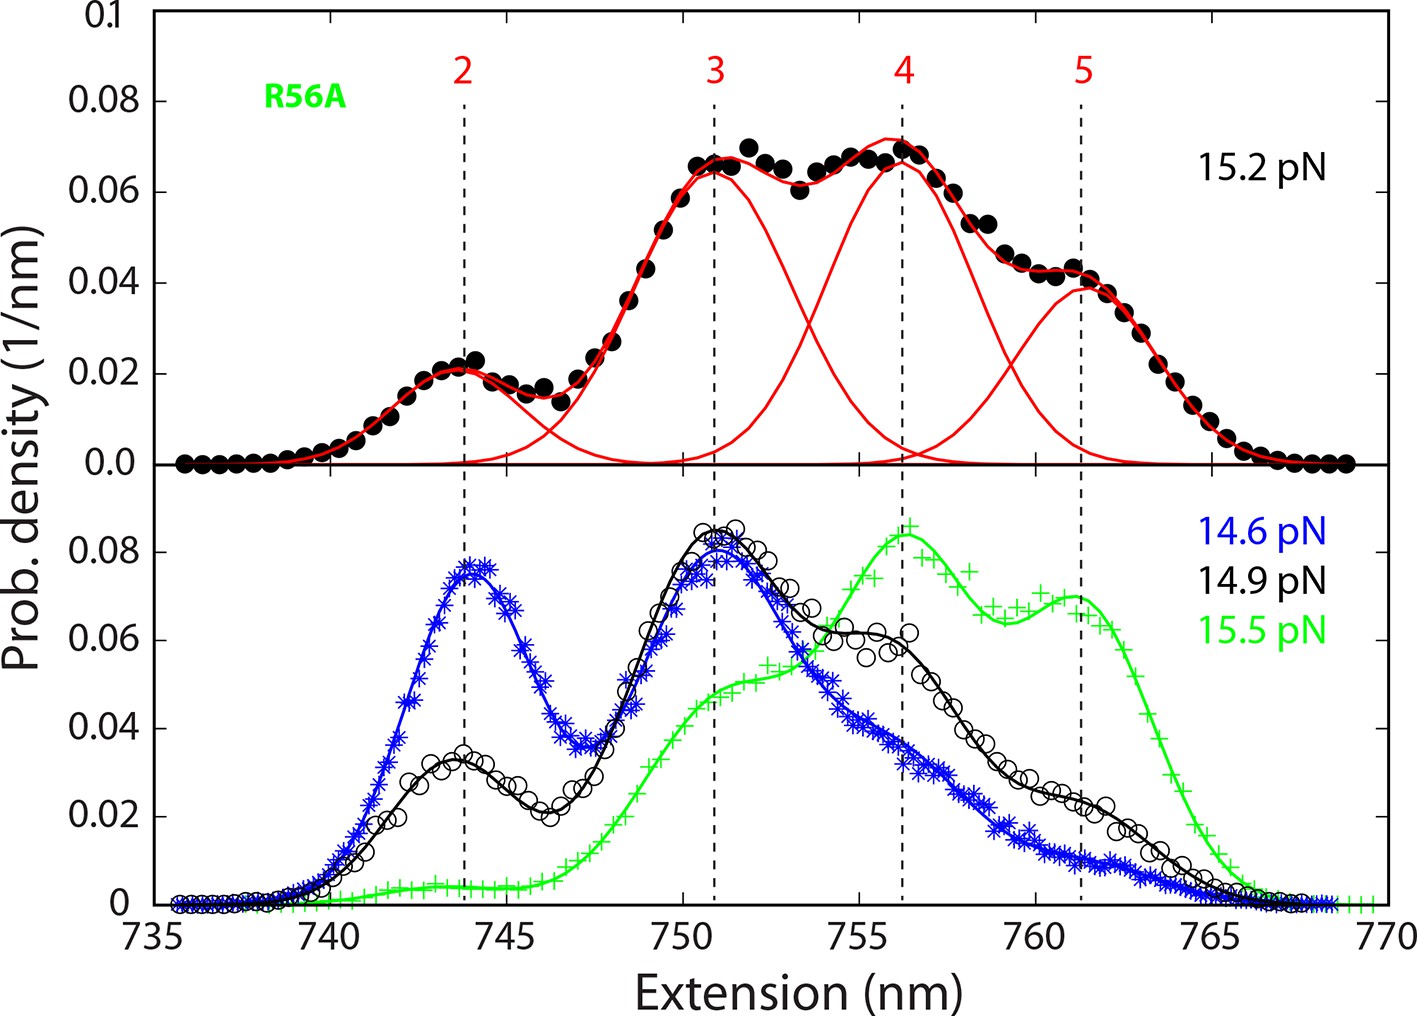
Probability density distributions of the extensions of the mutant SNARE complex R56A under different constant mean forces.
The distributions were calculated using the best-fit parameters from the HMM analysis of the extension trajectories, which were filtered using a time window of 0.2 ms. A four-state SNARE transition is seen from the distributions. HMM, hidden-Markov modeling.
Figure 6
Comparison of force-dependent state populations and transition rates of the mutant SNARE complexes.
Experimental measurements from representative single SNARE complexes (symbols) were fit by a simplified energy landscape model of SNARE assembly (lines) to derive the folding energies of different domains (‘Materials and methods’).
Figure 7
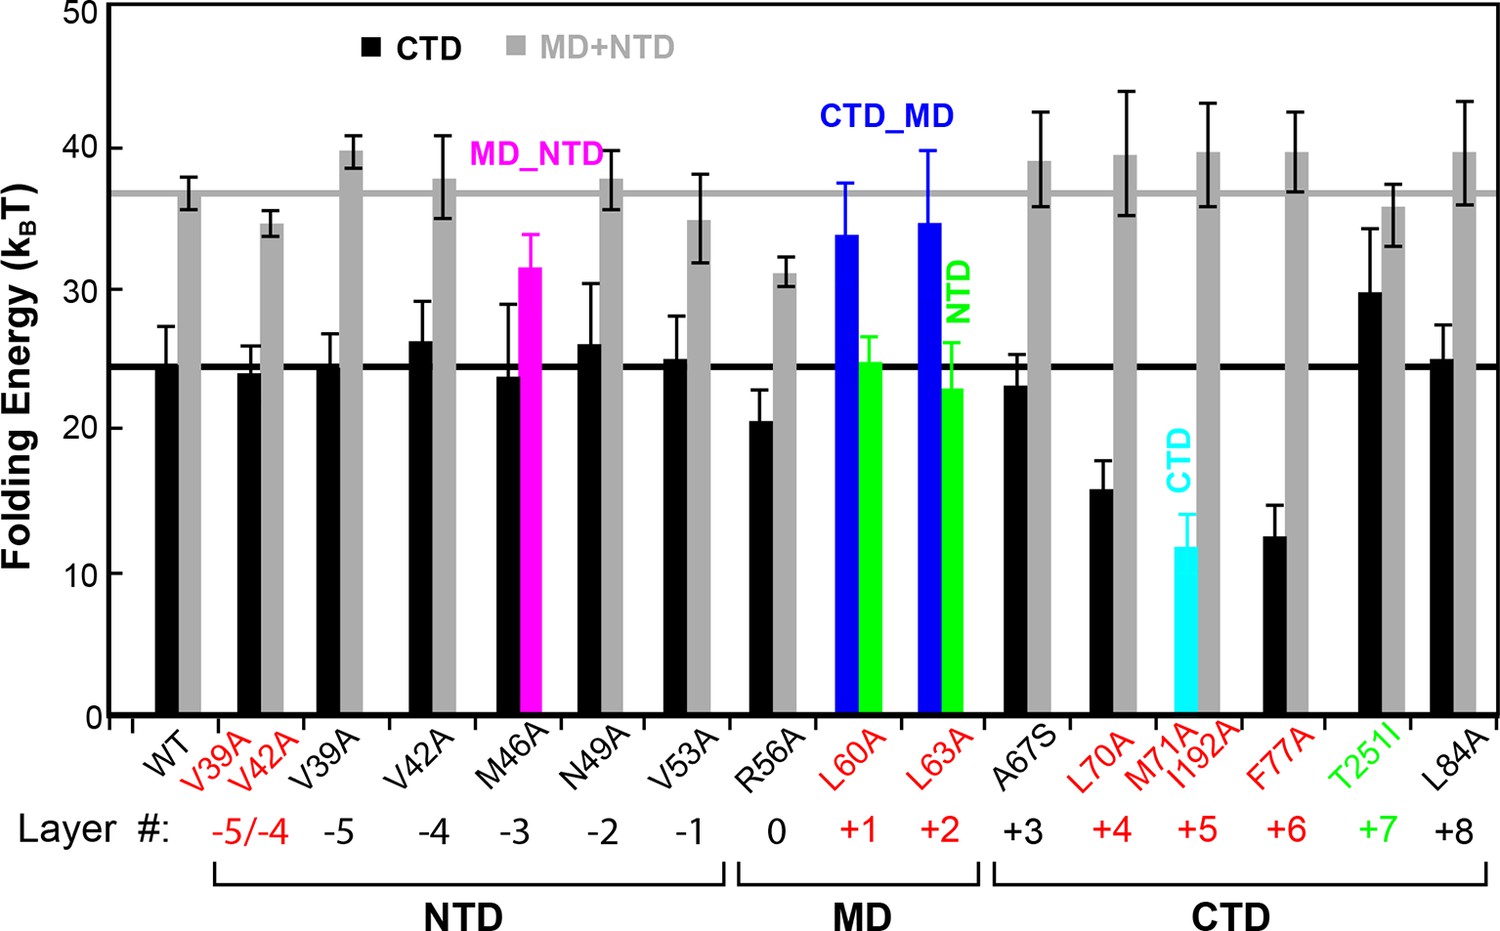
Layer mutations differentially affect folding energies and pathways of SNARE assembly.
The wild-type and most mutant SNARE complexes assemble sequentially in the order of NTD, MD, CTD, and LD, with their total MD and NTD (MD+NTD) energies and CTD energies shown in black and gray bars, respectively. The energies of CTD and MD+NTD of the wild-type SNARE complex are marked by black and gray lines, respectively. Other mutants contain cooperative transitions involving two domains (Figure 4—figure supplement 1), which are indicated by colored bars. The double mutations in the +5 layer in SNAP-25 cause cooperative LD and CTD transition, but only the CTD energy is shown for better comparison, assuming an LD folding energy of 8 kBT (Gao et al., 2012). The mutant amino acids and their layer numbers that impair or enhance exocytosis are colored in red or green, respectively. Error bars represent standard deviations of the measurement. CTD, C-terminal domain; LD, linker domain; MD, middle domain; NTD, N-terminal domain.
Figure 8
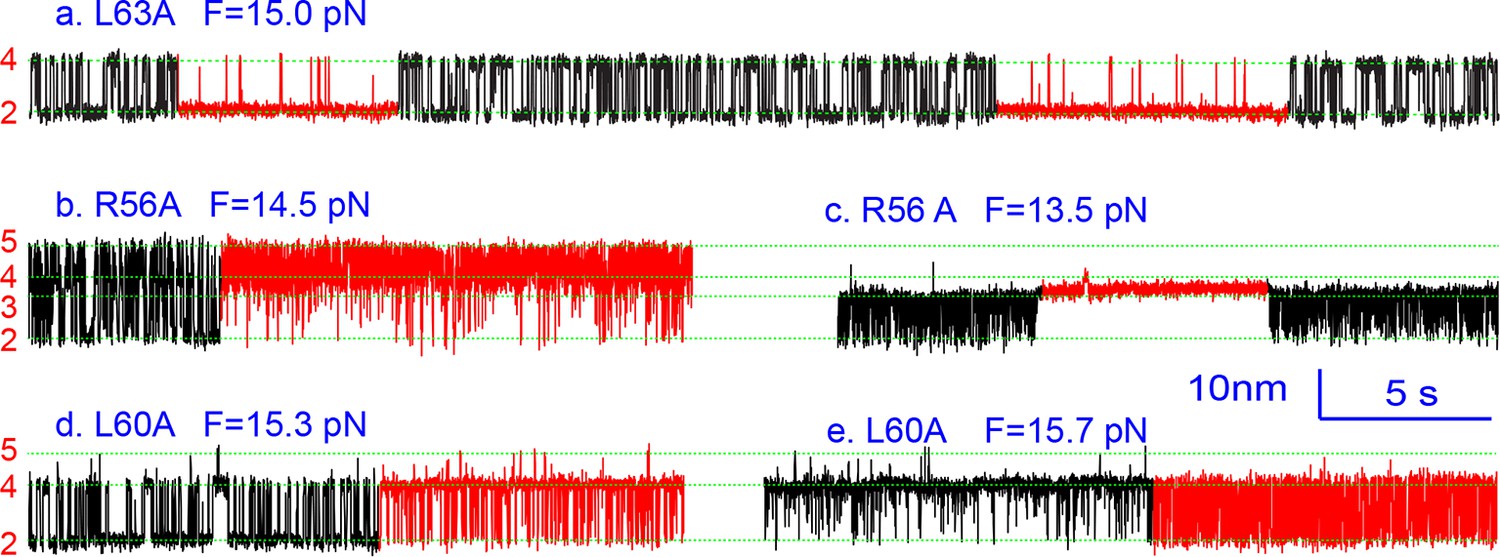
Extension-time trajectories showing kinetic heterogeneity in SNARE folding due to MD Layer Mutation.
The canonical (occurring more frequently) and the altered transitions are shown in black and red, respectively. The heterogeneity in SNARE assembly was manifested by abrupt changes in transition rates and state populations. Some of these kinetic switching events (a and c) were reversible in our experimental time scale (typically <30 min), indicating that the kinetic heterogeneity was caused neither by impurities in our SNARE constructs nor by photodamage of SNARE proteins in optical traps. However, the underlying molecular mechanism for such heterogeneity is unknown, but likely related to the metastable t-SNARE complex.
Figure 9
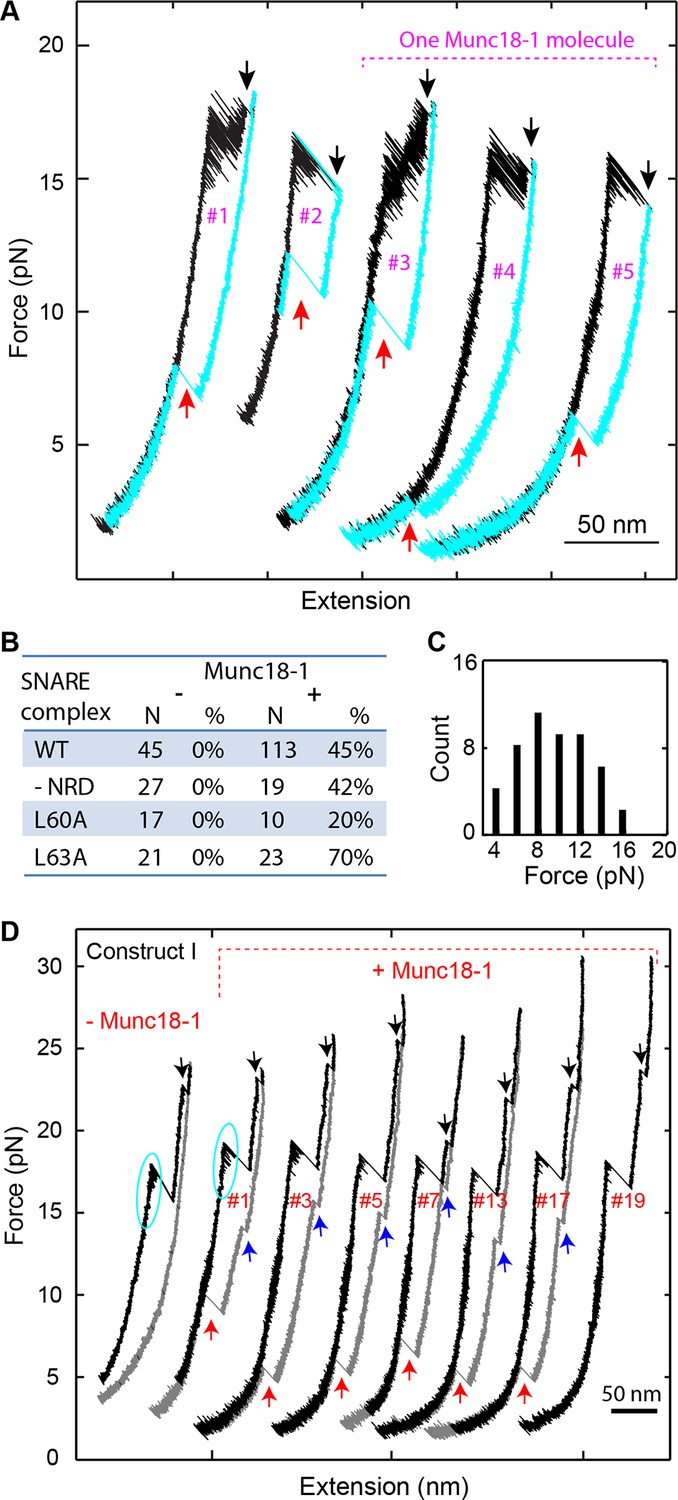
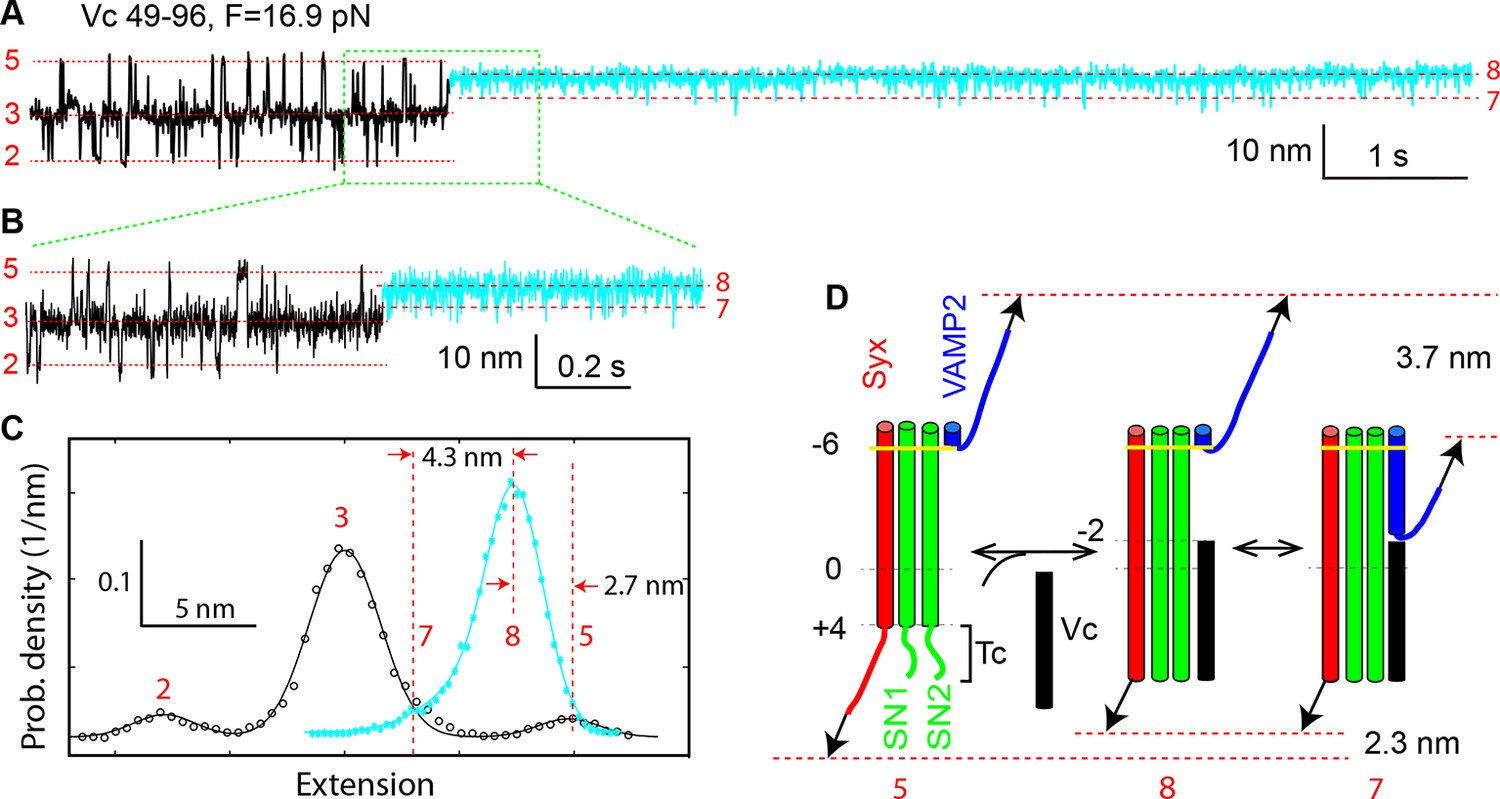
Munc18-1 helps to initiate SNARE assembly.
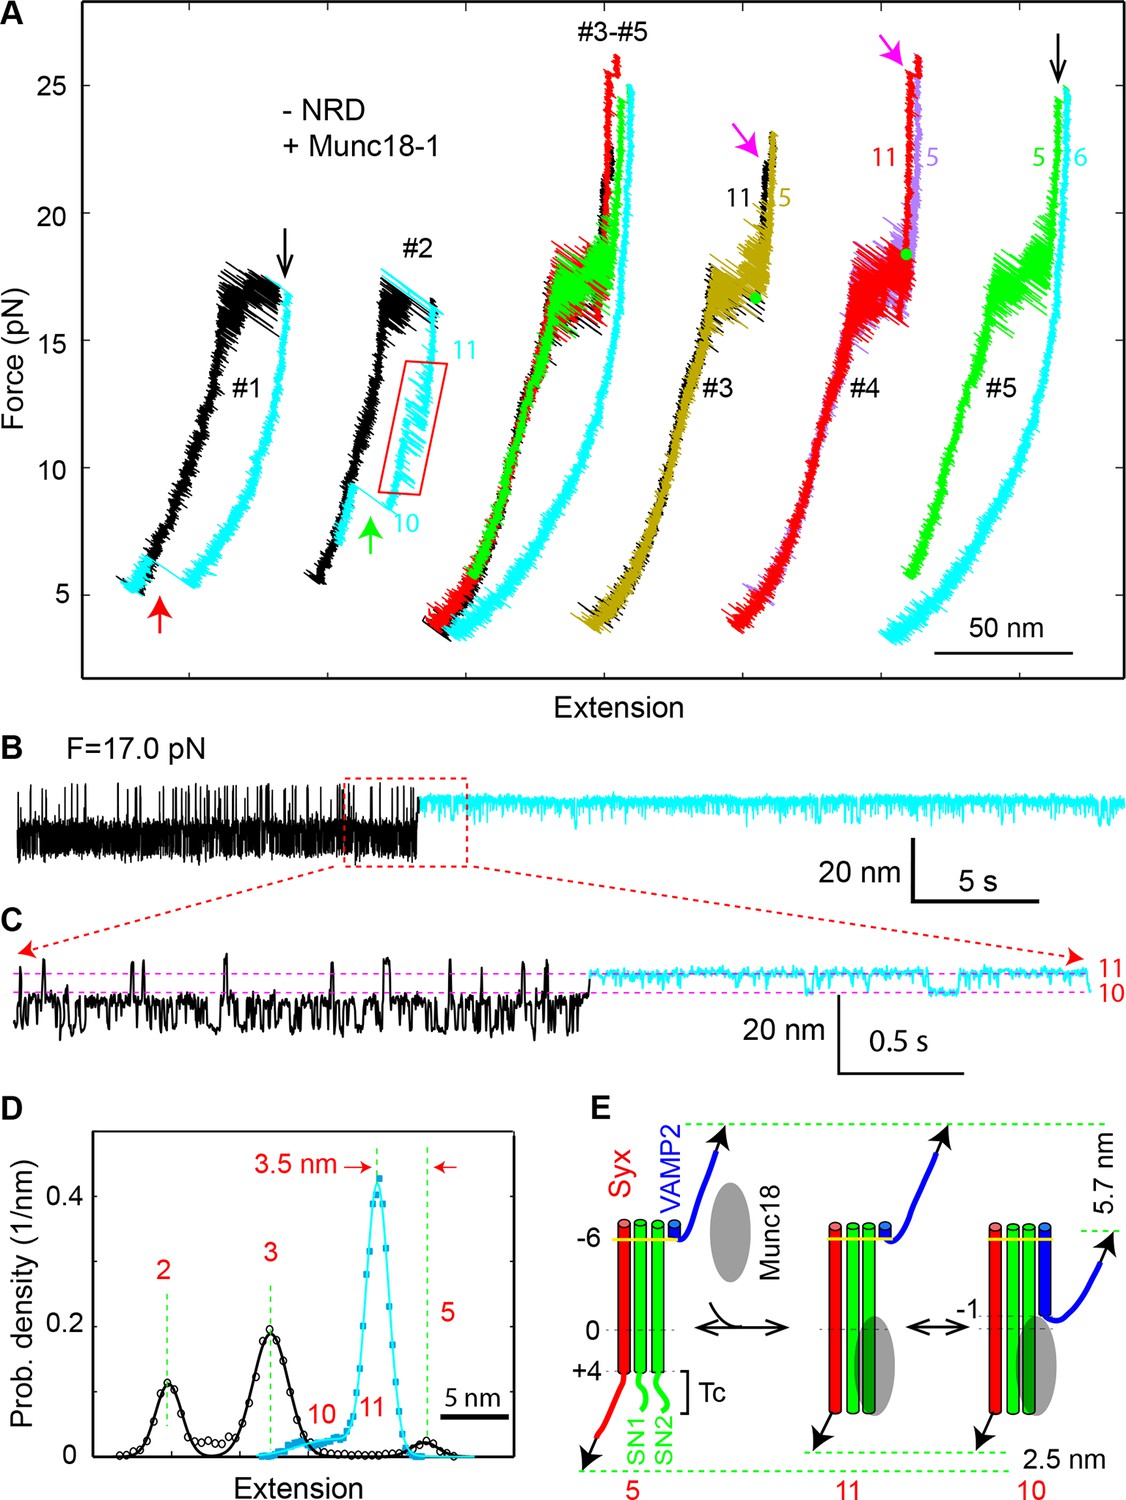
(A) FECs of single SNARE complexes obtained in the presence of 10 µM Munc18-1 in the solution. Black and red arrows indicate t-SNARE unfolding and de novo SNARE reassembly, respectively. The FECs #3-#5 were obtained by consecutively pulling and relaxing the same SNARE complex. (B) Percentage of de novo assembly (%) among a total number of unfolded SNARE complexes tested (N) for the wild-type (WT), NRD-removed (-NRD), and mutant (L60A and L63A) SNARE complexes in the presence (+) or absence (−) of 10 µM Munc18-1. (C) Histogram distributions of the forces associated with the Munc18-1-mediated de novoSNARE assembly. (D) FECs of the SNARE complexes crosslinked at a site N-terminal to the SNARE motifs (Figure 1—figure supplement 1, construct I) in the absence (−Munc18-1) or presence (+Munc18-1) of Munc18-1. In the absence of Munc18-1, SNAP-25 tended to dissociate from the tethered syntaxin and VAMP2 when the t-SNARE complex was unfolded (black arrows). As a result, the SNARE complex generally reassembled for no more than four rounds during repetitive pulling and relaxation (Gao et al., 2012). However, in the presence of 10 µM Munc18-1, the yield of SNARE reassembly was greatly enhanced, leading to robust SNARE disassembly and reassembly for at least 19 rounds on the single SNARE complex. For clarity, only the FECs of some rounds of pulling and relaxation (indicated by the red numbers) are shown. In this case, full SNARE reassembly (red arrows) was preceded by t-SNARE formation (blue arrows) in the force range of 12-17 pN, due to the slow and force-sensitive NTD assembly of this construct. FECs, force-extension curves; NTD, N-terminal domain.
Figure 10

Munc18-1 stabilizes the half-zippered SNARE complex.
(A–B) Extension-time trajectories of single wild-type or mutant (L70A) SNARE complexes under constant forces in the presence of 10 µM Munc18-1 in the solution. The red regions indicate the Munc18-1-bound state (state 9). A close-up view of the region in the dashed rectangle in i is shown in (B), iv. (C) Histogram distribution of the dwell times of the Munc18-1-stabilized half-zippered state. (D) Histogram distribution of the forces of the Munc18-1-stabilized half-zippered state. (E) Probability density distributions of the extensions of the Munc18-1-unbound states (black) and the Munc18-1-bound state (red) calculated from the corresponding regions in trace ii in A. Different peaks represent different SNARE folding states numbered as in Figure 1D.
Figure 11 with 3 supplements
Munc18-1 stabilizes the half-zippered SNARE complex in an NRD-dependent manner and binds the t-SNARE complex to structure Tc in an NRD-independent manner.
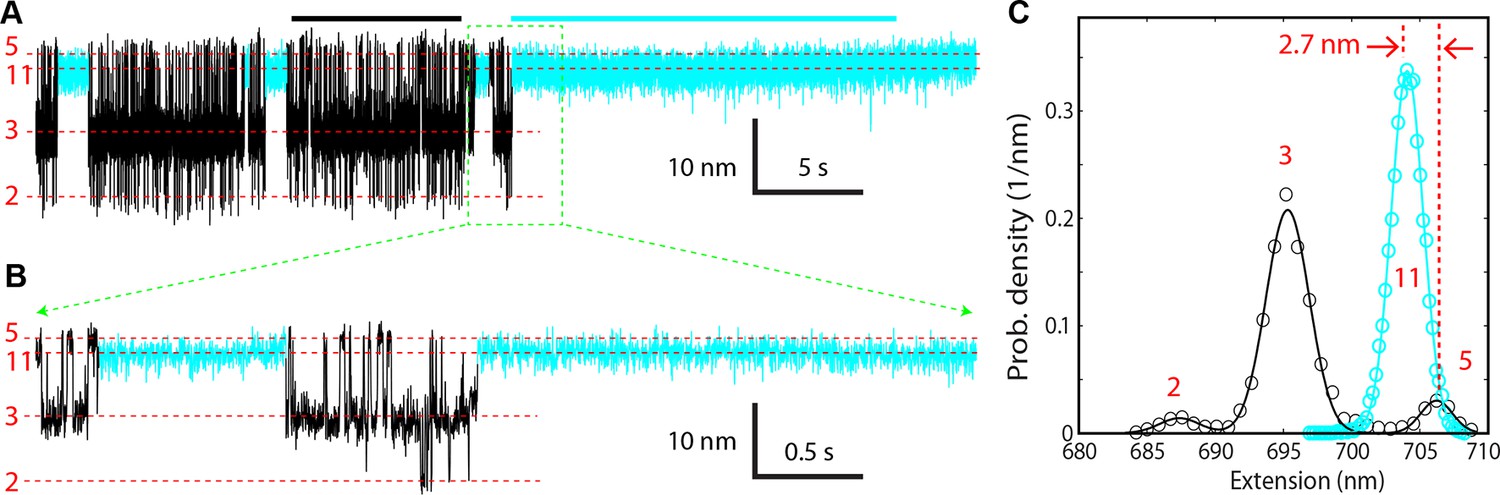
(A) FECs of the SNARE complex lacking the NRD in the presence of 10 µM Munc18-1 in the solution. The rectangle marks the Munc18-1-mediated reversible transition in FEC #2 between states 10 and 11 illustrated in E. The FECs #3-#5 were obtained from the same SNARE complex in three consecutive rounds of pulling and relaxation. The FECs of different rounds overlap well (#3-#5) but are shifted along the x-axis for clarity (#3, #4, and #5). The states corresponding to some regions of FECs are indicated by their corresponding state numbers (Figures 11E and 1D). In FECs #3 and #4 the point of Munc18-1 binding is marked by a green dot. (B–C) Extension-time trajectories of the SNARE complex lacking an NRD under constant forces in the presence of 10 µM Munc18-1. The cyan regions indicate the Munc18-1-bound states (states 10 and 11). A close-up view of the region in B in the dashed rectangle is shown in (C). (D) Probability density distributions of the extensions of the Munc18-1-unbound states (black) and the Munc18-1-bound states (cyan) calculated from the corresponding regions in the trace shown in B. Different peaks represent different SNARE folding states numbered in red as in E and Figure 1D. (E) Diagram illustrating effects of Munc18-1 on assembly of the SNARE complex lacking an NRD and the associated average extension changes of the different states. FECs, force-extension curves; NRD, N-terminal regulatory domain.
Figure 11—figure supplement 1
(A–B) Extension-time trajectory of the SNARE complex lacking an NRD in the presence of 10 μM Munc18-1 in the solution.
The regions corresponding to the Munc18-1-bound states are colored cyan. The positions of different states are marked by red dashed lines. A close-up view of the region in (A) marked by a rectangle is shown in (B). (C) Probability density distributions (symbols) of the extensions corresponding to regions in A marked by black and cyan bars without and with Munc18-1 bound. The lines are best-fits of the distributions using a sum of three or one Gaussian function for the Munc18-1-unbound states or Munc18-bound states, respectively. NRD, N-terminal regulatory domain.
Figure 11—figure supplement 2
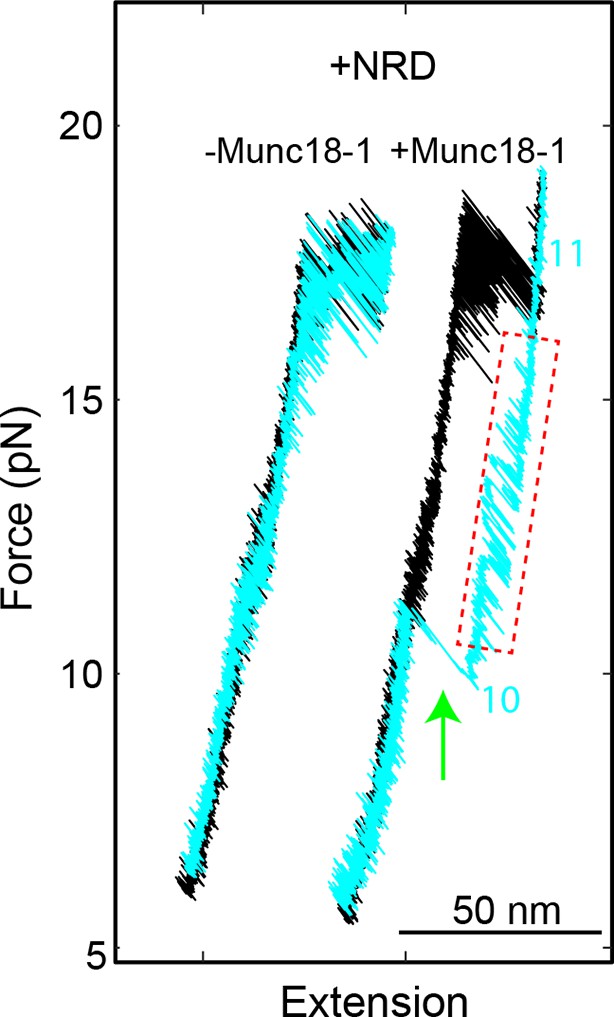
FECs of the SNARE complexes with the NRD (+NRD) obtained in the absence (−Munc18-1) or presence (+Munc18-1) of 10 µM Munc18-1.
The region marked by a red rectangle shows the Munc18-1-mediated conformational transition between states 10 and 11 illustrated in Figure 11E. The green arrow indicates Munc18-1 displacement and SNARE reassembly. Compared with the FEC of the SNARE complex lacking the NRD (Figure 11A, #2), the results here suggest that even in the presence of the NRD, Munc18-1 could bypass the NRD to bind the SNARE complex in an NRD-independent manner. FECs, force-extension curves; NRD, N-terminal regulatory domain.
Figure 11—figure supplement 3
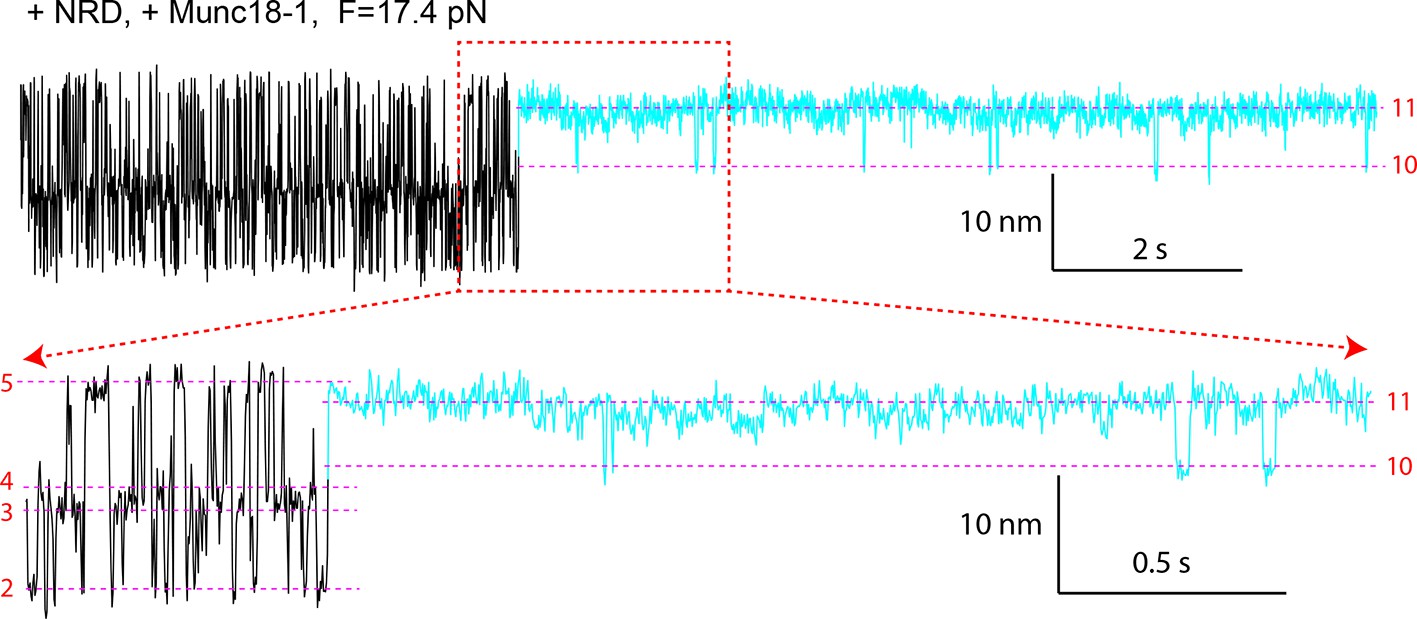
Extension-time trajectory of the wild-type SNARE complex with the NRD in the presence of 10 μM Munc18-1.
The regions corresponding to the Munc18-1-bound states are colored cyan. The positions of different states are marked by red dashed lines. A close-up view of the region in the top trace marked by a rectangle is shown at the bottom. Compared with the trajectories for the SNARE complex lacking the NRD (Figure 11B,C), the trajectories here demonstrate that Munc18-1 could tightly bind t-SNARE and structure Tc in an NRD-independent manner, even in the presence of the NRD. NRD, N-terminal regulatory domain.
Figure 12
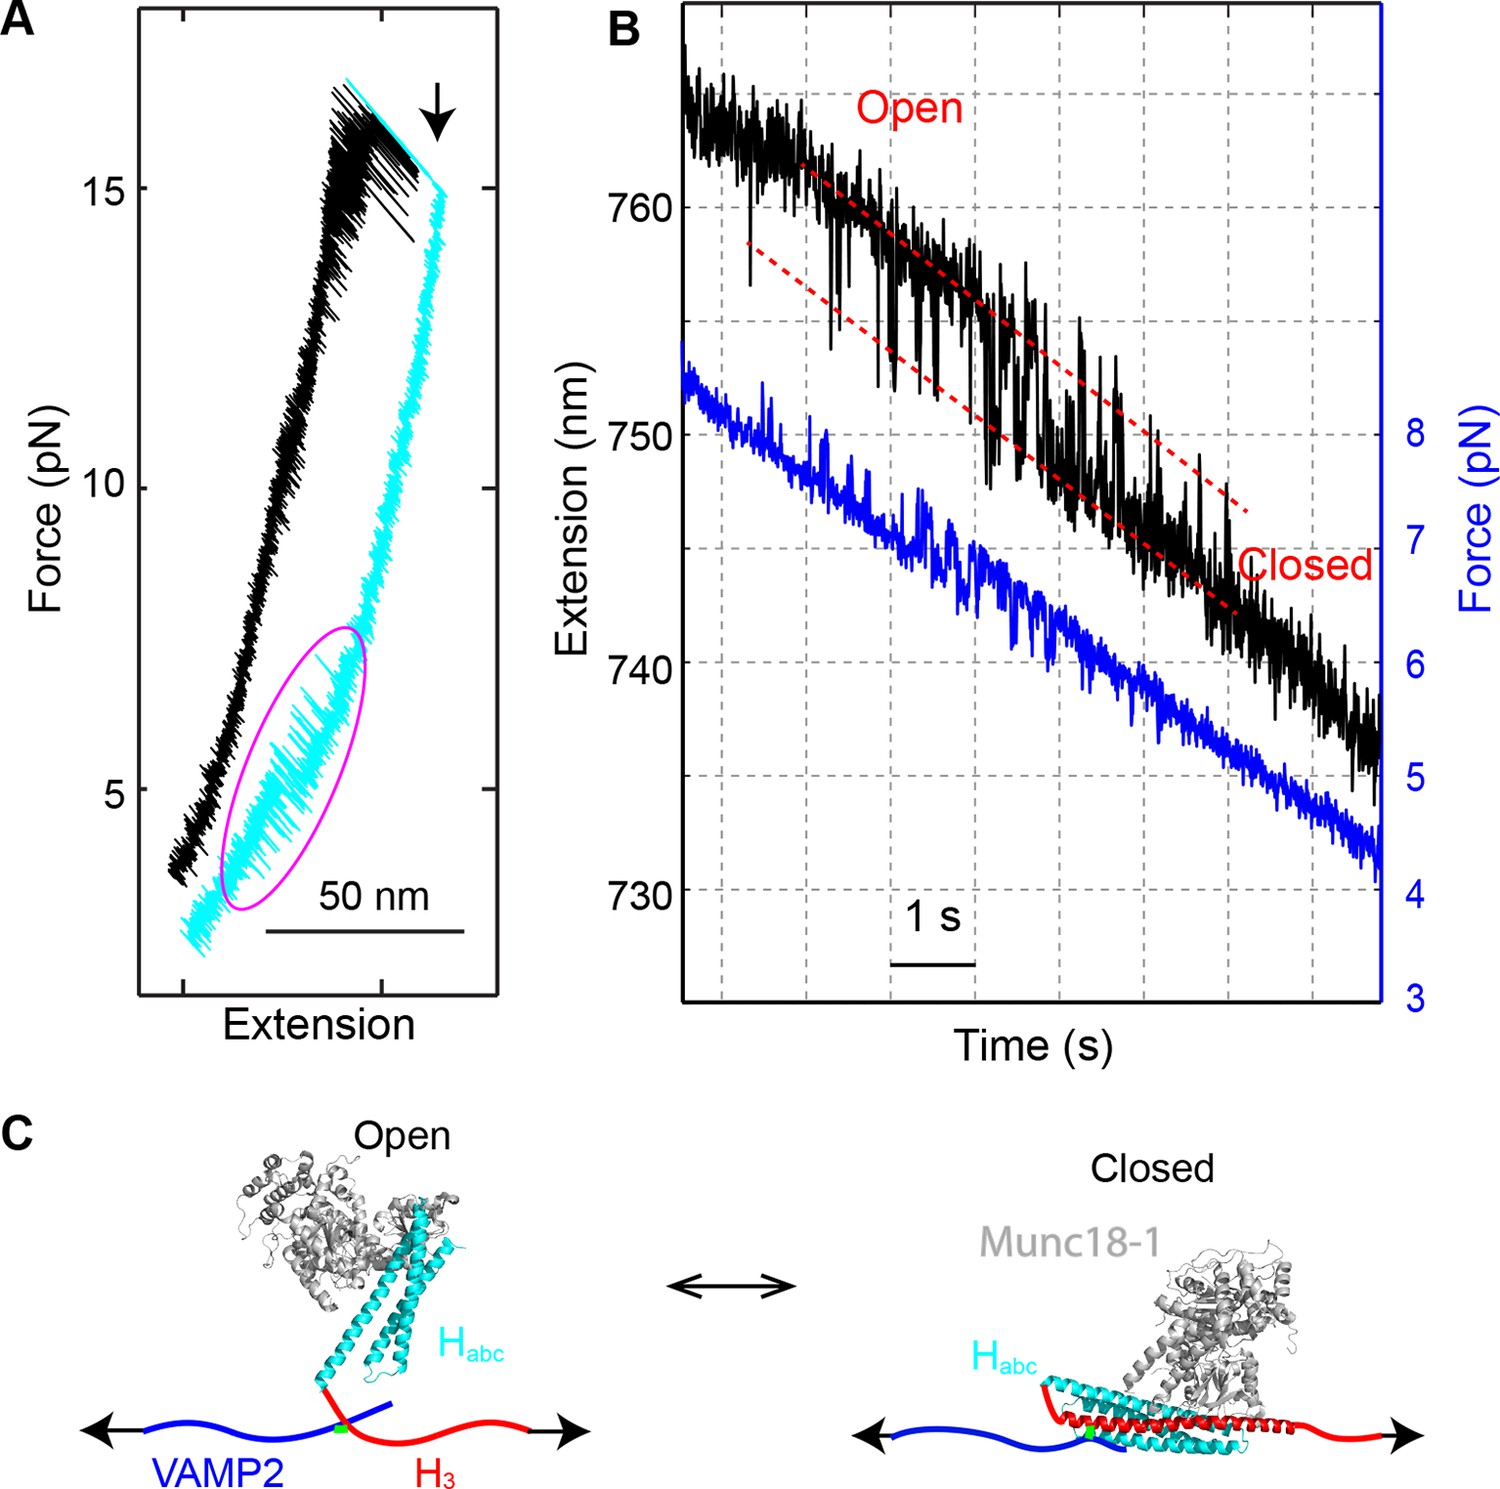
Munc18-1 only loosely closes syntaxin.
(A) FECs obtained by pulling (black) and then relaxing (cyan) the SNARE complex. A magenta oval marks the Munc18-1-mediated syntaxin opening and closing transition illustrated in C. A black arrow indicates the t-SNARE unfolding event. (B) Time-dependent extension (black) and force (blue) showing opening and closing transitions of syntaxin as the SNARE complex was being relaxed in the presence of 10 µM Munc18-1. (C) Diagram of the derived syntaxin conformational transition.
Figure 13
Opening the closed syntaxin by force.
(A) Syntaxin construct pulled from its N- and C-termini to study the syntaxin conformational transition mediated by Munc18-1 (not shown). The syntaxin molecule contained a C-terminal Avi-tag and a cysteine inserted after amino acid D25, which was used to crosslink syntaxin to the DNA handle. (B) Predicted conformational transitions of the syntaxin molecule induced by force. (C) Representative FECs in the absence (−) and presence (+) of Munc18-1 confirming the predicted conformational transitions shown in (B). FECs, force-extension curves.
Figure 14
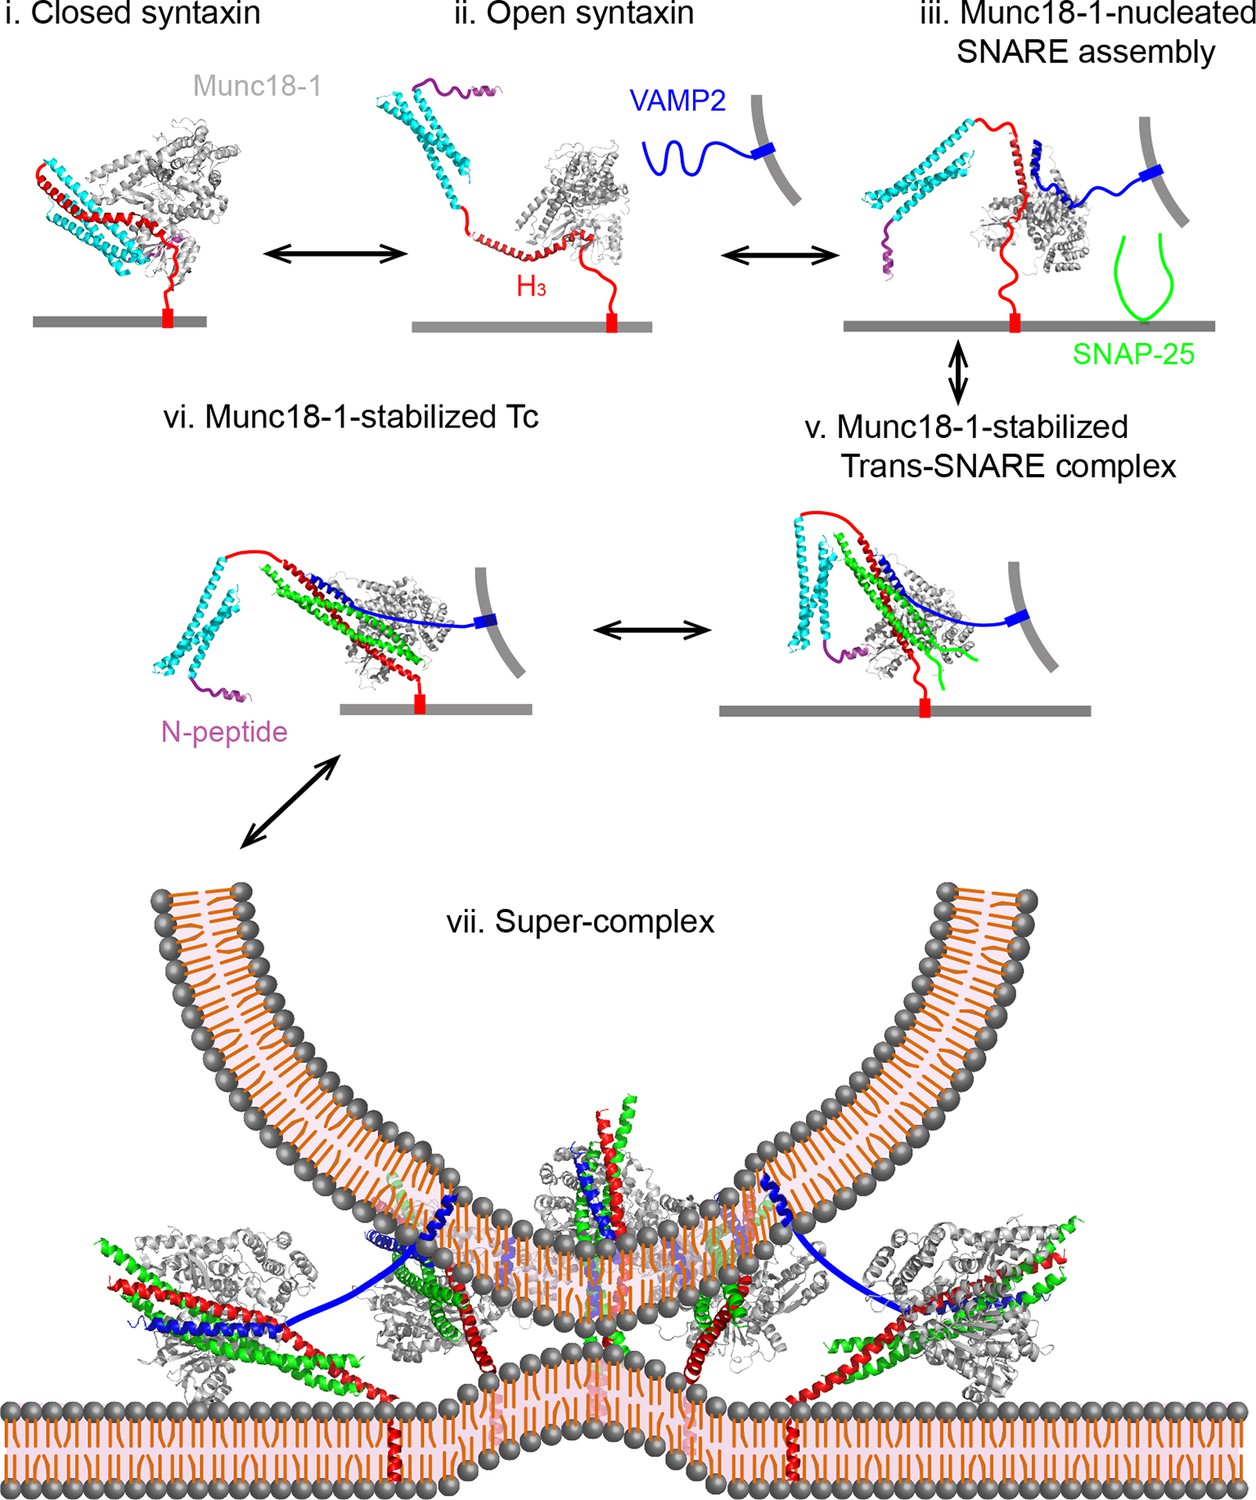
Working model of Munc18-1-regulated stage-wise SNARE assembly in membrane fusion.
See the main text for details. Munc18-1 undergoes a conformation transition to open the syntaxin molecule (from states i to ii) and form the VAMP2 binding surface (Hu et al., 2011; Parisotto et al., 2014). Thus, syntaxin opening and the template formation in state iii may be cooperative, which likely leads to a transient open syntaxin conformation shown in state ii.
Videos
Video 1
Optical tweezers manipulate a single SNARE complex to reveal its folding intermediates, energetics, and kinetics.
Not drawn to scale. Note that the single-SNARE complex was being pulled or relaxed by moving the optical trap on the right (not shown) at a speed of 10 nm/s. The tension and extension of the DNA-protein tether was monitored to derive the conformations, energetics, and kinetics of SNARE assembly.
Video 2
Force-induced SNARE folding and unfolding transitions under thermodynamic equilibrium among four distinct states.
The single SNARE complex was held at the indicated mean force at a constant trap separation. The stochastic unfolding and refolding transitions of the SNARE complex represent its thermodynamic fluctuations when the free energies of the four states become close (<5 kBT) in the presence of force (Liphardt et al., 2001).
Download links
A two-part list of links to download the article, or parts of the article, in various formats.
Downloads (link to download the article as PDF)
Open citations (links to open the citations from this article in various online reference manager services)
Cite this article (links to download the citations from this article in formats compatible with various reference manager tools)
Munc18-1-regulated stage-wise SNARE assembly underlying synaptic exocytosis
eLife 4:e09580.
https://doi.org/10.7554/eLife.09580


