Neuron-glia signaling in developing retina mediated by neurotransmitter spillover
- University of California, Berkeley, United States
- Johns Hopkins School of Medicine, United States
Figures
Figure 1 with 1 supplement
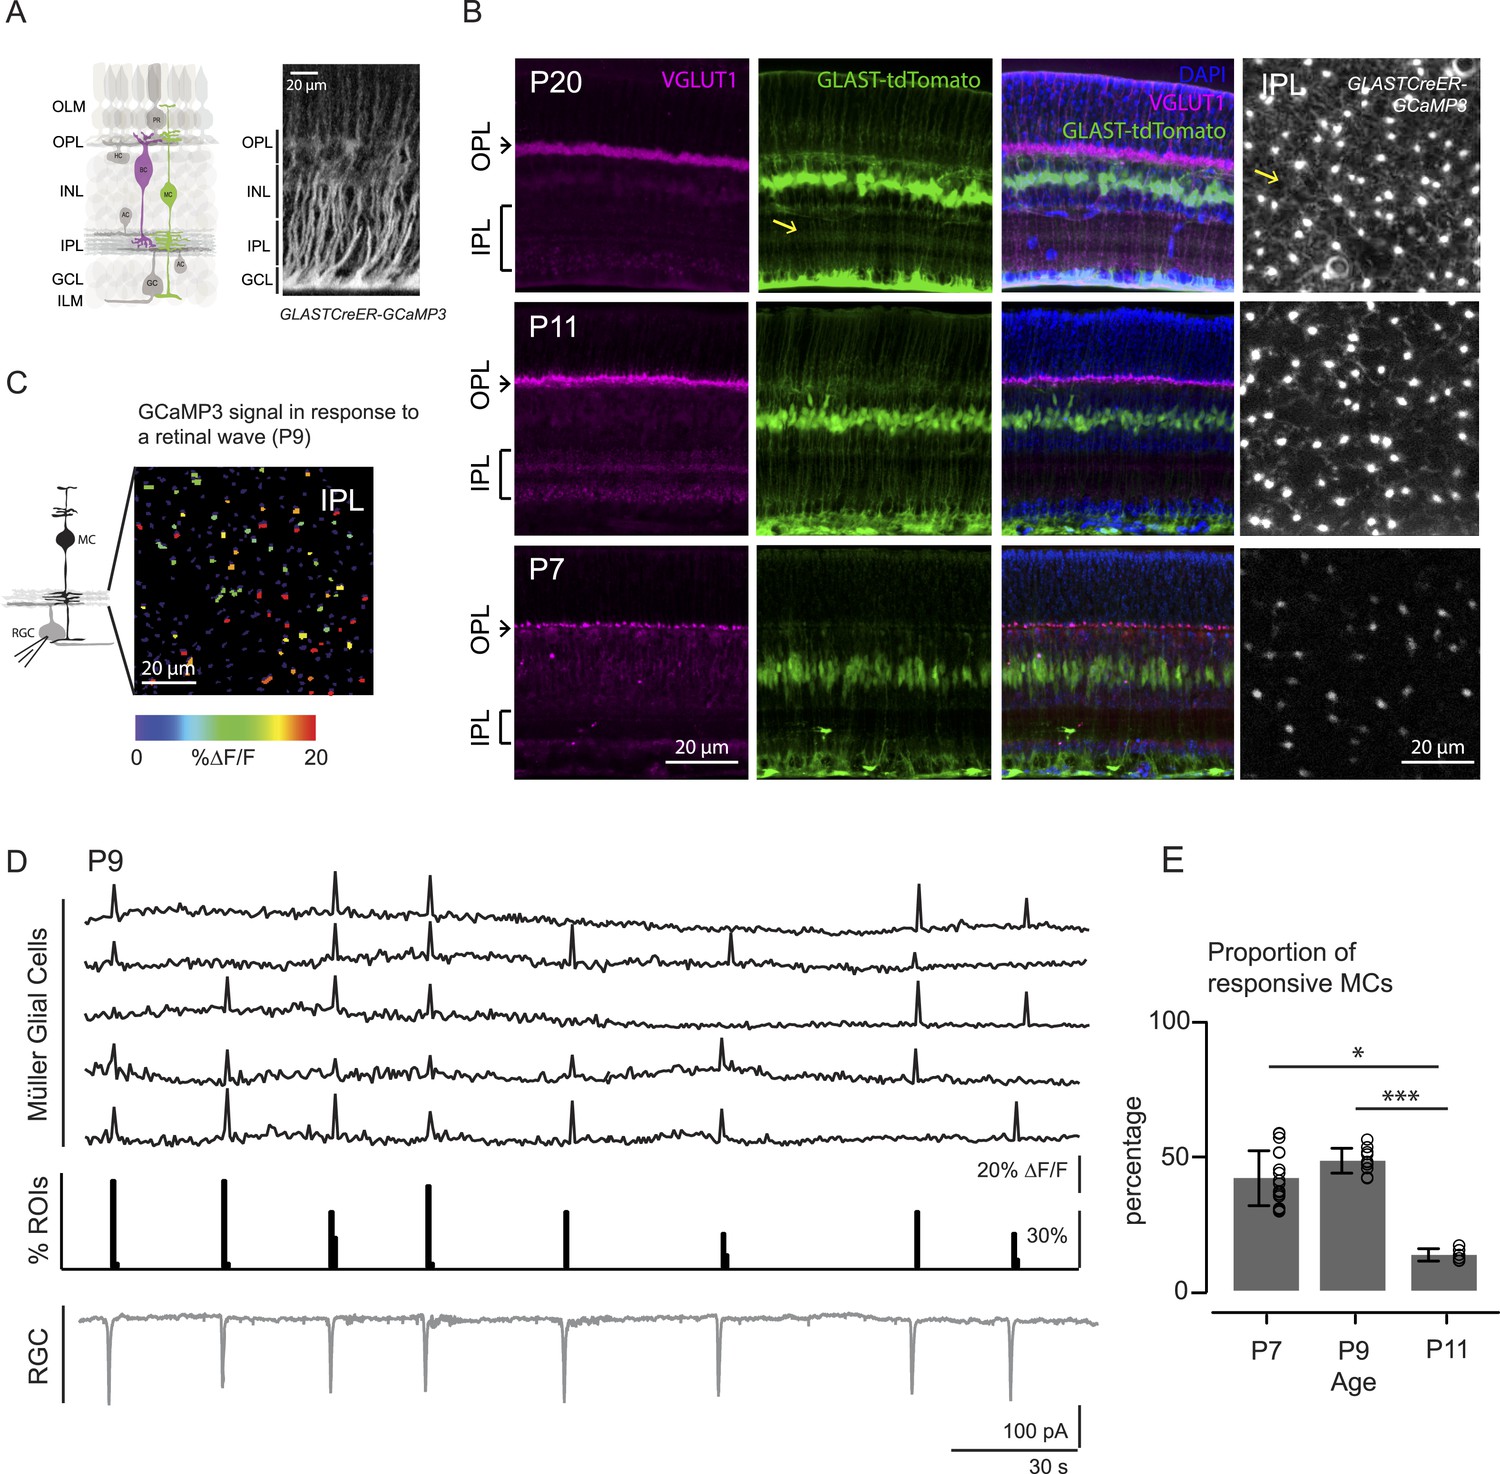
Morphology of Müller glial cells and their interactions with neurons change over development.
(A) Left, Diagram of adult retinal cross-section illustrates layered circuitry (OLM: outer limiting membrane; OPL: outer plexiform layer; INL: inner nuclear layer; IPL: inner plexiform layer; GCL: ganglion cell layer; ILM: inner limiting membrane) and main cell types (PR: photoreceptor; HC: horizontal cell; BC: bipolar cell; MC: Müller glial cell; AC: amacrine cell; GC: ganglion cell). Right, Orthogonal projection of two-photon Z-stacks shows GCaMP3 expression in MCs of a P22 GLASTCreER::GCaMP3 mouse retina. (B) Vibratome sections of GLASTCreER::tdTomato retinas show the structure of MCs (green; tdTomato) and the expression of vesicular glutamate transporter 1 (VGLUT1) in bipolar cells (magenta; anti-VGLUT1) at different ages. Blue stain is 4′,6-diamidino-2-phenylindoele (DAPI) for visualizing cell nuclei as landmarks. Rightmost images are XY planes of the IPLs in GLASTCreER::GCaMP3 retinas showing GCaMP3 signal at different ages. Note the expansion of MC lateral processes into the IPL with development. Yellow arrows indicate lateral processes of the Müller glial cells. (C) Left, Circuit diagram of the retina highlights cells recorded for figures C and D; labeling as in Figure 1A. Right, XY plane shows GCaMP3 signals of MCs in response to a retinal wave in a P9 GLASTCreER::GCaMP3 retina. Color scale indicates normalized changes in fluorescence during a retinal wave. (D) Simultaneous MC calcium imaging and retinal ganglion cell (RGC) whole-cell voltage-clamp recording (Vm = −60 mV) of a P9 GLASTCreER::GCaMP3 retina. Sample ∆F/F traces (black traces) from individual regions of interests (ROIs) (that include stalks and processes of the MC population) in response to neuronal waves recorded in a RGC (grey trace). Histogram in middle denotes percentage over time of ROIs with responsive MCs. (E) Percentage of ROIs with responsive MCs during at least one retinal wave at different ages. P7: 1326 ROIs from 11 retinas; P9: 3027 ROIs from 14 retinas; P11: 872 ROIs from 6 retinas. Kruskal–Wallis one-way ANOVA, Dunn's post-hoc test. ***p < 0.001 and *p < 0.05. See also Figure 1—figure supplement 1 and Video 1.
Figure 1—figure supplement 1

Comparison of two-photon calcium imaging signals in stalks and lateral processes of MCs.
MC calcium transients were not compartmentalized within lateral processes, but were equally present in both lateral processes and stalks within the IPL. (A) Vibratome sections of GLASTCreER::TdTomato retina show the widespread expression across the slice (left). Higher resolution image of boxed portion of retina (right). Blue labeling: DAPI stained nuclei. (B) XY plane of an IPL shows MCs expressing GCaMP3 in a P9 retina (top). ROI mask was generated as described in ‘Materials and methods’ for A (middle). Stalks (yellow) and lateral processes (red) could be distinguished among all ROIs (bottom). ROIs presenting a round-shaped area were defined as stalks; the rest were defined as lateral processes. Yellow and red rectangles distinguish stalks from lateral processes, respectively. (C) Simultaneous calcium imaging of MC stalks and lateral processes and whole-cell voltage-clamp recording of a RGC (grey trace, Vm = −60 mV) monitored in the same field of view in a P9 GLASTCreER::GCaMP3 retina. (D) Left, Comparison of averaged calcium signals (ΔF/F) from lateral processes, stalks and all ROIs (stalks + lateral processes) evoked by a neuronal wave indicated by the inward current (black trace, bottom). The vertical dashed line denotes the beginning of the neuronal wave. Right, Graph summarizes these averaged calcium signals (ΔF/F). Error bars are standard deviations. Stalks: 86 ROIs from 2 retinas; lateral processes: 94 ROIs from 2 retinas. (E) Graph summarizes percentage of ROIs with MC parts that respond to at least one retinal wave. Error bars are standard deviations. (F) Line scans across MCs show a GCaMP3 signal duration of ∼3–5 s. Our standard rate of acquisition is 0.74 or 1.7 Hz. Thus to determine if we were missing any shorter MC calcium transients and to compare the temporal resolution from our standard acquisition, we used line scans to image several MCs at 300 Hz and found that the duration of each calcium transient was still ∼3–5 s. Left; Fluorescent image at the level of the IPL with line scan location (magenta); X-time (t) plot below image shows 3 example ROIs drawn around MC stalks. Right; GCaMP3 fluorescent signals from these 3 ROIs. Line scan acquisition is ∼300 Hz. Calcium transients indicate a response to neuronal activity. Notably we did not observe any calcium transients with line scan that had durations shorter than our standard imaging rate.
Figure 2
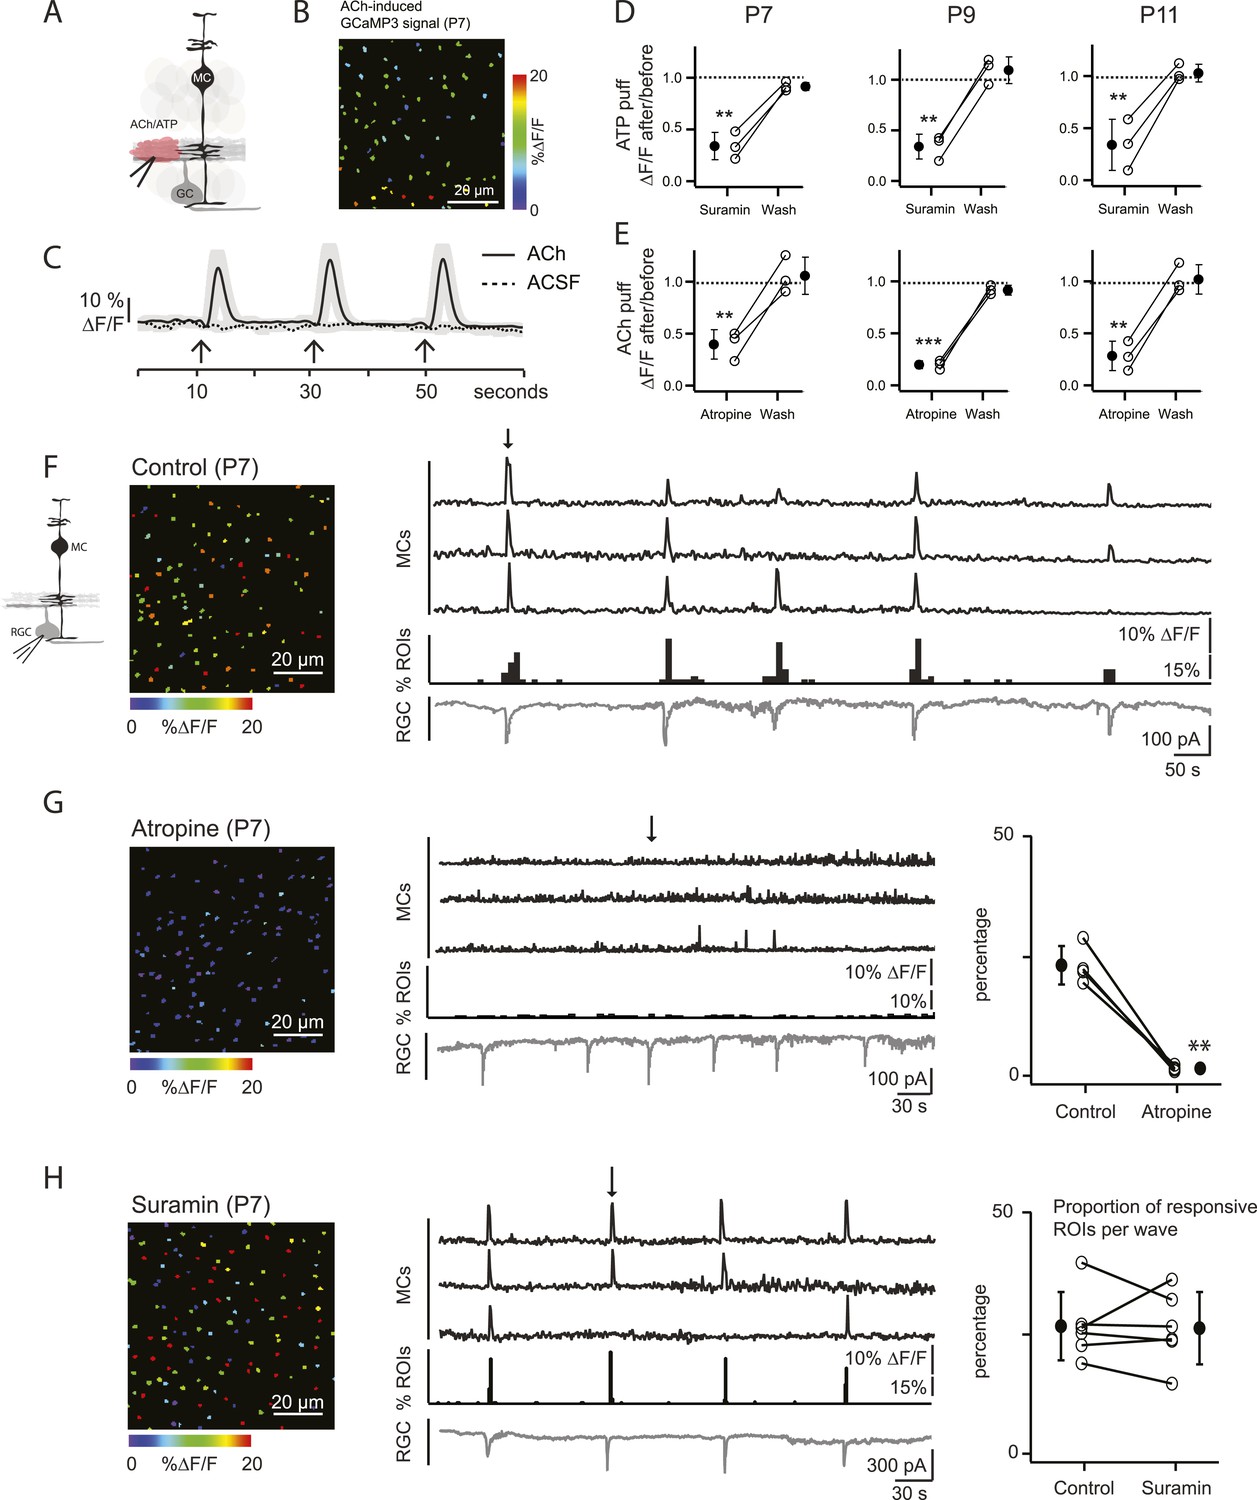
Volume release of acetylcholine (ACh) during P7 retinal waves induces calcium transients in MCs.
(A) Diagram of retinal cross-section illustrates focal application of the agonist (pink) at the junction between the IPL and the GCL; labeling as in Figure 1. (B) XY plane of the IPL from a P7 GLASTCreER::GCaMP3 retina showing fluorescent signals in MCs during a focal application of acetylcholine (ACh, 1 mM, 100 ms) pseudocolored as in Figure 1C. (C) Averaged MC calcium signals (ΔF/F) in a ROI evoked by a sequence of 3 focal applications of ACh (solid line; 78 ROIs from 1 retina) or artificial cerebrospinal fluid (ACSF, dashed line; 429 ROIs from 3 retinas). Black arrows indicate agonist application. Shaded areas represent standard deviation. (D) Averaged MC calcium signals (ΔF/F) evoked by focal application of ATP in the absence and presence of the non-specific P2 receptor blocker suramin (100 μM) at P7, P9 and P11. P7: 158 ROIs in control and 142 ROIs in suramin from 3 retinas; P9: 201 ROIs in control and 151 ROIs in suramin from 3 retinas; P11: 139 ROIs in control and 123 in suramin from 3 retinas. Black circle and error bars show mean ±SD. One-way ANOVA, Tukey post-hoc test ***p < 0.001; **p < 0.01. (E) Averaged MC calcium signals (ΔF/F) evoked by focal applications of ACh in the absence and presence of the muscarinic cholinergic receptor blocker atropine (50 μM) at P7, P9 and P11. P7: 256 ROIs in control and 396 ROIs in atropine from 3 retinas; P9: 234 ROIs in control and 264 ROIs in atropine from 3 retinas; P11: 183 ROIs in control and 121 ROIs in atropine from 3 retinas. One-way ANOVA, Tukey post-hoc test ***p < 0.001; **p < 0.01. (F–H) Simultaneous MC calcium imaging (black traces) and RGC whole-cell voltage-clamp recording (grey trace, Vm = −60 mV) monitored in the same field of view from a P7 GLASTCreER::GCaMP3 retina in control solution (F), in the presence of the muscarinic acetylcholine receptor blocker atropine (50 μM) (G), or in the presence of the non-selective P2 receptor antagonist suramin (100 μM) (H). Below the MC calcium transient traces are histograms showing the percentage of ROIs with responsive MCs over time. Left, Images show XY planes of the IPL with the MC fluorescent signals occurring at the time denoted by black arrows. Right, Plots summarize effects of suramin (350 ROIs in control and 390 ROIs in suramin from 6 retinas) and atropine (267 ROIs in control and 64 ROIs in atropine from 4 retinas) on the percentage of ROIs with responsive MCs per wave. Lines connect values from one experiment in control vs blocker. Black circle and error bars show mean ±SD. t-test **p < 0.01. See also Video 2.
Figure 3
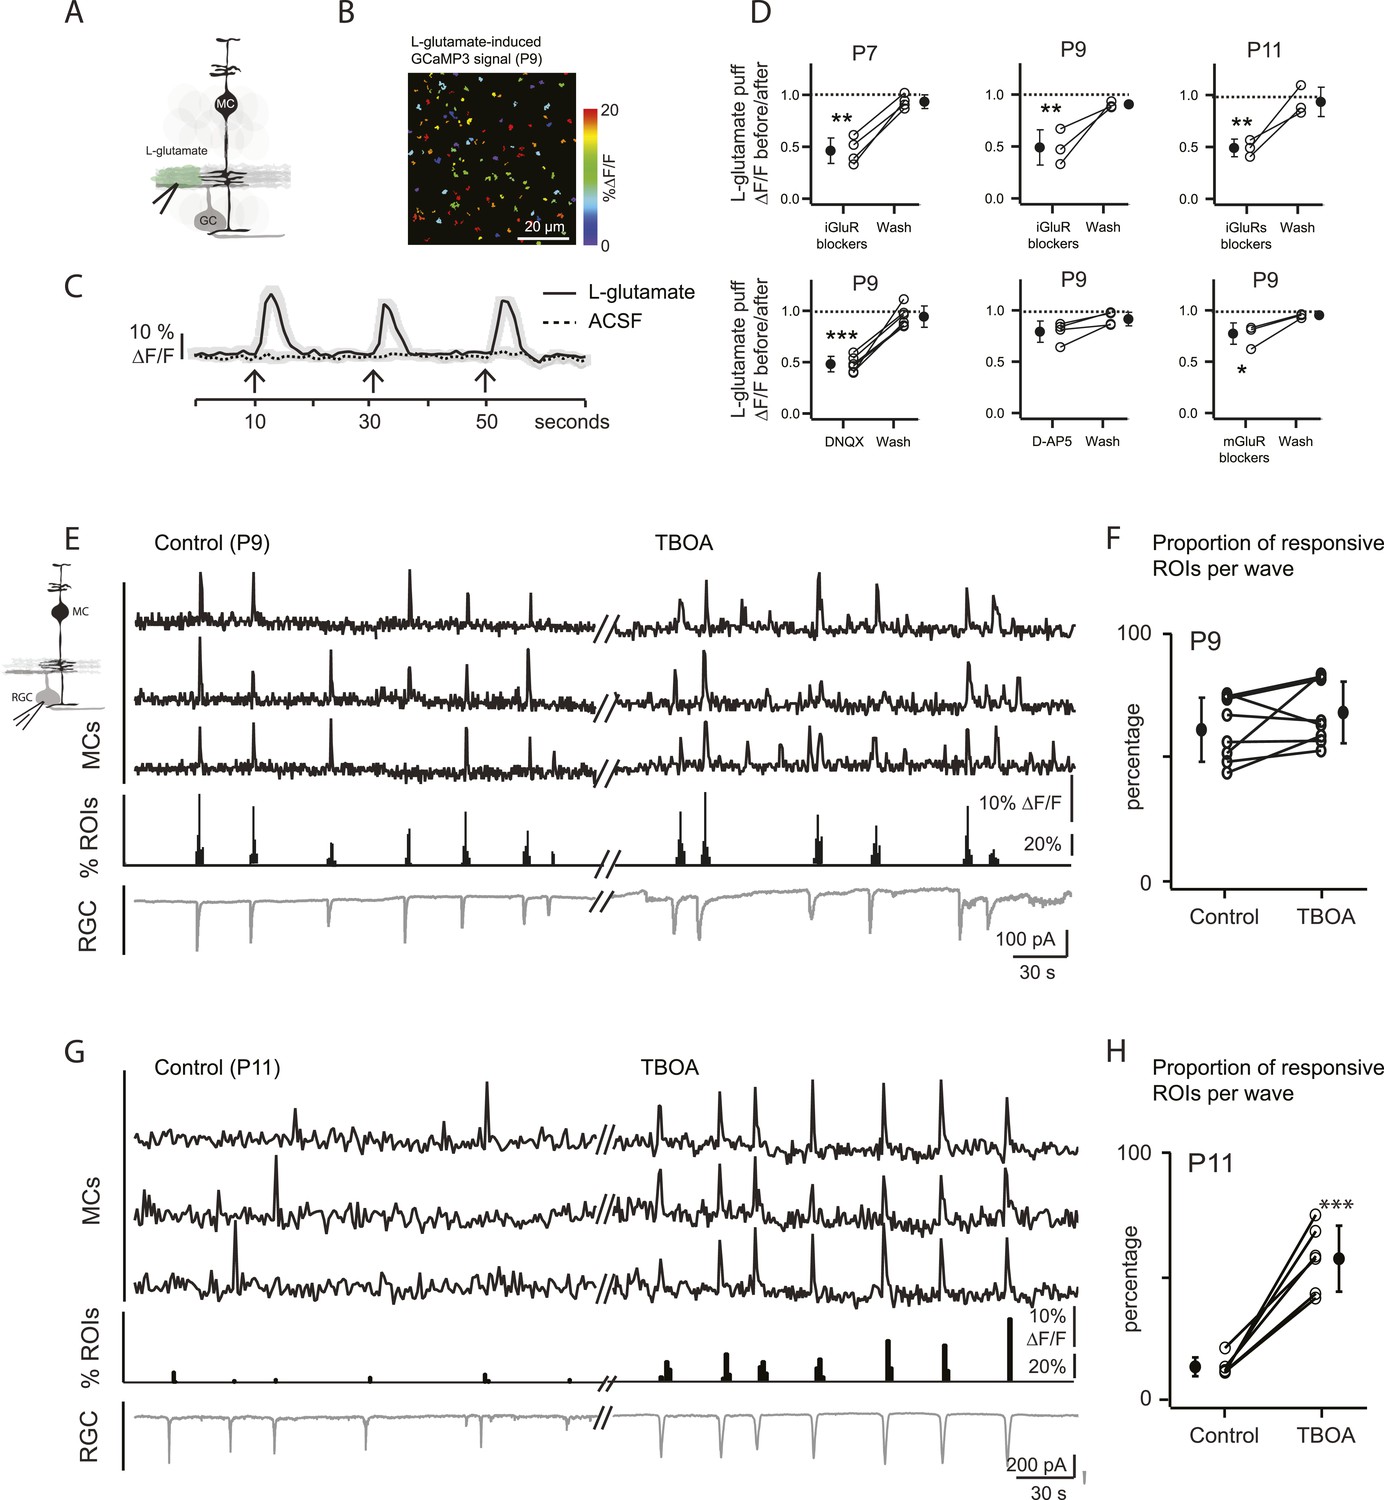
Wave-induced glial signaling is limited by extent of glutamate spillover.
(A) Diagram of retinal cross-section illustrates focal application of the agonist (green) at the junction between the IPL and the GCL; labeling as in Figure 1. (B) XY plane of the IPL from a P9 GLASTCreER::GCaMP3 retina shows fluorescent signals in MCs during short-application of L-glutamate (1 mM, 100 ms) pseudocolored as in Figure 1C. (C) Averaged MC calcium signals (ΔF/F) in a ROI evoked by a sequence of focal applications of L-glutamate (solid line; 145 ROIs from 3 retinas) or ACSF (dashed line; 78 ROIs from 1 retina). Black arrows represent agonist application. Shaded areas represent standard deviation. (D) Top, Averaged MC calcium signals (ΔF/F) evoked by focal applications of L-glutamate in the absence and presence of a cocktail of ionotropic glutamate receptor blockers (iGluR blockers; 20 μM DNQX and 50 μM D-AP5) at P7 (462 ROIs from 3 retinas), P9 (708 ROIs from 4 retinas) and P11 (1342 ROIs from 5 retinas). Bottom, Averaged MC calcium signals (ΔF/F) evoked by focal application of L-glutamate in the absence and presence of the ionotropic AMPA glutamate receptor blocker DNQX (20 μM; 1311 ROIs from 7 retinas), the ionotropic NMDA glutamate receptor blocker D-AP5 (50 μM; 907 ROIs from 4 retinas) and a cocktail of metabotropic glutamate receptor blockers (mGluR blockers; 8 μM LY341495, 100 μM MCPG and 100 μM MTEP; 937 ROIs from 4 retinas) at P9. One-way ANOVA, Tukey post-hoc test ***p < 0.001; **p < 0.01 and *p < 0.05. (E–H) Simultaneous MC calcium imaging (black traces) and RGC whole-cell voltage-clamp recording (grey trace, Vm = −60 mV) monitored in the same field of view at P9 (E) and P11 (G) in control solution and in the presence of 25 μM DL-TBOA. Below calcium traces are histograms showing the percentage of ROIs with responsive MCs over time. Plots summarize DL-TBOA effects on the percentage of ROIs with responsive MCs per retinal wave at P9 (F; 3027 ROIs in control and 3549 ROIs in DL-TBOA from 8 retinas) and P11 (H; 872 in control and 1342 in DL-TBOA from 6 retinas). Lines connect values from one experiment in control vs DL-TBOA. Black circle and error bars show mean ±SD. t-test, ***p < 0.001. See also Video 3 and Video 1.
Figure 4 with 1 supplement

Glutamate released during neuronal waves reaches MC membrane at P9 but not at P11.
(A) Left, Diagram of a retinal cross-section illustrates neuronal expression of iGluSnFR (green) in the IPL and simultaneous voltage-clamp recording of a RGC (grey). XY plane of the IPL shows iGluSnFR expression in neuronal membranes at P11. Right, Simultaneous imaging of AAV9-2YF-hSynapsin-iGluSnFR signals in neuronal membranes (green traces) and whole-cell voltage-clamp recording of a RGC (grey trace, Vm = −60 mV) monitored in the same field of view at P11 in control and in the presence of 25 μM DL-TBOA. Above the whole-cell voltage-clamp trace are histograms showing the percentage of ROIs within a neuronal iGluSnFR signal. (B) Left, Diagram of a retinal cross-section illustrates glial expression of iGluSnFR (green) and simultaneous voltage-clamp recording of a RGC (grey). XY plane of the IPL shows iGluSnFR expression in MCs. Right, Simultaneous imaging of ShH10-CMV-iGluSnFR signals in MCs (green traces) and whole-cell voltage-clamp recording of a RGC (grey trace, Vm = −60 mV) monitored in the same field of view at P9 and P11 in control and in the presence of 25 μM DL-TBOA. Above each whole-cell voltage-clamp trace are histograms showing the percentage of ROIs with glial iGluSnFR signals in response to retinal waves. (C) Plot summarizes DL-TBOA effects on the participation of neuronal (160 ROIs from 5 retinas at P9 and 160 ROIs from 5 retinas at P11) and MC (1023 ROIs from 5 retinas at P9 and 1201 ROIs from 5 retinas at P11) ROIs per retinal wave. Lines connect values from one experiment in control vs DL-TBOA. Black circle and error bars are mean ±SD. t-test ***p < 0.001. (D) Cumulative probability distribution of inter-transient intervals of iGluSnFR (green traces) and GCaMP3 (black traces) signals in MC ROIs at P9 and P11. Control in solid lines and DL-TBOA in dashed lines. See also Figure 4—figure supplement 1 and Videos 4, 5.
-
Figure 4—source data 1
Cumulative probability distributions of inter-transient intervals of iGluSnFR and GCaMP3 signals in MC ROIs for each experiment at P9 and P11, and in absence or in presence of DL-TBOA.
- https://doi.org/10.7554/eLife.09590.011
Figure 4—figure supplement 1
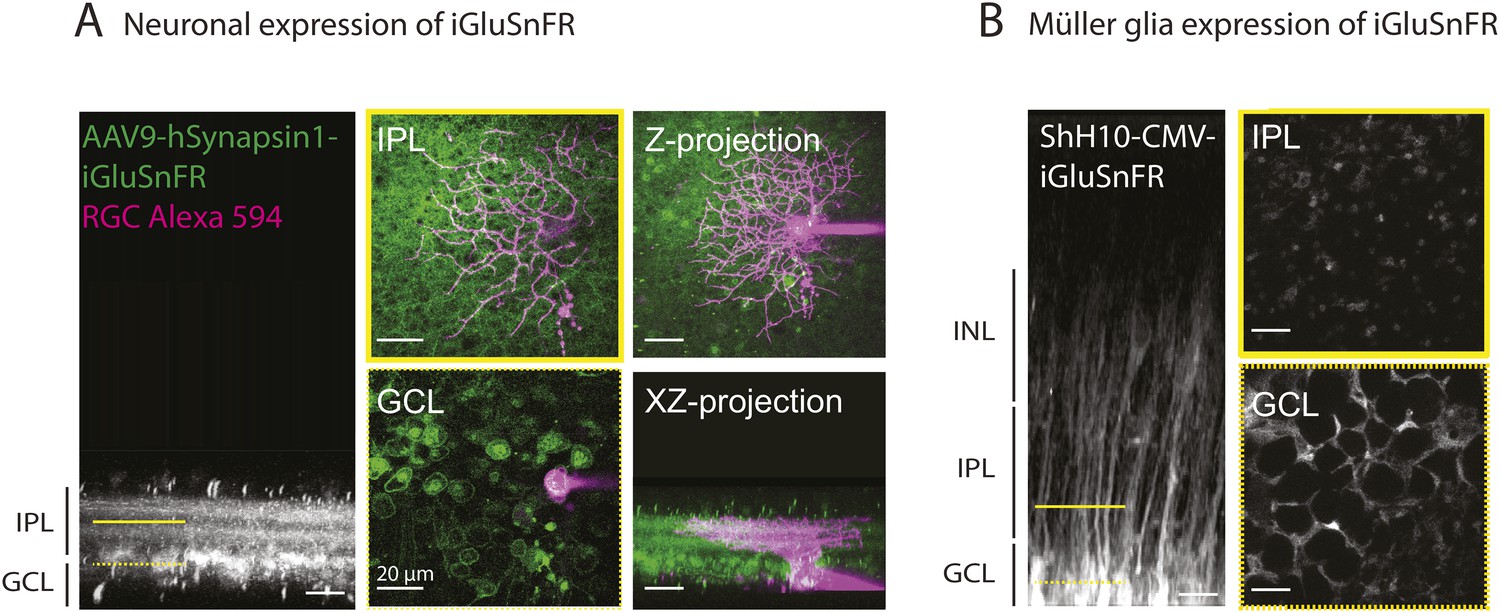
Methodological tools to study neuron-glia interaction mediated by glutamate spillover in whole mount retinas.
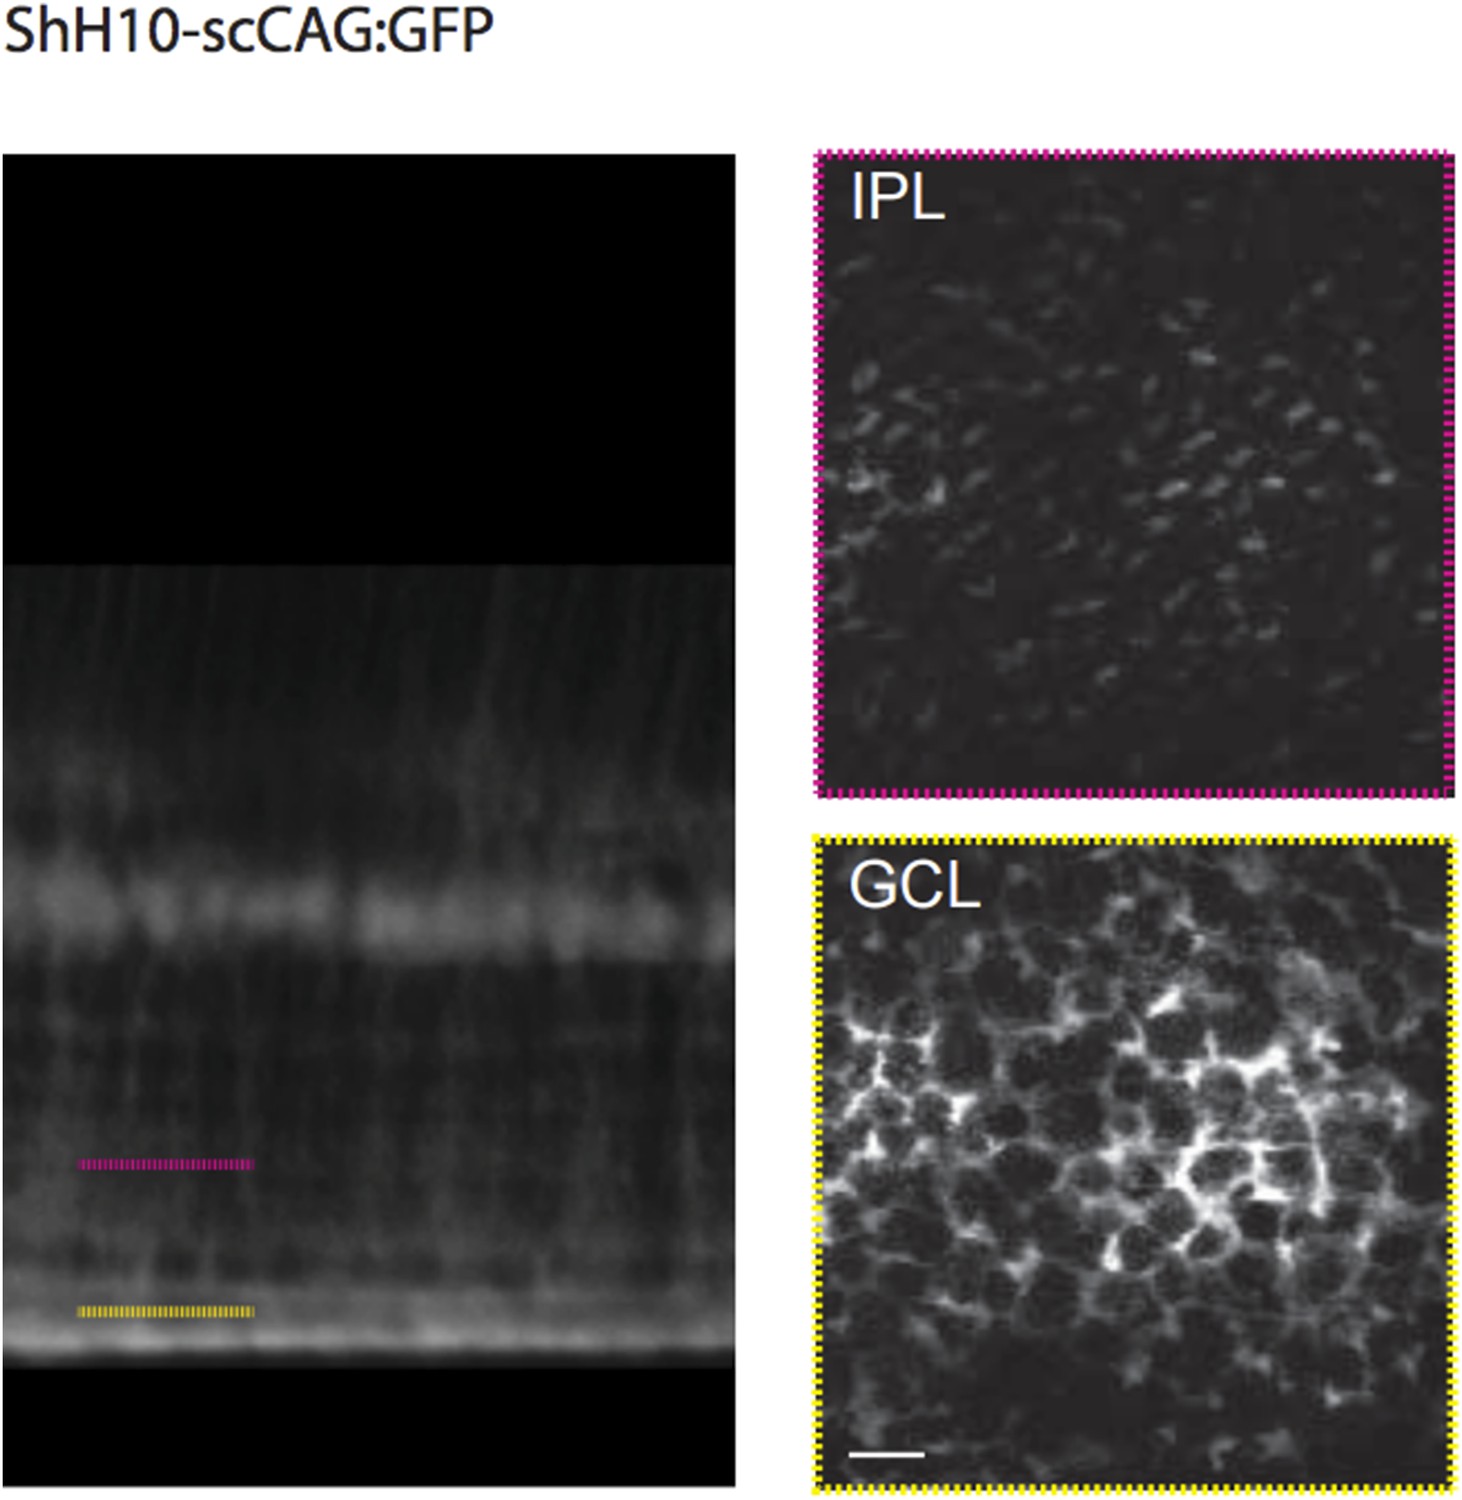
(A) Orthogonal projection of two-photon Z-stacks shows expression of the intensity-based glutamate sensor iGluSnFR in ganglion and amacrine cell membranes of a P9 wild-type mouse retina. AAV9-2YF-hSynapsin1-iGluSnFR was tail vein injected at P2. Yellow solid and dashed lines indicate the XY planes chosen to illustrate iGluSnFR expression in neuronal membranes in the IPL and GCL, respectively (middle panel). Magenta overlay indicates an iGluSnFR-expressing ON-OFF ganglion cell targeted for whole-cell recording and filled with a red fluorescent dye (Alexa 594). Right panel: Z-projection and X-Z projection of this ON-OFF RGC (magenta) and the neuronal dendritic network expressing iGluSnFR (green). (B) Orthogonal projection of two-photon Z-stacks shows iGluSnFR expression in MCs of a P9 wild-type mouse retina. ShH10-CMV-iGluSnFR was intravitreally injected at P4. Yellow solid and dashed lines indicate the XY planes chosen to illustrate iGluSnFR expression in MC membranes in the IPL and GCL, respectively (right panel).
Figure 5 with 1 supplement
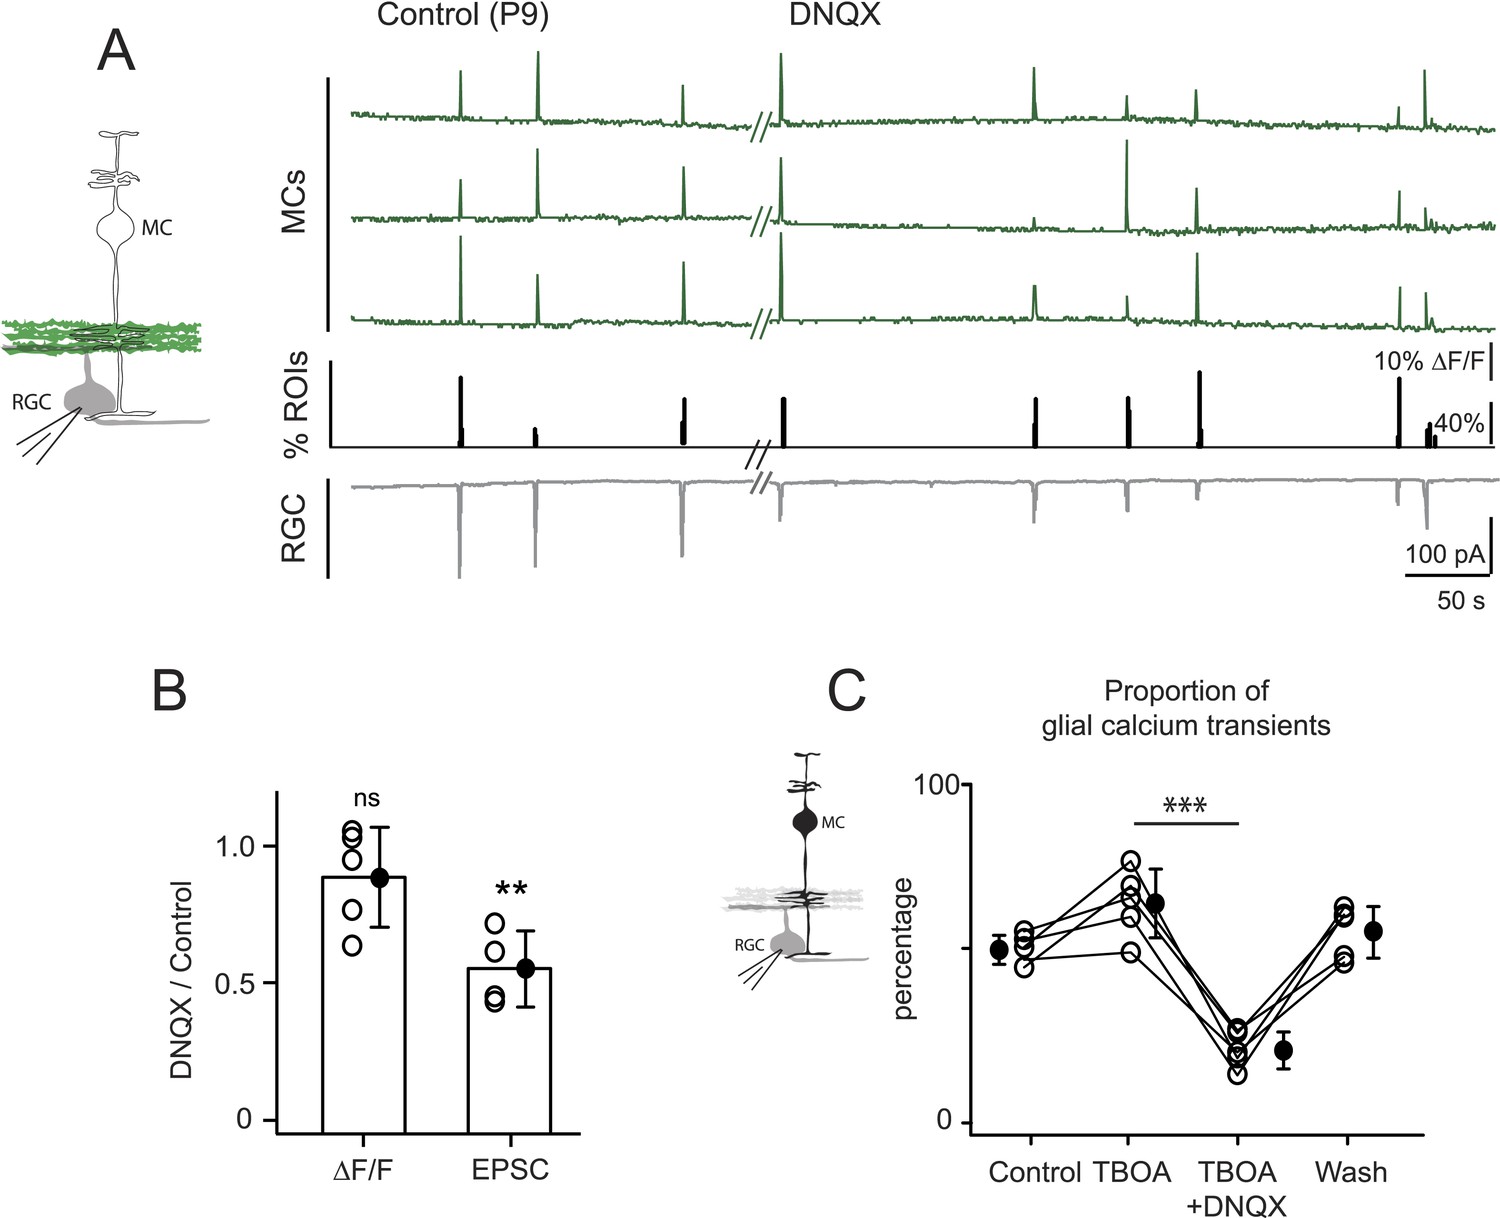
Neuron-glia interaction is mediated by ionotropic AMPA glutamate receptors.
(A) Left, Diagram of a retinal cross-section illustrates neuronal expression of iGluSnFR (green) in the IPL and simultaneous voltage-clamp recording of a RGC (grey). Right, Simultaneous imaging of AAV9-2YF-hSynapsin1-iGluSnFR signals in neuronal membranes (green traces) and whole-cell voltage-clamp recording of a RGC (grey trace, Vm = −60 mV) monitored in the same field of view at P9 in control and in the presence of 20 μM DNQX. Above each whole-cell voltage-clamp trace are histograms showing the percentage of ROIs with responsive neuronal iGluSnFR signals. (B) Graph summarizes the effect of DNQX on the change in volume release of glutamate (ΔF/F) and on the change in amplitude of the RGC excitatory postsynaptic currents. Each open circle plots the value from one experiment. Note, DNQX does not modify the amount of glutamate released from bipolar cells. Black circle and error bars are mean ±SD. t-test, **p < 0.01. (C) Left, Diagram of a retinal cross-section illustrates glial expression of GCaMP3 (black) and simultaneous voltage-clamp recording of a RGC (grey). Right, Graph summarizes the effect of DNQX on the percentage of ROIs with responsive glia at P9 in the presence of DL-TBOA (25 µM). Lines connect values from one experiment in control (974 ROIs), DL-TBOA (1154 ROIs), DL-TBOA+DNQX (397 ROIs) and wash (987 ROIs). Data collected from 5 retinas. Black circle and error bars are mean ±SD. One-way ANOVA, Tukey post-hoc test ***p < 0.001. See also Figure 5—figure supplement 1.
Figure 5—figure supplement 1
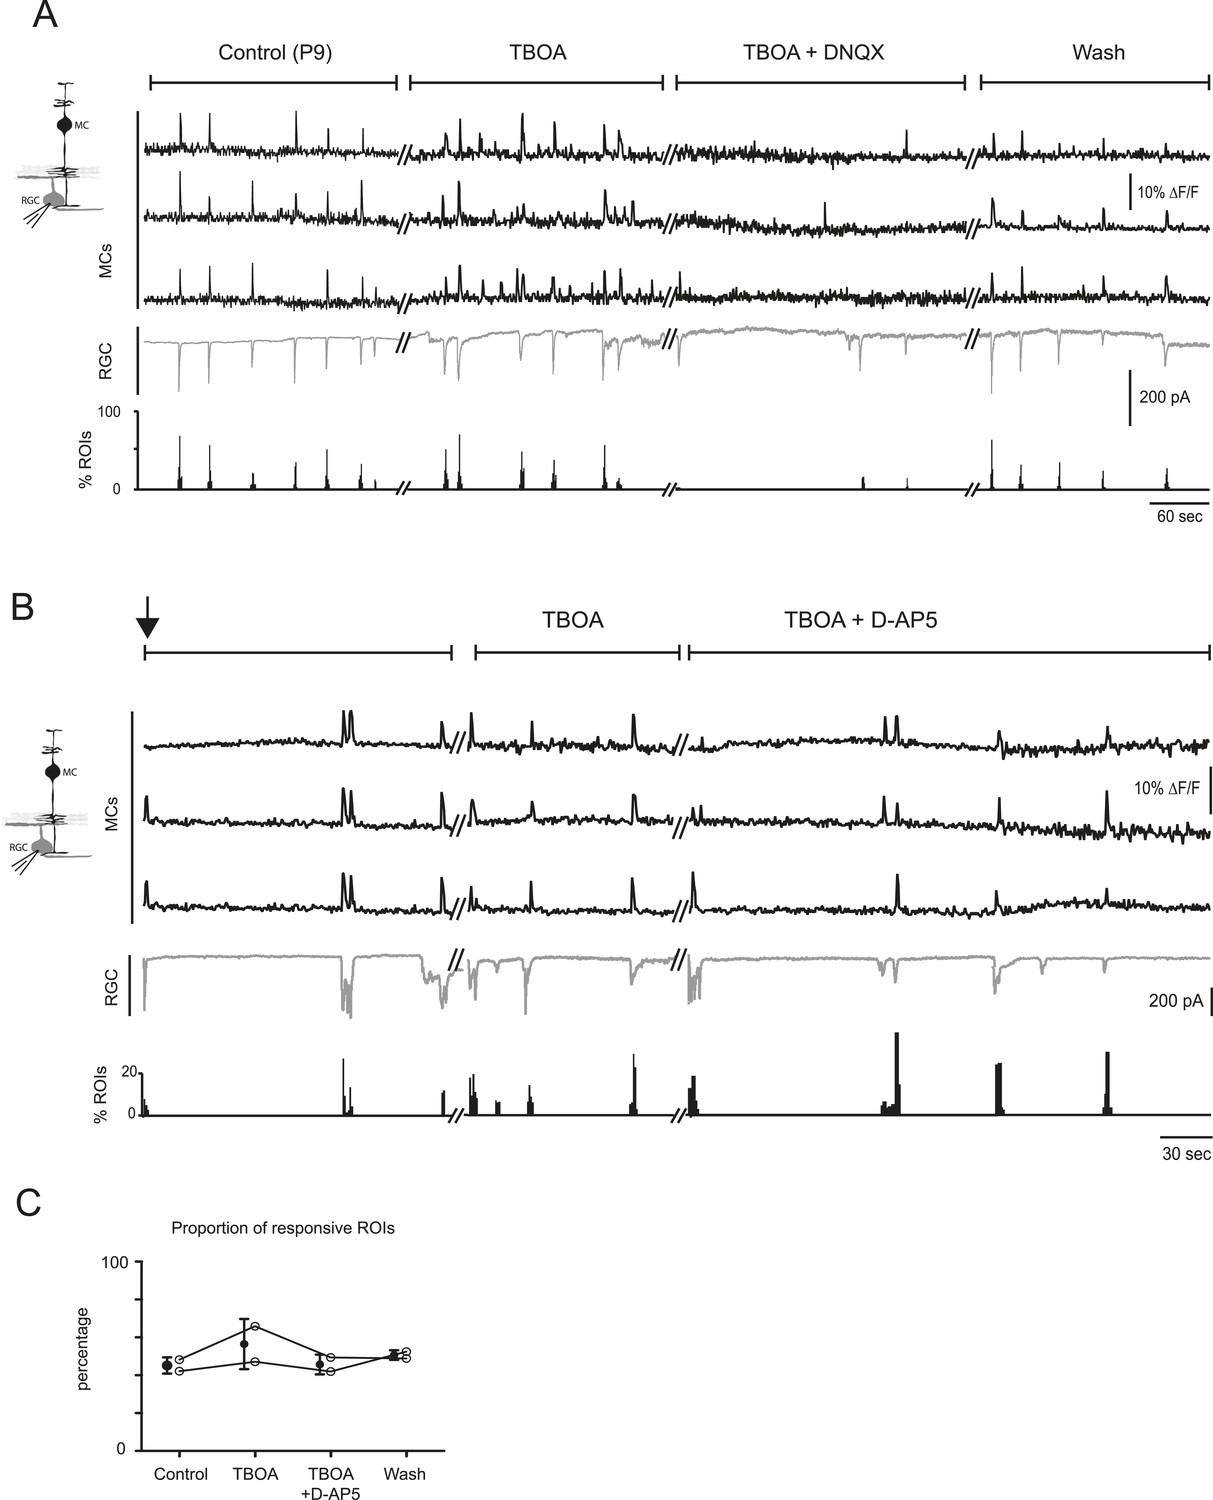
The AMPA receptor antagonist DNQX, but not the NMDA receptor antagonist D-AP5, decreases neuron-glia interaction at P9.
(A) Simultaneous calcium imaging of MCs (black traces) and whole-cell voltage-clamp recording of a RGC (grey trace, Vm = −60 mV) monitored in the same field of view in control, in the presence of 25 µM DL-TBOA, in the presence of 25 µM DL-TBOA + 20 µM DNQX and after wash. Below the whole-cell voltage-clamp trace are histograms showing the percentage of ROIs with responsive MCs in each condition. See also Figure 5 for quantification. (B) Simultaneous calcium imaging of MCs (black traces) and whole-cell voltage-clamp recording of a RGC (grey trace, Vm = −60 mV) monitored in the same field of view during the first minutes of DL-TBOA application (black arrow), after 8–10 min of the drug application, and after adding D-AP5 and waiting for 10 min before recording. Below each whole-cell voltage-clamp trace are histograms showing the percentage of ROIs with responsive MCs in each condition. (C) Plot summarizes effect of D-AP5 (50 μM) on the proportion of responsive ROIs at P9 (318 ROIs in control, 390 ROIs in DL-TBOA and 341 ROIs in DL-TBOA + D-AP5 from 2 retinas). Lines connect values from one experiment in control, DL-TBOA, DL-TBOA + D-AP5, and wash. Black circle and error bars are mean ±SD.
Figure 6
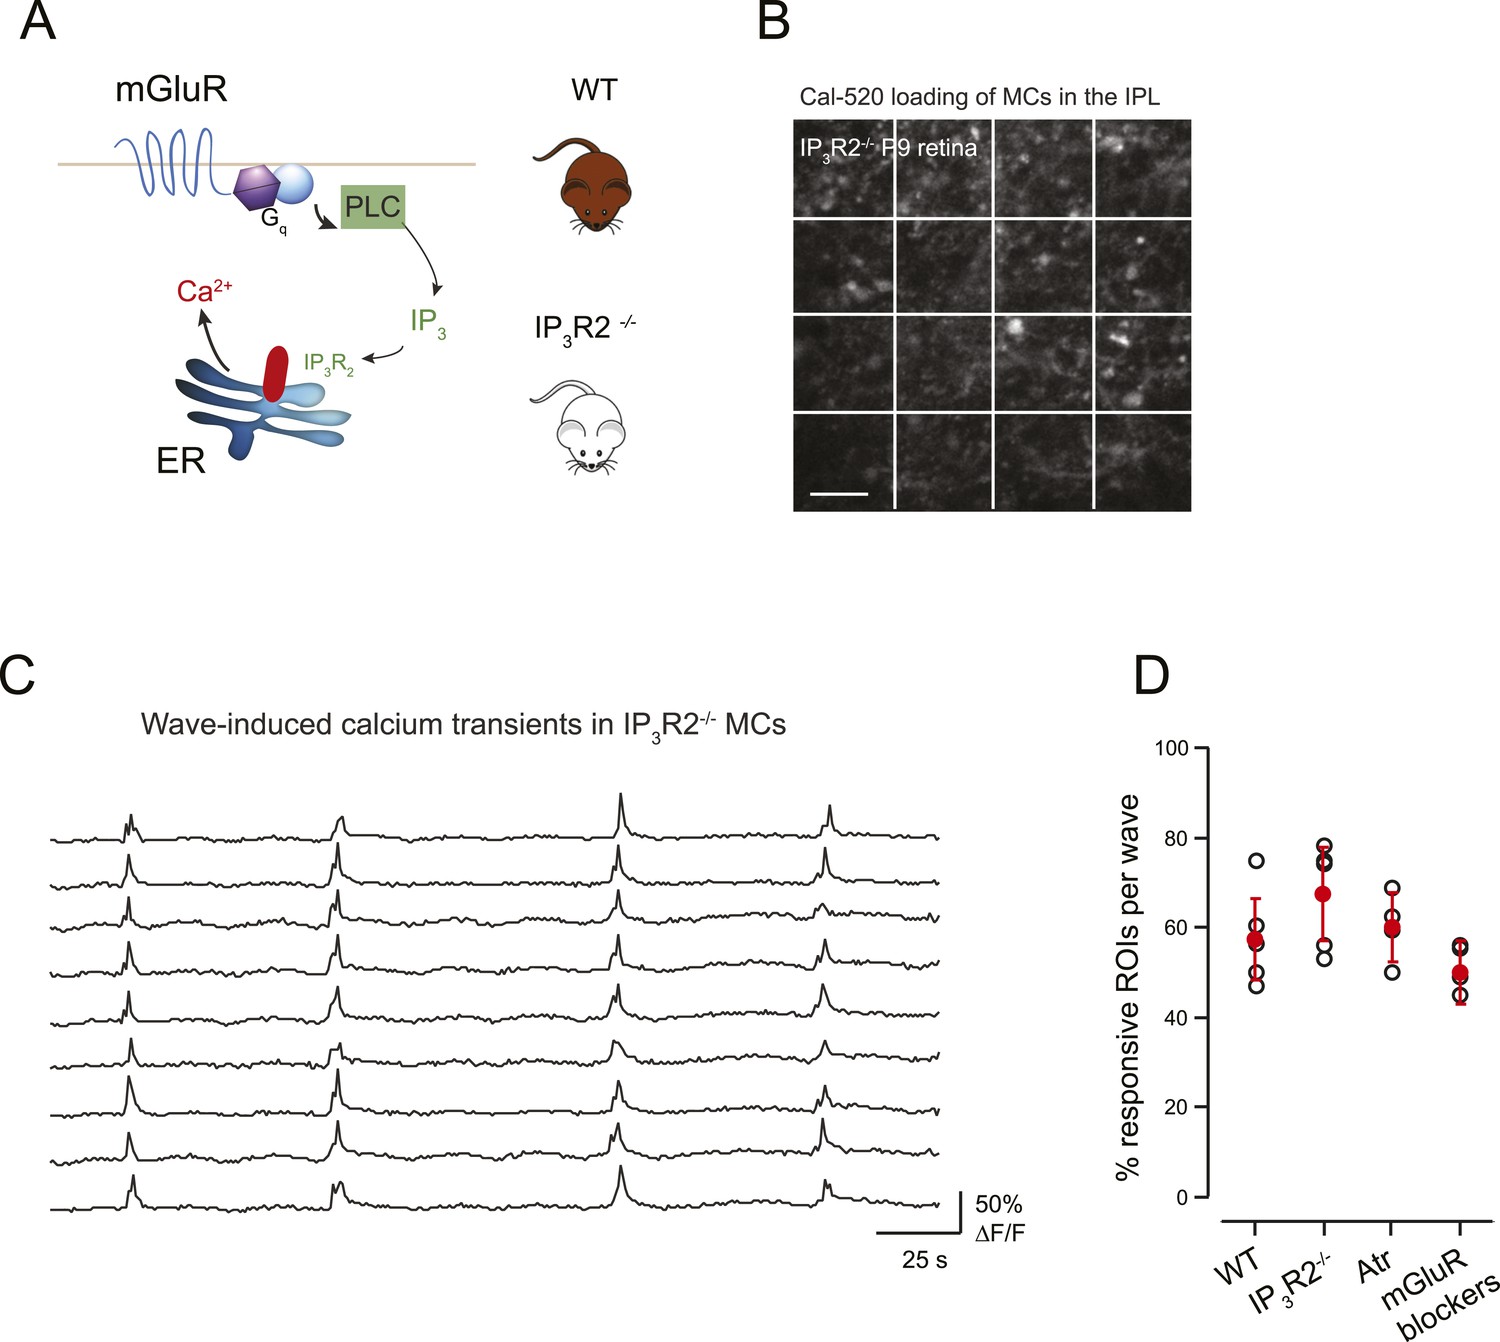
mGluR and mAChRs contribute minimally to wave-induced MC calcium transients at P9.
(A) Schematic of mGluR-mediated pathway for increases in intracellular calcium in Müller glial cell. (B) XY plane of the IPL shows Cal-520 loading from an IP3R2-KO P9 retina. The whole field of view was divided in 16 ROI represented by the white rectangles. (C) Example traces of spontaneous MC calcium signals (ΔF/F) in IP3R2-KO retinas. (D) Summary of the effects of genetic and pharmacological manipulations of GPCR signaling in MCs using IP3R2-KO mice, mAChR antagonist (50 µM atropine), and mGluR antagonists (8 μM LY341495, 100 μM MCPG, 100 μM MTEP).
Author response image 1
Videos
Video 1
Wave-induced responses are shown as changes in fluorescence of the calcium indicator GCaMP3 expressed specifically in MCs in a P9 or P11 mouse retina in the presence of the glutamate uptake blocker DL-TBOA (25 μM).
Electrophysiological recordings confirmed that calcium signals were correlated with RGC activity during retinal waves. Scale bars are 20 μm. Related to Figure 1.
Video 2
Calcium transients (ΔF/F) in MCs expressing the calcium indicator GCaMP3 are shown in response to a series of focal applications of ATP or ACh (1 mM, 100 ms) at P7.
Scale bars are 20 μm. White spots in video indicate when focal applications of agonist were applied. Related to Figure 2.
Video 3
Calcium transients (ΔF/F) in MCs expressing the calcium indicator GCaMP3 are shown in response to a series of focal applications (100 ms) of ACSF or L-glutamate (1 mM) at P9.
Scale bars are 20 μm. White spots in video indicate when focal applications of agonist were applied. Related to Figure 3.
Video 4
Wave-induced fluorescence changes of the glutamate sensor iGluSnFR expressed in RGCs and amacrine cells in a P11 mouse retina are shown in the presence of the glutamate uptake blocker DL-TBOA (25 μM).
Electrophysiological recordings confirmed that glutamate signals were correlated with RGC activity during retinal waves. Scale bars are 10 μm. Related to Figure 4.
Video 5
Wave-induced fluorescence changes of the intensity-based glutamate sensing fluorescent reporter iGluSnFR expressed specifically in MCs in a P11 mouse retina are shown in the presence of the glutamate uptake blocker DL-TBOA (25 μM).
Electrophysiological recordings confirmed that glutamate signals were correlated with RGC activity during retinal waves. Scale bars are 20 μm. Related to Figure 4.
Download links
A two-part list of links to download the article, or parts of the article, in various formats.
Downloads (link to download the article as PDF)
Open citations (links to open the citations from this article in various online reference manager services)
Cite this article (links to download the citations from this article in formats compatible with various reference manager tools)
Neuron-glia signaling in developing retina mediated by neurotransmitter spillover
eLife 4:e09590.
https://doi.org/10.7554/eLife.09590


