Cohesin-interacting protein WAPL-1 regulates meiotic chromosome structure and cohesion by antagonizing specific cohesin complexes
- Imperial College London, United Kingdom
Figures
Figure 1 with 1 supplement
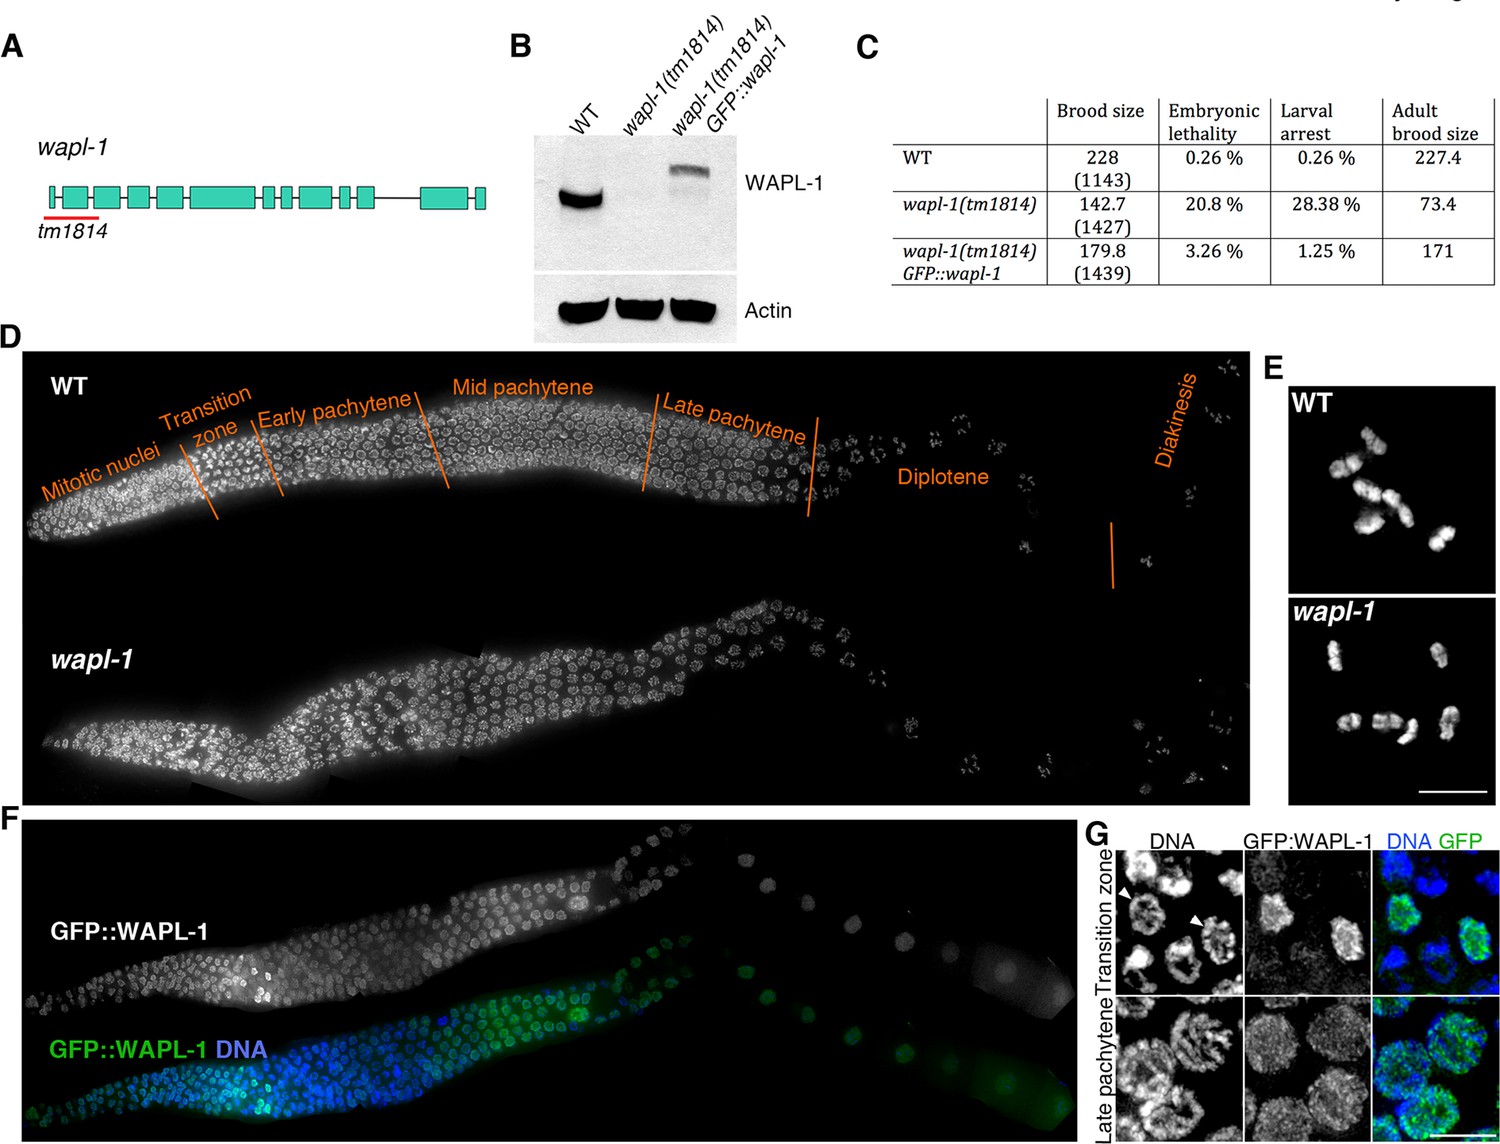
WAPL-1 localizes to germ line nuclei and promotes viability.
(A) Structure of the wapl-1 gene, red bar indicates the region deleted in the tm1814 allele. (B) Western blot demonstrates that wapl-1(tm1814) is a null allele and that a protein of the expected size is present in worms carrying a GFP::wapl-1 transgene. (C) wapl-1 mutants display reduced fertility and larval lethality, numbers in parenthesis indicate total number of embryos analysed per genotype . (D) Projections of whole-mounted germ lines stained with DAPI, the different stages of meiotic prophase are noted above the WT germ line, with transition zone containing nuclei in leptotene and zygotene. Note that overall germ line organization in wapl-1 mutants is similar to WT. (E) Projections of diakinesis oocytes stained with DAPI, six bivalents are present in both WT and wapl-1 mutants. (F) Whole-mounted germ line from a transgenic worm homozygous for the wapl-1(tm1814) deletion and for a GFP::wapl-1 single copy transgene stained with DAPI and anti-GFP antibodies. Note that the intensity of GFP::WAPL-1 decreases in transition zone and peaks again during late pachytene. (G) Insets from germ line shown in F showing GFP::WAPL-1 staining in transition zone and pachytene nuclei, note that GFP::WAPL-1 intensity is very high in transition zone nuclei that do not display chromosome clustering (arrowheads). Figure 1—figure supplement 1 shows quantification of GFP::WAPL-1 intensities along the germ line. Scale bars in E and G = 5 µm.
Figure 1—figure supplement 1
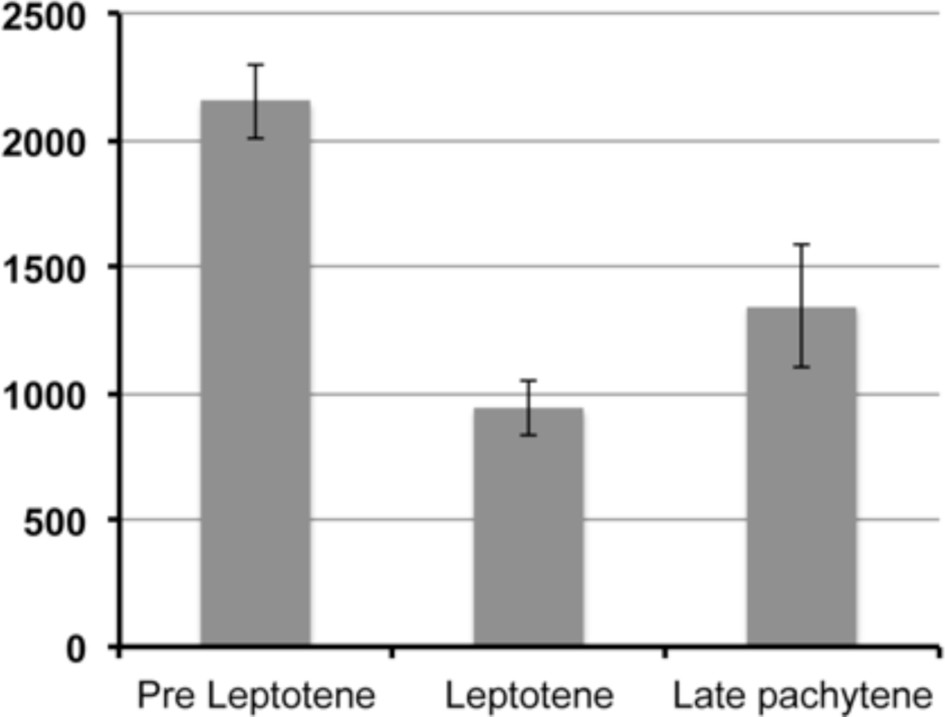
Quantification of GFP::WAPL-1 intensity.
Y axis depicts average nuclear intensity of GFP signal per nucleus (calculated from maximum intensity projections made from non-deconvolved Z-stacks acquired with the same settings), X axis indicates stages at which intensity was measured, and error bars indicate standard deviation. Note the drop in GFP::WAPL-1 fluorescence intensity between pre-leptotene and leptotene nuclei. Differences between pre-leptotene and leptotene nuclei, and between leptotene and late pachytene nuclei are significant (p<0.0001, t-test). A total of 58 (pre leptotene), 61 (leptotene), and 42 (late pachytene) nuclei from 6 different germ lines were included in the fluorescence intensity analysis.
Figure 2 with 1 supplement
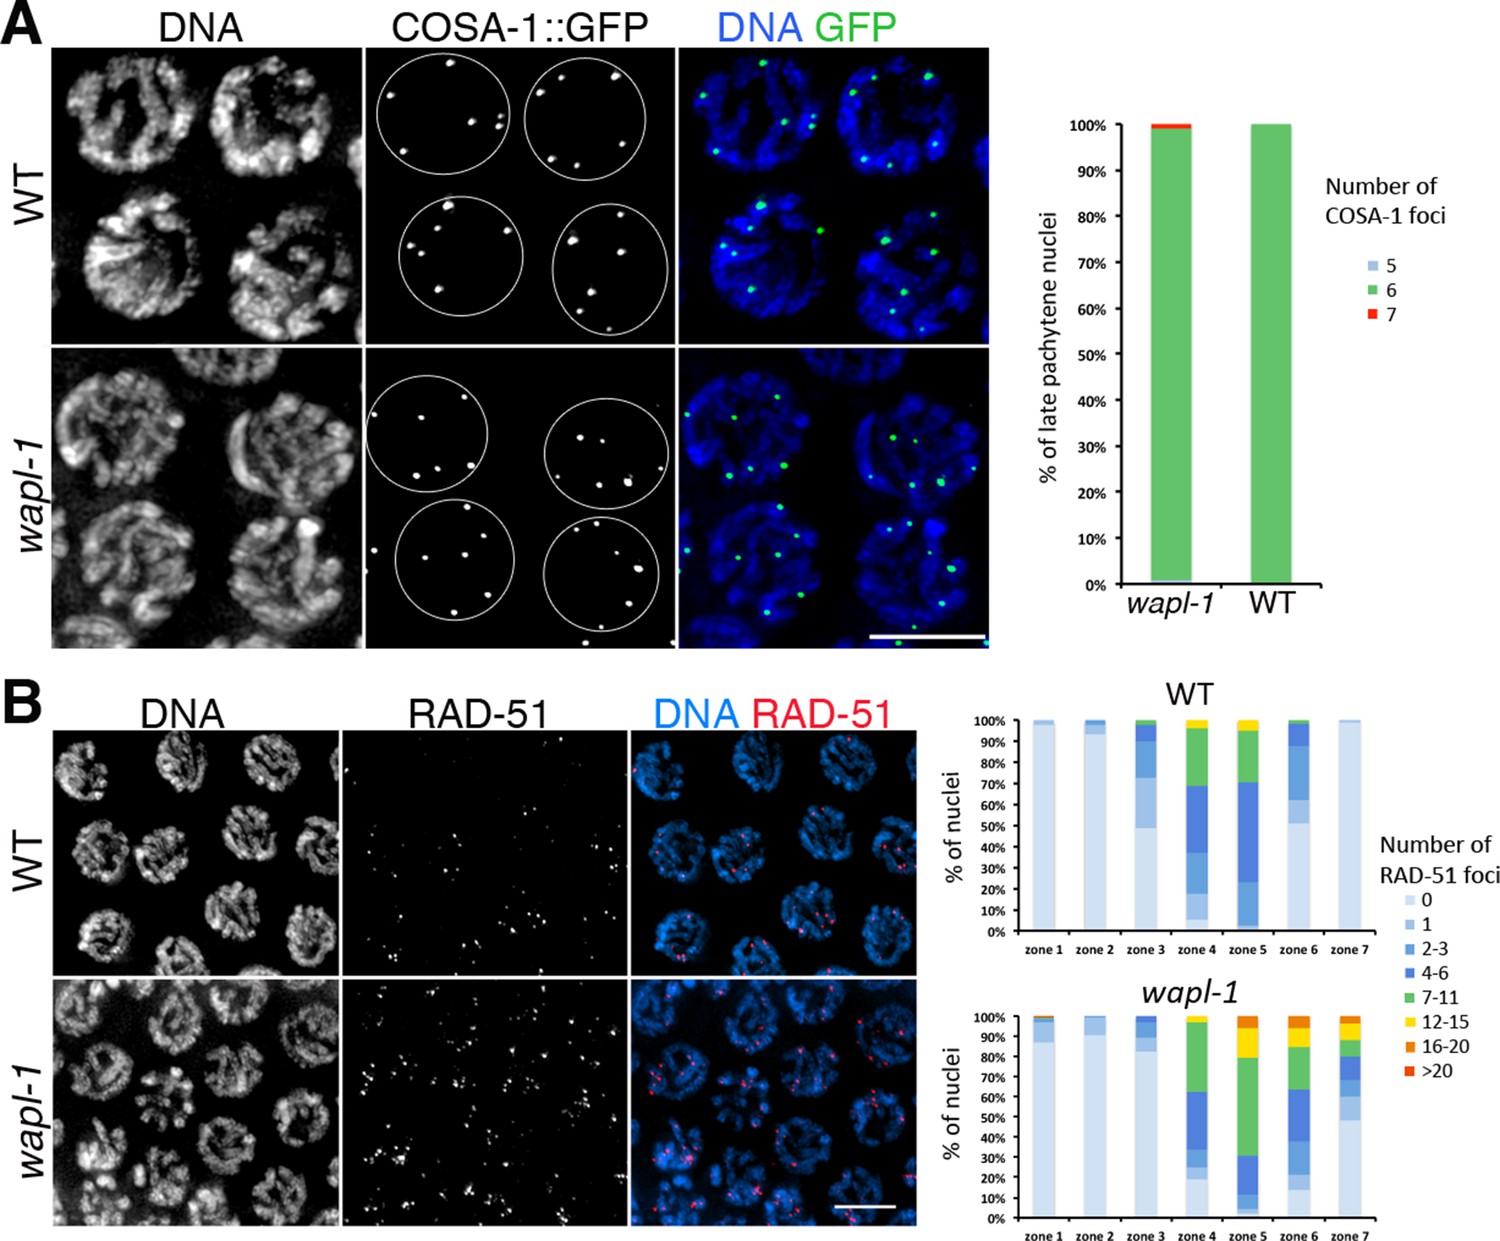
WAPL-1 affects DNA repair during meiotic prophase.
(A) Projections of late pachytene nuclei from worms expressing COSA-1::GFP, note that both wapl-1 mutants and WT controls display 6 COSA-1 foci per nucleus. Graph showing quantification of COSA-1 foci (126 nuclei from wapl-1 mutants and 100 nuclei from WT). (B) Projections of pachytene nuclei stained with anti-RAD-51 antibodies and DAPI, note increased RAD-51 foci in wapl-1 mutant panel. Quantification of RAD-51 foci in germ lines of WT and wapl-1 mutants. Each germ line was divided into 7 equal-sized regions, with regions 4 to 7 representing early to late pachytene. The X axis indicates the seven regions along the germ line, while the Y axis indicates the percentage of nuclei with a given number of RAD-51 foci (as indicated in the color key). wapl-1 mutants accumulate RAD-51 in mid and late pachytene nuclei. Number of nuclei analyzed (WT, wapl-1 mutant): Zone 1 (133, 138), zone 2 (246, 195), zone 3 (137, 135), zone 4 (154, 101), zone 5 (122, 90), zone 6 (114, 69), zone 7 (93, 61).
Figure 2—figure supplement 1
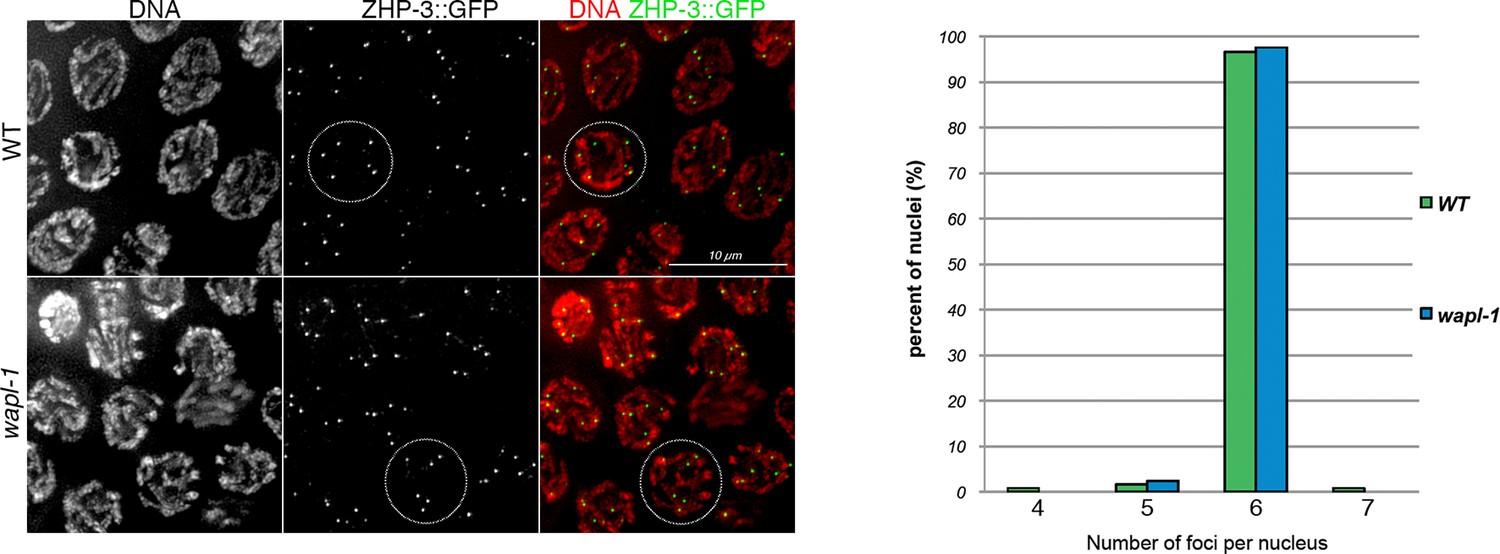
wapl-1 mutants form normal numbers of ZHP-3 foci.
Projections of late pachytene nuclei from worms expressing a ZHP-3::GFP transgene, note that both wapl-1 mutants and WT controls display 6 ZHP-3 foci per nucleus. Graph showing quantification of ZHP-3 foci (124 nuclei from wapl-1 mutants and 119 nuclei from WT).
Figure 3 with 1 supplement
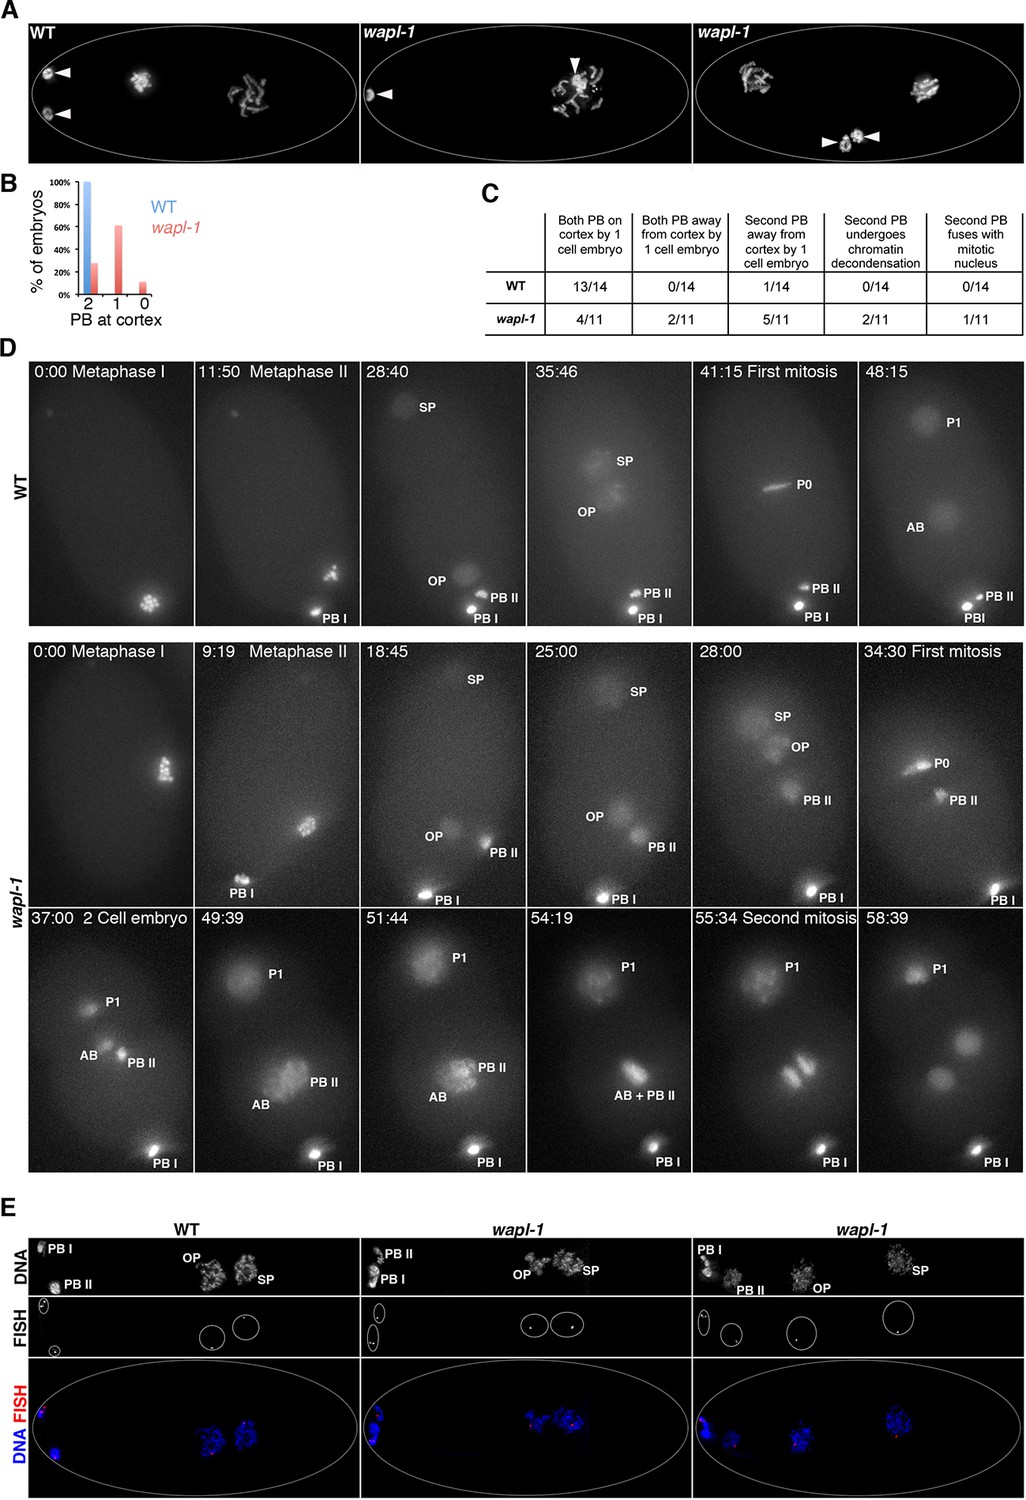
WAPL-1 is required for polar body extrusion.
(A) Projections of fixed embryos at the 1- or 2-cell stage stained with DAPI, arrowheads point to the position of polar bodies generated during the meiotic divisions. Polar bodies are found near the cortex in WT control, but one (middle panel) or both (right-hand side panel) polar bodies localize away from the cortex in wapl-1 mutant embryos. (B) Quantification of the percentage of embryos with zero, one, or two polar bodies localized at the cortex (36 embryos scored in wapl-1 and 34 in WT). (C) Quantification of polar body behavior in videos from live WT and wapl-1 mutant embryos expressing a histone H2B::mcherry fusion protein. Note that 7 out of 11 wapl-1 mutant embryos displayed defects in polar body extrusion. Examples of videos used for the quantification are shown in Video 1 (WT), Videos 2–3 (wapl-1). (D) Selected frames from the WT embryo shown in Video 1 and from the wapl-1 mutant embryo shown in Videos 2–3. Time is indicated on top-left corner, starting from metaphase I. Abbreviations: PB I (first polar body), PB II (second polar body), OP (oocyte pronucleus), SP (sperm pronocleus), P0 (first mitotic metaphase following fusion of OP and SP), P1 and AB (cells resulting from the first mitotic division). Note that in the WT embryo PB II remains highly condensed and locates close to PB I on the cortex. In the wapl-1 mutant embryo, PB II becomes decondensed and fails to move to the cortex, first remaining close to the OP and then close to the AB cell produced after the first mitotic division. Chromosomes from AB and PB II appear to mix together before the second mitotic division of the embryo. (E) Projections of fixed embryos following the completion of the second meiotic division and labeled with a FISH probe against the 5S rDNA locus on chromosome V and DAPI. Note that in both WT and wapl-1 mutant embryos the oocyte pronucleus (OP) and the second polar body (PB II) contain a single FISH signal, even when PB II is not localized on the cortex and chromatin appears decondensed (wapl-1 example on right-hand side).
Figure 3—figure supplement 1
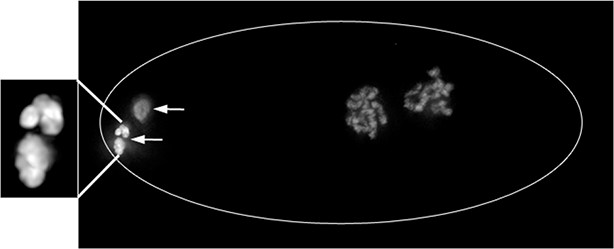
Example of abnormal chromatin condensation in polar bodies of wapl-1 mutant embryos.
Projection of a wapl-1 mutant 2-cell embryo stained with DAPI. Polar bodies are labeled with arrows, and bottom polar body is magnified in the inset, note the presence of separated chromatin masses within the polar body.
Figure 4 with 6 supplements
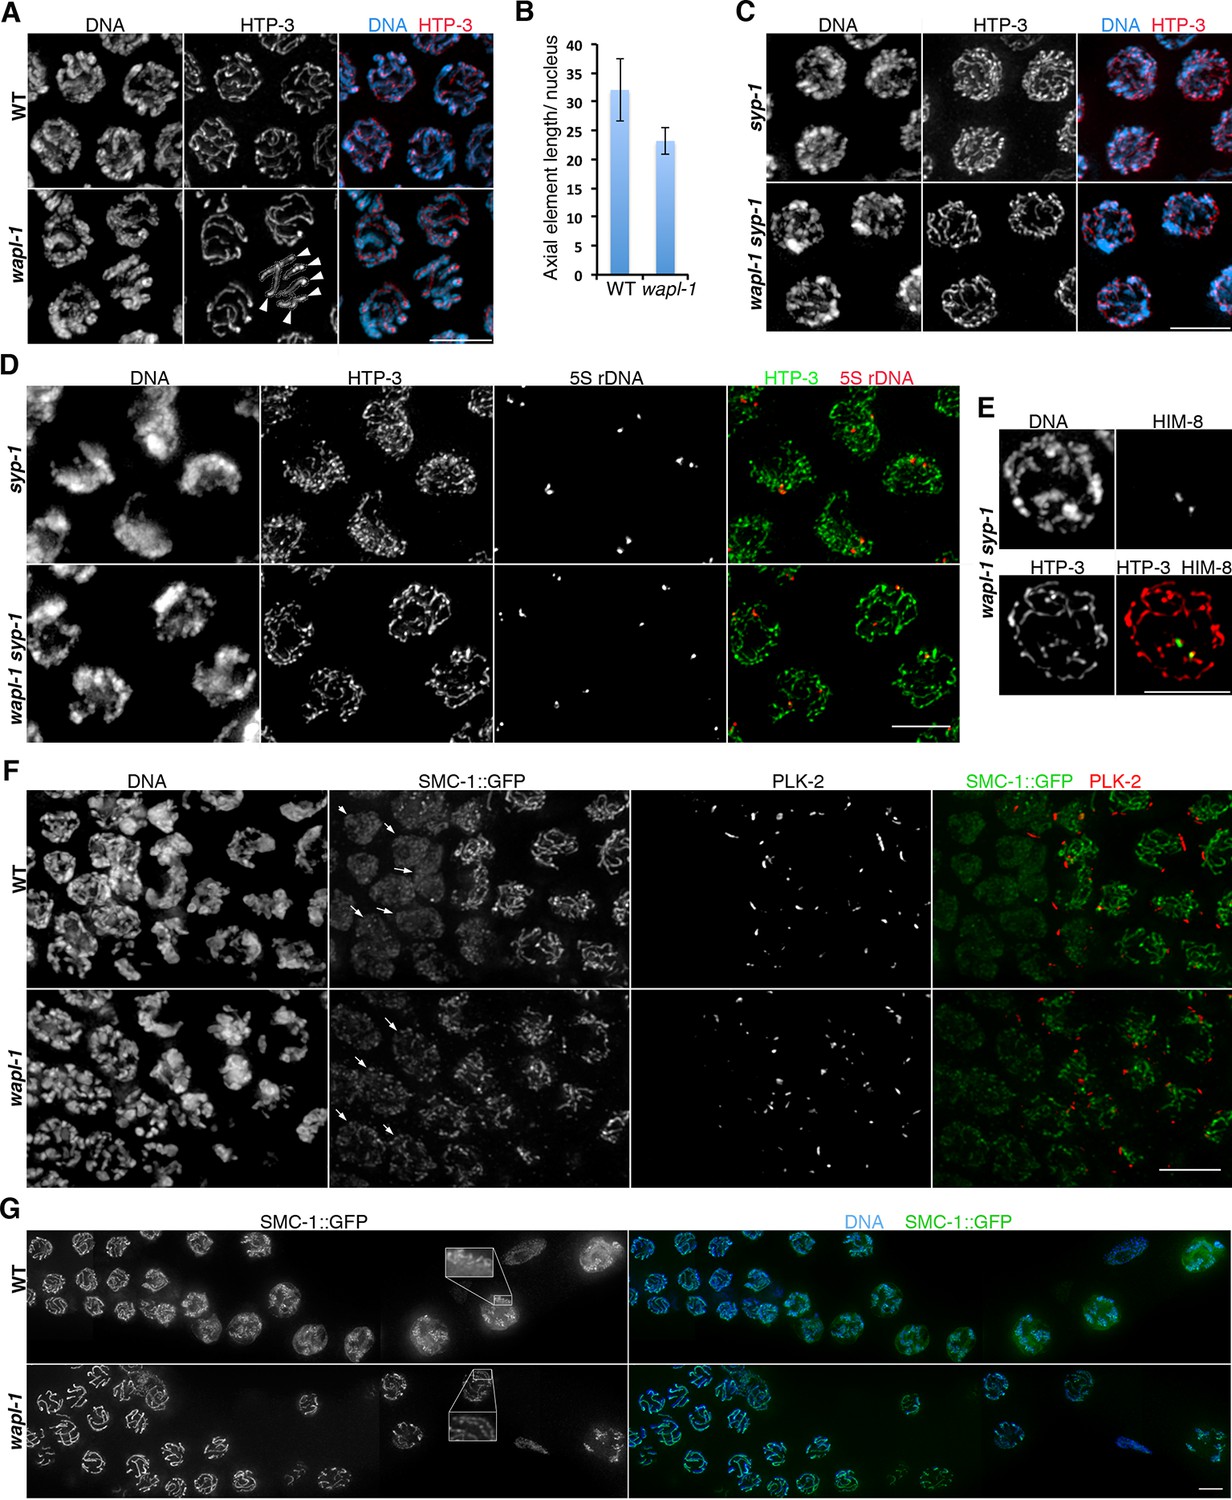
WAPL-1 regulates chromosome organization during meiotic prophase.
(A) Projections of late pachytene nuclei stained with anti-HTP-3 antibodies (axial elements) and DAPI. Axial elements are shorter in wapl-1 mutants, arrowheads point to 6 HTP-3 tracks that can be individually traced along their whole length (each track represents a pair of aligned homologous chromosomes). (B) Quantification of total HTP-3 length per late pachytene nucleus in WT controls and wapl-1 mutants. Error bars represent standard deviation, differences are significant (p<0.0001, t-test). (C) Projections of late pachytene nuclei stained with HTP-3 antibodies (axial elements) and DAPI. The number of HTP-3 tracks appears larger in syp-1 mutants than in wapl-1 syp-1 double mutants, where some short HTP-3 tracks are seen. (D) Projections of mid pachytene nuclei stained with anti-HTP-3 antibodies (axial elements), DAPI, and labeled with a probe against the 5S rDNA locus on chromosome V. Most nuclei in syp-1 and wapl-1 syp-1 mutants display 2 5S foci, showing that homologs are not associated (quantification shown in Figure 4—figure supplement 2). (E) Projection of a late pachytene nucleus stained with DAPI, anti-HTP-3 antibodies and anti-HIM-8 antibodies (binding to a single end of the X chromosome). Both HIM-8 signals are located at the end of a short HTP-3 track, each one representing a highly compacted X chromosome. Shortening of X chromosome axial elements in late pachytene nuclei was seen in 3 out of 3 syp-1 wapl-1 germ lines. (F) Projections of transition zone nuclei from worms carrying a GFP tag on the endogenous smc-1 gene (generated by CRISPR) stained with DAPI, anti-GFP antibodies, and anti-PLK-2 antibodies. Appearance of PLK-2 aggregates on the nuclear envelope marks the onset of meiotic prophase (leptotene stage). In the WT germ line, SMC-1::GFP tracks are only observed in nuclei with PLK-2 aggregates, while pre-leptotene nuclei display diffuse SMC-1::GFP staining (arrows). SMC-1::GFP tracks are present in pre-leptotene nuclei of wapl-1 mutants (arrows). (G) Projections of late pachytene and diplotene nuclei from worms carrying a GFP tag on the endogenous smc-1 gene (generated by CRISPR) stained with DAPI and anti-GFP antibodies. A large accumulation of nuclear soluble SMC-1::GFP is present in wild-type nuclei, but not in wapl-1 mutants (see quantification on Figure 4—figure supplement 5). Note that axial elements become elongated, twisted and with a more diffuse appearance in wild-type nuclei compared with wapl-1 mutant nuclei (insets show magnification of the indicated nuclear region). Scale bar = 5 µm in all panels.
Figure 4—figure supplement 1
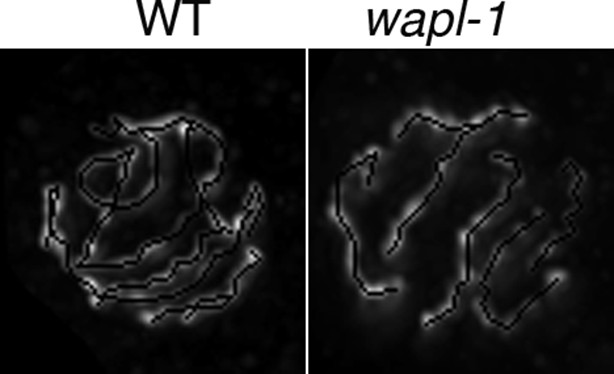
Examples of HTP-3 tracking in projections of late pachytene nuclei stained with anti-HTP-3 antibodies.
https://doi.org/10.7554/eLife.10851.013
Figure 4—figure supplement 2
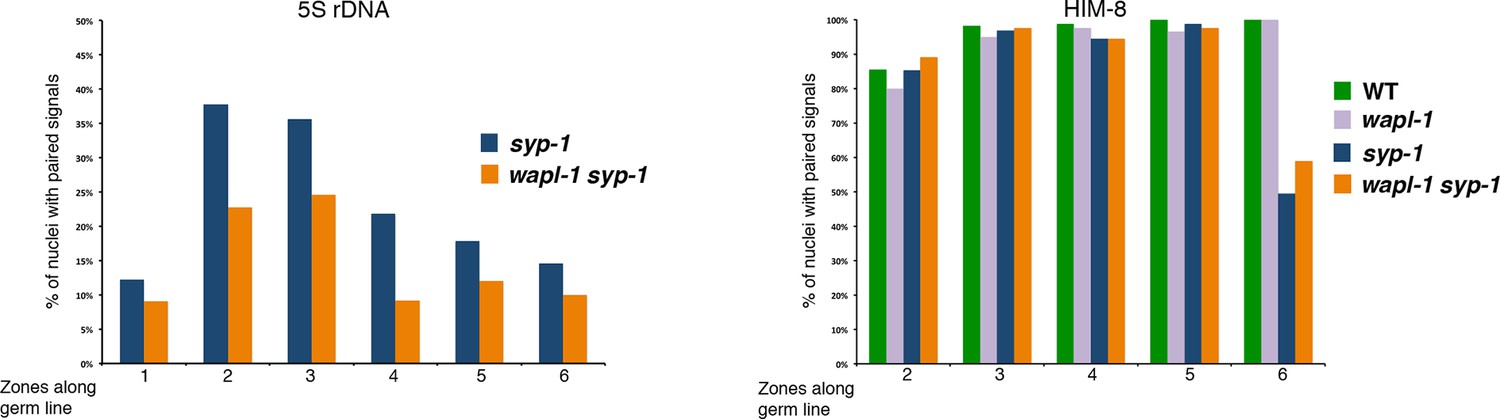
Quantification of homolog pairing in germ lines of syp-1 and wapl-1 syp-1 double mutants.
Germ lines were labeled with a FISH probe against the 5S rDNA locus on chromosome V, or with anti-HIM-8 antibodies to visualize the pairing center end of the X chromosomes. Y axis indicates percentage of nuclei with paired signals and X axis indicates regions along the germ line: zone-1 (premeiotic nuclei), zone 2 (transition zone), zones 3 to 6 (early to late pachytene). In mid- and late-pachytene nuclei (zones 4-6) 5S rDNA signals are separated in most nuclei of both syp-1 and wapl-1 syp-1 double mutants. Number of nuclei per zone: syp-1 (98, 180, 295, 293, 180, 185), wapl-1 syp-1 (77, 114, 142, 173, 126, 69). X chromosomes are unpaired in ~50% of late pachytene nuclei in both syp-1 and wapl-1 syp-1 double mutants. Number of nuclei per zone: WT (83, 113, 157, 114, 96), wapl-1 (105, 101, 121, 87, 78), syp-1 (143, 195, 108, 149, 111), wapl-1 syp-1 (182, 158, 215, 161, 149).
Figure 4—figure supplement 3
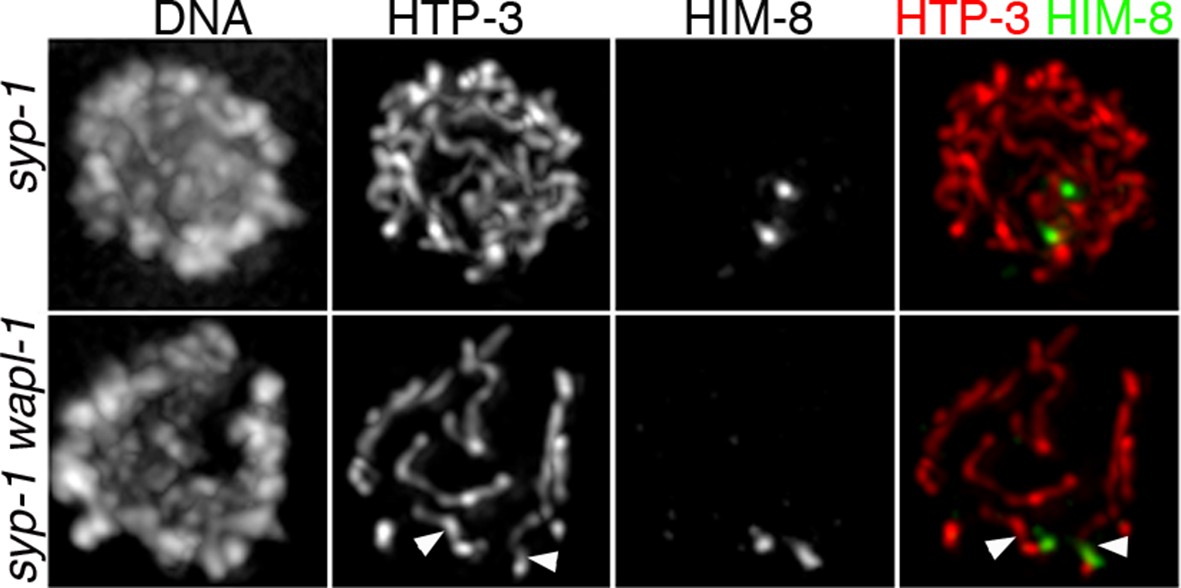
Shortening of X chromosome axial elements in wapl-1 syp-1 double mutants.
Projections of late pachytene nuclei stained with anti-HTP-3 and anti-HIM-8 antibodies, and counterstained with DAPI. Note overall reduction in axis overlap in syp-1 wapl-1 nucleus compared to syp-1 nucleus. Arrowheads in syp-1 wapl-1 panels point to two short stretches of HTP-3 corresponding to the axial elements of the X chromosomes (they colocalize with HIM-8 signals). Axial elements of the X chromosomes can not be easily traced on the syp-1 panel due to extensive overlap with axial elements from other chromosomes.
Figure 4—figure supplement 4
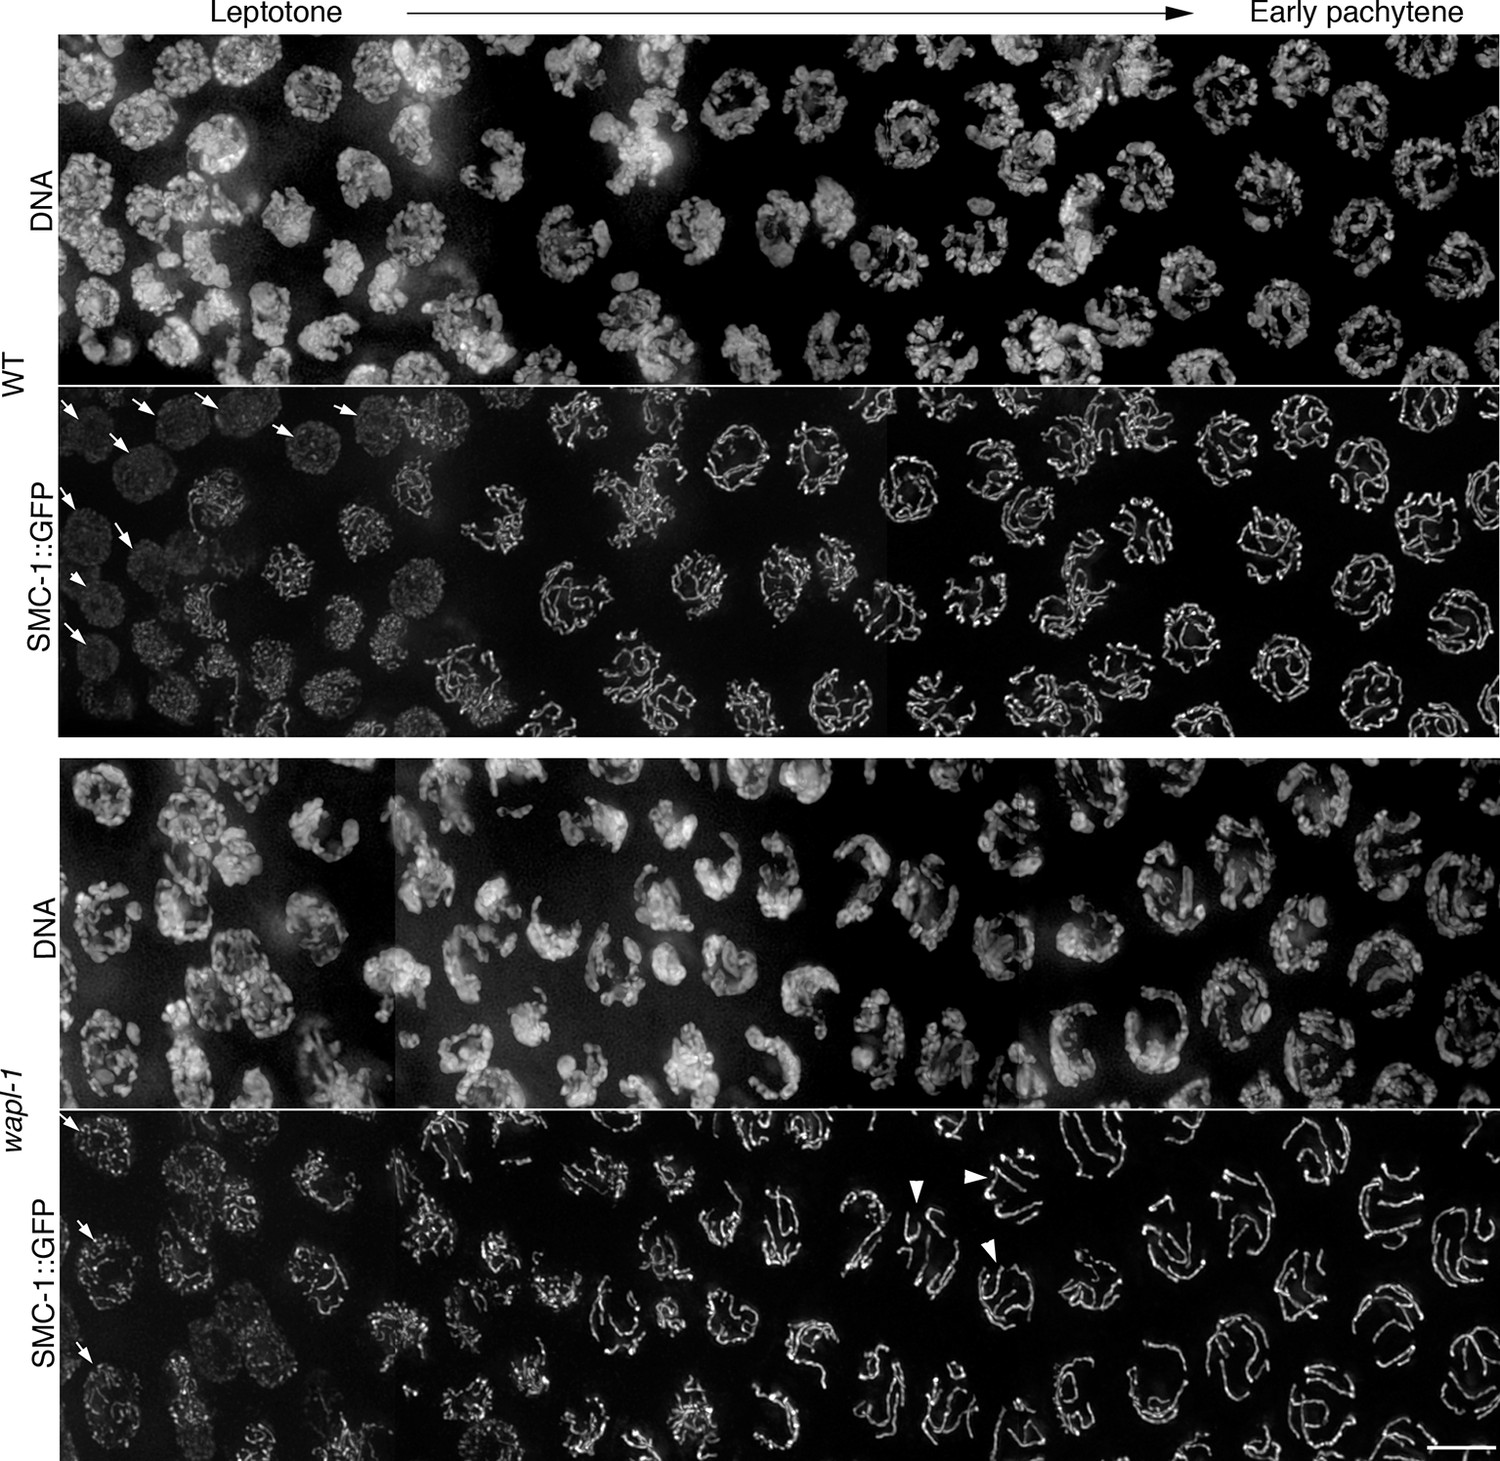
WAPL-1 affects nuclear organization during early meiosis.
Projections show nuclei about to enter meiotic prophase (left of image) progressing to early pachytene (right-hand side of image) stained with anti-GFP antibodies (to visualize SMC-1::GFP) and DAPI. Arrows indicate nuclei at preleptotene stages, note that these nuclei contain linear tracks of SMC-1::GFP in wapl-1 mutants but no in WT. Arrowheads in wapl-1 panel point to early pachytene nuclei in which it is possible to distinguish 6 linear structures (each one representing paired homologous chromosomes). Note that in WT nuclei at the same stages there is extensive overlap of SMC-1::GFP tracks, making it difficult to trace individual tracks along their entire length. Scale bar = 5 µm.
Figure 4—figure supplement 5
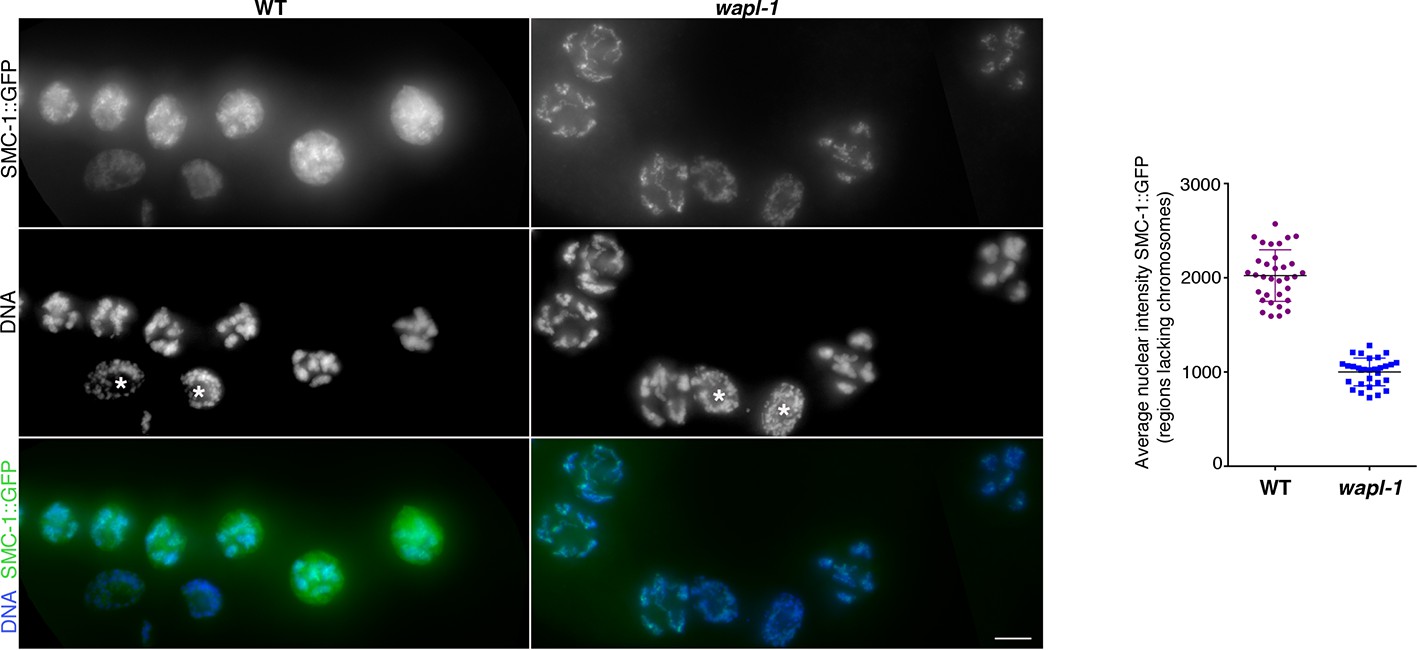
WAPL-1 induces accumulation of nuclear soluble SMC-1::GFP in diplotene nuclei.
Images are maximum intensity projections from non-deconvolved Z stacks acquired with the same settings and adjusted with the same display scale to allow a direct visual comparison of fluorescence intensities in WT and wapl-1 mutants. Note that in WT nuclei a large fraction of SMC-1::GFP staining decorates nuclear regions lacking chromosomes (identified by DAPI staining), while in wapl-1 diplotene nuclei most SMC-1::GFP signal overlaps with chromosomes. Asterisks in the DNA panel indicate mitotic nuclei of the germ line sheath. Graph shows quantification of SMC-1::GFP average nuclear fluorescence intensity in regions lacking chromosomes (measured in maximum intensity projections from Z stacks of non-deconvolved diplotene nuclei acquired with the same settings). Note that average SMC-1::GFP intensity in chromosome-free regions is much higher in WT than wapl-1 mutants (p<0.0001, t-test). Three areas of 0.63 x 0.63 µm (not containing chromosomes) were measured per nucleus and a total of 10 nuclei from three different germ lines were included in the analysis. Scale bar = 5 µm.
Figure 4—figure supplement 6
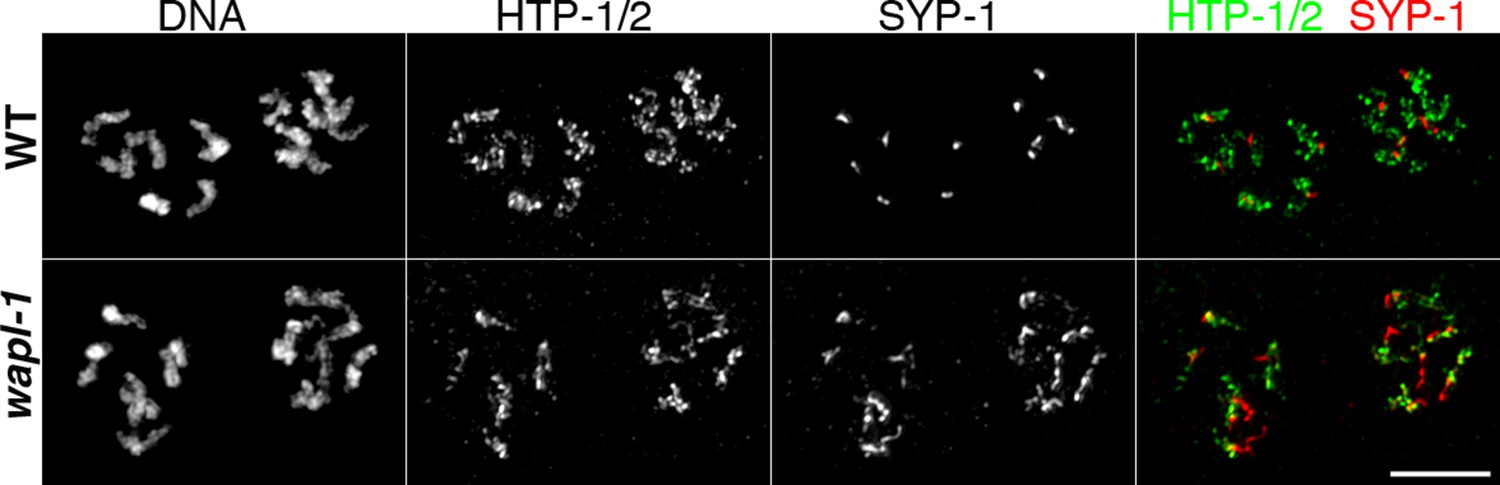
SC disassembly is delayed in wapl-1 mutant germ lines.
Projections of diplotene nuclei stained with anti-HTP-1/2 antibodies, anti-SYP-1 antibodies and counterstained with DAPI. SYP-1 is restricted to a very short line per pair of homologs in WT germ lines, while long tracks of SYP-1 are observed in wapl-1 mutants. Note also that coiling of axial elements (HTP-1/2 staining) is more evident in WT nuclei compared with wapl-1 mutants. Scale bar = 5 µm.
Figure 5 with 5 supplements
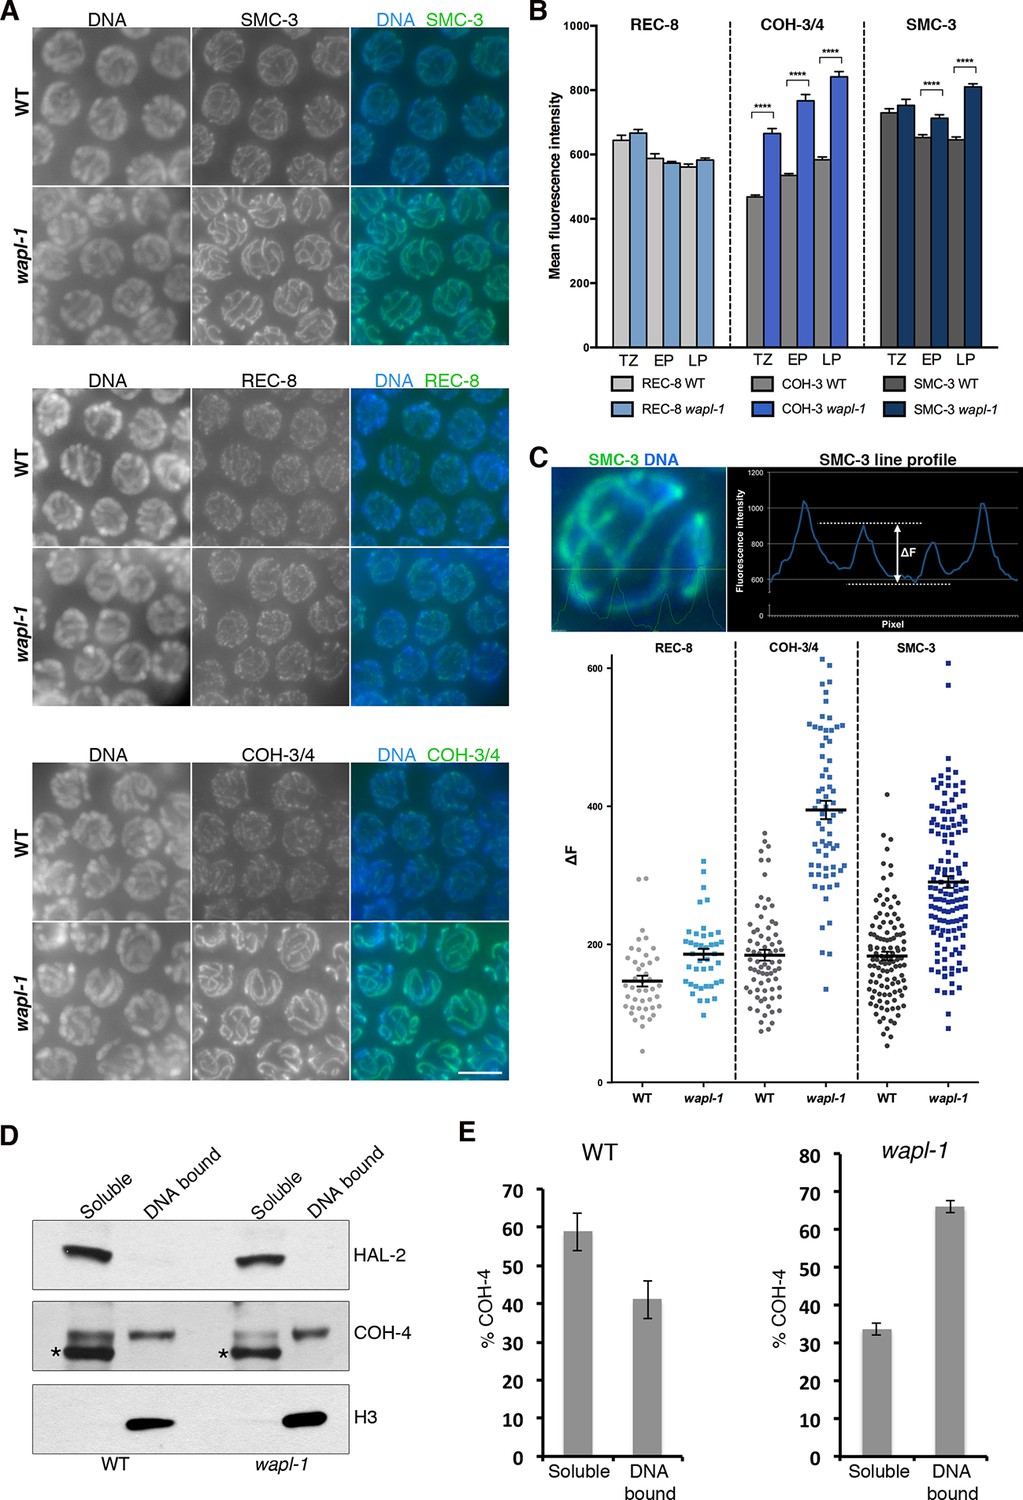
WAPL-1 antagonizes binding of COH-3/4 cohesin to axial elements.
(A) Projections of pachytene nuclei stained with the indicated antibodies and DAPI. In all cases, WT and wapl-1 examples were acquired with the same exposure settings and images are non-deconvolved projections adjusted with same settings to allow visual comparisons in staining intensity. The intensities of SMC-3 and COH-3/4 are increased in wapl-1 mutants, while REC-8 staining appears similar in WT and wapl-1 nuclei. Scale bar = 5 µm. (B) Quantification of mean fluorescence intensity per nucleus of REC-8, COH-3/4 and SMC-3 in transition zone (TZ), early pachytene (EP) and late pachytene (LP) nuclei. Between 15 and 20 nuclei per germ line, from a minimum of 5 germ lines were analyzed per genotype and stage. Differences indicated with asterisks are significant (p<0.0001, t-test), error bars= SEM. (C) Line profile quantification to compare the intensity of cohesin at axial elements versus inter-chromosome domains. Top left-hand side panel: example of a SMC-3 and DAPI-stained pachytene nucleus showing the intensities of DAPI (blue) and SMC-3 (green) along the depicted line. The line profile of SMC-3 intensity is shown in the top right-hand panel, ΔF indicates the increment in staining between the peak (axial element) and the valley (inter chromosome domain as determined by lack of DAPI staining). Graph: Plotting of individual ΔF values from late pachytene nuclei of wapl-1 mutants and WT stained with REC-8, COH-3/4 or SMC-3 antibodies. Between 12 and 32 nuclei from different germ lines were analyzed per genotype. Mean value and SEM are indicated. Proportional increase between the mean ΔF value in wapl-1 and WT: 27% for REC-8 (p= 0.0008, t-test), 114% for COH-3/4 (p<0.0001, t-test), 59% for SMC-3 (p<0.0001, t-test). (D) Western blots of triton soluble and insoluble (DNA bound) protein fractions from WT and wapl-1 mutant worms probed with anti-COH-4 (see Figure 5—figure supplement 5 for additional controls), anti-HAL-2 (marker for soluble fraction), and anti-H3 (marker for DNA-bound fraction) antibodies. Asterisk indicates a non-specific band recognized by anti-COH-4 antibodies (see Figure 5—figure supplement 5). Note that COH-4 signal in WT extracts is higher in the soluble than in the DNA fraction, while in wapl-1 mutant extracts COH-4 intensity is higher in DNA-bound than in the soluble fraction. (E) Quantification of relative intensity of anti-COH-4 signal in the soluble and DNA-bound fractions. Three westerns were included in the analysis.
Figure 5—figure supplement 1
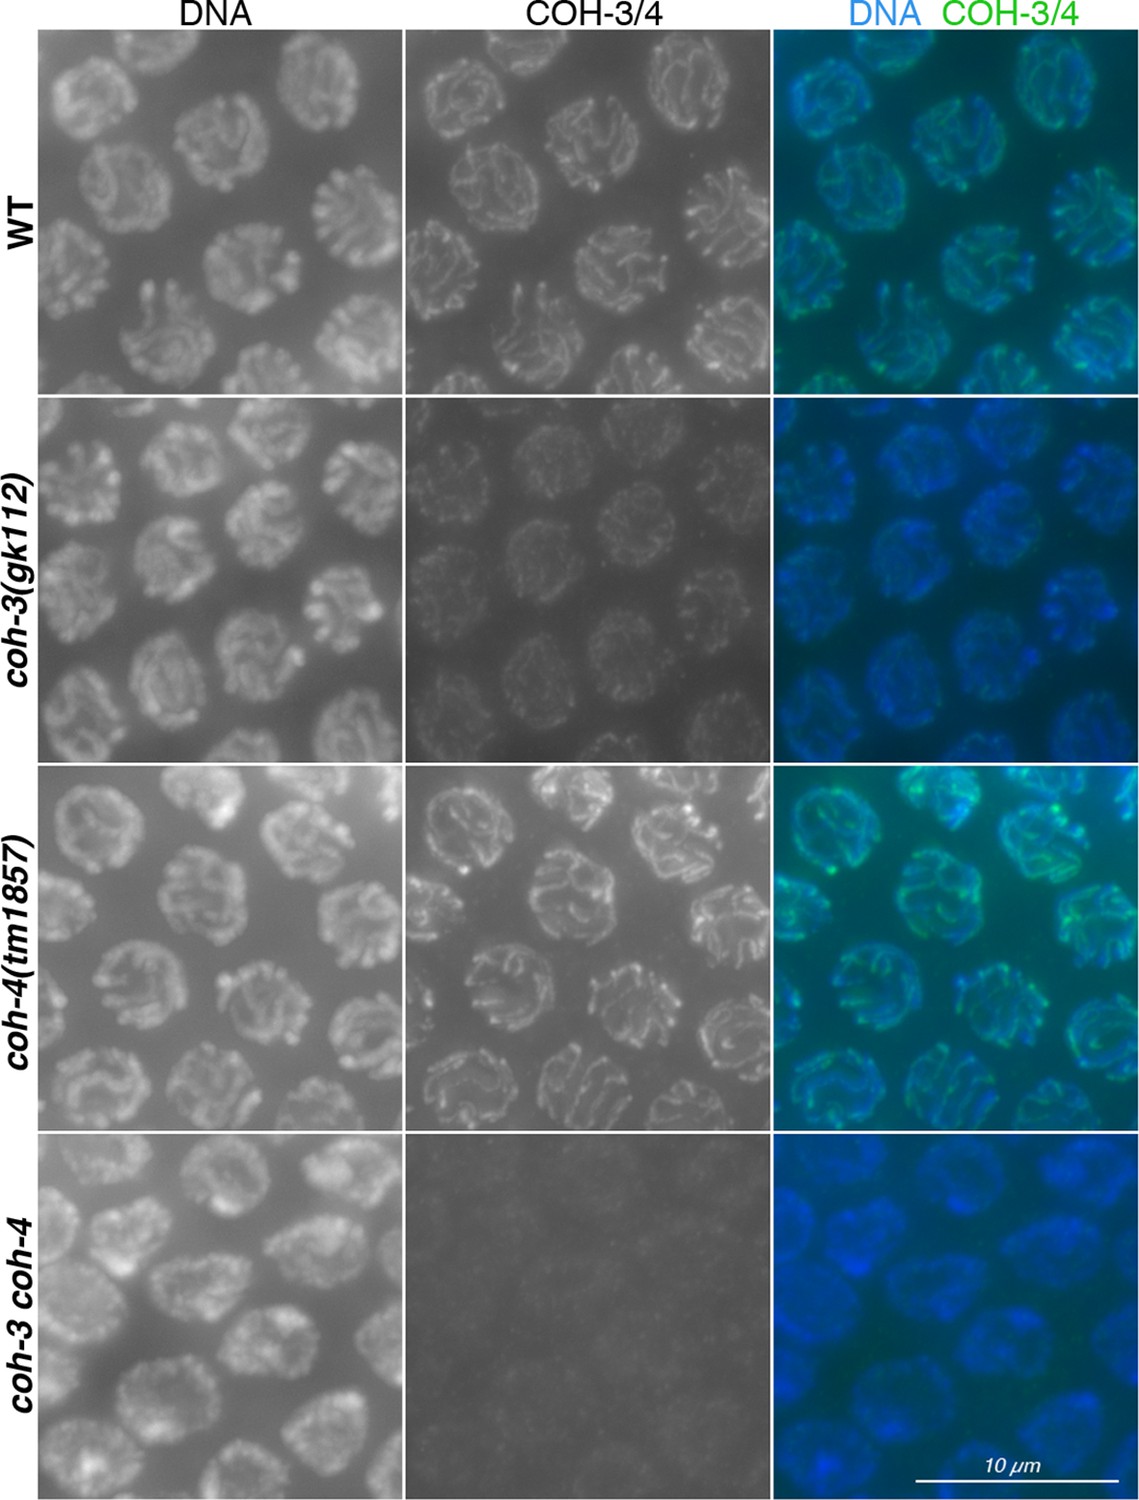
Controls showing specificity of anti-COH-3/4 antibodies.
Projections of pachytene nuclei stained with the anti-COH-3/4 antibodies and DAPI. Note that signal from anti-COH-3/4 antibodies only disappears in germ lines from coh-3 coh-4 double mutants, demonstrating that the antibodies recognize both COH-3 and COH-4.
Figure 5—figure supplement 2
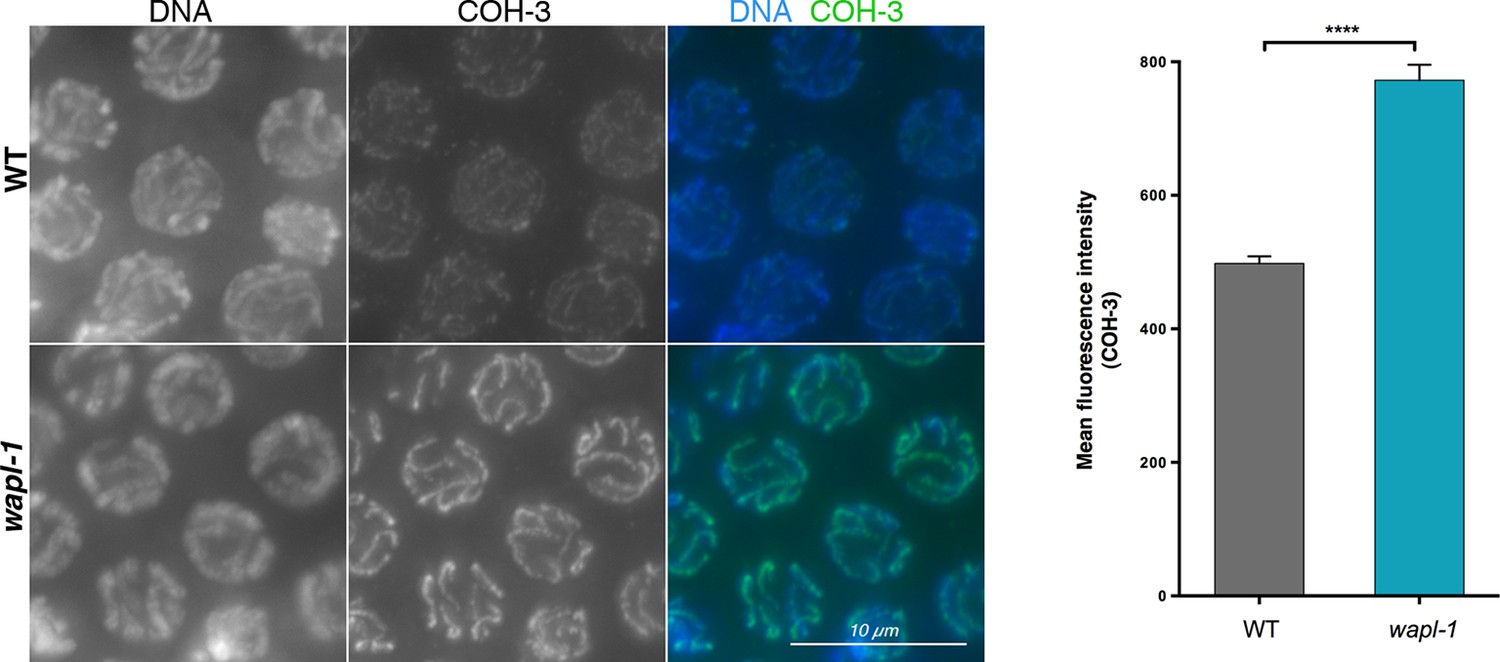
A different anti-COH-3 antibody also shows increased staining intensity in pachytene nuclei of wapl-1 mutant germ lines.
WT and wapl-1 examples were acquired with the same exposure settings and images are non-deconvolved projections adjusted with same display settings to allow visual comparisons in staining intensity. Chromatin was stained with DAPI (blue). Graph shows quantification of mean fluorescence intensity in pachytene nuclei stained with anti-COH-3 antibodies. Differences between WT and wapl-1 are significant (p<0.0001, t-test), error bars = SEM.
Figure 5—figure supplement 3
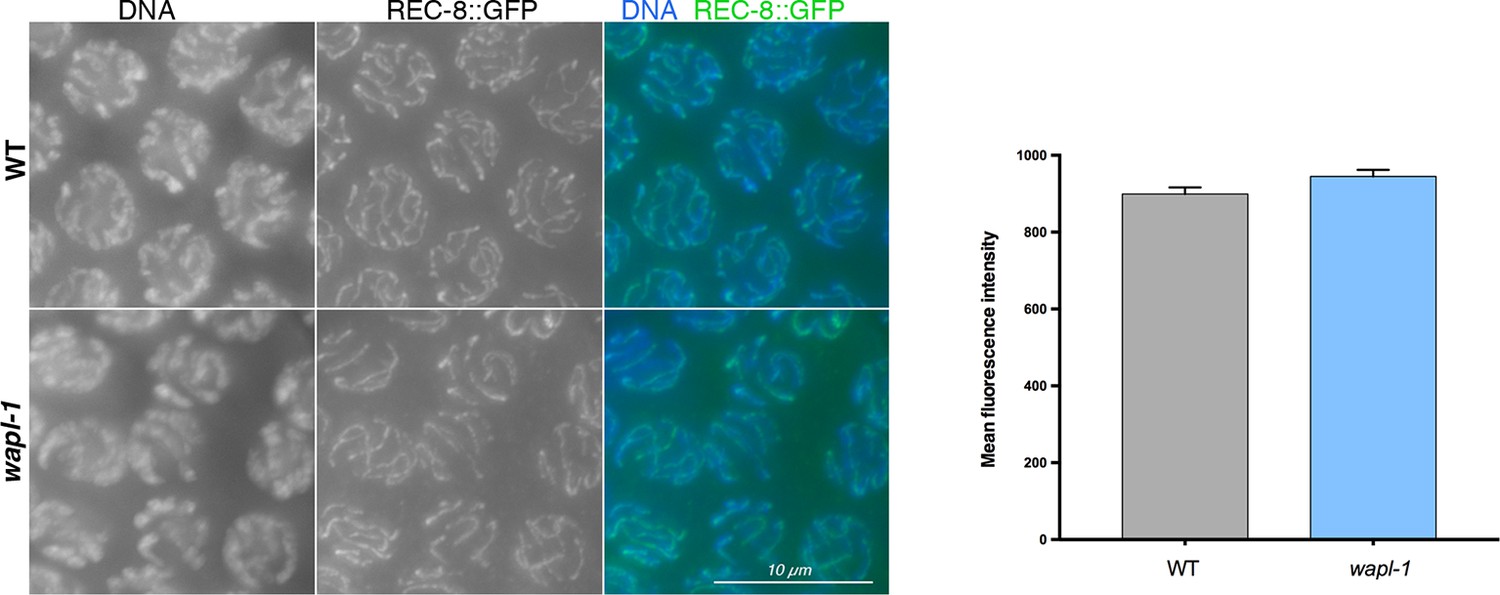
A REC-8::GFP transgene shows similar staining intensity in pachytene nuclei of WT and wapl-1 mutant germ lines.
WT and wapl-1 examples were acquired with the same exposure settings and images are non-deconvolved projections adjusted with same display settings to allow visual comparisons in staining intensity. Chromatin was stained with DAPI (blue). Graph shows quantification of mean fluorescence intensity in pachytene nuclei stained with anti-GFP antibodies. Differences between WT and wapl-1 are not significant, error bars = SEM.
Figure 5—figure supplement 4
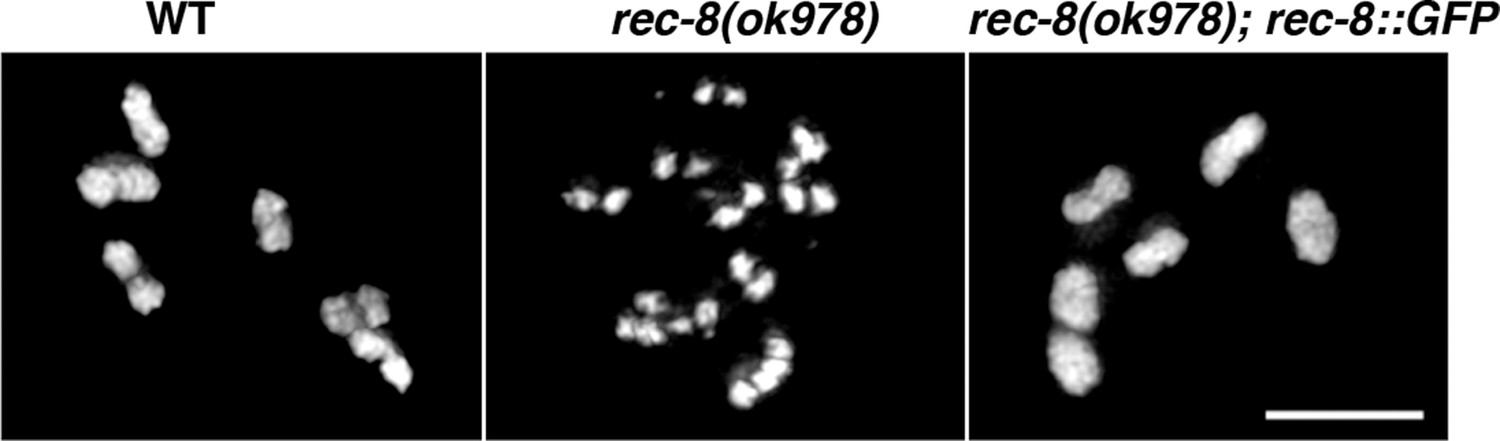
Controls demonstrating the functionality of the REC-8::GFP transgene.
Expression of the REC-8::GFP transgene shown in Figure 4—figure supplement 3 rescues the defects in chiasma formation of rec-8 mutants, demonstrating that the REC-8::GFP fusion protein provides full REC-8 function. Scale bar = 5 µm.
Figure 5—figure supplement 5
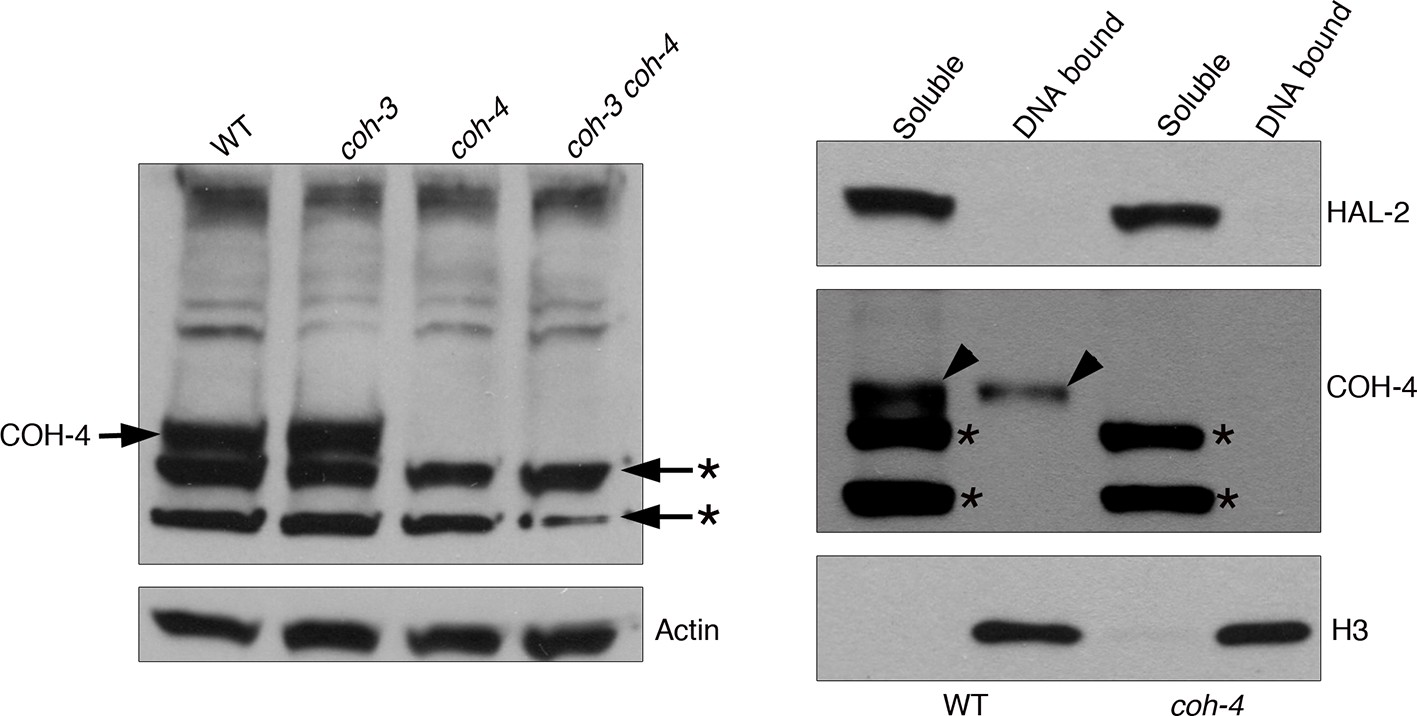
Control western blots for anti-COH-4 antibodies.
Left-hand side western blot: whole worm extracts from indicated genotypes labeled with anti-COH-4 antibodies. A band of the expected molecular weight for COH-4 is present in WT and coh-3 mutant extracts, but not in coh-4 single or coh-3 coh-4 double mutant extracts, demonstrating that the antibodies specifically recognize COH-4. Asterisks indicate two non-specific bands recognized by the antibodies as they are present in extracts from coh-4 single and coh-3 coh-4 double mutants. Actin antibodies are used as loading control. Right-hand side western blot: Protein fractionation (soluble and DNA bound) from WT and coh-4 mutant extracts labeled with anti-COH-4 antibodies. Note that the band corresponding to COH-4 is only detected in WT (arrowheads), with the signal being stronger in the soluble fraction. Two non-specific bands are detected in the soluble fraction of both WT and coh-4 mutant extracts (asterisks). Anti-HAL-2 antibodies were used as a marker for the soluble protein fraction and anti-histone H3 antibodies were used as a marker for the DNA-bound protein fraction.
Figure 6 with 2 supplements

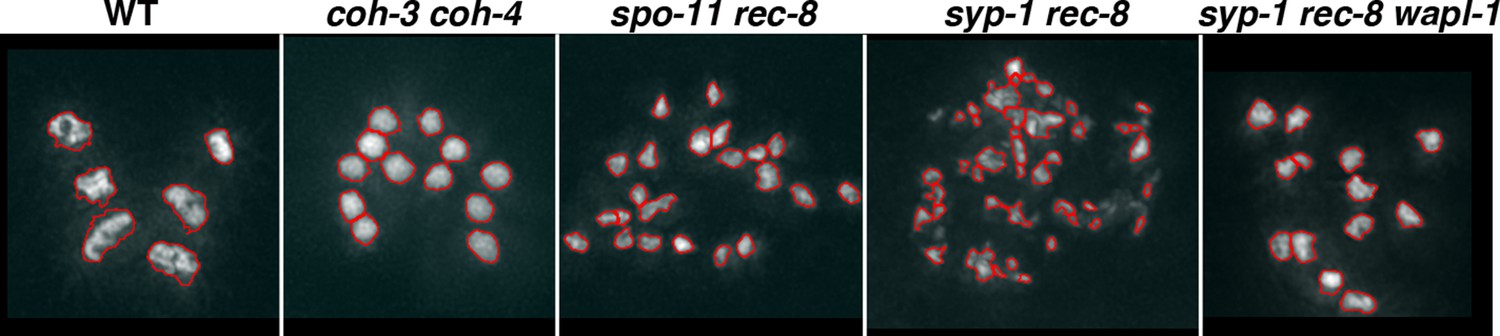
WAPL-1 antagonizes COH-3/4 cohesion in diakinesis oocytes.
(A) Projections of diakinesis oocytes of the indicated genotypes stained with DAPI. 6 DAPI-stained bodies (WT) indicates presence of 6 bivalents, 12 DAPI-stained bodies indicates absence of chiasmata, and the presence of more than 12 DAPI-stained bodies indicates separation of sister chromatids, with 24 demonstrating separation of all sisters. The average number of DAPI-stained bodies observed in each genotype is indicated on the bottom right of each panel, number of nuclei analyzed: WT (20), rec-8 (29), coh-3 coh-4 (16), rec-8 coh-3 coh-4 (17), rec-8 spo-11 (94), coh-3 coh-4 spo-11 (26), and coh-3 coh-4 syp-2 (26). Arrowheads in rec-8 syp-1 panel point to chromosome fragments. Note that removal of SPO-11 or SYP-1/2 causes loss of cohesion in rec-8 mutants but not in coh-3 coh-4 double mutants. (B) Projections of diakinesis oocytes of the indicated genotypes stained with DAPI, quantification shown in (C). Note the reduction of DAPI-stained bodies in rec-8 spo-11 wapl-1 compared with three other genotypes (p<0.0001 in all cases, t-test). Error bars = standard deviation. Number of nuclei analyzed: rec-8 spo-11 (94), rec-8 spo-11 wapl-1 (85), rec-8 spo-11 wapl-1 coh-3 coh-4 (29), rec-8 spo-11 wapl-1GFP::wapl-1 (27). (D) Automated quantification (CellProfiler) of area sizes corresponding to chromatin bodies in projections of diakinesis oocytes of indicated genotypes stained with DAPI. Values on the X axis represent area in pixels and binning of the different categories was adjusted using oocytes of known phenotypes: WT (bivalents), coh-3 coh-4 (univalents) spo-11 rec-8 (detached sisters). Number of oocytes analyzed: WT (40), coh-3 coh-4 (61) spo-11 rec-8 (116). (E) Automated quantification of area sizes corresponding to chromatin bodies in projections of diakinesis oocytes, note that removing WAPL-1 from rec-8 syp-1 double mutants causes a large decrease of chromosome fragments and an increase in univalents. Number of nuclei analyzed: rec-8 syp-1 (52), rec-8 syp-1 wapl-1 (36). (F) Example of DAPI-stained oocyte from rec-8 syp-1 wapl-1 demonstrating absence of chromosome fragments, compare with rec-8 syp-1 example shown in A. (G) Projections of diakinesis oocytes stained with DAPI, note that chromosome fragments are present in rec-8 coh-4 (arrowheads) but not in rec-8 coh-4 wapl-1 oocytes. (H) Automated quantification of area sizes corresponding to chromatin bodies in projections of diakinesis oocytes, note that removing WAPL-1 from rec-8 coh-4 double mutants causes a large decrease of chromosome fragments. 26 diakinesis oocytes were analyzed for both rec-8 coh-4 and rec-8 coh-4 wapl-1.
Figure 6—figure supplement 1
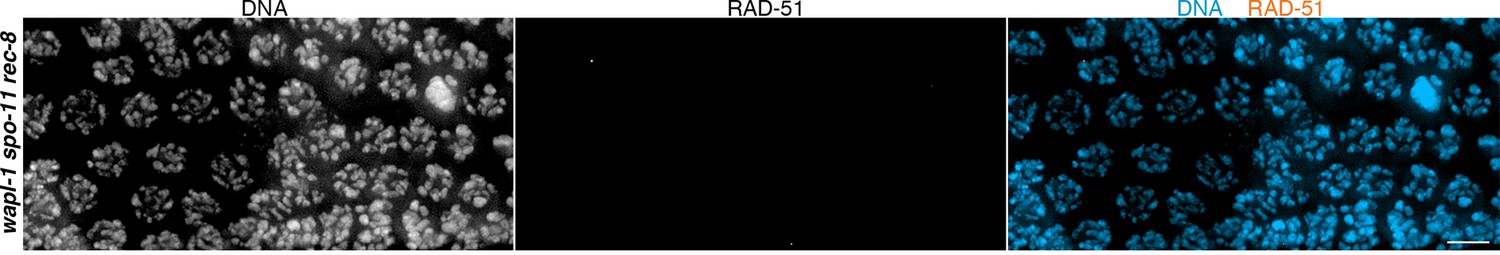
Control demonstrating that unscheduled DSBs are not formed in wapl-1 spo-11 rec-8 triple mutants.
Projections of pachytene nuclei from wapl-1 spo-11 rec-8 triple mutants stained with anti-RAD-51 antibodies and DAPI, note the absence of RAD-51 foci (compare with RAD-51 staining in the wapl-1 panel shown in Figure 2B). Scale bar = 5 µm.
Figure 6—figure supplement 2
Examples of automated area analysis using CellProfiler.
Images show projections of diakinesis oocytes of the indicated genotypes stained with DAPI. Red lines represent the boundaries of chromatin bodies as determined by CellProfiler.
Figure 7
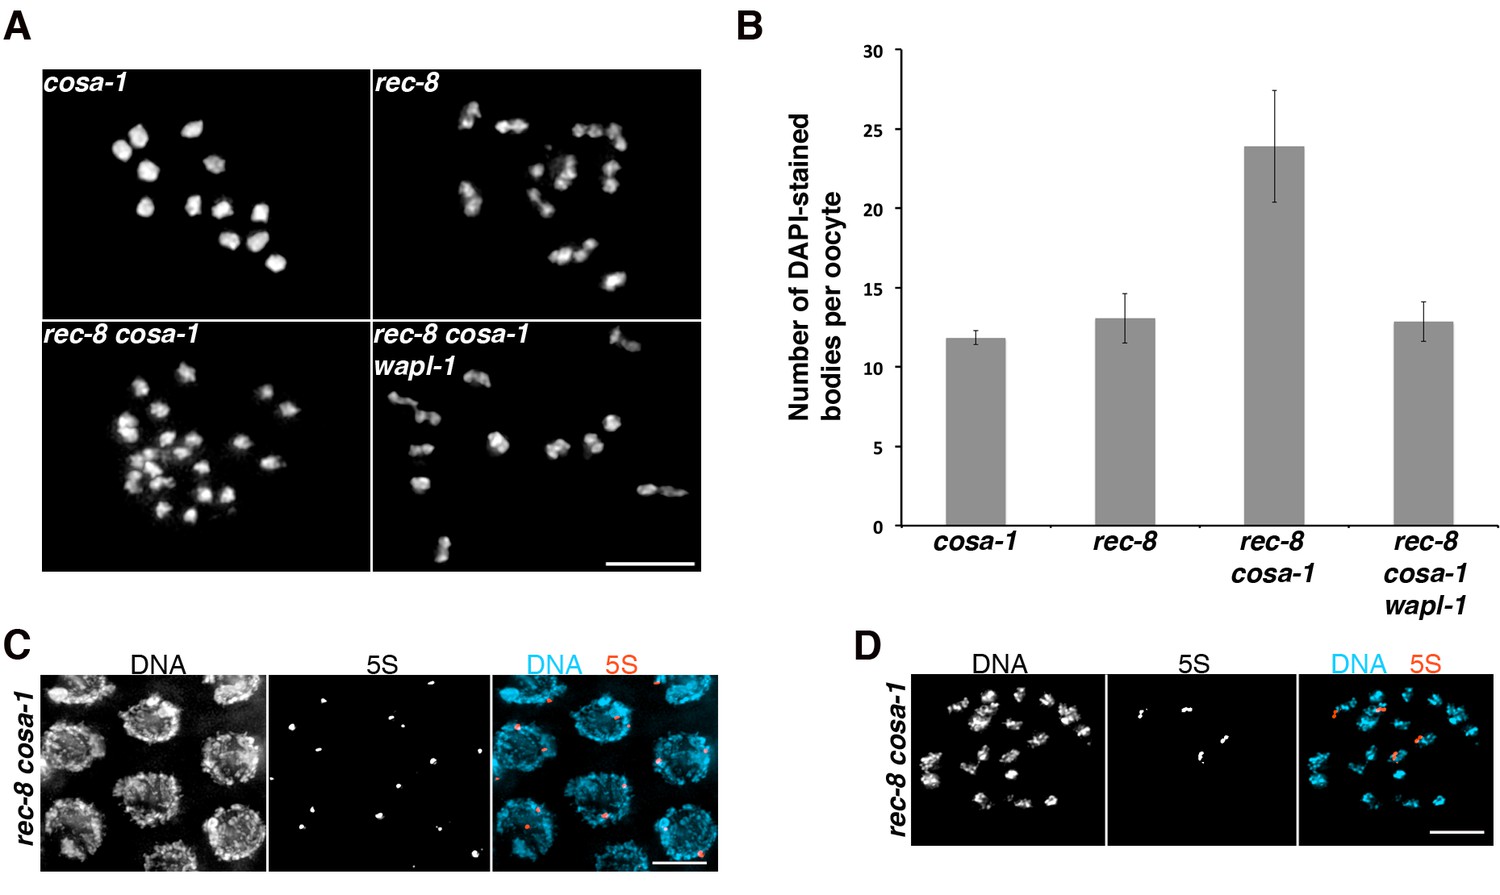
Tethering of sister chromatids in rec-8 oocytes requires crossover precursors.
(A) Projections of diakinesis oocytes stained with DAPI. Sisters are detached in rec-8 cosa-1 oocytes, but not in rec-8 cosa-1 wapl-1 oocytes. (B) Quantification of the number of DAPI-stained bodies in diakinesis oocytes of indicated genotype, note significant increase of DAPI-stained bodies in rec-8 cosa-1 compared with three other genotypes (p<0.0001 in all cases, t-test). Error bars= standard deviation. Number of nuclei analyzed: cosa-1 (65), rec-8 (29), rec-8 cosa-1 (39), rec-8 cosa-1 wapl-1 (42). (C) Projection of pachytene nuclei labeled by FISH with 5S rDNA probe and stained with DAPI. The presence of two signals per nucleus (one per homolog) indicates that sister chromatids are not separated. (D) Projection of a diakinesis oocyte labeled by FISH with 5S rDNA probe and stained with DAPI. The four signals indicate separation of sister chromatids. Scale bar in all panels = 5 µm.
Figure 8 with 1 supplement
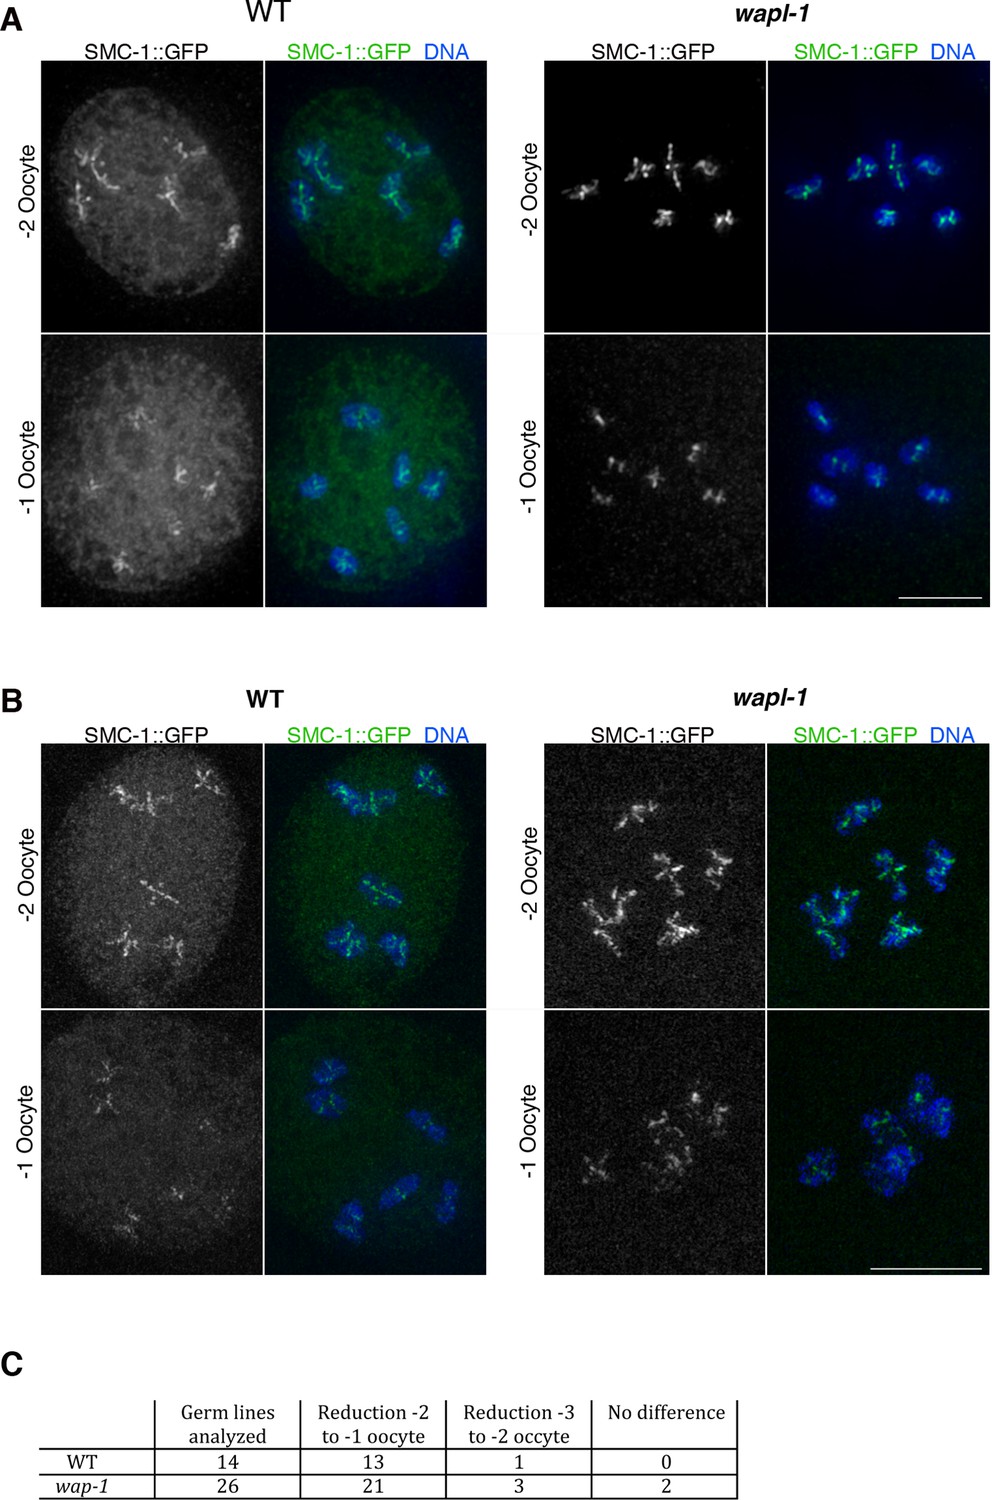
Cohesin is removed by a WAPL-1-independent mechanism in late diakinesis oocytes.
Projections of diakinesis oocytes from worms expressing SMC-1::GFP (tagged by CRISPR) stained with anti-GFP antibodies and DAPI, and imaged with a Delta Vision system (A) or a structured illumination microscope (B). WT oocytes accumulate a large amount of nuclear soluble SMC-1::GFP that is lacking in wapl-1 mutant oocytes, but a reduction in chromosome-associated SMC-1::GFP occurs in -1 oocytes of both WT and wapl-1 mutants. -1 and -2 oocytes shown for each genotype were part of the same germ line and were acquired on the same image. Scale bars = 5 µm. (C) Table showing analysis of reduction in chromosome-associated SMC-1::GFP staining in late diakinesis oocytes of WT and wapl-1 mutant worms.
Figure 8—figure supplement 1
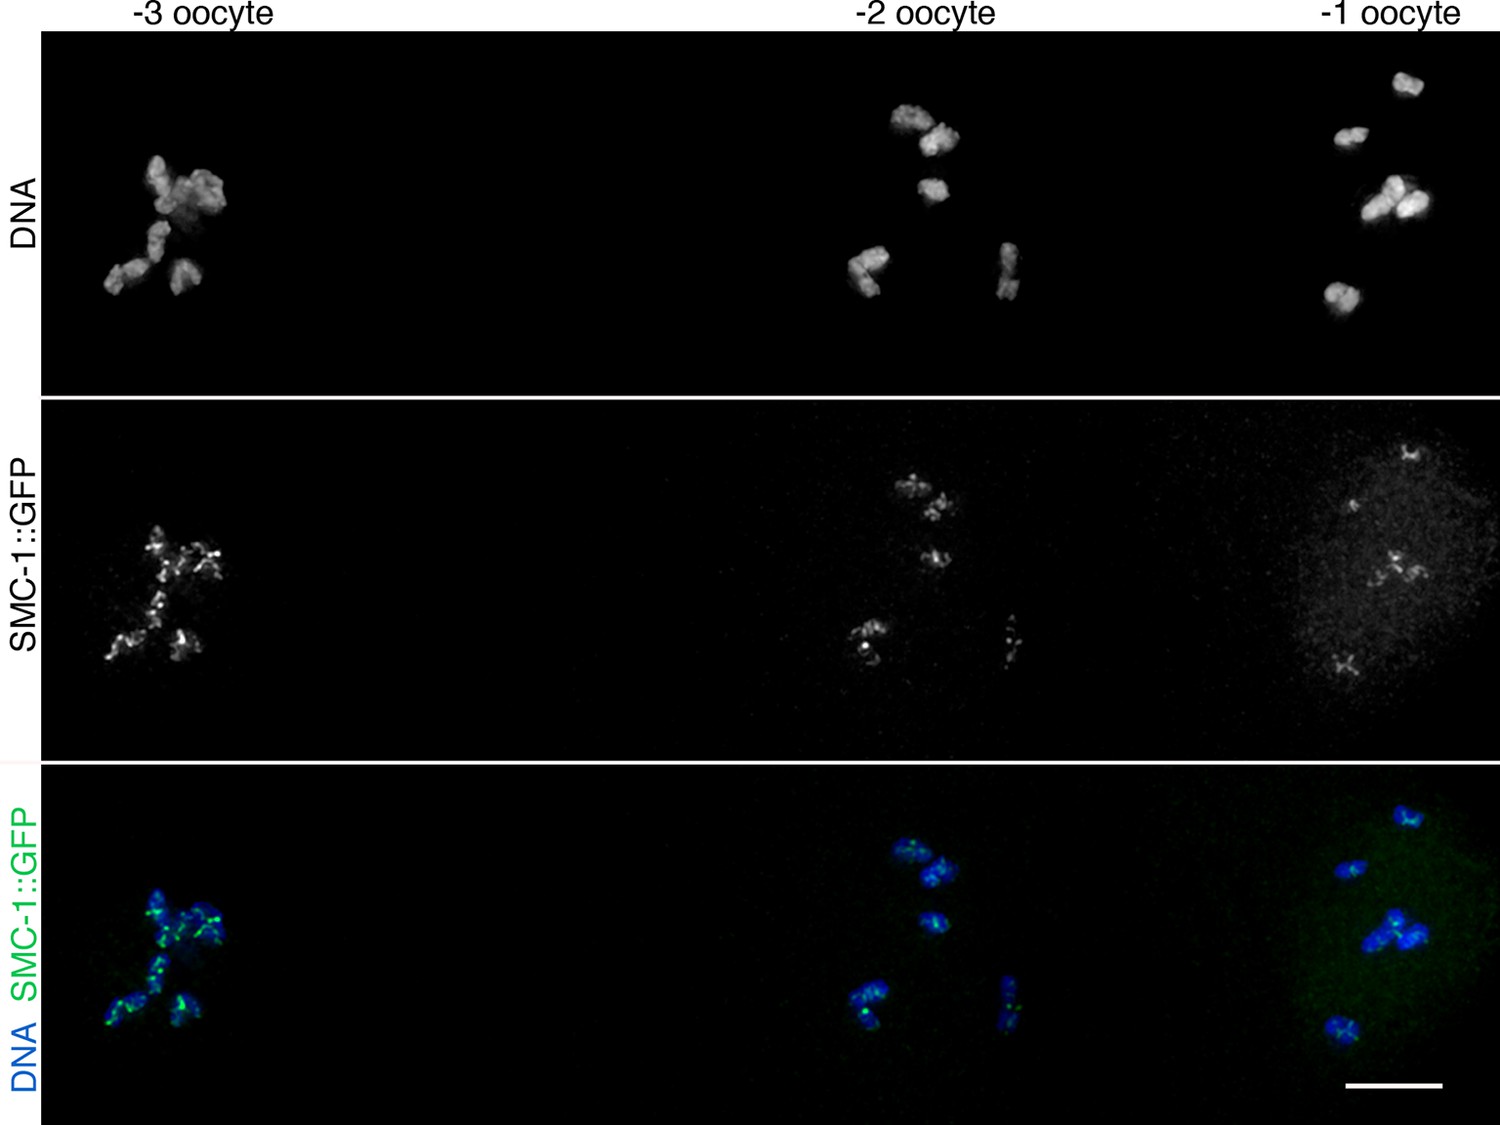
WAPL-1-independent reduction in SMC-1::GFP staining during late meiotic prophase.
Projection of diakinesis oocytes from wapl-1 mutants expressing SMC-1::GFP and stained with anti-GFP antibodies and DAPI. The numbers at the top of the panel indicate the position of oocytes within the germ line (-1 oocyte is about to be ovulated and enter the first meiotic division). Note the decrease in chromosome-associated SMC-1::GFP signal between oocytes -3 and -2. Scale bar = 5 µm.
Videos
Video 1
Live imaging of a WT embryo expressing histone H2B::mcherry.
Filming covers the interval between the first meiotic metaphase and the end of the first mitotic division. Each meiotic division results in the production of a polar body and both polar bodies remain highly condensed and located at one end of the embryo, away from the oocyte and sperm pronuclei. Figure 3D contains individual images from this video in which specific meiotic and mitotic events are labeled (images in Figure 3D are rotated with respect to the video).
Video 2
Live imaging of a wapl-1 mutant embryo expressing histone H2B::mcherry.
Filming covers the interval between the first meiotic division and the end of the first mitotic division. Note that the second polar body does not migrate to the cortex, instead it follows the movement of the oocyte pronucleus towards the middle of the embryo and the chromosomes appear decondensed. As chromosomes in the sperm and oocyte pronuclei condense in preparation for the first mitotic division, condensation of chromatin also occurs in the second polar body. Figure 3D contains individual images from this video in which specific meiotic and mitotic events are labeled, and Video 3 shows continued filming from the same embryo.
Video 3
Continuation of live imaging of the wapl-1 mutant embryo shown in Video 2.
Filming covers the interval between the end of the first mitotic division and up to the four cell embryo. Following the completion of the first mitotic division, chromatin in the second polar body (PB II) undergoes decondensation. PB II localizes to the vicinity of the AB mitotic nucleus, and as chromosomes in the AB nucleus condense so do chromosomes in PB II. At this point condensed chromosomes from the AB nucleus and PB II appear to mix up before dividing into two daughter nuclei. Figure 3D contains individual images from this video in which specific mitotic events are labeled.
Download links
A two-part list of links to download the article, or parts of the article, in various formats.
Downloads (link to download the article as PDF)
Open citations (links to open the citations from this article in various online reference manager services)
Cite this article (links to download the citations from this article in formats compatible with various reference manager tools)
Cohesin-interacting protein WAPL-1 regulates meiotic chromosome structure and cohesion by antagonizing specific cohesin complexes
eLife 5:e10851.
https://doi.org/10.7554/eLife.10851


