A serial multiplex immunogold labeling method for identifying peptidergic neurons in connectomes
- Max-Planck-Institute for Developmental Biology, Germany
Figures
Figure 1
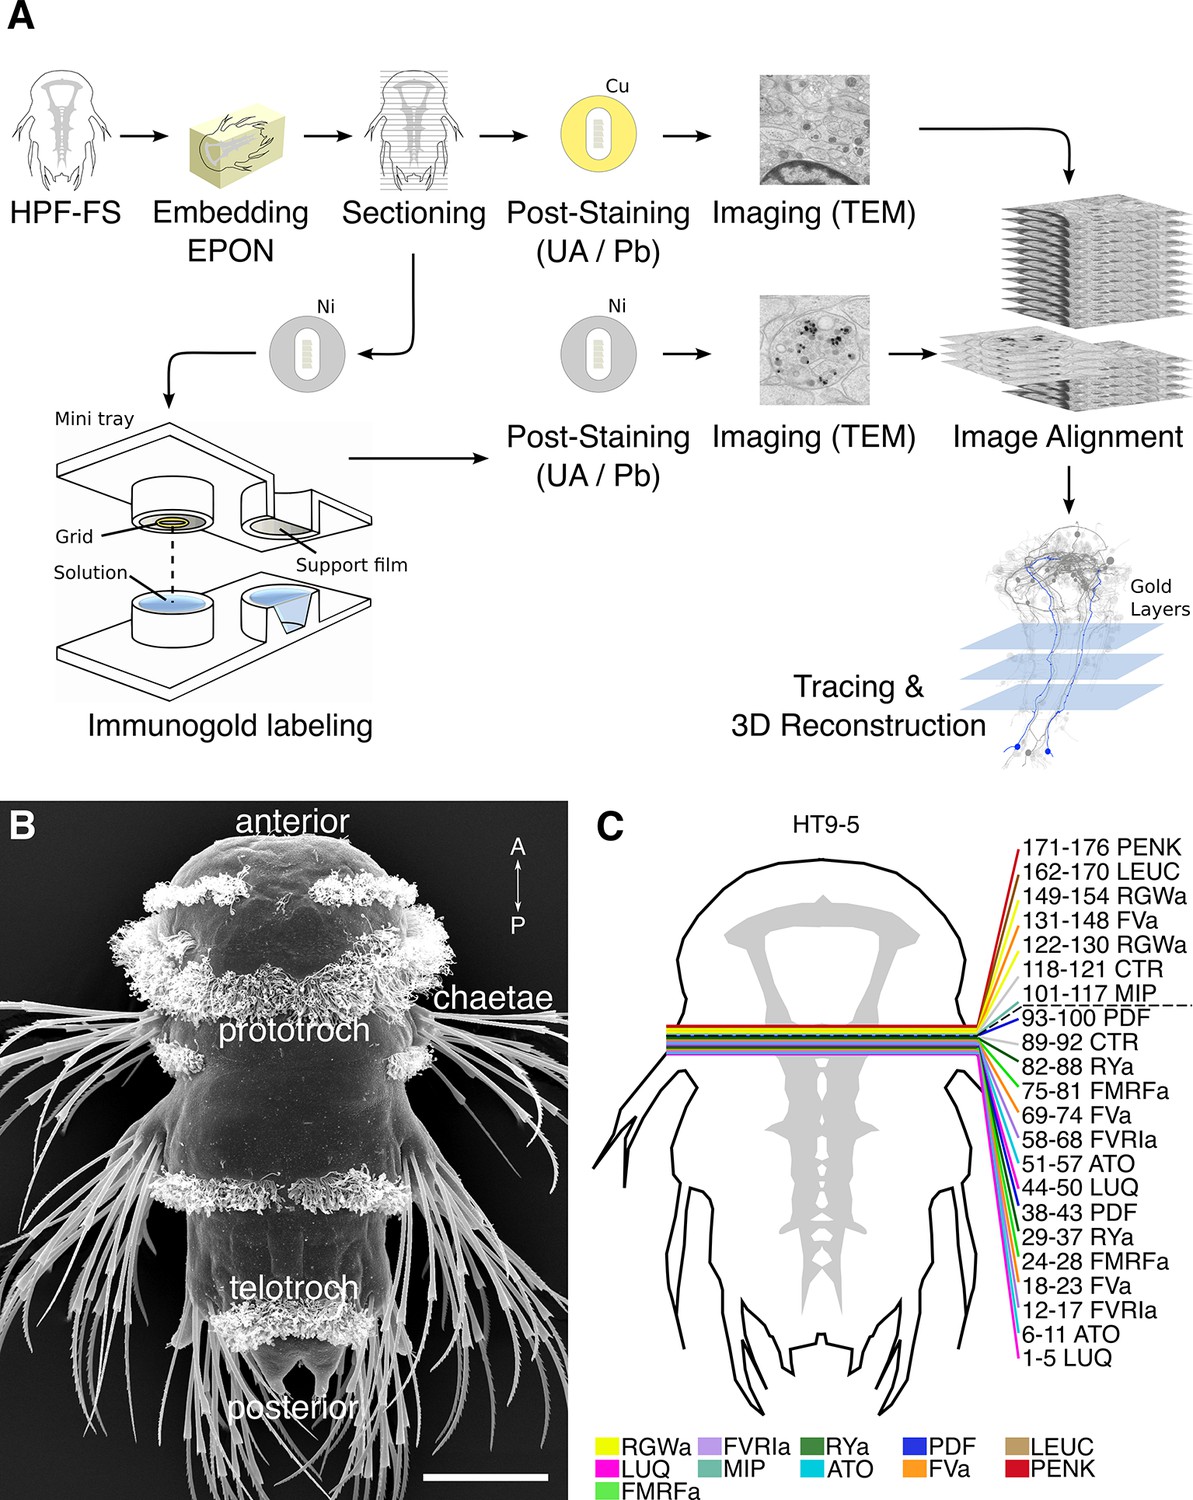
Development of the siGOLD method.
(A) Schematic flowchart of the siGOLD labeling approach from high-pressure freezing and freeze substitution (HPF-FS) to tracing and 3D reconstruction. Ni, nickel grid, Cu, copper grid. (B) SEM micrograph of a 72 hpf Platynereis larva. (C) Schematic of the HT9-5 sample showing the position of the ventral nerve cord (VNC), ventral view. Colored lines indicate where cross-sections through the VNC were taken, near the base of the circumesophageal connectives at the level of the first commissure. Layer number(s) followed by neuropeptide ID are indicated for each colored line. Dashed line indicates the gap (approximately 10 missing sections) between the first and second series of sections. Scale bar: (B) 50 μm.
Figure 2
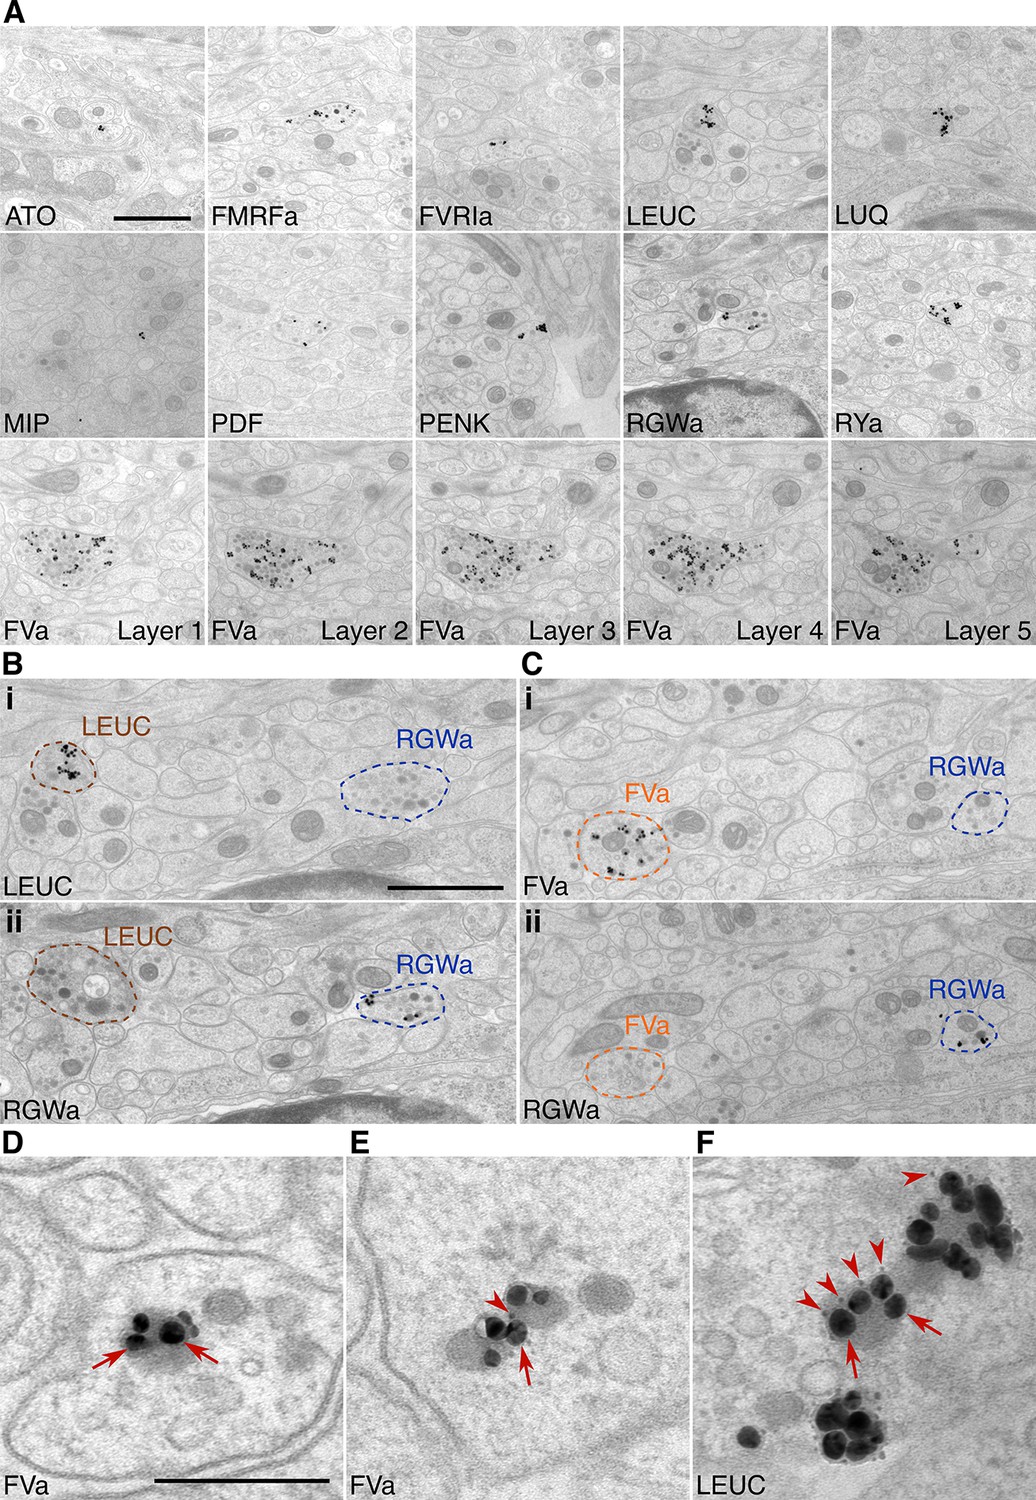
Immunolabeling with neuropeptide antibodes on Epon sections.
(A) Representative micrographs with immunogold labeled axons for the neuropeptide antibodies indicated. For the FVa neuropeptide antibody, five adjacent sections are shown (FVa Layer 1–5). (B, C) Neurite-specific labeling in adjacent sections (seven sections apart) labeled with different antibodies. (D–F) High-resolution micrographs of immunogold labeled, silver-enhanced gold particles (arrows), and unenhanced ultra small gold particles (arrowheads) Scale bar: (A-C) 1 μm; (D–F) 200 nm. High-resolution images are available in (Shahidi, et al., 2015).
Figure 3 with 1 supplement
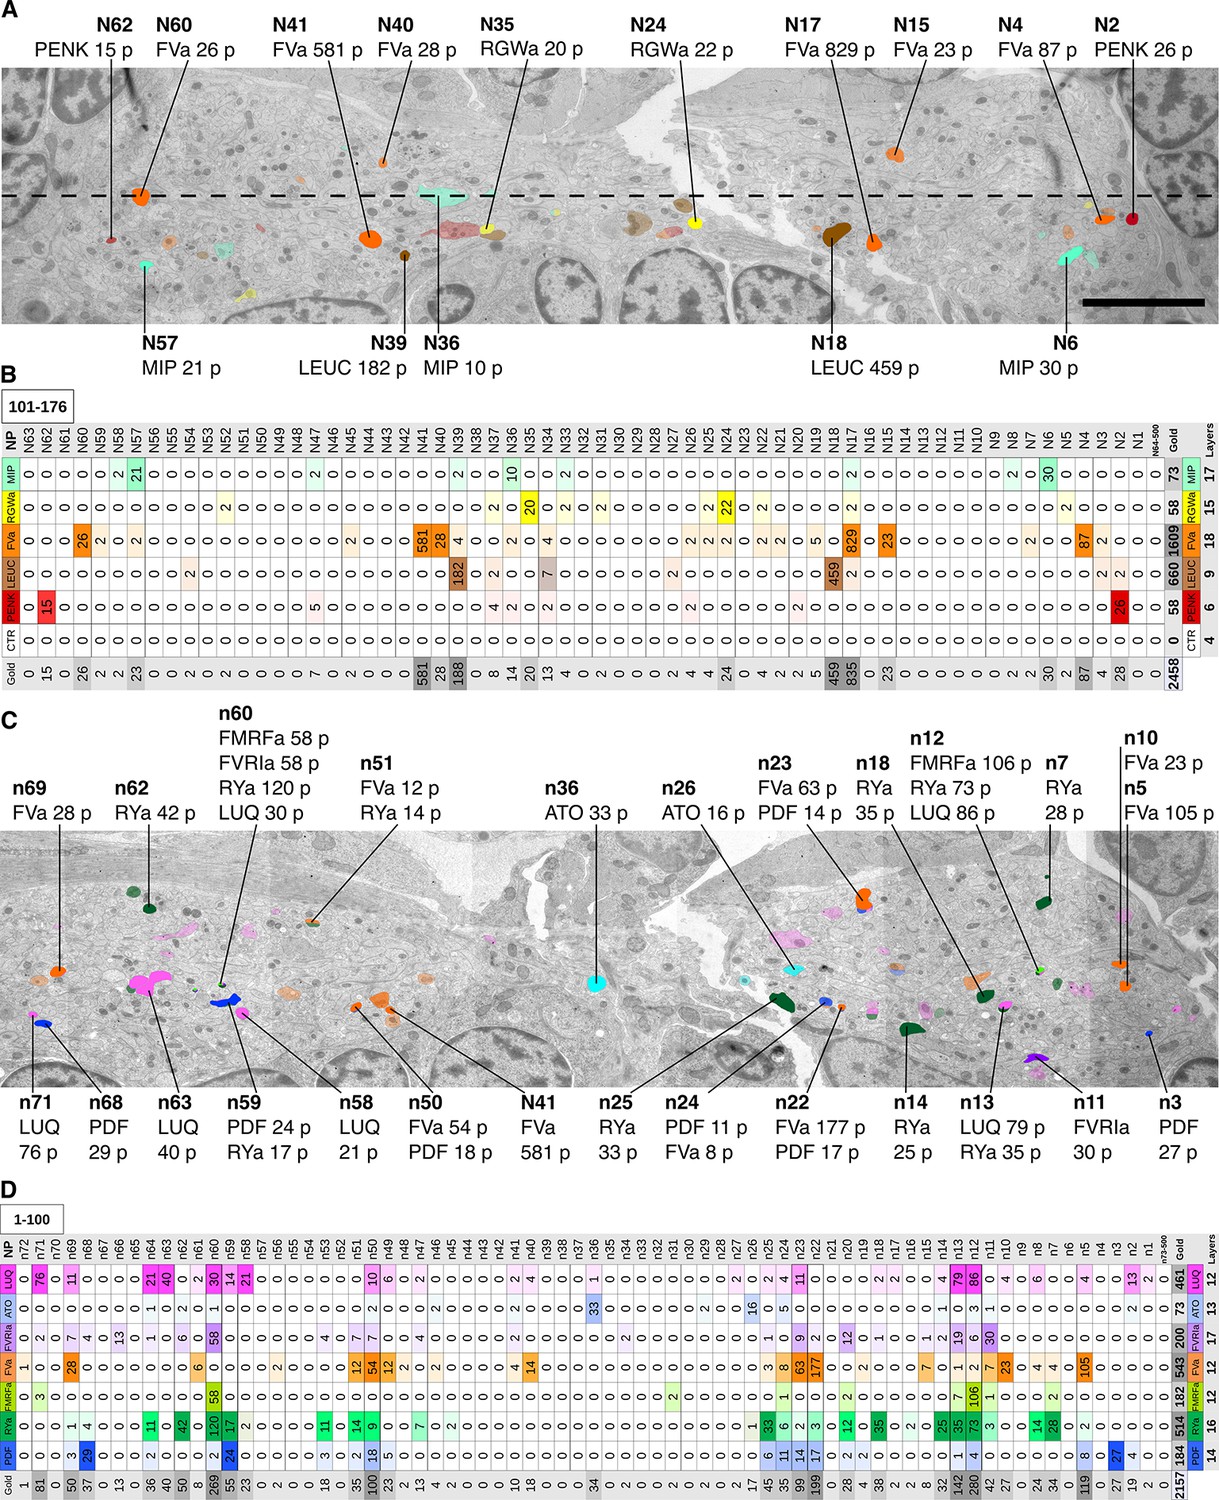
Identification of peptidergic neurites by siGOLD in a 72 hpf Platynereis specimen (HT9-5).
(A, C) Anterior view of EM cross-section through the VNC near the first commissure. Dorsal side of larva is to the top. Strongly labeled neurites were analyzed across the whole VNC region. Control axon profiles were analyzed along a transect (dotted line), two axon profiles were sampled every 1 μm. Total of 72 and 63 axons were examined for the first and second series of sections respectively (an approximately 10-section gap occurs between the two series). Colored cell profiles indicate gold labeled neuropeptidergic axons. Different shades of a color represent an approximation of labeling intensity. Positive axons are tagged with neuron number, neuropeptide name, and total number of gold particles per total number of layers for that neuropeptide. (B, D) Tables show number of gold particles per axon for each neuropeptide. All strongly labeled axons across the VNC and control axons along the sampled transect are shown. Data were arranged according to the spatial distribution of the corresponding neurites in the VNC. Each sampled axon was traced across all layers and counted for its total number of gold particles. Columns indicate neurons and an ID with ‘n’ is given to each neuron in the first series of sections and ‘N’ for neurons in the second series of sections. Rows indicate neuropeptide immunogold labels. Different shades of the same color indicate intensity of gold labeling. Totals are shown for each row (neuropeptide) and each column (axon profile). In the final column of each table, the total number of layers stained for each neuropeptide is shown. Scale bar: 5 μm. Gold scores are available in Figure 3—source data 1.
-
Figure 3—source data 1
Tabulated counts of all gold particles in each traced neurite in HT9-5.
(Sheet 1) Detailed gold counts throughout all layers analyzed from the HT9-5 specimen. (Sheet 2) Tabulated data shown in Figure 3B,D. (Sheet 3) DCV counts and gold counts in selected neurites.
- https://doi.org/10.7554/eLife.11147.007
Figure 3—figure supplement 1
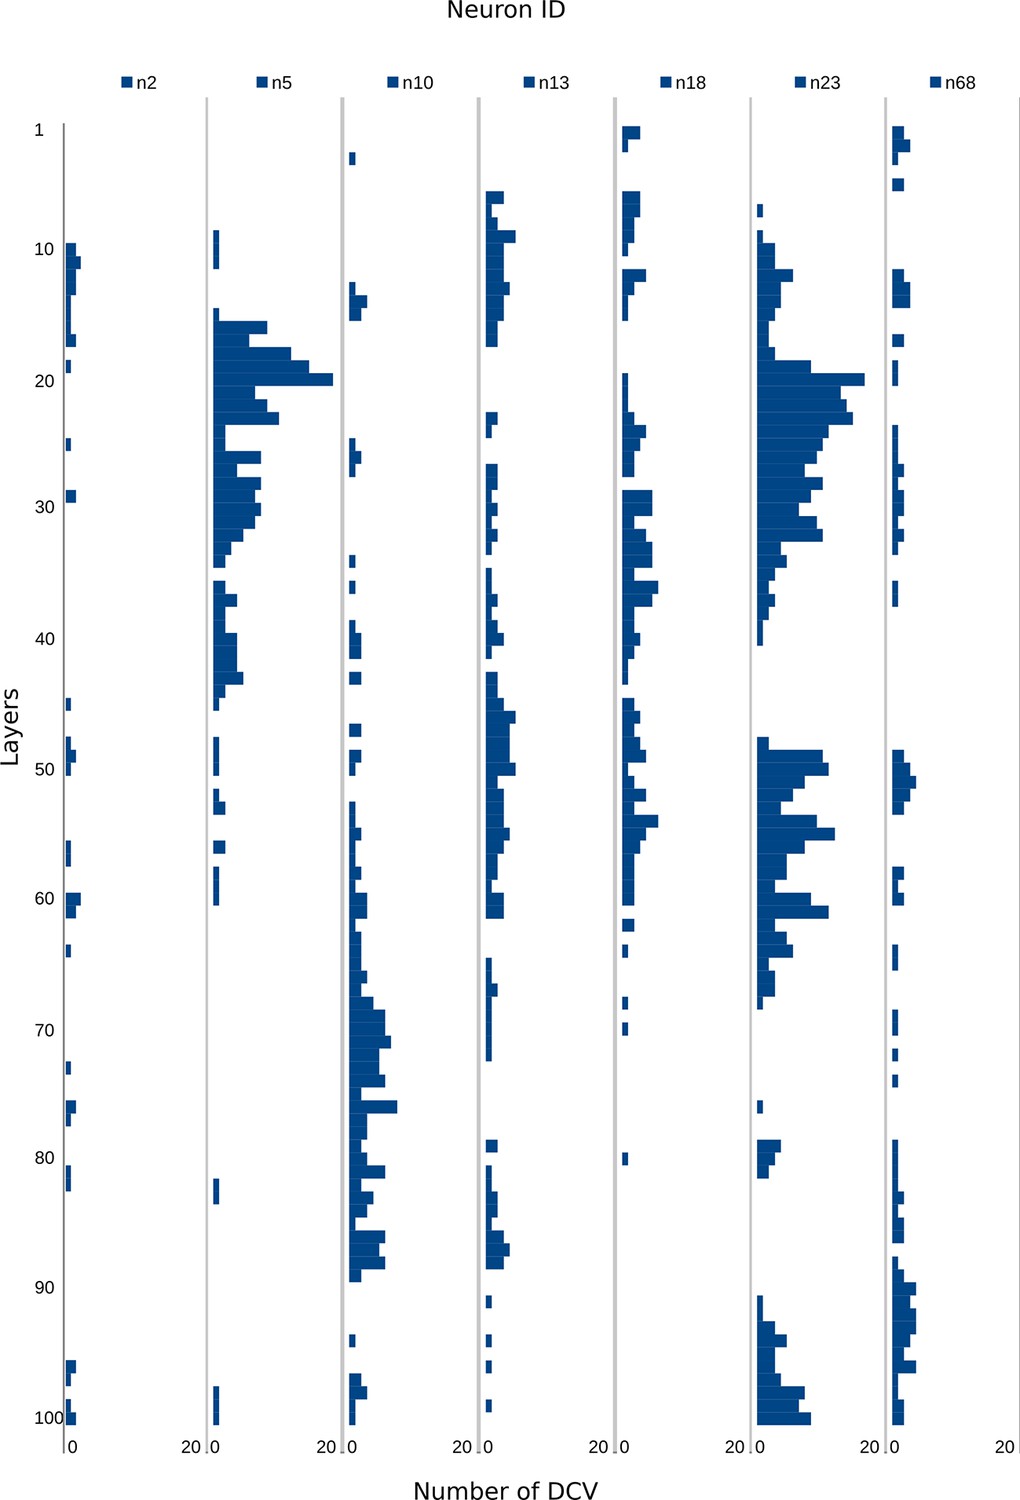
Number of DCVs in selected neurite profiles along 100 layers.
Number of DCVs scored along 100 layers in selected neurites in the HT9-5 dataset. The gold counts for the corresponding profiles are shown in Figure 3—source data 1.
Figure 4 with 1 supplement
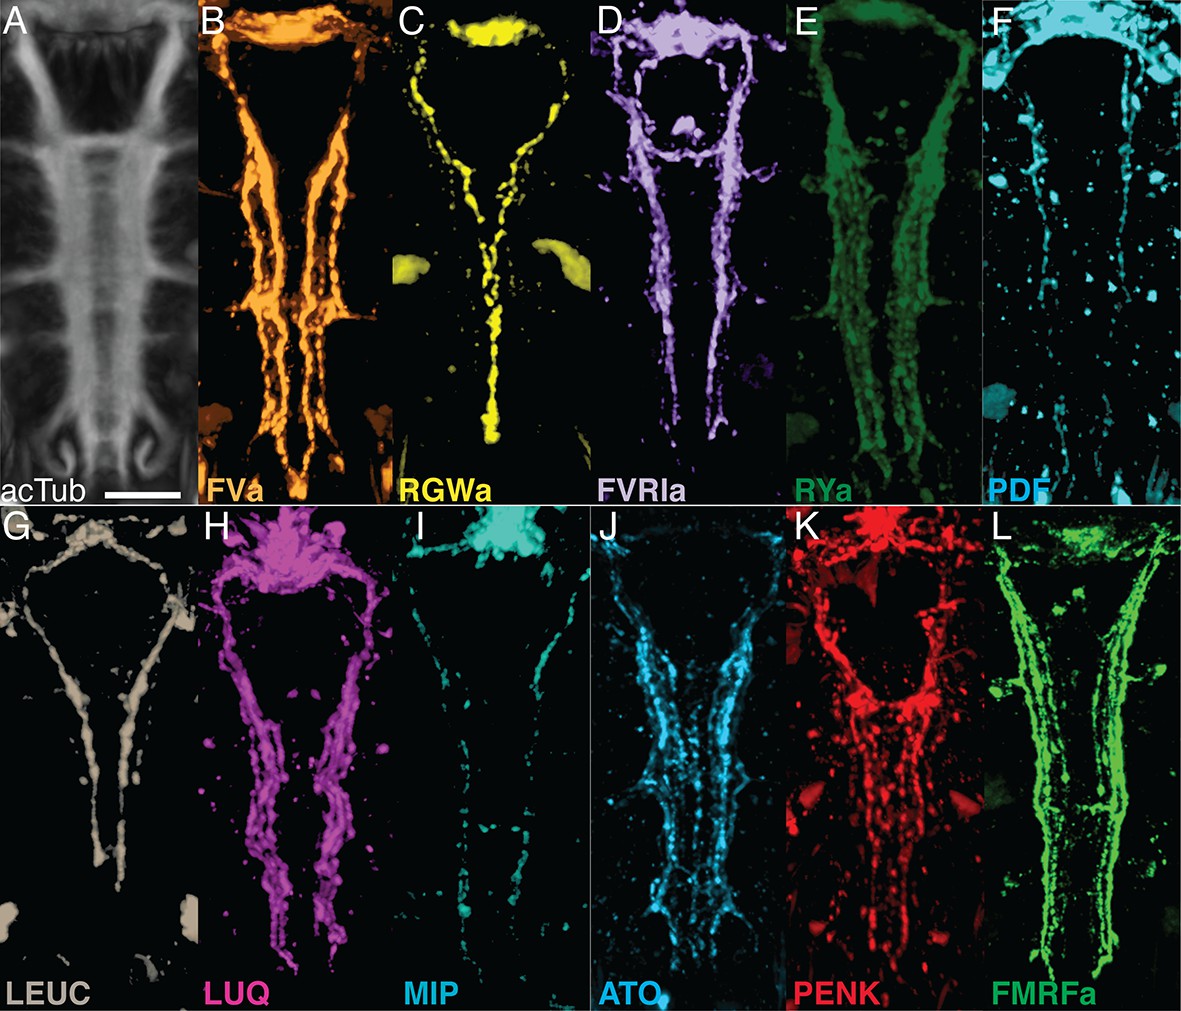
Whole-mount IF of Platynereis larvae with antibodies raised against neuropeptides labels distinct subsets of neuronal tracks in the VNC.
(A) Ventral view of Platynereis VNC, stained with an anti-acetylated tubulin antibody. This is the registered average VNC generated from scans of 36 larvae. (B–L) Whole-mount IF of Platynereis larvae with an antibody raised against (B) FVa, (C) RGWa, (D) FVRIa, (E) RYa, (F) PDF, (G) LEUC, (H) LUQ, (I) MIP, (J) ATO, (K) PENK, (L) FMRFa. Whole-mount scans were cropped to show only the VNC region. Scale bar: 20 μm.
Figure 4—figure supplement 1
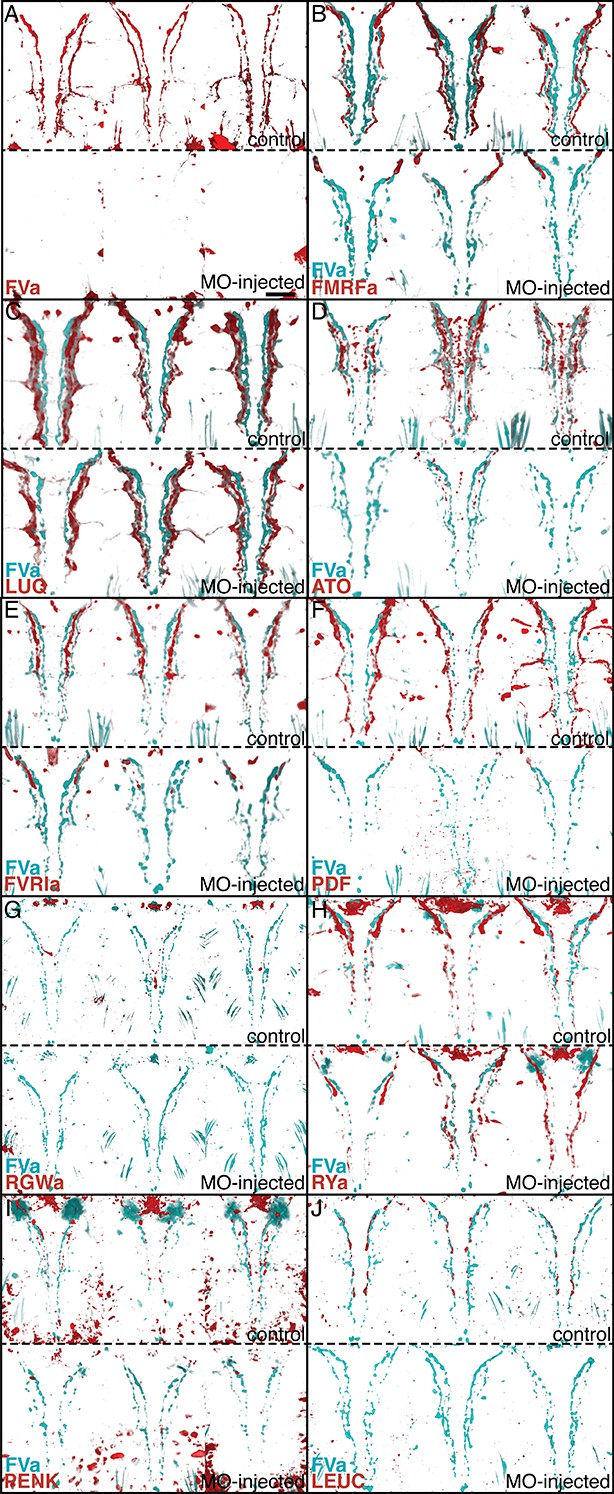
Morpholino-mediated knockdown of proneuropeptides followed by whole-mount IF indicates antibody specificities.
Whole-mount IF of 72 hpf uninjected control Platynereis larvae and larvae micro-injected with translation-blocking morpholinos (MOs) targeting different neuropeptide precursor genes. FVa-knockdown and control larvae were stained with an antibody raised against FVa and counterstained with acetylated tubulin. All other control and knockdown larvae were co-stained with an antibody raised against FVa and an antibody raised against the MO target peptide indicated and counterstained with acetylated tubulin. All larvae are shown in ventral view. For each neuropeptide, three control larvae (top) and three MO-knockdown larvae (bottom) are shown. (A) FVa knockdown and control larvae with antibody raised against FVa. (B) FMRFa knockdown and control larvae with antibody raised against FMRFa. (C) LUQ knockdown and control larvae with antibody raised against LUQ. (D) ATO knockdown and control larvae with antibody raised against ATO. (E) FVRIa knockdown and control larvae with antibody raised against FVRIa. (F) PDF knockdown and control larvae with antibody raised against PDF. (G) RGWa knockdown and control larvae with antibody raised against RGWa. Note that the staining in the head is eliminated following knockdown. The staining in the VNC was too weak in these samples. (H) RYa knockdown and control larvae with antibody raised against RYa. (I) PENK knockdown and control larvae with antibody raised against PENK. (J) LEUC knockdown and control larvae with antibody raised against LEUC. Scale bar: 30 µm.
Figure 5
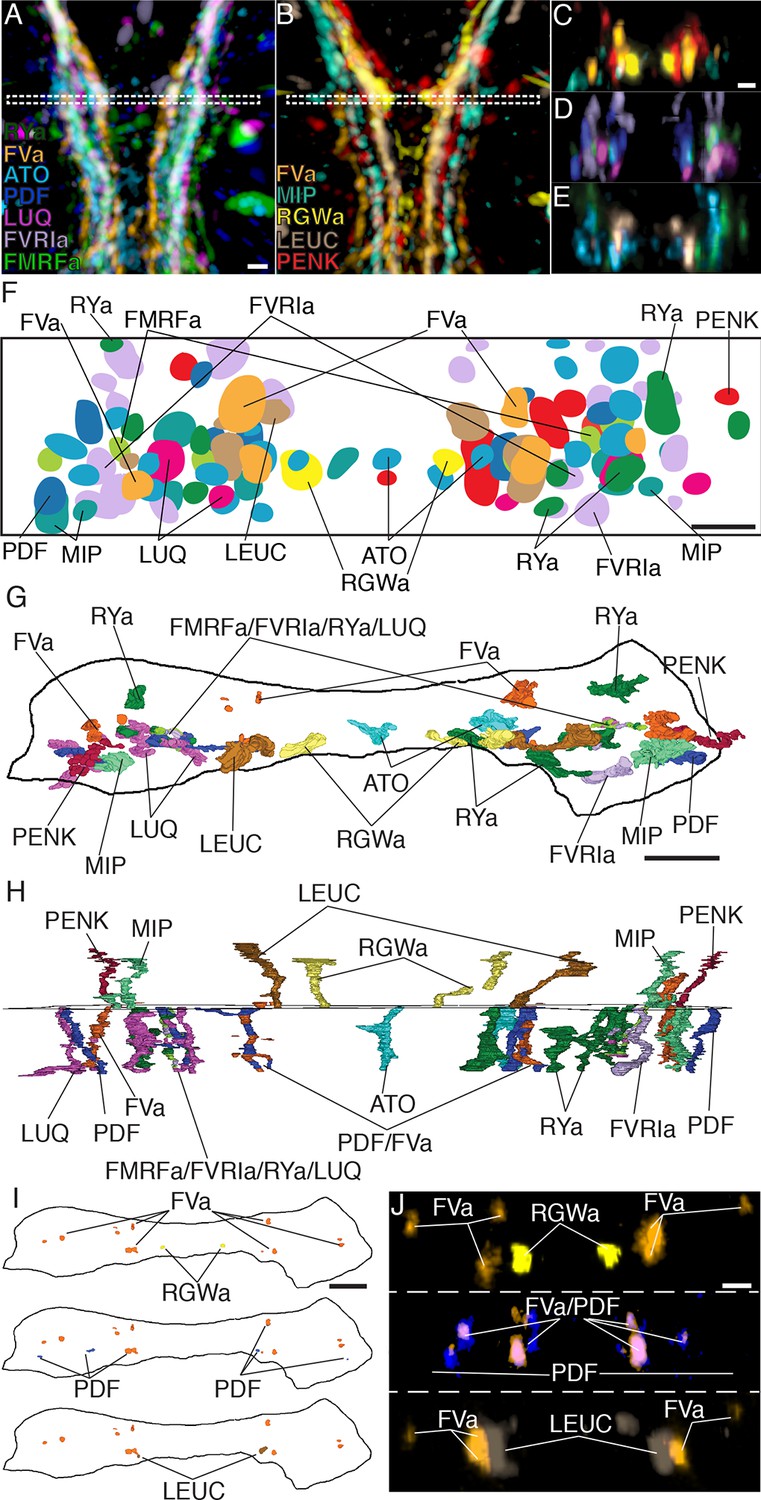
Axonal arrangements in the VNC detected by whole-body IF spatially match those detected by siGOLD.
(A, B) Ventral overview of individual registered full-body IF with antibodies raised against 11 different neuropeptides (colors). Image is cropped to show only the VNC in the first segment. White dashed box indicates the region where a 5 μm virtual transverse section shown in (C–E) was taken. (C–E) 5 μm virtual transverse section of individual registered full-body IFs from (A, B) in anterior view to indicate their spatial position in the VNC relative to each other. (C) RGWa, FVa, PENK, MIP, (D) FVRIa, PDF, LUQ, FMRFa (E) RYa, LEUC, ATO. (F) Schematic overview of (C–E) indicating relative positioning of individual registered antibody stainings in the VNC, anterior view. (G, H) Reconstruction of neurites labeled by siGOLD in the VNC of specimen HT9-5 with antibodies raised against 11 different neuropeptides, (G) anterior view, (H) ventral view. For comparison with registered IF labeling in (A–F). (I) Position of neurites in specimen HT9-5 siGOLD-labeled with FVa and RGWa (top), FVa and PDF (middle), and FVa and LEUC antibodies (bottom). For comparison with double-IF in (J). (J) 2 μm virtual transverse sections of the VNC of 72 hpf Platynereis larvae double-stained with the FVa antibody (orange) and the RGWa (yellow, top), the PDF (blue, middle) or the LEUC (brown, bottom) antibodies. Scale bars: (A–E) 15 μm, (F–J) 5 μm.
-
Figure 5—source data 1
Acetylated tubulin reference signal used for image registration.
The reference is based on the registration and averaging of the acetylated tubulin signal from 36 whole-body confocal stacks. The file is a mult-image TIFF stack and can be opened e.g. with Fiji or ImageJ.
- https://doi.org/10.7554/eLife.11147.012
Figure 6
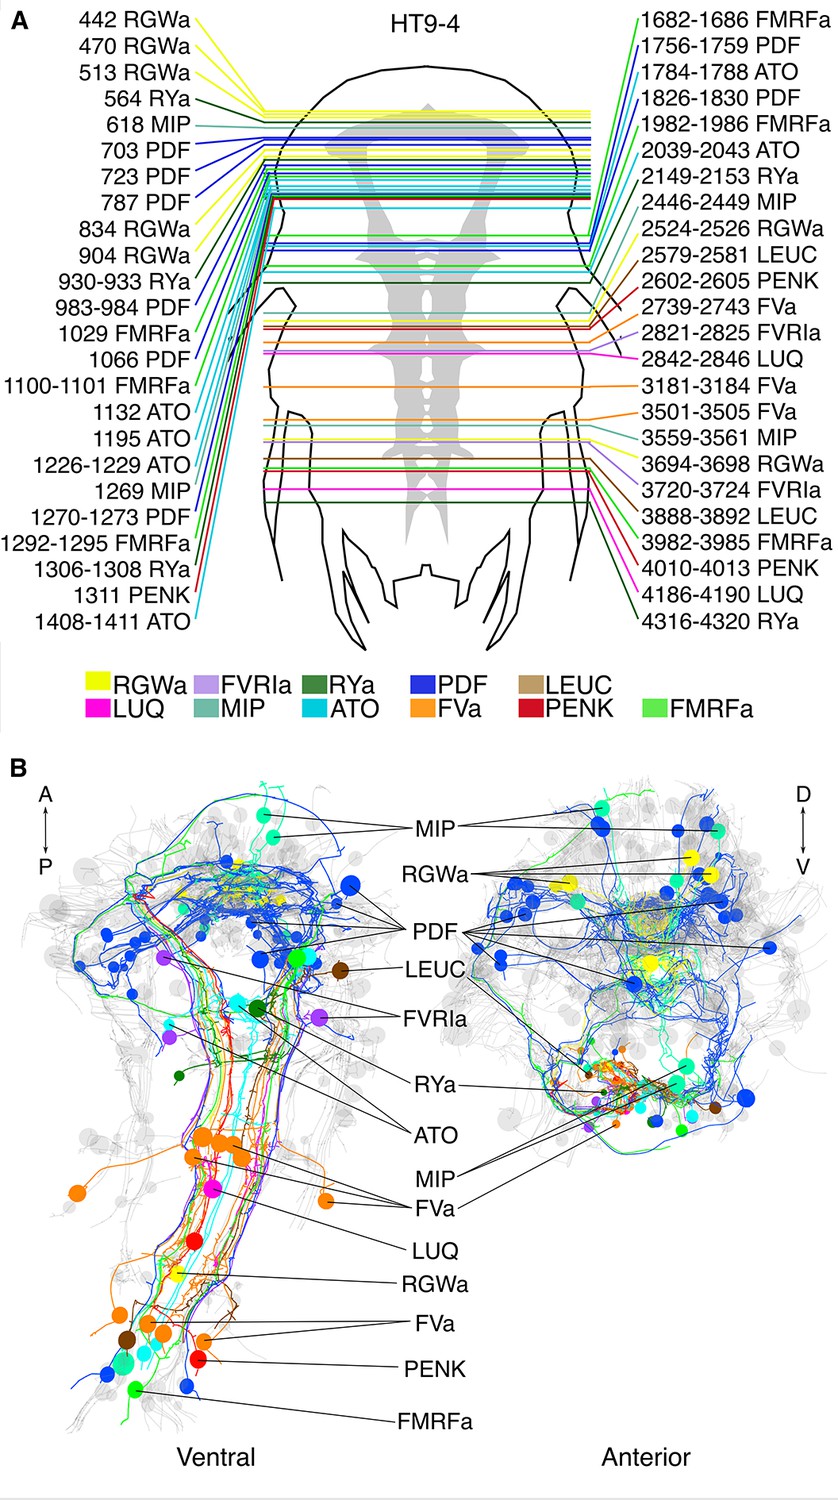
siGOLD labeling in a whole-body serial EM dataset (HT9-4).
(A) Schematic of the HT9-4 specimen showing the position of the VNC (grey), ventral view. The entire larva was fully sectioned and imaged. Colored lines indicate the position of sections that were used for immunolabeling. For each line, layer number(s) followed by the name of the neuropeptide that was immunogold-labeled in those layers are indicated. (B) Ventral and anterior views of all fully traced immunogold-labeled peptidergic neurons. Detailed layer information is available in Figure 6—source data 1.
-
Figure 6—source data 1
Complete layer statistics of the sections and images of HT9-4.
The table is updated from (Randel et al., 2015) with the information on all immunoEM layers.
- https://doi.org/10.7554/eLife.11147.015
Figure 7
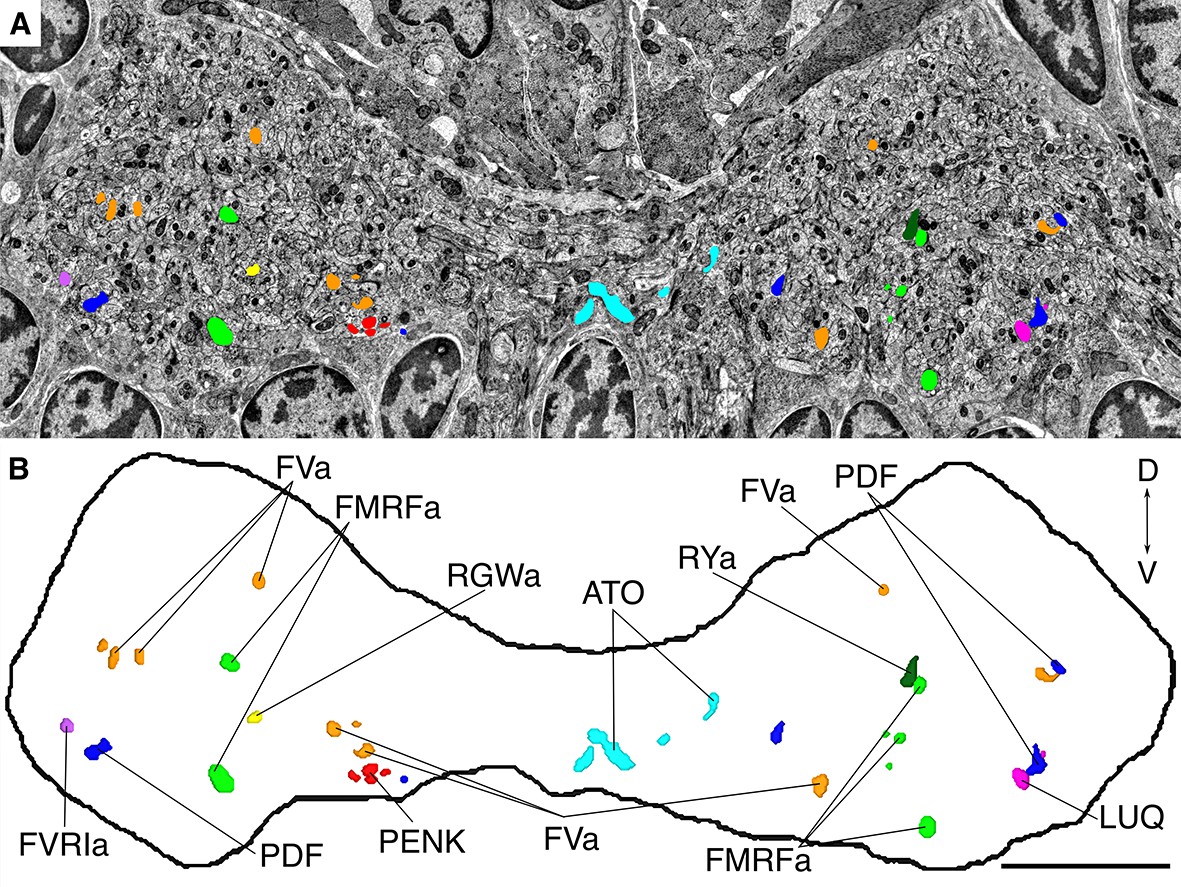
Position of siGOLD-labeled neurites in a cross-section of the VNC in HT9-4.
(A) TEM image of a VNC cross-section with the segmented profiles of peptidergic neurites identified by siGOLD. Different colors represent different neuropeptide-antibody labeling. (B) Segmented profiles of peptidergic axons in a cross-section through the VNC near the base of the circumesophageal connectives at the first commissure. All traced neuropeptidergic axons crossing the VNC at that level in the HT9-4 specimen are shown. Scale bar: (B) 5 μm.
Figure 8
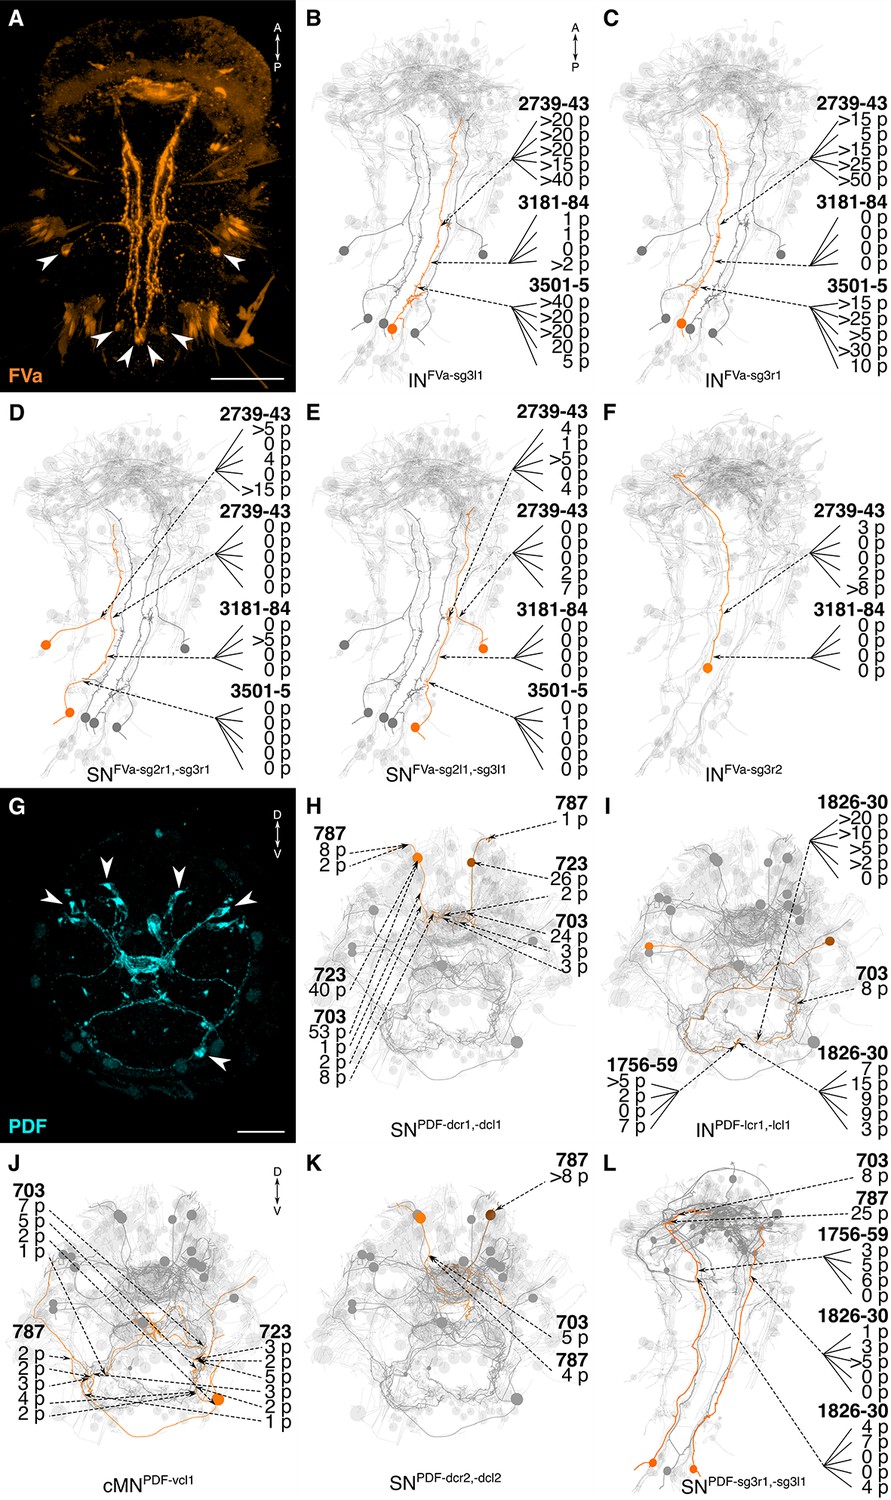
siGOLD labeling and whole-body neuron reconstructions in HT9-4.
(A, G) Full body IF labeling of FVa and PDF-positive cells, ventral view and anterior view, respectively. Note that (A) is 72 hpf and (G) is 48 hpf. Arrowheads point to neuron cell-bodies that were traced in EM reconstructions. (B–F, H–L) Fully reconstructed neurons, identified using the siGOLD method in the full body HT9-4 dataset. Dashed arrows indicate immunogold labeled layers along the neurite, layer number(s) and number of gold particles per layer are shown. Reconstructed FVa (B–F) and PDF (H–L) positive cells. Scale bars: (A) 50 μm; (G) 30 μm.
Figure 9
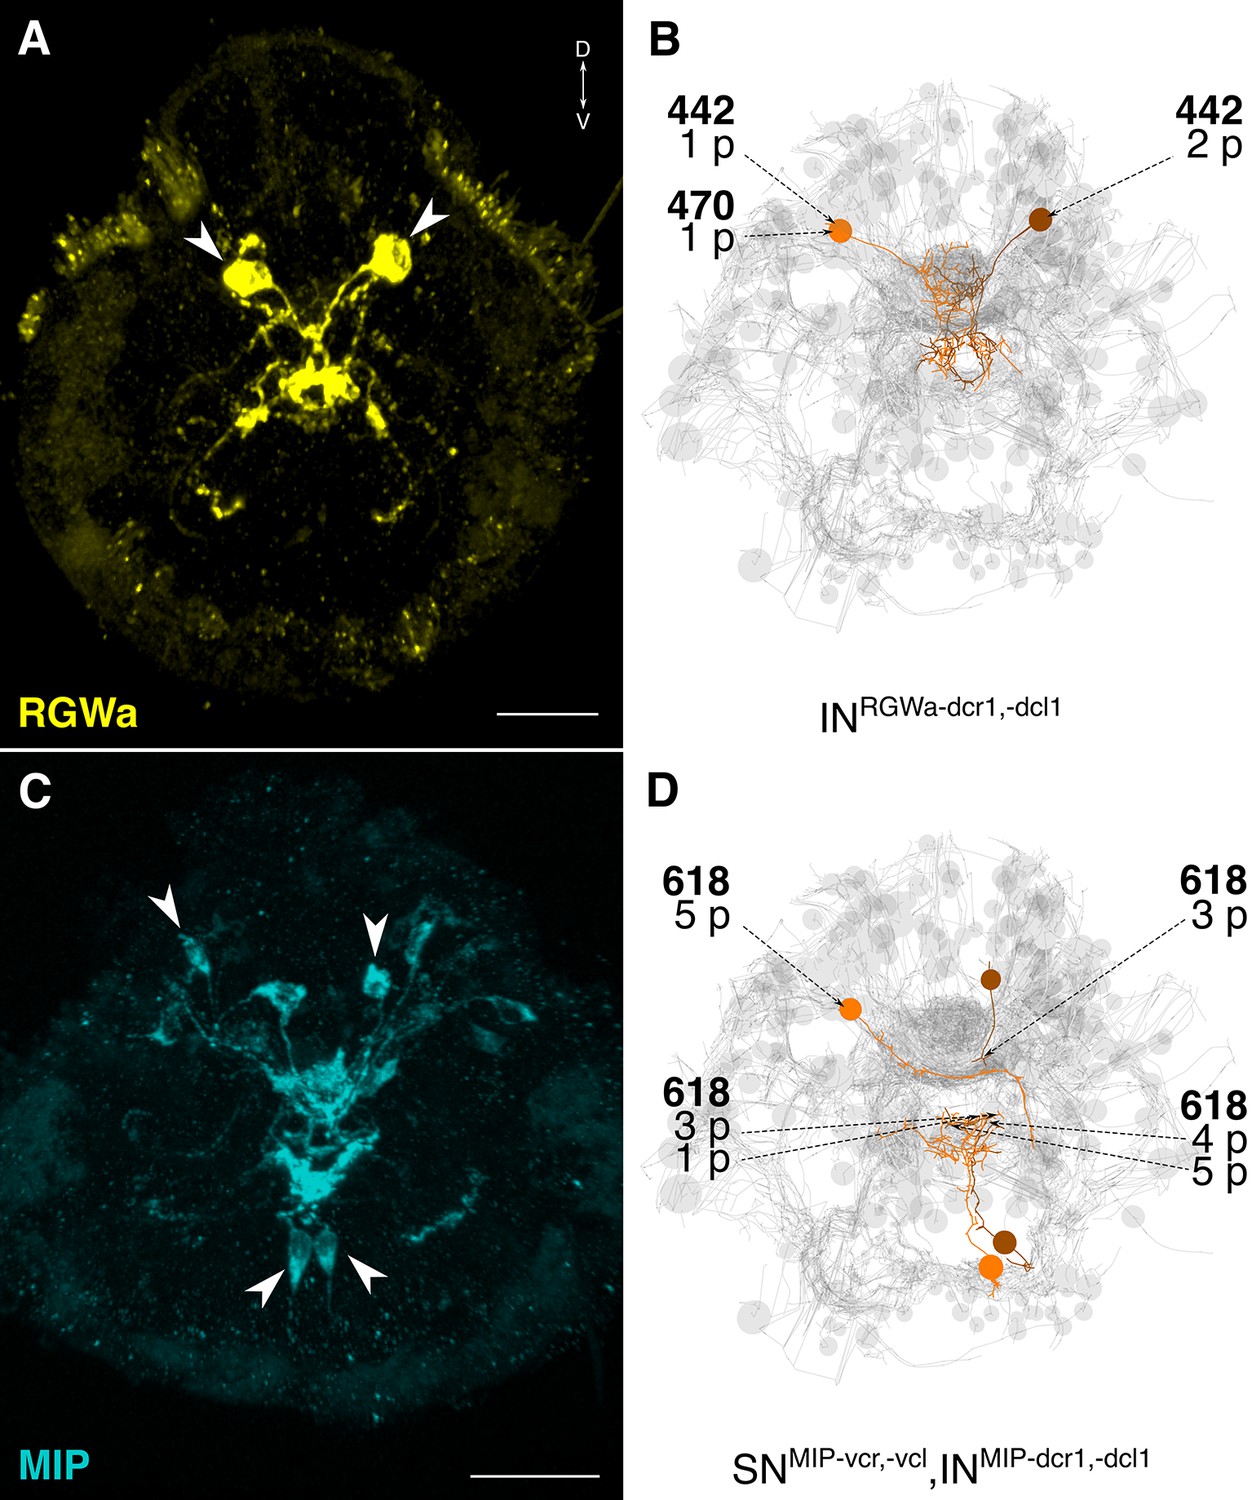
siGOLD labeling and whole-body neuron reconstructions in HT9-4.
(A, C) Full body IF labeling of RGWa and MIP-positive cells in 72 hpf larvae, anterior views. Arrowheads point to neurons that were traced in EM reconstructions. (B, D) Traced neurons, identified using the siGOLD method in the full body HT9-4 dataset. Dashed arrows indicate immunogold-labeled layers along the neurite, layer number(s) and the number of gold particles per layer are shown. Reconstructed RGWa (B) and MIP (D) positive cells. Scale bars: (A, C) 30 μm.
Figure 10 with 2 supplements
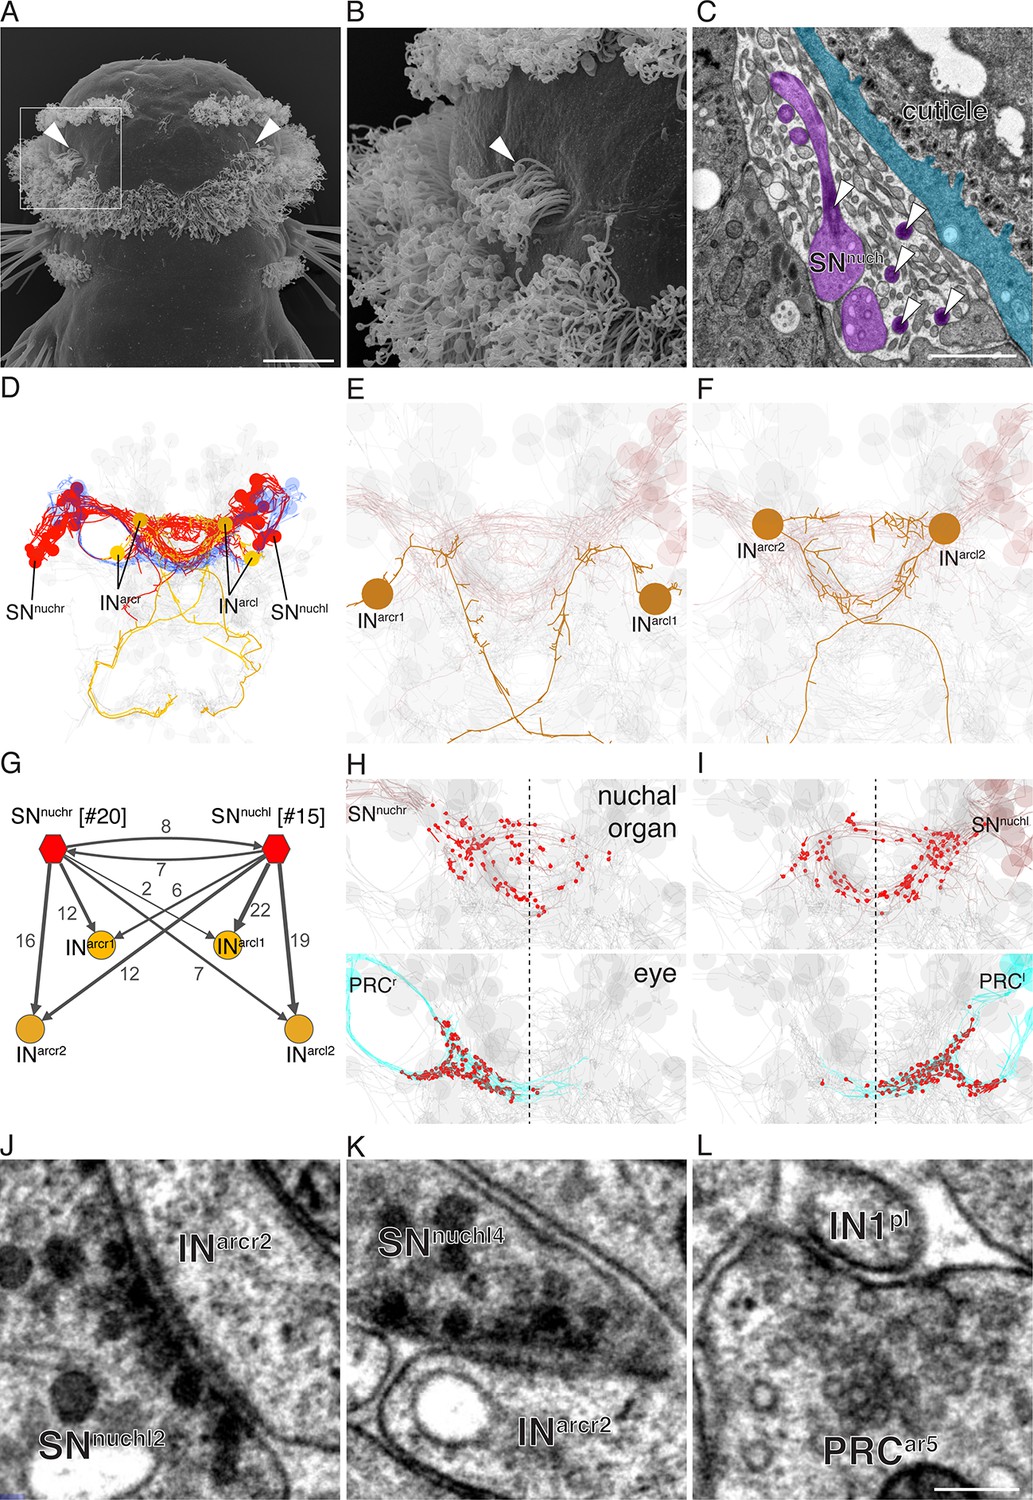
Reconstruction of a siGOLD-labeled peptidergic circuit.
(A, B) SEM image of the nuchal organs (arrowhead) in the dorsal-posterior head of a 72 hpf Platynereis larva, dorsal view. Boxed area is shown enlarged in (B). Arrowheads point at motile cilia above the olfactory pit. (C) TEM image of a cross section of the nuchal organ showing the olfactory pit with sensory neurons and microvilli. Arrowheads point at sensory cilia. Sensory endings in the olfactory pit are highlighted in magenta, an epithelial cell underneath the cuticle is highlighted in blue. (D) 3D reconstruction of the nuchal organ circuit. SNnuch neurons (red), and INarc (orange) interneurons are shown. The photoreceptor cells of the adult eyes are shown in blue as a reference. (E, F) 3D reconstruction of INarc (orange) interneurons. (G) Graph representation of SNnuch connectivity. Nodes represent neurons or groups of neurons, edges represent synaptic connections. The number of synapses is indicated on each arrow. Edge thickness is proportional to the square root of the number of synapses. (H, I) Presynaptic sites (red dots) in SNnuch neurons and adult-eye photoreceptor cells (PRC) with their soma on the right (H) or left (I) side of the body. (J, K) Peptidergic synapses in SNnuch neurons. (L) A glutamatergic synapse in an adult eye photoreceptor cell. Scale bar: (A) 30 μm; (C) 1 μm; (L) 150 nm.
Figure 10—figure supplement 1
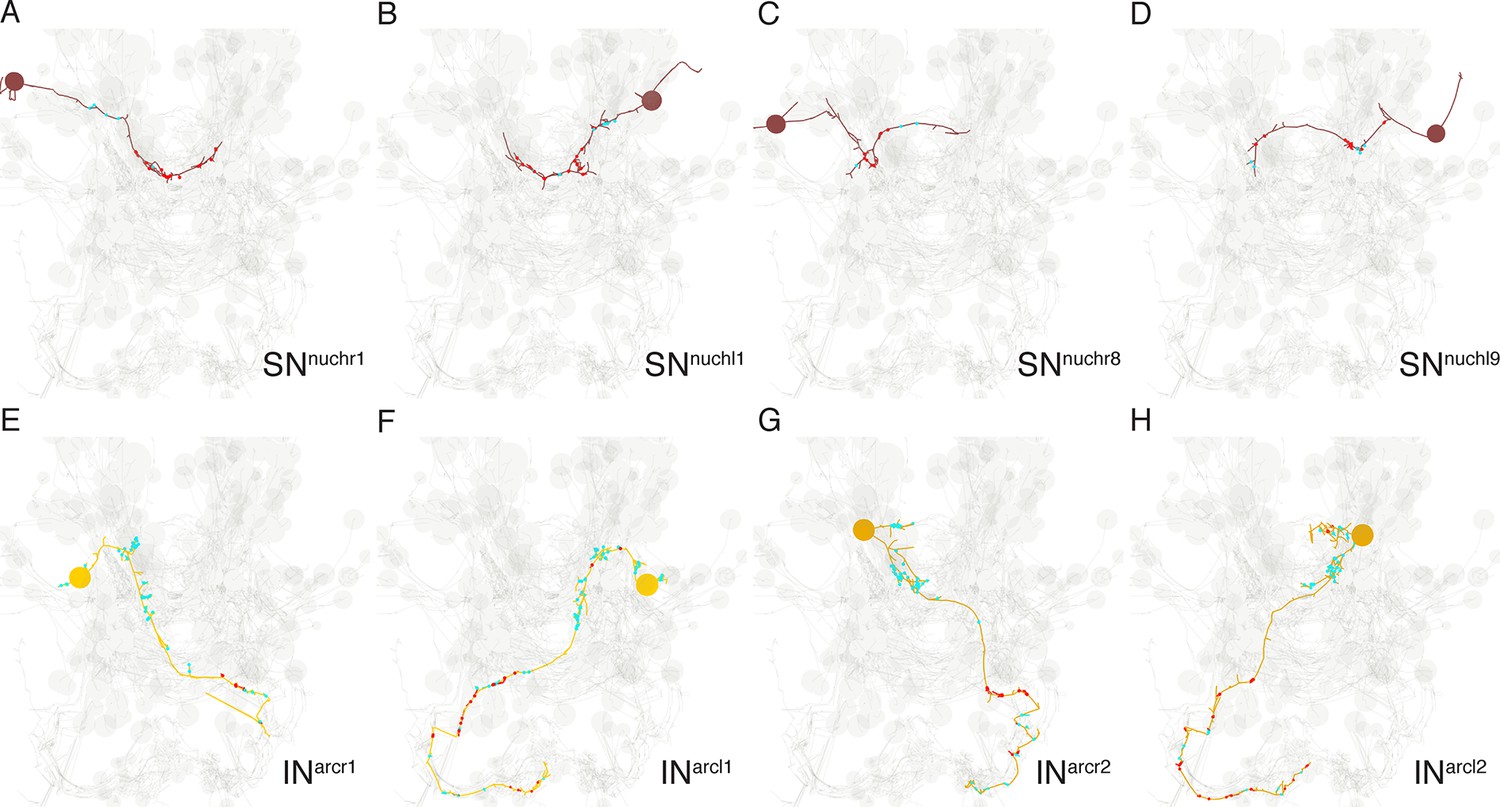
Morphology of SNnuch and INarc neurons.
(A, D) Four examples of SNnuch sensory neurons with the presynaptic (red) and postsynaptic sites shown. (E, H) Morphology of the four INarc interneurons with the presynaptic (red) and postsynaptic sites shown.
Figure 10—figure supplement 2
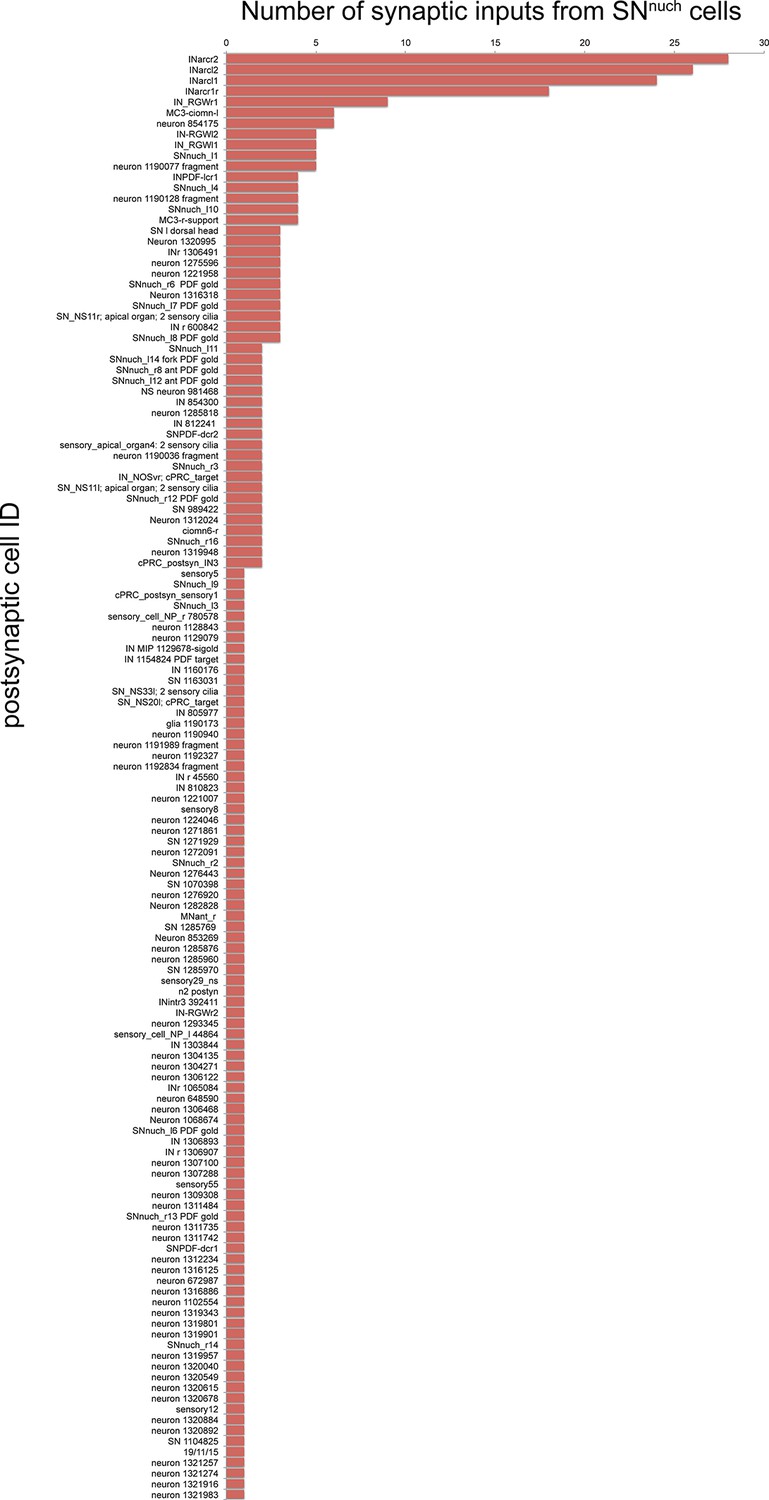
Number of synaptic inputs from SNnuch cells to all postsynaptic targets.
All postsynaptic targets of the SNnuch neurons are listed.
Videos
Video 1
Neuronal arrangements in the ventral nerve cord detected by whole-body IF and image registration.
Ventral view of 72 hpf Platynereis. VNC (grey) of average whole-body reference template stained with acetylated tubulin, generated from scans of 36 individuals. Onto this reference scaffold, we project individual registered immunostaining patterns generated by the different neuropeptide antibodies. In order of appearance: FVa (orange), RGWa (yellow), LEUC (brown), FVRIa (lavender), RYa (forest green), LUQ (magenta), MIP (aqua), ATO (sky blue), FMRFa (lime green), PENK (red), PDF (royal blue).
Video 2
3D view of the 72 hpf HT9-4 larva showing fully-traced peptidergic neurons identified by siGOLD.
Ventral view of the 72 hpf Platynereis siGOLD-tagged peptidergic neurons are shown in the following colors: FVa (orange), RGWa (yellow), LEUC (brown), FVRIa (lavender), RYa (forest green), LUQ (magenta), MIP (aqua), ATO (sky blue), FMRFa (lime green), PENK (red), PDF (royal blue). Other non-labeled traced neurons (grey) provide the outline of the larva.
Video 3
Reconstruction of the nuchal organ.
Reconstruction of the nuchal organ from the dorsal head of the 72 hpf Platynereis larva dataset HT9-4. The nuchal organ consists of three multiciliated cells and 16 sensory cells which project a sensory cilium and branching microvilli into an olfactory pit just below the cuticular layer.
Video 4
Reconstruction of the nuchal organ circuit.
The nuchal organ sensory cells (SNnuch, red) connect to two pairs of INarc interneurons (orange). The adult eye photoreceptors (dark blue) are shown for reference. Several other neurons are shown in pale grey to highlight the shape of the larval nervous system.
Tables
Table 1
List of antibodies used
| NP precursor name | Abbreviation | Antigen |
|---|---|---|
| FMRFamide | FMRFa | (C)FMRFa |
| RYamide | RYa | (C)VFRYa |
| Myoinhibitory peptide/Allatostatin B | MIP | (C)AWNKNSMRVWa or (C)VWa |
| RGWamide | RGWa | (C)RGWa or (C)GWa |
| Proenkephalin | PENK | (C)YGDLSFSNSNYa |
| Luqin | LUQ | (C)WRPQGRFa |
| Allatotropin | ATO | (C)GFRTGAYDRFSHGFa |
| Pigment dispersing factor | (C)NPGTLDAVLDMPDLMSLa | |
| Leucokinin | LEUC | (C)KFTPWAa |
| FVamide | FVa | (C)AHRFVa or (C)FVa |
| FVRIamide | FVRIa | (C)FVRIa |
-
The full name and abbreviation of neuropeptide precursors that contain the neuropeptides used for immunoEM. The FMRFa, RYa, MIP short and long, RGWa, FVa short and long, and FVRIa antibodies have been described previously (Conzelmann and Jékely, 2012; Conzelmann et al., 2011; Conzelmann et al., 2013a; Jékely et al., 2008). All 11 neuropeptides are amidated (a). A Cys (C) was added to the N-terminus of each peptide to allow coupling during immunization and affinity purification. All antibodies were generated in rabbits. For FVa long, a rat antibody was also generated.
Table 2
Number of gold particles in SNnuch neurons in three layers labeled with the PDF antibody.
| Layer | Layer | ||||||
|---|---|---|---|---|---|---|---|
| SNnuch | 703 | 723 | 787 | SNnuch | 703 | 723 | 787 |
| r1 | 0 | 2 | 0 | l1 | 0 | 0 | 0 |
| r2 | 0 | 0 | 0 | l2 | 1 | 0 | 4 |
| r3 | 0 | 0 | 0 | l3 | 0 | 0 | 0 |
| r4 | 0 | 0 | 7 | l4 | 0 | 0 | 0 |
| r5 | 0 | 0 | 0 | l5 | 0 | 0 | 0 |
| r6 | 2 | 0 | 0 | l6 | 0 | 3 | 10 |
| r7 | 0 | 0 | 0 | l7 | 0 | 0 | 2 |
| r8 | 0 | 1 | 2 | l8 | 1 | 0 | 3 |
| r9 | 0 | 0 | 0 | l9 | 0 | 0 | 0 |
| r10 | 0 | 0 | 0 | l10 | 0 | 0 | 0 |
| r11 | 0 | 0 | 0 | l11 | 0 | 0 | 0 |
| r12 | 0 | 3 | 0 | l12 | 6 | 1 | 0 |
| r13 | 1 | 3 | 2 | l13 | 9 | 9 | 6 |
| r14 | 0 | 0 | 0 | l14 | 18 | 0 | 0 |
| r15-r20 | 0 | 0 | 0 | l15 | 0 | 0 | 0 |
-
Number of gold particles in SNnuch neurons identified in three different immunogold layers labeled with the PDF antibody in all SNnuch sensory neurons.
Download links
A two-part list of links to download the article, or parts of the article, in various formats.
Downloads (link to download the article as PDF)
Open citations (links to open the citations from this article in various online reference manager services)
Cite this article (links to download the citations from this article in formats compatible with various reference manager tools)
A serial multiplex immunogold labeling method for identifying peptidergic neurons in connectomes
eLife 4:e11147.
https://doi.org/10.7554/eLife.11147


