P1 interneurons promote a persistent internal state that enhances inter-male aggression in Drosophila
- Janelia Research Campus, Howard Hughes Medical Institute, United States
- California Institute of Technology, United States
- Howard Hughes Medical Institute, California Institute of Technology, United States
Figures
Figure 1 with 3 supplements
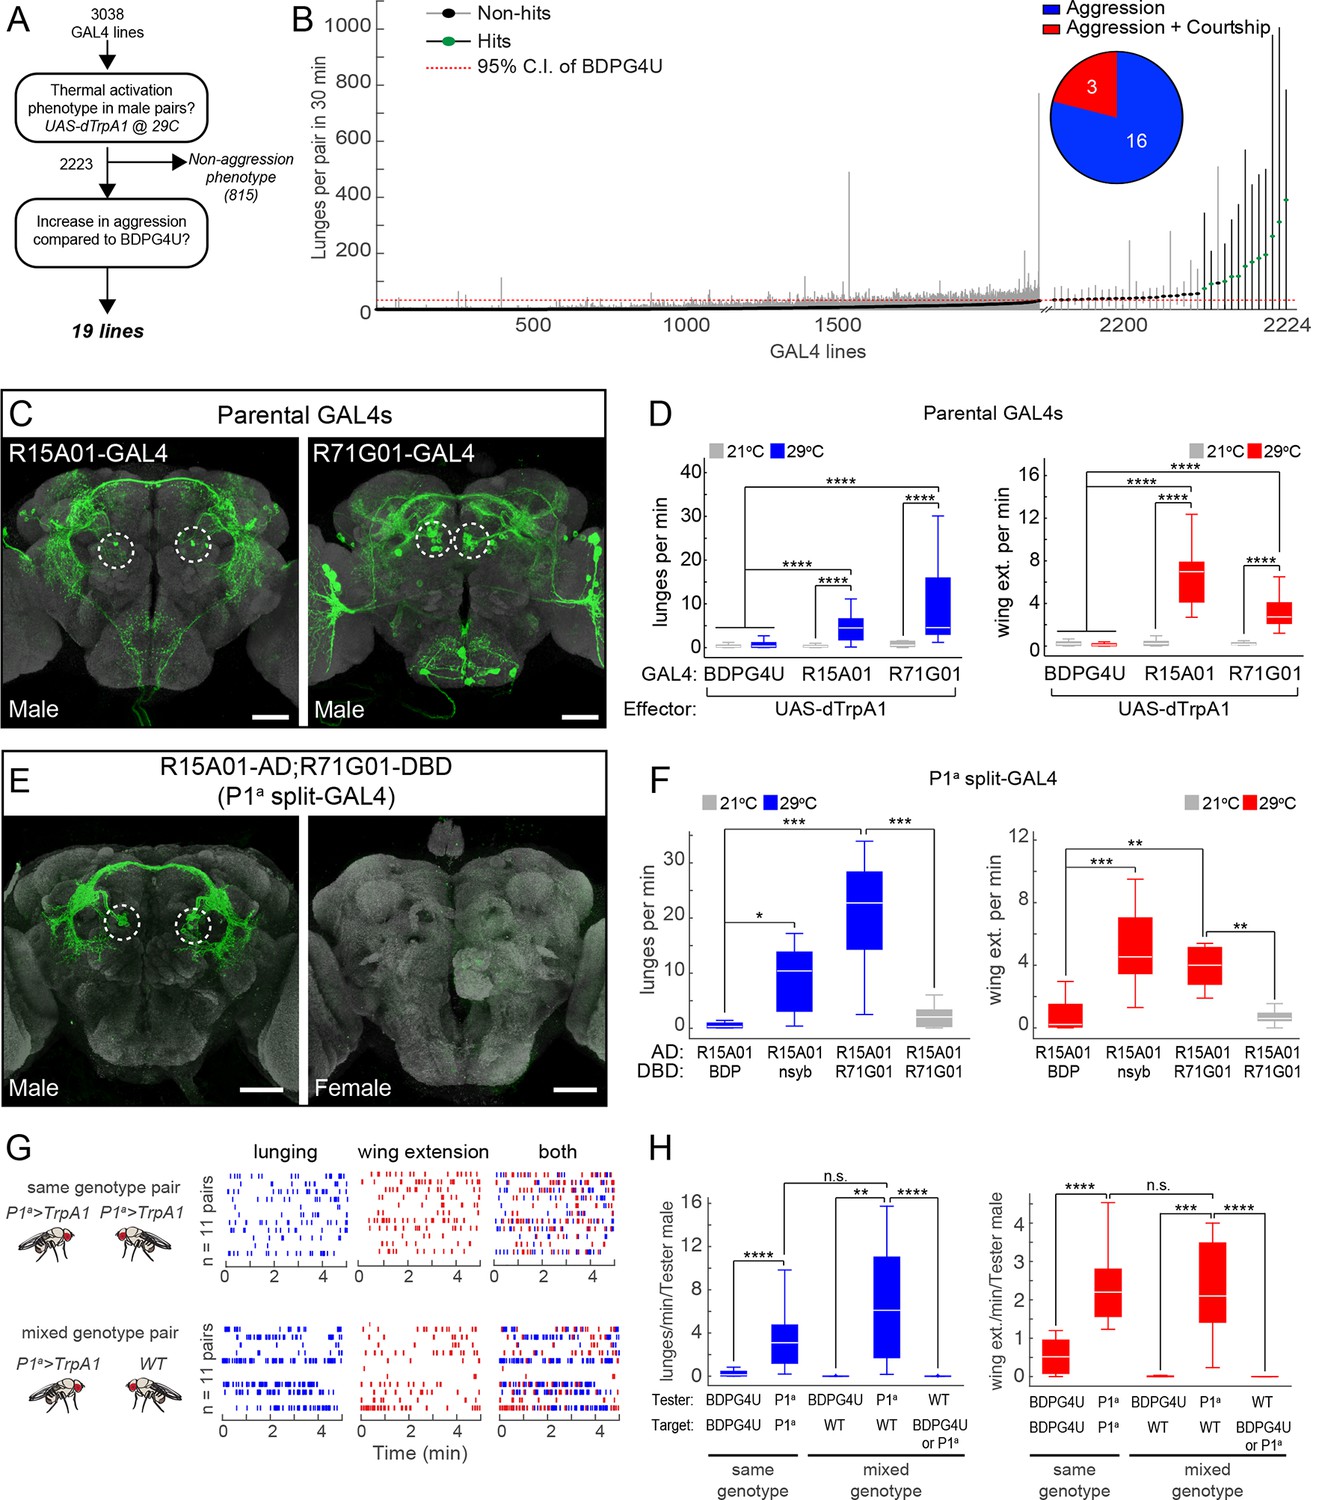
Thermogenetic activation of P1 neurons promotes inter-male aggression and wing extension.
(A) Overview of thermogenetic activation screen to identify GAL4 lines that promote aggression. (B) Lunge frequency across the 2223 GAL4 lines that were analyzed for increased aggression. The GAL4 lines are sorted by median lunge frequency. Dots indicate median lunges per pair in 30 min, and lines represent 1.5 times the interquartile range (IQR). For comparison, the dashed red line shows the upper bound of the 95% bootstrap confidence interval (CI) of the BDPG4U>dTrpA1 control males. The blowup on the right side shows the 35 lines that had a median lunge frequency greater than upper bound of the BDPG4U C.I. Green dots indicate lines that showed a significant elevation in lunging compared to BDPG4U after manual verification of lunge scores; black dots were not significantly different. (Inset) The proportion of hits that show aggression exclusively (blue) and aggression plus unilateral wing extension (red). Statistical tests are described in Materials and methods. n=226 pairs for BDPG4U>dTrpA1 controls; n=12–24 for each GAL4 line. (C) Anatomy of the parental GAL4 lines in the male brain. Confocal images of the central brain for R15A01-GAL4 and R71G01-GAL4. Dashed white circles denote P1 cell bodies. The expression patterns in ventral nerve cord and female nervous system are shown in Figure 1—figure supplement 1A-B. (D) Frequency of lunges (left) and wing extensions (right) per minute by pairs of parental GAL4 males expressing dTrpA1 at 21°C (gray) or 29°C (blue or red bars). Pairs tested at 21°C and 29°C: BDPG4U, n=82 and 47; R15A01-GAL4, n=58 and 34; R71G01-GAL4, n=20 and 29. (E) Anatomy of split-GAL4 (spGAL4) intersection between R15A01-AD and R71G01-DBD (referred to as 'P1a') in the male (left) and female (right) brain. Expression in the VNC is shown in Figure 1—figure supplement 1C, and additional intersections that label P1 neurons are shown in Figure 1—figure supplements 2 and 3 and summarized in Supplementary file 1. (F) Frequency of lunges (left) and wing extensions (right) per min by pairs of males of the indicated spGAL4 combinations with dTrpA1 at 29°C (blue or red bars) or 21°C (gray bars). nsyb refers to a promoter fragment from the n-Synaptobrevin gene that labels the majority of neurons in the brain (R57C10-GAL4; Pfeiffer et al., 2008) and BDP refers to an enhancerless-DBD lines (pBPZpGAL4DBDU; Pfeiffer et al., 2010). n=8–12 pairs. (G) Comparison of lunging and wing extension behaviors by pairs of males of the same genotype (top) or 'mixed genotype' pairs (bottom) in which a BDPG4U>dTrpA1 or P1a>dTrpA1 male was paired with a WT male. All males were group-housed to reduce baseline aggression. Raster plots showing bouts of lunging (left, blue ticks) and wing extension (middle, red ticks) and both (right) at 29°C by P1a>dTrpA1 males towards another P1a>dTrpA1 male or a WT male. Raster plot shows minutes 10–15 of a 30 min assay. (H) Rate of lunging (left) and wing extension (right) per min by the 'Tester' male towards the 'Target' male in same and mixed-genotype pairs (G). Data plotted are from the entire 30 min assay. n=11 for same and mixed-genotype assays. Immunostaining in C and E against GFP is shown in green and neuropil staining with anti-Bruchpilot is shown in light gray. Scale bars in panels C and E are 50 µm. Boxplots (D, F and H) and throughout show the median (white line) flanked by the 25th and 75th percentiles (box) and whiskers showing 1.5 times the IQR. Outliers were excluded from plots for clarity but not from statistical analyses (see Materials and methods). Statistical tests are described in the Materials and methods. P-values were adjusted for multiple comparisons by Bonferroni correction. Here and throughout, *: P<0.05, **: P<0.01, ***: P<0.001 and ****: P<0.0001. Complete genotypes of the flies used in each figure can be found in Supplemental file 2.
Figure 1—figure supplement 1

Anatomical expression of parental GAL4s and P1a split-GAL4.
(A, B) Anatomy of R15A01-GAL4 (A), R71G01-GAL4 (B) parental GAL4 lines in the female and male central brain and ventral nerve cord (VNC). White arrowheads denote P1 neuron cell bodies, and yellow arrowheads denote P1 commissural projections and projections to the lateral protocerebral complex. Insets on the right show antibody staining against FruM (magenta) in P1 cell bodies from male brains of the corresponding GAL4 lines. Filled arrowheads denote FruM-positive neurons and open arrowheads denote FruM-negative neurons. (C) Anatomy of R15A01-AD;R71G01-DBD (P1a spGAL4) in the female and male nervous systems. Arrowheads denote the same as in A with the addition of the cyan arrowheads, which denote the population of 0-4 neurons with cell bodies in the lateral horn (LH) that are labeled in males and females. Insets show FruM antibody staining in P1 neurons (left) and lateral horn (LH) neurons in the male brain. (D) Expression pattern of BDPG4U in the male nervous system. All images of nervous system are confocal Z-stacks of the central brain and ventral nerve cord. Confocal images and immunostaining are the same as in Figure 1C. Scale bars are 50 μm for nervous systems images and 10 μm for insets.
Figure 1—figure supplement 2
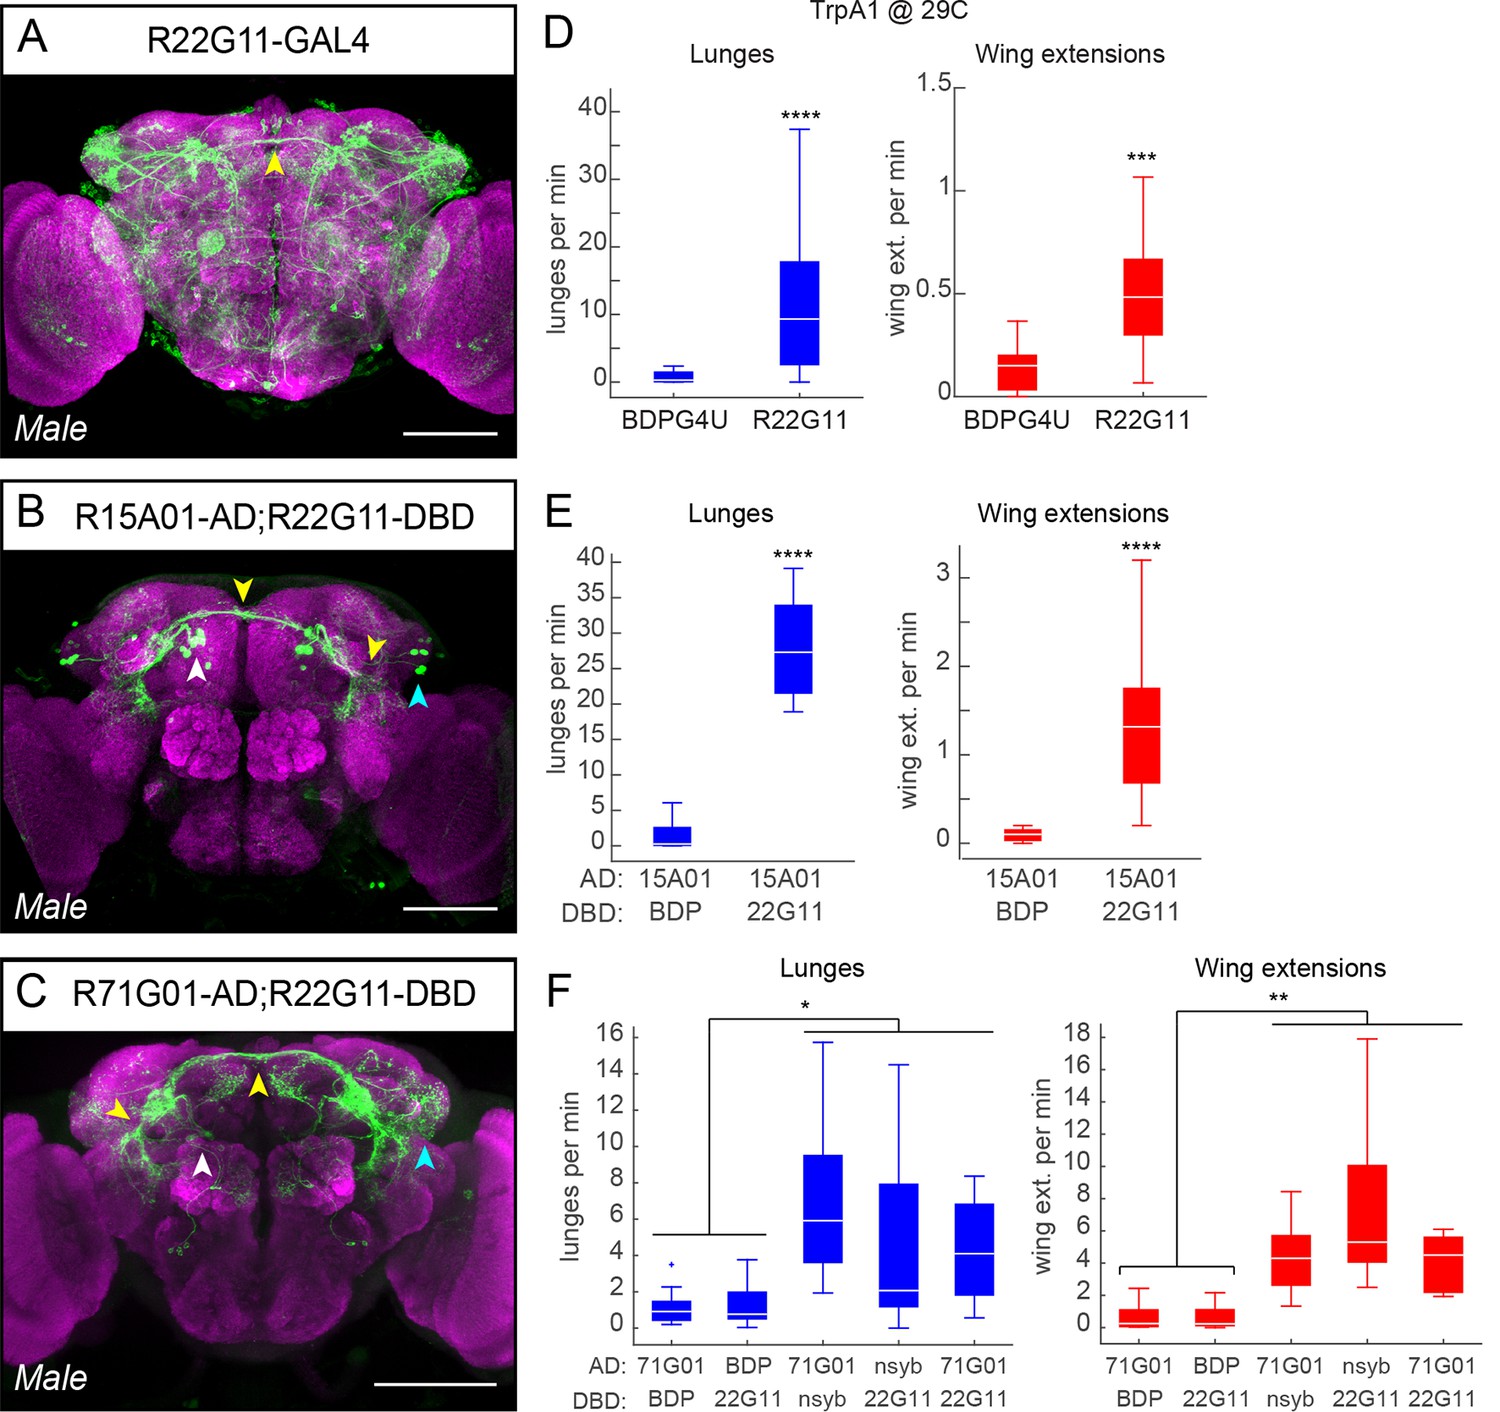
Additional split-GAL4 intersections that target P1 neurons.
(A–C) Anatomical expression of R22G11-GAL4 (A), R15A01-AD;R22G11-DBD spGAL4 (B) and R71G01-AD;R22G11-DBD spGAL4 (C) in the male brain. Image properties are the same as in Figure 1—figure supplement 1C. Scale bars are 100 μm. (D) Number of lunges (blue boxplots) and wing extensions (red boxplots) per pair per min for R22G11-GAL4>dTrpA1 males at 29°C. n=12 for BDPG4U>dTrpA1 and 34 for R22G11-GAL4>dTrpA1. (E) Number of lunges (blue boxplots) and wing extensions (red boxplots) per pair per min for R15A01-AD;R22G11-DBD spGAL4 combinations with dTrpA1 at 29°C. BDP denotes a 'enhancer-less' spGAL4-DBD (see Figure 1F). n=24 pairs per genotype. (F) Number of lunges (blue boxplots) and wing extensions (red boxplots) per minute per pair for R71G01-AD;R22G11-DBD spGAL4 combinations with dTrpA1 at 29°C. nsyb refers the promoter fusion of an enhancer fragment of the n-Synaptobrevin gene (R57C10) driving AD or DBD. Asterisks in panel F are Bonferroni-adjusted P-values.
Figure 1—figure supplement 3
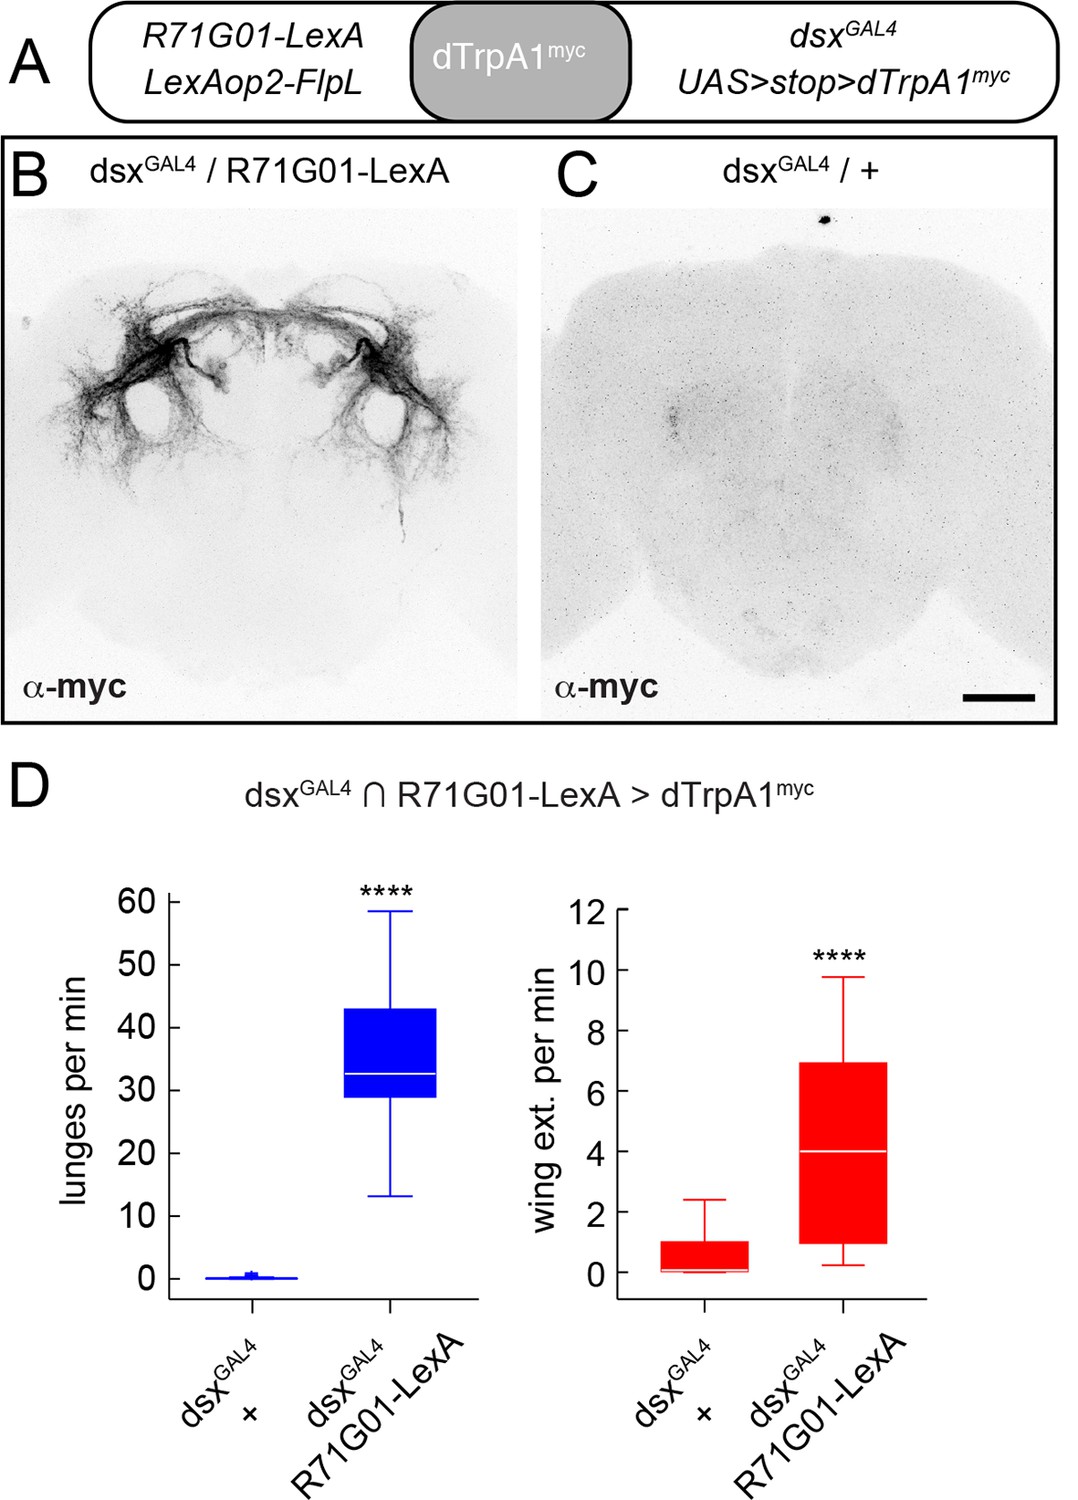
dsx+/R71G01+ P1 neurons drive both aggression and wing extension.
(A) Positve intersection strategy for targeting P1 neurons using R71G01-LexA and dsxGAL4 to drive a Flp-dependent myc-tagged dTrpA1 (UAS>stop>dTrpA1myc; von Philipsborn et al., 2011; Pan et al., 2012) in P1 neurons. (B, C) Confocal images showing immunostaining of dTrpA1myc expression in the brains of UAS>stop>dTrpA1myc/LexAop2-FlpL;dsxGAL4/R71G01-LexA (B) and UAS>stop>dTrpA1myc/LexAop2-FlpL;dsxGAL4/+ (C) males. Scale bar is 50 μm. (D) Lunges (blue boxplots) and wing extensions (red boxplots) per pair per min of indicated genotypes. n=24 pairs per genotype. Asterisks are P-values from Mann-Whitney U-tests.
Figure 2
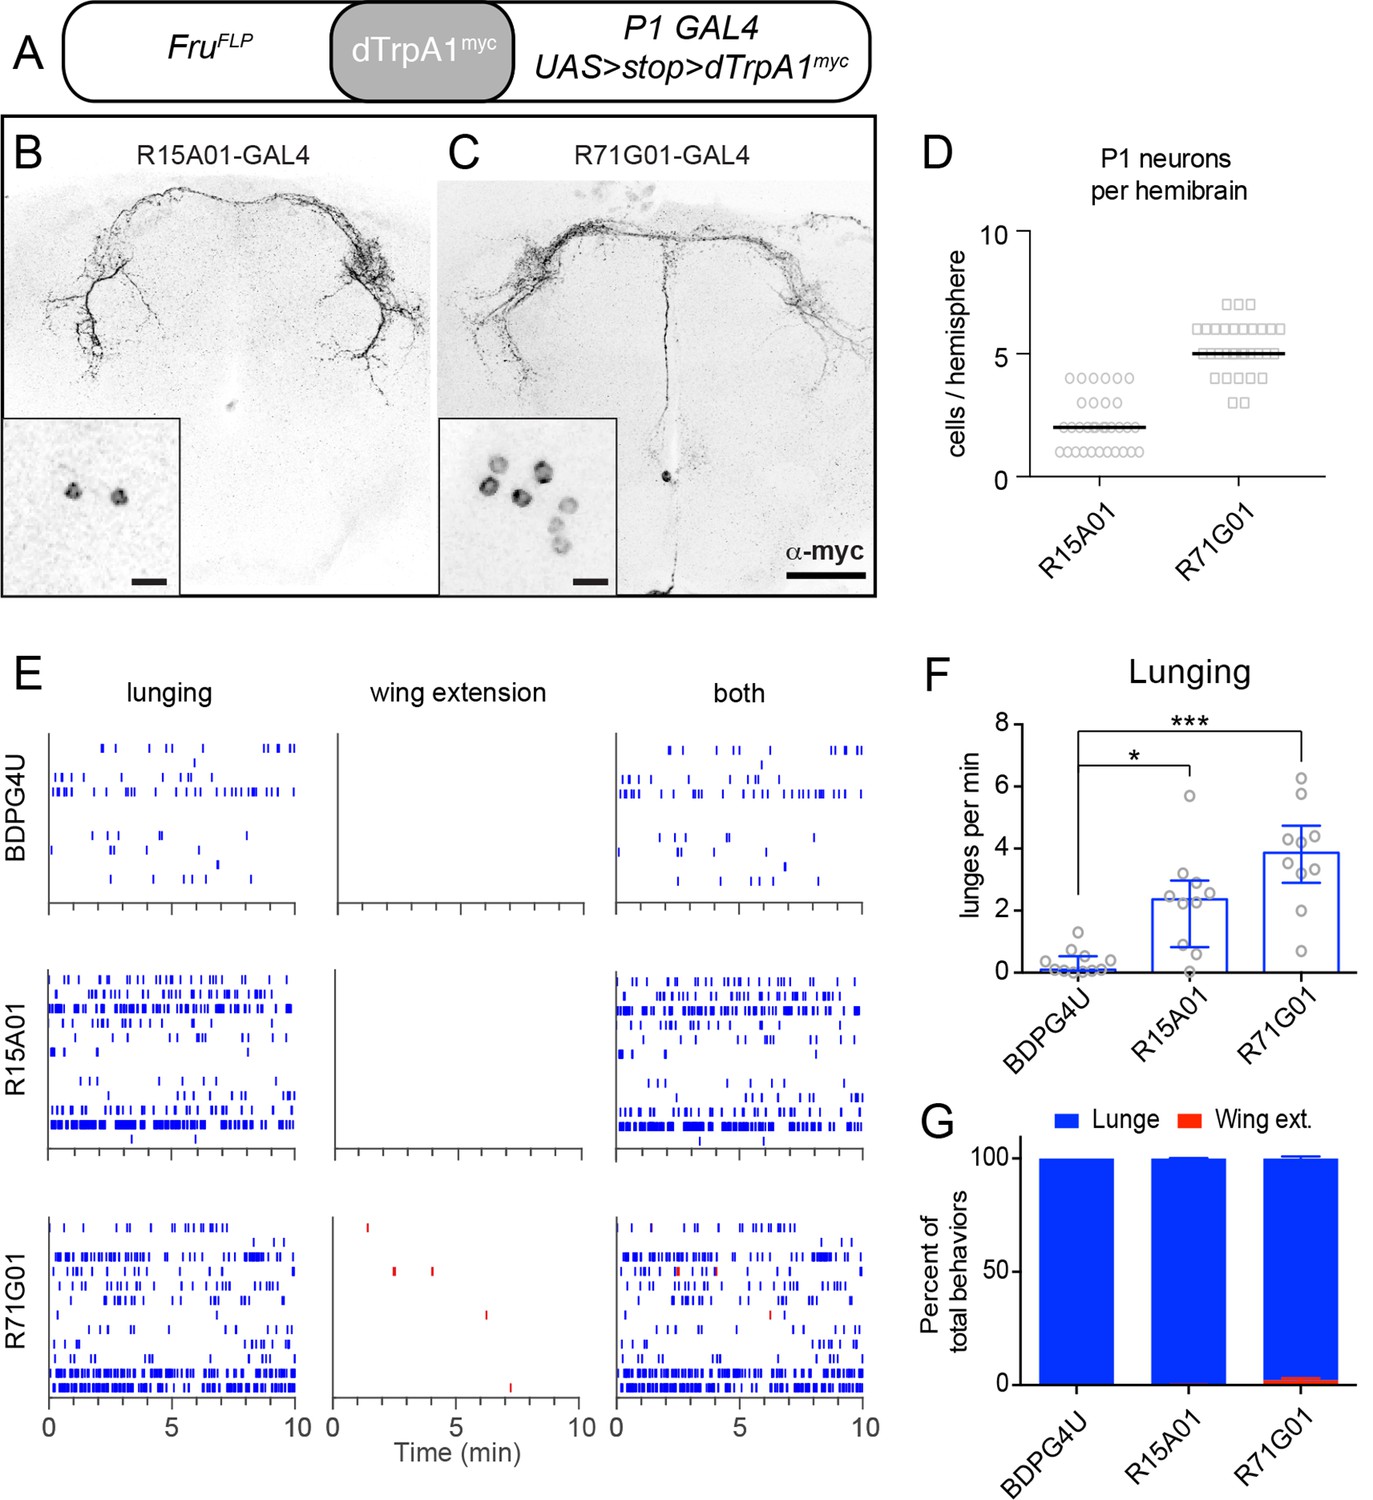
TrpA1 activation of FruM+ subset of P1 neurons in parental GAL4 lines promotes aggression but not wing extension.
(A) Intersectional strategy for targeting FruM+ neurons in the parental GAL4 lines. (B, C), Intersectional expression of dTrpRPA1myc in male brains of R15A01-GAL4 ∩ FruFLP (B) and R71G01-GAL4 ∩ FruFLP (C) flies. Confocal Z-stacks through the anterior brain showing antibody staining against dTrpA1myc of the P1 neuron projections. Insets show high-magnfication views of the P1 neurons labeled in the intersection in one hemisphere of the brain. Scale bars are 50 μm, and 10 μm in the insets. (D) Number of P1 neurons per brain hemisphere labeled with dTrpA1myc in males of R15A01-GAL4 and R71G01-GAL4 intersections with fruFLP. n=16 brains for each. (E) Raster plots of lunging (left), wing extensions (middle) and both (right) in each GAL4 ∩ FruFLP intersection during minutes 10-20 of a 30 min aggression assay. (F) Number of lunges per min by pairs of males of the indicated genotypes at 32°C. (G) Proportion of lunges and wing extensions performed by each fly as a percentage of total behaviors (lunges + wing extensions). Bars are mean ± s.e.m. n=12 pairs per genotype. Asterisks are Bonferroni-corrected P-values.
Figure 3 with 3 supplements
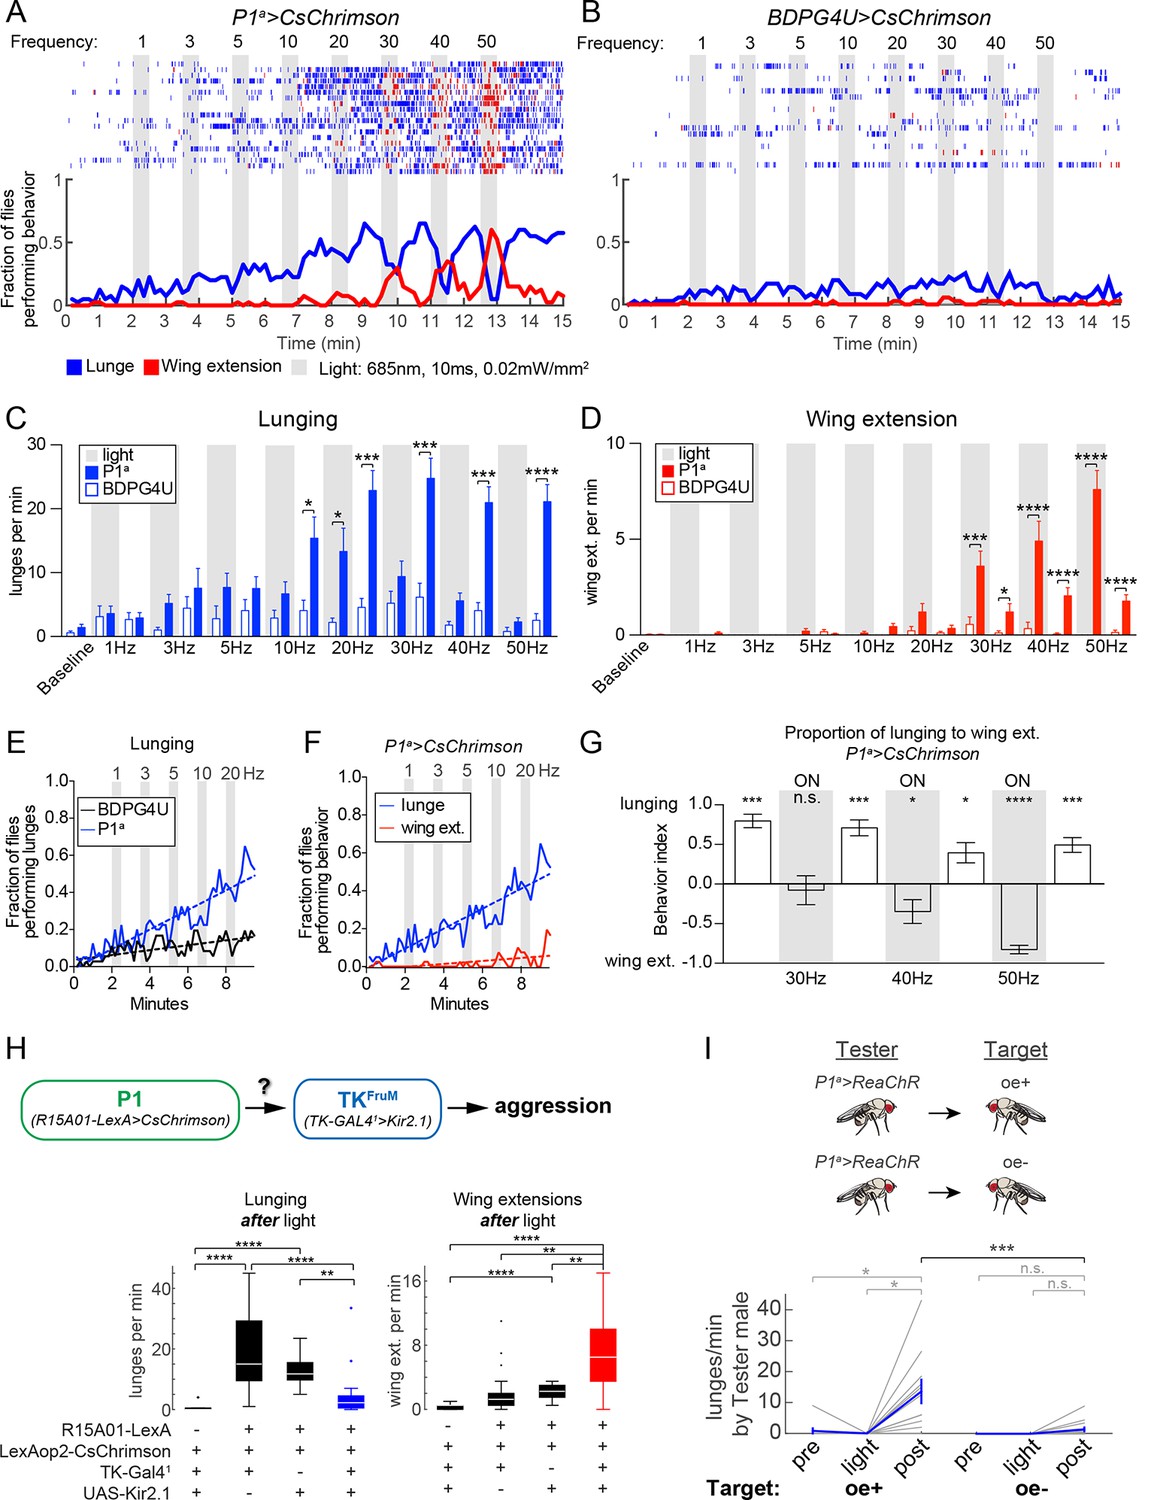
Optogenetic stimulation of P1 neurons acutely suppresses aggression and promotes wing extension.
(A–B) Frequency titration of 685 nm light on pairs of P1a>CsChrimson::venus (A) or BDPG4U>CsChrimson::venus (B) males. Blocks of 30 s photostimulation (PS, gray bars) with increasing stimulation frequency separated by 1 min intervals were sequentially delivered to the males. Top: raster plots showing lunging (blue ticks) and wing extensions (red ticks) by each pair. Bottom: fraction of flies performing lunging or wing extension in 10 s time bins. n=20 pairs for P1a>CsChrimson and 18 pairs for BDPG4U>CsChrimson. Figure 3—figure supplement 1 shows functional imaging of P1 neuronal responses to Chrimson activation over the same range of stimulation frequencies. (C, D) Frequency of lunging (C) and wing extension (D) by P1a>CsChrimson and BDPG4U>CsChrimson male pairs during each stimulation (gray bars) and post-stimulation period. Baseline refers to the 2 min prior to the first PS. Bars are mean ± s.e.m.; asterisks are Dunn’s corrected P-values for between-genotype comparisons. See Figure 3—figure supplement 2A for comparison of P1a>CsChrimson behavior during each interval with pre-stimulation baseline. (E) Fraction of flies performing lunges from baseline to the 30 Hz PS period (0 to 9:30 min) in P1a>CsChrimson and BDPG4U>CsChrimson genotypes (data are from the experiments shown in A & B, blue lines). A linear regression was fit to each curve (see Materials and methods). The slope of both the BDPG4U and P1a linear regressions was significantly different from zero, P<0.0001. The fraction of flies performing lunging was calculated as in (A). (F) Fraction of P1a>CsChrimson males performing lunging (blue; same analysis as in panel (E) reproduced for purposes of comparison) or wing extension (red) over the same period. The slopes of the lines are significantly different (P<0.0001). Data are from the experiment shown in (A), blue and red lines. (G) Proportion of lunges to wing extensions performed by P1a>CsChrimson males from the post-20 Hz through post-50 Hz intervals (8.5–15 min in A). Behavior index = (lunges – wing ext.)/(lunges + wing ext.). Lunging and wing extension rates (bouts per min) for each pair were divided by the maximum lunge and wing extension rates in order to normalize between the two behaviors. Bars are mean ± s.e.m. Asterisks represent significant deviation from zero (Wilcoxon signed-rank test). See also Figure 3—figure supplement 2C-E for velocity of pairs and single males. (H) Epistasis experiment between P1 and TKFruM neurons. Top: Schematic of experimental genotypes. P1a>CsChrimson was used to activate P1 neurons while silencing TKFruM neurons with TK-GAL41>UAS::eGFP-Kir2.1. Bottom: Lunge (left) and wing extension (right) frequency per pair after PS with continuous 627nm light at 0.2 mW/mm2 for 30 s. n=14–22 pairs per genotype; asterisks are Bonferroni-adjusted P-values. See also Figure 3—figure supplement 3 for raster plots and quantification of behavior during PS. (I) Lunging by photostimulated P1a>ReaChR males ('Tester') towards 'Target' males with intact (oe+) or ablated (oe-) oenocytes. All males were group-housed to reduce baseline aggression. PS was 1 min of 530 nm light (10 Hz, 20 ms pulse-width, 0.2 mW/mm2). Pairs were allowed to interact for 1 min prior to PS ('Pre') and 2 min after PS ('Post'). Gray lines are individual pairs and bold lines are mean ± s.e.m. Asterisks in gray are within genotype comparison and asterisks in black are between genotype comparisons. n=11 pairs (oe+) and 16 pairs (oe-).
Figure 3—figure supplement 1
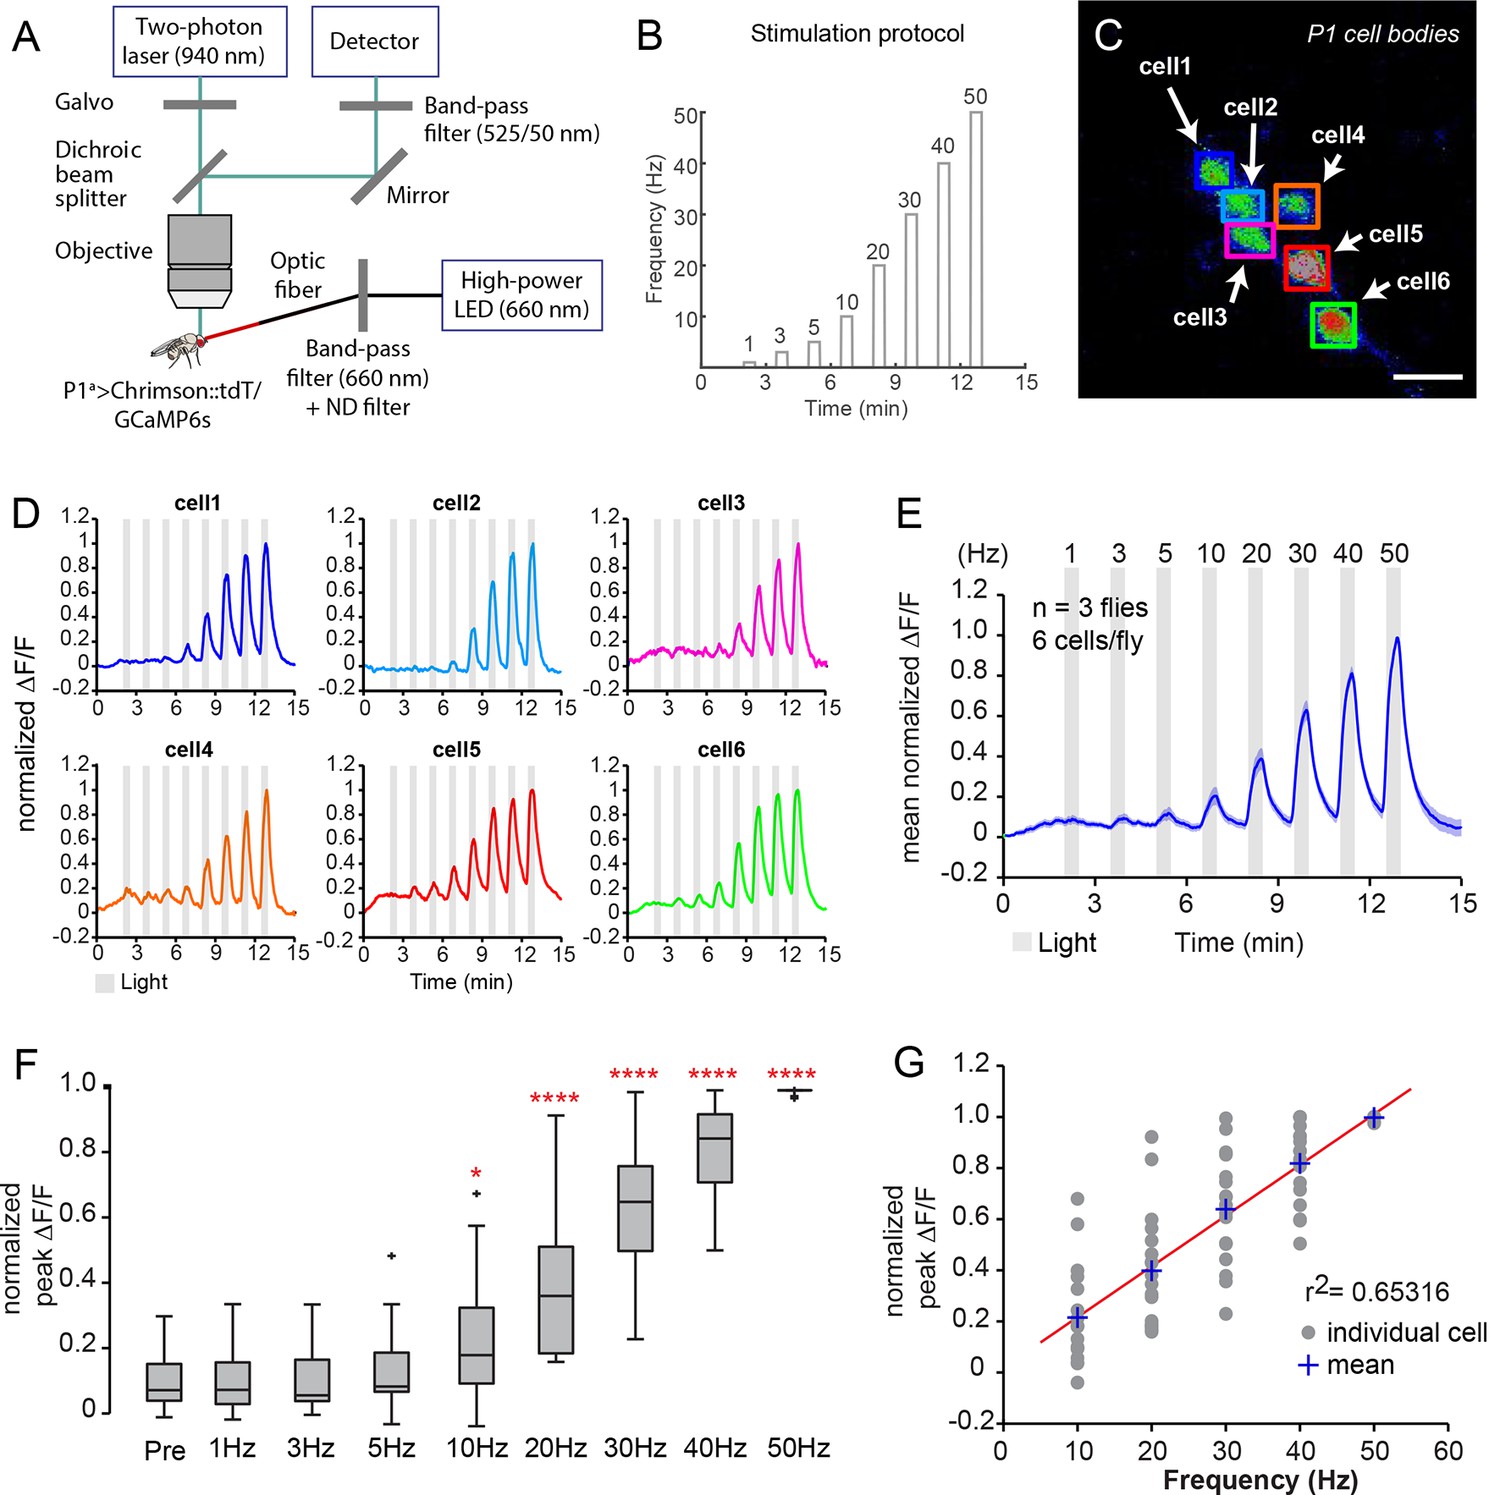
Functional imaging of P1 neuronal responses to optogenetic activation.
(A, B) Experimental setup of calcium imaging experiments. See Materials and methods for details. (A) Calcium responses of P1 neurons to Chrimson activation were recorded with a two-photon laser scanning microscope in an open-cuticle preparation. Males co-expressed Chrimson::tdT and GcAMP6s in P1 neurons using the P1a split-GAL4 driver. (B) Photoactivation with 660 nm light was done with the same stimulation frequencies used in Figure 3. (C) Maximum intensity projection of calcium response in P1 neuron cell bodies during 50 Hz photostimulation (PS). Scale bar is 10 μm. (D) Calcium responses of the individual P1 neurons shown in (C). The fluorescence change compared to baseline (∆F/F) was normalized by dividing each trace by its maximum ∆F/F. (E) Mean GCaMP6s response of all P1 neurons imaged (n=18 neurons). The dark blue line shows the average normalized ∆F/F and light blue shading is the s.e.m. (F) Peak normalized ∆F/F responses at each PS frequency. Values were normalized for each cell as in (D). Asterisks are Bonferroni-adjusted P-values comparing each condition to pre-PS baseline ('Pre'). (G) Linear regression fit (red line) to the normalized peak ∆F/F response of P1 neurons at each PS frequency.
Figure 3—figure supplement 2
Photoactivation of P1a>CsChrimson flies.
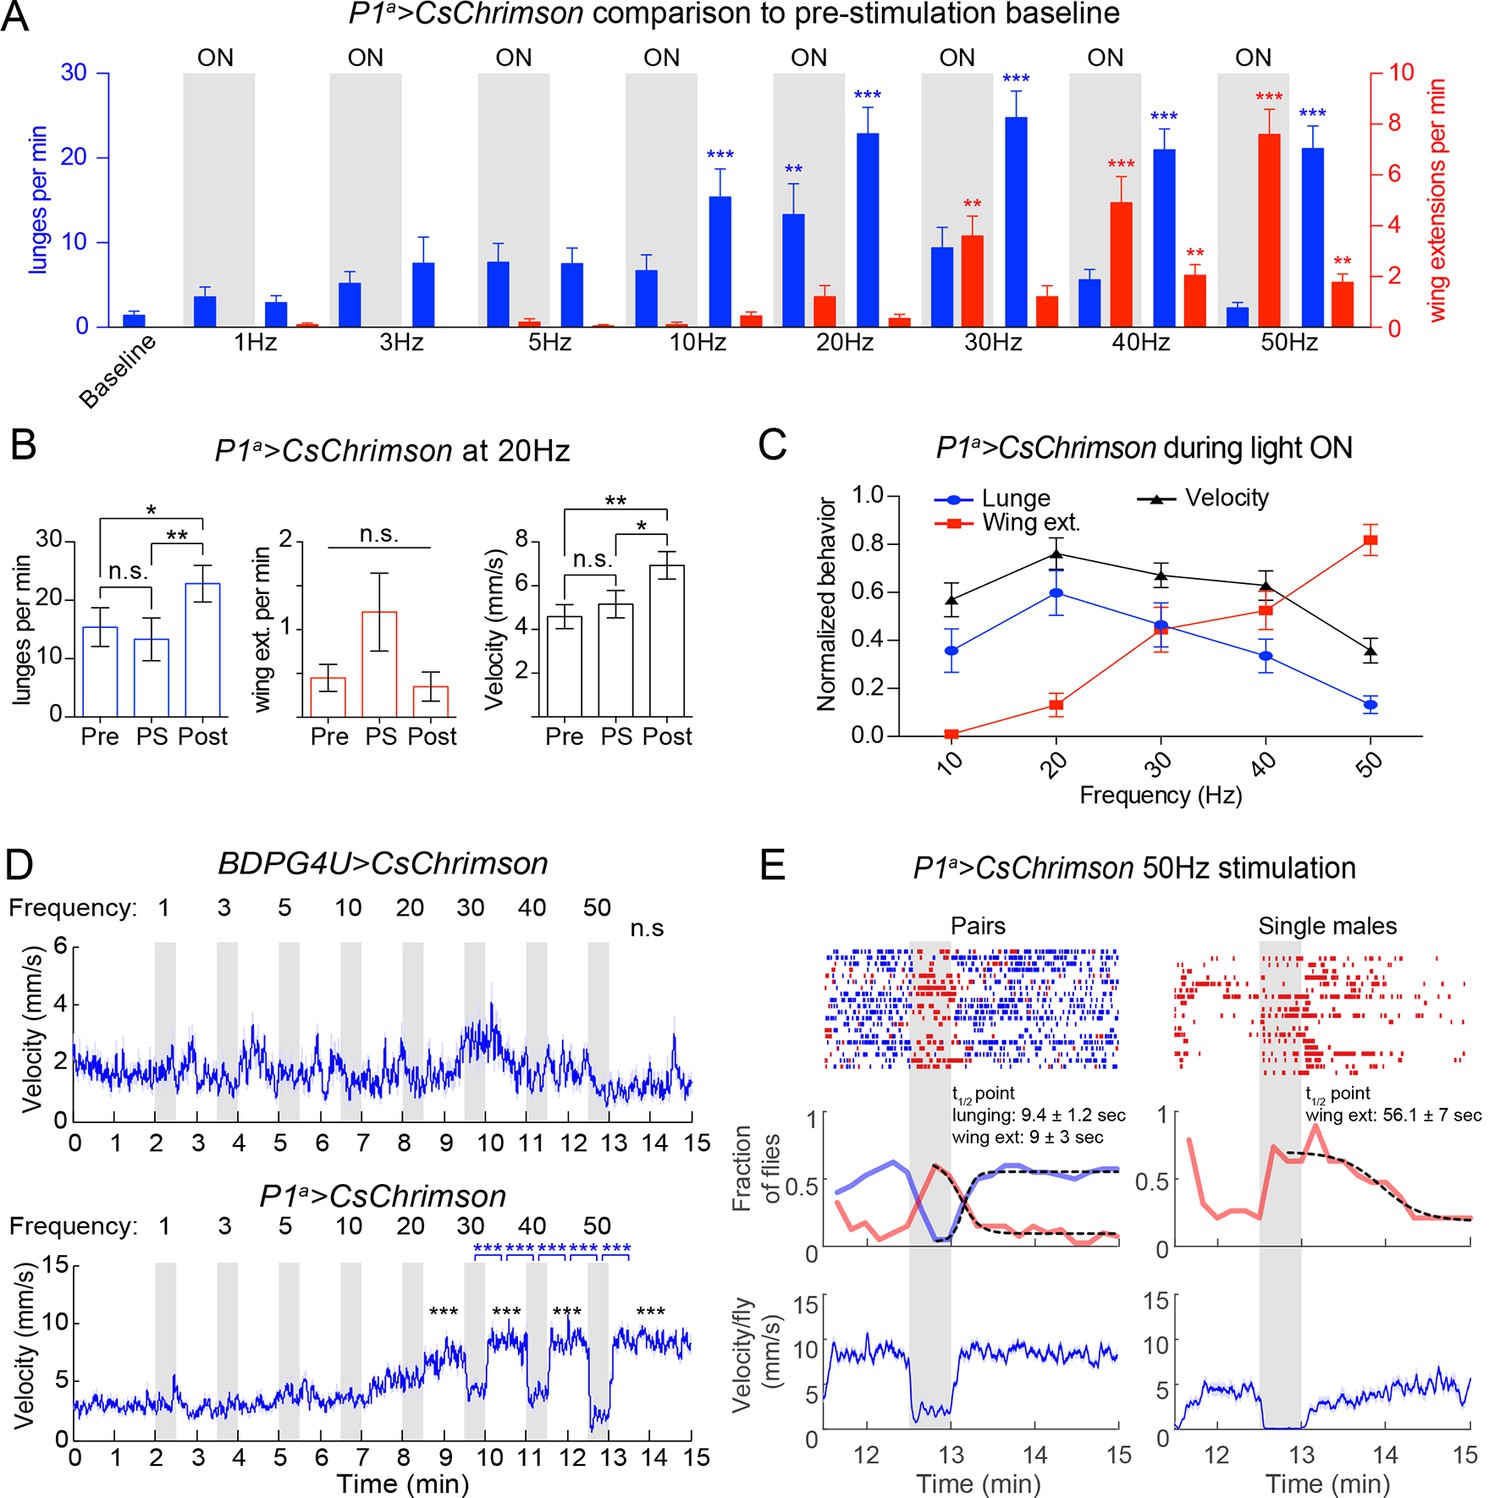
(A) Comparison of P1a>CsChrimson lunges (blue bars) and wing extensions (red bars) per min at different PS frequencies with pre-stimulation baseline levels. Data are replotted from experiments shown in Figure 3A. Asterisks are Mann-Whitney U-tests with Dunn’s correction. (B) Behavior of P1a>CsChrimson pairs in the interval before ('Pre'), during ('PS') and after ('Post') PS with 20 Hz light in the experiment shown in Figure 3A. (C) Normalized behavior per pair during intervals of PS with 10–50 Hz (light ON). Wing extension (red) shows a significant increase between 10 Hz–50 Hz (P=0.001, Friedman’s test), while both lunging (blue) and mean velocity (black) show a significant decrease from 20 Hz–50 Hz (P=0.001 for lunging and P=0.0006 for velocity, Friedman’s test). Data for each pair were normalized by dividing the bouts per min or mean velocity at each time interval by the maximum value of the pair across PS intervals from 10–50 Hz. (D) Mean velocity per fly during frequency titration experiments shown in Figures 3A and B. Dark blue line is the smoothed mean velocity (window = 1 s) and light blue shading is the s.e.m. Two statistical comparisons of the mean velocity per fly at each interval are shown: (1) comparison between each interval and baseline ('Baseline vs.'; black asterisks); and (2) between each consecutive interval of light ON and light OFF ('ON vs. OFF'; blue asterisks). Asterisks are P-values adjusted by Dunn’s test. (E) Comparison of pairs (left) and single males (right) at 50 Hz stimulation interval from the frequency titration experiment shown in 3A. Single males were run in parallel using the same PS protocol. Top: raster plots of lunging and wing extension. Middle: Fraction of flies performing each behavior in 10 s time bins (thick blue and red lines). A sigmoidal function was fit to the data (dashed black lines) and the time point of half maximal response (t1/2) was calculated for each curve. Bottom: Smoothed mean velocity per male (window = 1 s). Statistics and curve fitting is described in Materials and methods. Plots in A, B and C show mean ± s.e.m.
Figure 3—figure supplement 3
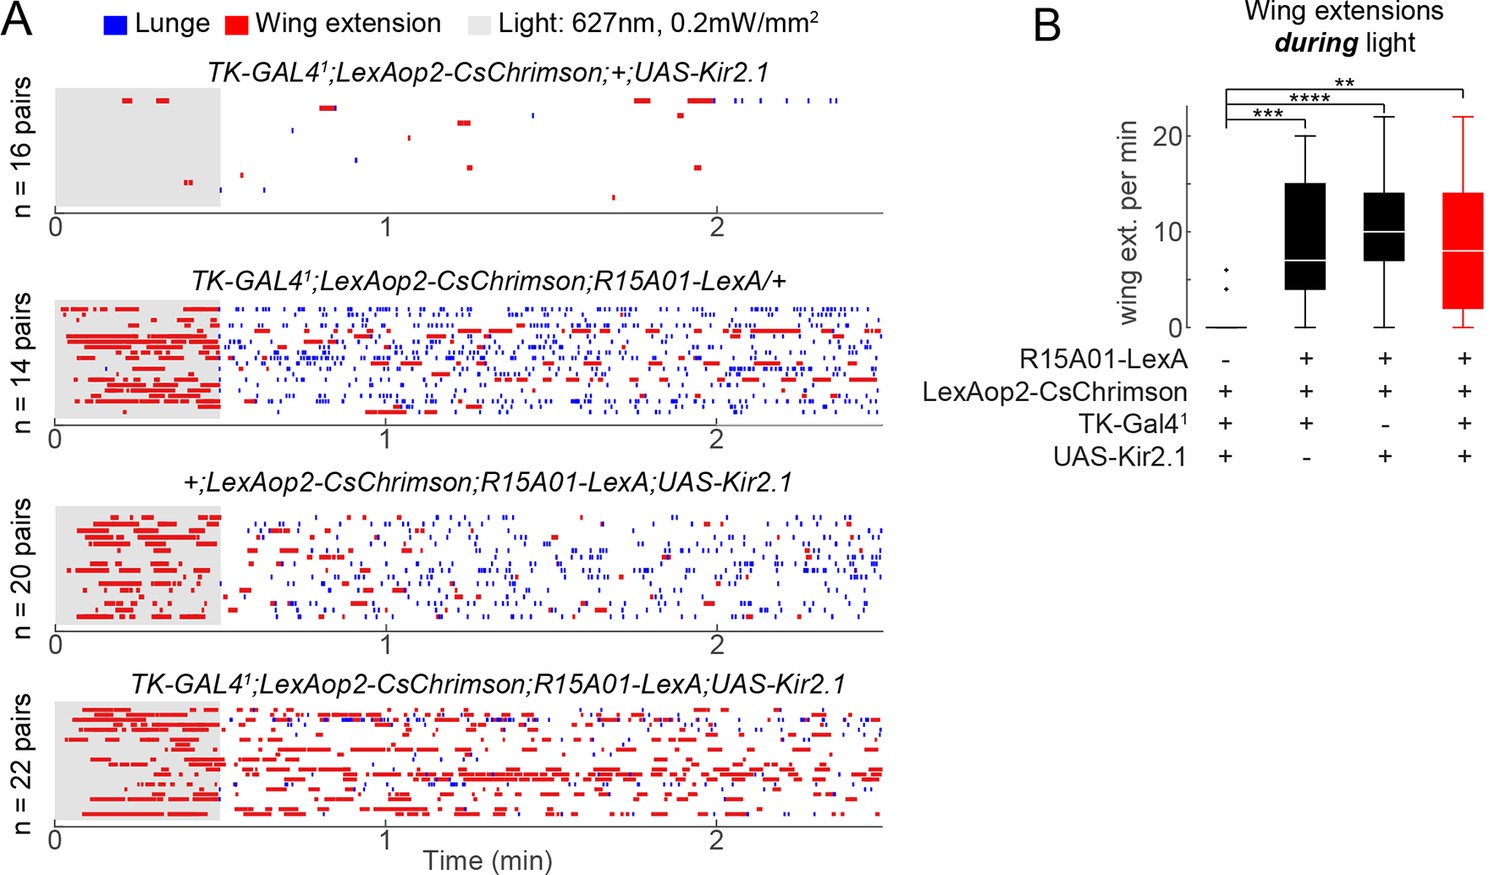
Effect of silencing TKFruM neurons on behavioral phenotype of P1 neuron optogenetic activation.
(A) Plots in these panels are from the P1/TKFruM epistasis experiment shown in Figure 3H. Raster plots show lunging and wing extension for each genotype tested; genotypes and number of pairs tested are noted on each raster plot. (B) Number of wing extensions per min during PS. Askterisks are Bonferroni-corrected P-values.
Figure 4 with 1 supplement

Transient activation of P1 neurons induces persistent aggression.
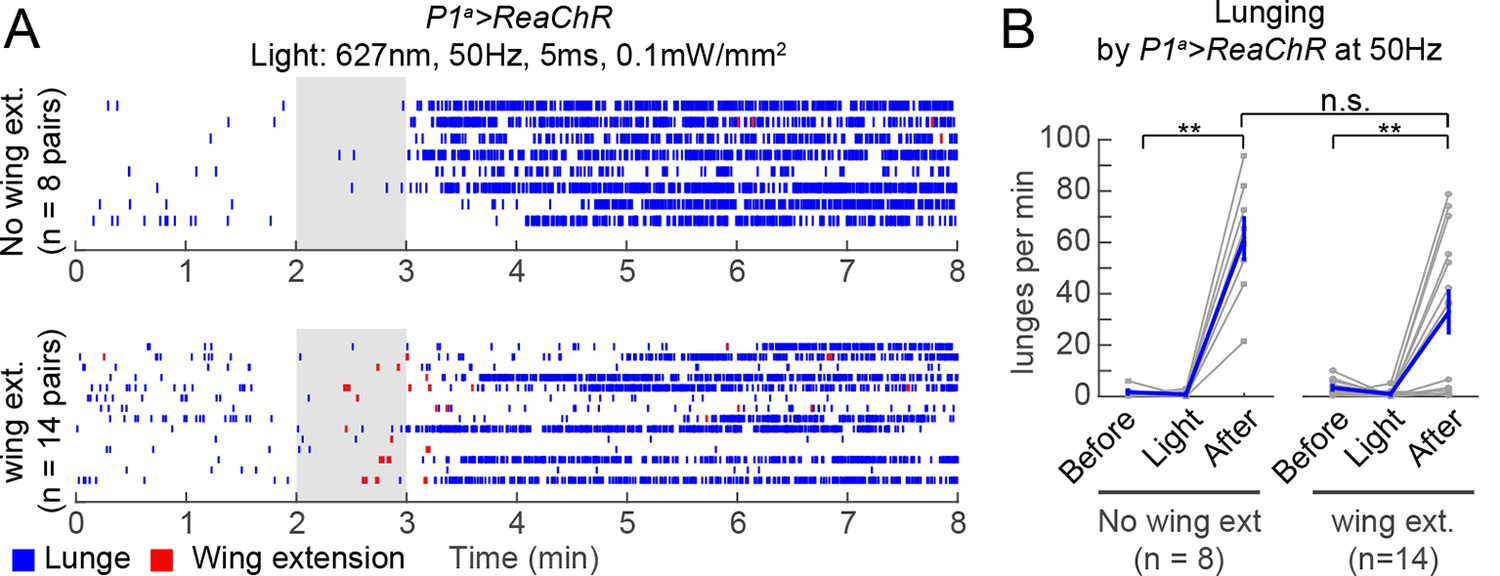
(A) Activation of P1a spGAL4 with UAS-ReaChR. Pairs of males were photostimulated for 1 min with 530 nm light (30 Hz, 5 ms pulse-width, 0.25 mW/mm2). Plot properties are the same as in Figure 3A. (B, C) Lunges (B) and wing extensions (C) per minute performed by P1a>ReaChR and BDPG4U>ReaChR males in the period before ('pre'), during ('light') and after ('post') photostimulation (shown in A). Gray lines are individual pairs and bold lines are mean ± s.e.m. Asterisks in gray are within genotype comparisons and asterisks in black are between genotype comparisons. n=15–16 pairs per genotype. (D) P1a>ReaChR males stimulated more weakly than in (A) (627 nm, 50 Hz, 5 ms pulse-width, 0.1 mW/mm2) for 60 s. (E, F) Lunges (E) and wing extensions per minute (F) performed by P1a>ReaChR and BDPG4U>ReaChR males in the PS conditions shown in (D). See also Figure 4—figure supplement 1 for lunging in the cohort of males that exhibited no wing extensions prior to the onset of fighting. Plot properties and statistics are the same as in B and C. n=8 pairs for BDPG4U and n= 22 for P1a.
Figure 4—figure supplement 1
Wing extension is not necessary for persistent post-PS aggression.
(A) Raster plots relate to photostimulation experiment of P1a>ReaChR pairs with 627 nm light at 50 Hz that is shown in Figure 4D−F. Since there was a small but significant increase in wing extension by P1a>ReaChR males during PS compared to baseline (see Figure 4F), we separated the fly pairs into those that show no wing extension behavior prior to increased lunging (top) and those that did (bottom). In both cases, persistent aggression is seen following PS offset. (B) Number of lunges per min by pairs of P1a>ReaChR males from the groups shown in (A). In both groups, there was still a significant increase in lunging after PS compared to before or during PS, and there was no difference in the number of lunges per min after PS between groups (P=0.06, Mann-Whitney U-test). Asterisks are Bonferroni-corrected P-values.
Figure 5 with 1 supplement
P1 activation induces a persistent state that is fly intrinsic.
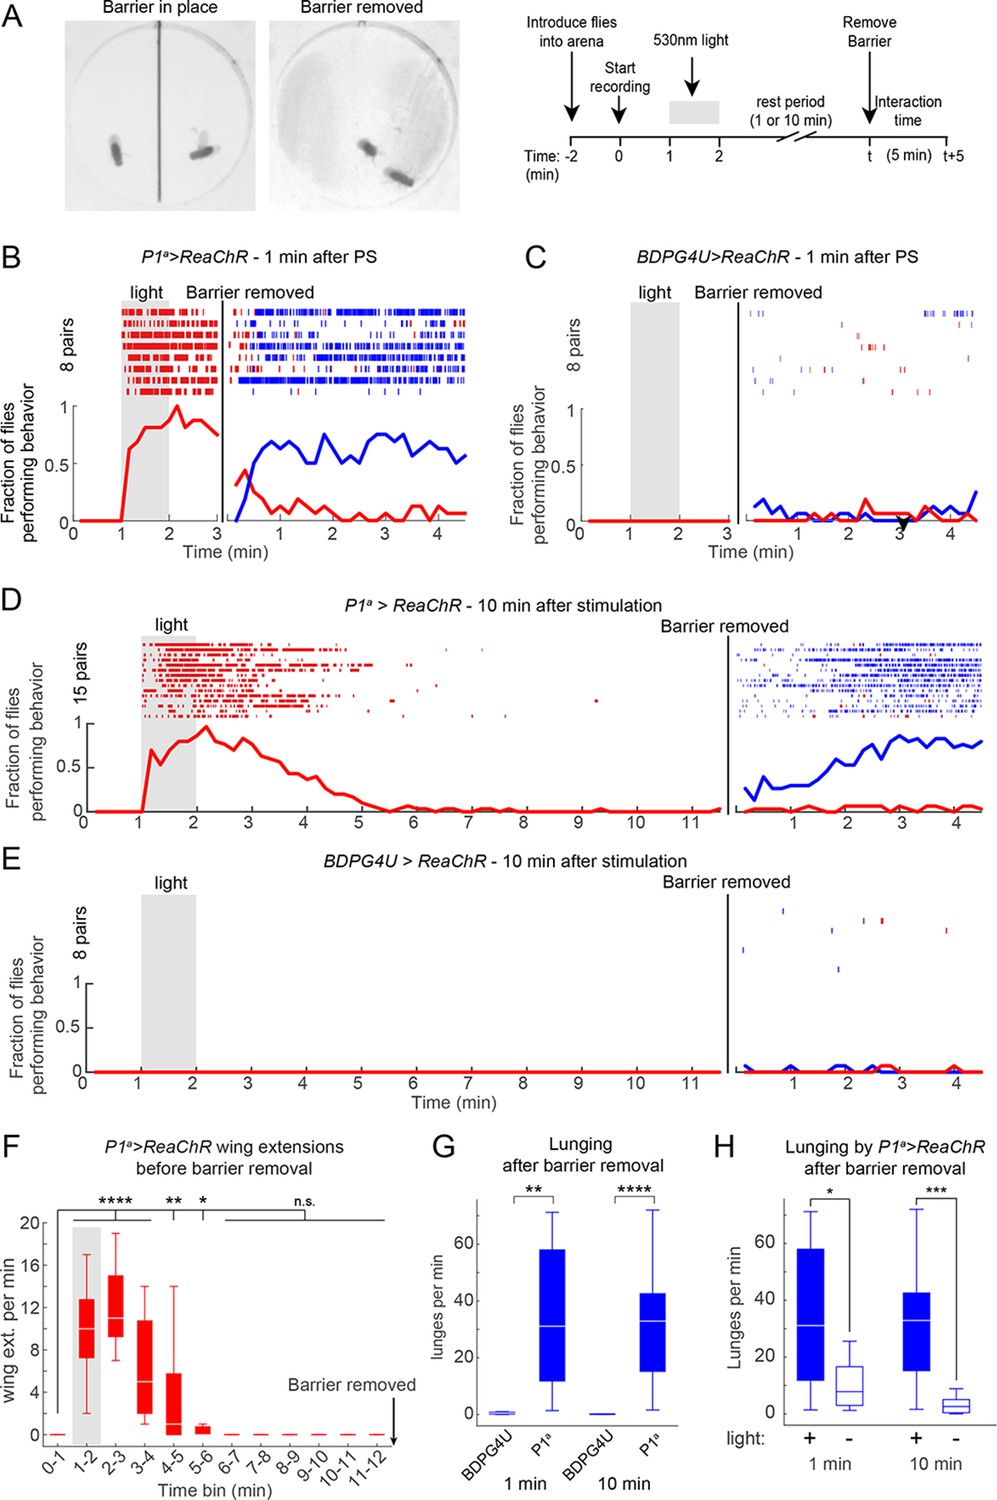
(A, B) Assay and experimental design used to separate optogenetic activation from social interaction. Males were placed on opposite sides of a removable opaque barrier (left; experimental design on right). After acclimation to the arena, a 1 min PS with 530 nm light (10 Hz, 20 ms pulse-width, 0.2 mW/mm2) was delivered to the separated males. The barrier was removed 1 or 10 min after the end of PS and male interactions were recorded for 5 min. (B–C) Behavior of P1a>ReaChR (B) and BDPGU>ReaChR (C) males when the barrier was removed 1 min after PS (barrier removal is represented by the black line). (D, E) Behavior of P1a>ReaChR (D) and BDPG4U>ReaChR (E) males when the barrier was removed 10 min after the end of PS. Velocity of P1a>ReaChR males before the barrier removal is shown in Figure 5—figure supplement 1C. (F) Wing extensions per minute performed by separated P1a>ReaChR males in the 10 min time period before barrier removal in the experiment shown in (D). (G) Lunges per minute performed by pairs of the indicated genotypes after the barrier was removed. Latency to increased aggression is shown in Figure 5—figure supplement 1D−E. (H) Comparison of lunges per minute after barrier removal for P1a>ReaChR pairs with or without photostimulation. Asterisks are Bonferroni-adjusted P-values.
Figure 5—figure supplement 1

Persistent aggression after optogenetic activation of P1 neurons.
(A) Raster plot of lunging and wing extension by P1a>ReaChR male towards a WT male ('mixed genotype pair'). Both males were group-housed to reduce baseline aggression. Flies were photostimulated with 530 nm light for 1 min and recorded for 10 min after PS. (B) Rate of lunging per min by 'Tester' male towards 'Target' male after PS for same and mixed-genotype pairs. Data for same genotype pairs are replotted from Figure 4A for comparison purposes. (C) Velocity of separated P1a>ReaChR males prior to barrier removal in the experiment shown in Figure 5D. Left: Smoothed mean velocity (blue line; window = 1 s) ± s.e.m. (light blue shading) of individual males. Right: Data were binned in 1 min time intervals. Asterisks represent statistical comparisons to the pre-stimulation time bin (0–1 min). (D) Latency to first lunge after barrier was removed either 1 or 10 min after PS offset. Data are from experiments shown in Figures 5B−E. 'Con' = BDPG4U>CsChrimson. (E) Latency to reach maximal aggression by P1a>CsChrimson males after barrier removal 1 or 10 min after PS offset. A sigmoidal function (dashed black lines) was fit to the fraction of flies lunging (10 s time bins; thick blue and light blue lines). The time point of half-maximal response (t1/2 point) was calculated from the sigmoidal function. See Materials and methods for description of curve fitting. Asterisks are Bonferroni-adjusted P-values.
Figure 6
Models for how P1 neurons may regulate courtship and aggression.
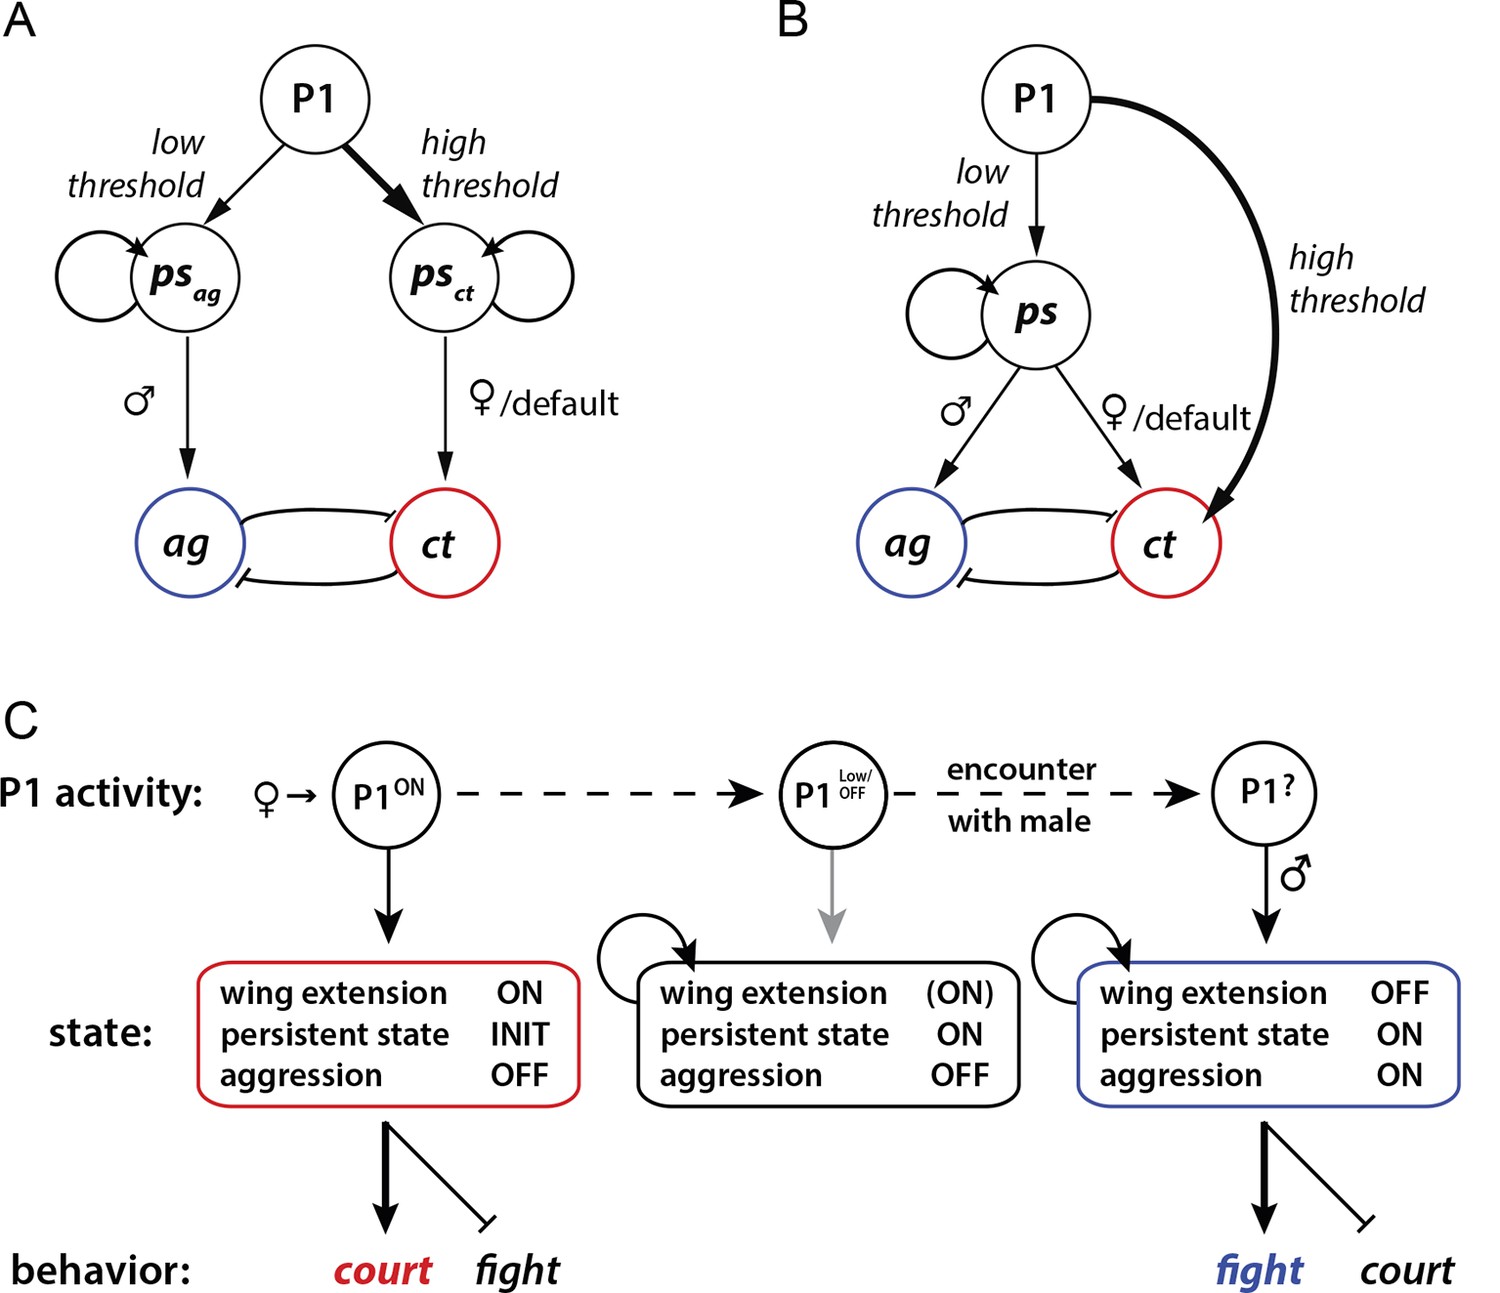
(A, B) Alternative models for how P1 neurons influence aggression ('ag') vs. courtship ('ct')-promoting circuitry. (A) 'Direct' model. P1 neurons exert parallel and independent influences on downstream circuits that promote persistent internal states specific to aggression ('psag') or courtship ('psct'), at low and high thresholds, respectively. These influences may be exerted by common or distinct subpopulations of P1 neurons (not illustrated). Following the offset of phasic P1 activation, the persistent aggression state drives overt fighting behavior in the presence of a male conspecific. In the absence of a male (or presence of a female), persistent courtship behavior is expressed. Reciprocal inhibition between aggression and courtship circuitry is posited to occur at some point downstream of P1 neurons (blunt arrows), although if the P1 population is heterogeneous it could occur within that population as well (not shown). (B) 'Indirect' model. Activation of P1 neurons at a relatively low level triggers a persistent internal state ('ps') that is neutral with respect to aggression vs. courtship. This state can facilitate either social behavior, depending upon the sex of the conspecific encountered. A parallel, high-threshold pathway that directly activates command modules for courtship song (von Philipsborn et al., 2011) is included to account for the effect of acute optogenetic activation of P1 neurons to trigger stimulus-locked wing extension behavior (Inagaki et al., 2013; Bath et al., 2014). (C) State diagram illustrating how male social behavior may be regulated by P1 neuron activity. P1ON denotes activation of P1 neurons by a female. Following disengagement from courtship, the persistent internal state triggered by P1 activation is maintained (middle box). A subsequent encounter with a male leads to aggression (right box). P1 neurons may be activated by some male-specific cues, but more weakly than by female cues (Kohatsu et al., 2011).
Videos
Video 1
dTrpA1 activation of R15A01-GAL4.
Pairs of R15A01>dTrpA1 males at 29°C exhibit interspersed bouts of aggression (lunging) and courtship (unilateral wing extension).
Video 2
P1a>dTrpA1 behavioral phenotype.
Pairs of P1a>dTrpA1 males at 29°C exhibit interspersed bouts of aggression and wing extension. Note that wing extensions occurring before lunging as shown in this clip is not the invariant sequence of the behaviors (see Figure 1G).
Video 3
Activation of P1 neurons induces aggression between wingless males.
Pair of P1a>dTrpA1 males at 29°C with wings removed still show aggression.
Video 4
P1a>CsChrimson phenotype in pairs of males during strong photostimulation.
Pairs of P1a>CsChrimson males at the onset of 50 Hz PS (see Figure 3) show a rapid suppression of aggression and locomotion and an increase in wing extensions. At the offset of the PS, males switch back to aggression.
Video 5
P1a>ReaChR males interacting following barrier removal 10 min after photostimulation.
Males were stimulated as described in Figure 5A.
Additional files
-
Supplementary file 1
Genetic intersections used to target P1 neurons.
- https://doi.org/10.7554/eLife.11346.022
-
Supplementary file 2
Full genotypes of flies in each experiment.
- https://doi.org/10.7554/eLife.11346.023
-
Supplementary file 3
Training datasets and performance of JAABA classifiers.
(A) The videos and genotypes of flies used to train the lunging and wing extension classifiers. The total number of bouts of each behavior, along with the total number of frames scored as positive or negative for the behavior are shown. (B) Performance of the classifiers against an independent set of 'ground-truth' videos. The framewise error rates and performance of the classifiers was calculated from a set of between 4,000 and 32,000 frames of manually scored ground-truth labels (total frames and total bouts). Frames were labeled as 'Important' if there was no uncertainty about the behavioral label to distinguish them from frames where the human scorer was unsure of the label. For each classifier the error rates, precision and recall for ‘important’ vs. all frames is shown. See Materials and methods for detailed description of ground-truth validation.
- https://doi.org/10.7554/eLife.11346.024
Download links
A two-part list of links to download the article, or parts of the article, in various formats.
Downloads (link to download the article as PDF)
Open citations (links to open the citations from this article in various online reference manager services)
Cite this article (links to download the citations from this article in formats compatible with various reference manager tools)
P1 interneurons promote a persistent internal state that enhances inter-male aggression in Drosophila
eLife 4:e11346.
https://doi.org/10.7554/eLife.11346


