An essential role of acetylcholine-glutamate synergy at habenular synapses in nicotine dependence
- Max Delbrück Center for Molecular Medicine, Germany
- The Rockefeller University, United States
- Charité - Universitätsmedizin Berlin, Germany
Figures
Figure 1
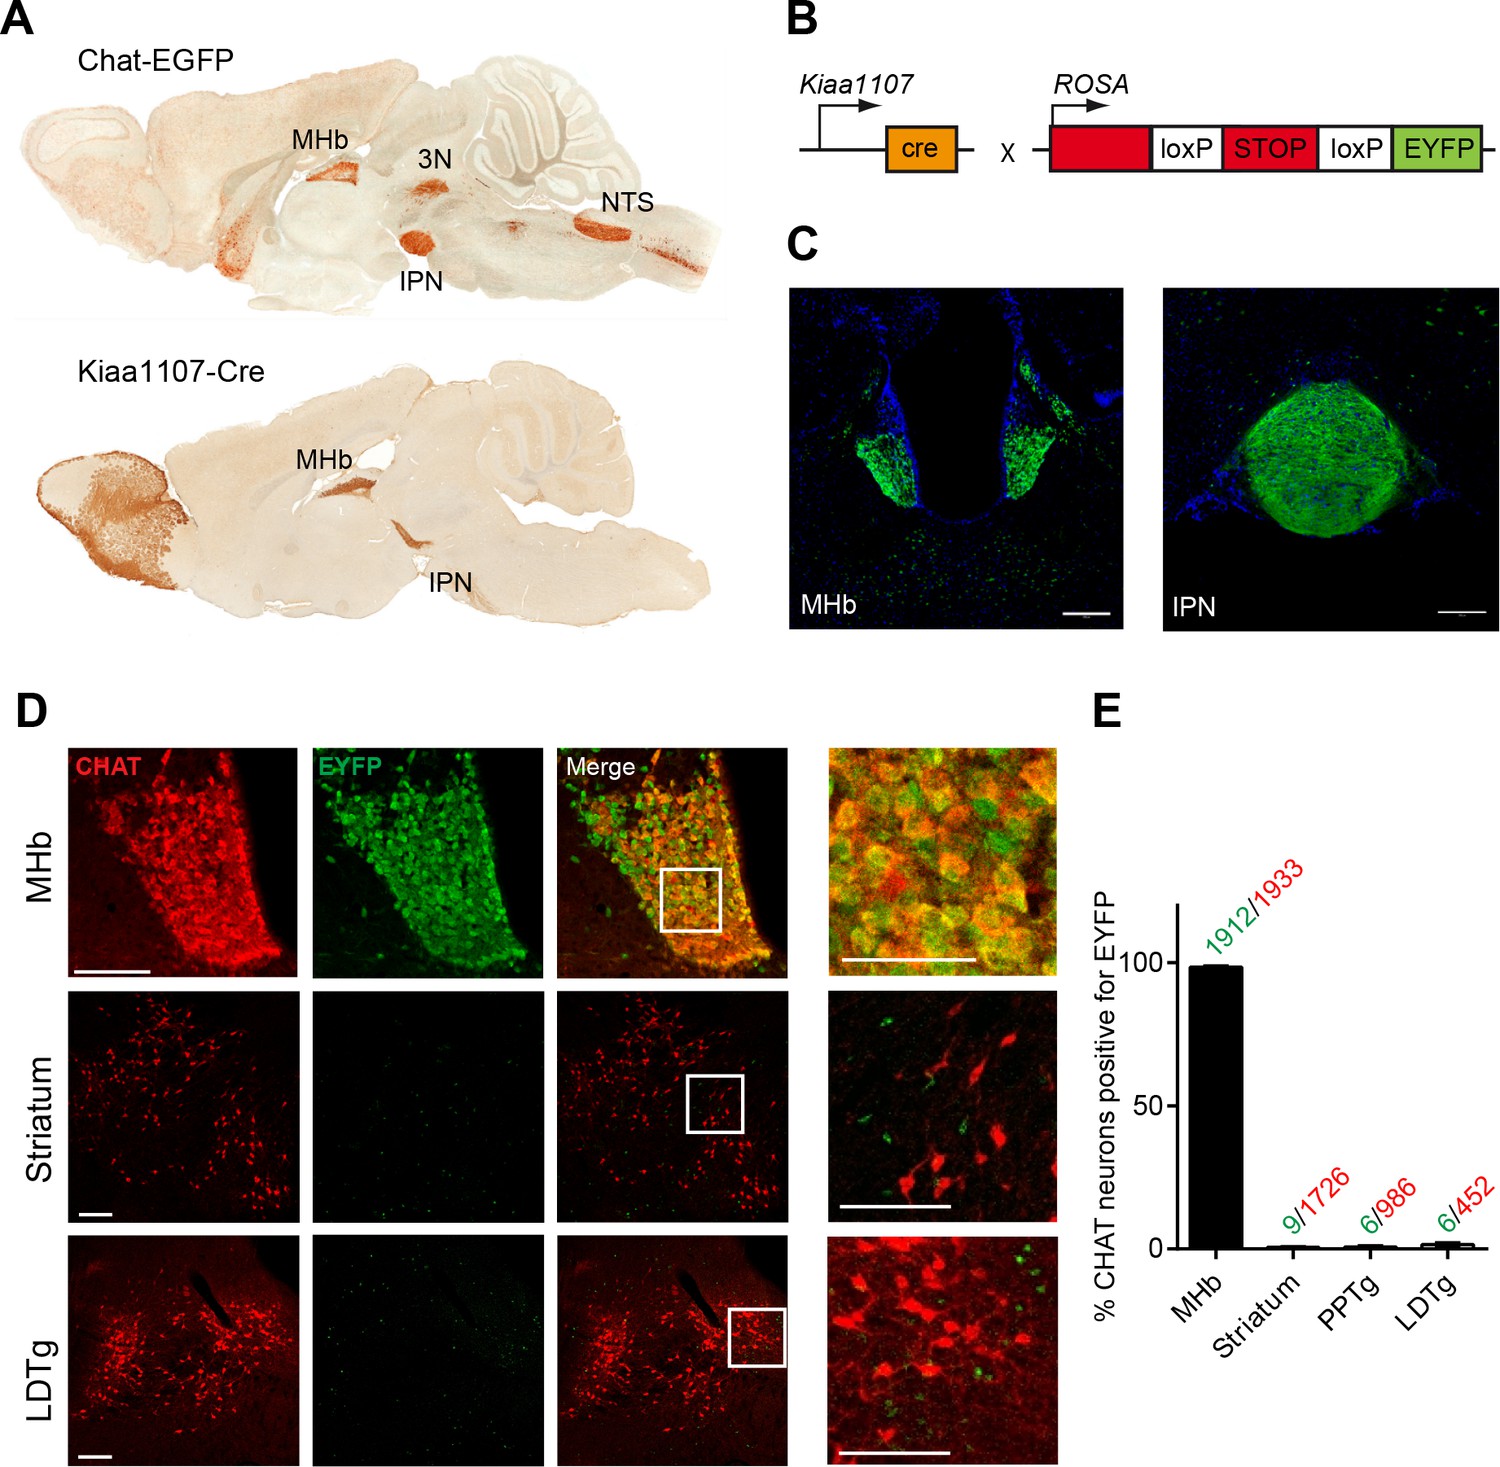
Analysis of the Cre driver line Kiaa1107-Cre in cholinergic neurons.
(A) Sagittal images from GENSAT corresponding to mouse BAC transgenic lines: Chat-EGFP founder GH293 and Kiaa1107-Cre founder KJ227. Chat-EGFP mice show EGFP expression in cholinergic areas including MHb, habenular projections to the interpeduncular nucleus (IPN), the laterodorsal tegmentum (LDTg), third cranial nerve (3N), basal forebrain (BF), and nucleus of the solitary tract (NTS). Kiaa1107-Cre mice show Cre-recombinase expression in the MHb and axonal projections in the IPN. (B) Mouse breeding scheme of the Cre-recombinase Kiaa1107-Cre transgenic line crossed with the Cre-dependent reporter line Gt(ROSA)26Sortm1(EYFP)Cos to visualize Cre-recombinase activity. (C) Cre-dependent EYFP-expression driven by Kiaa1107-Cre was observed in the ventral two-thirds of the MHb and in the axonal habenular projections to the central IPN. Scale bars: 200 µm. (D) Double immunostaining analyses with CHAT (red) and EYFP (green) antibodies in cholinergic brain areas of Kiaa1107-Cre crossed to Gt(ROSA)26Sortm1(EYFP)Cos mice. High magnifications of the indicated square areas are shown on the right column. Neurons in the ventral part of the MHb are double positive, while CHAT and EYFP label different cells in striatum and LDTg. Scale bars: MHb 100 µm, inset 50 µm and striatum, LDTg 200 µm, insets 100 µm. (E) Quantification of CHAT positive neurons expressing EYFP in MHb, striatum and tegmental cholinergic areas (LDTg, laterodorsal tegmentum; PPTg, pedunculopontine nucleus). The number of double positive cells per brain area is indicated above each bar (n=8 to 16 sections from three different mice). MHb: Medial habenula.
Figure 2
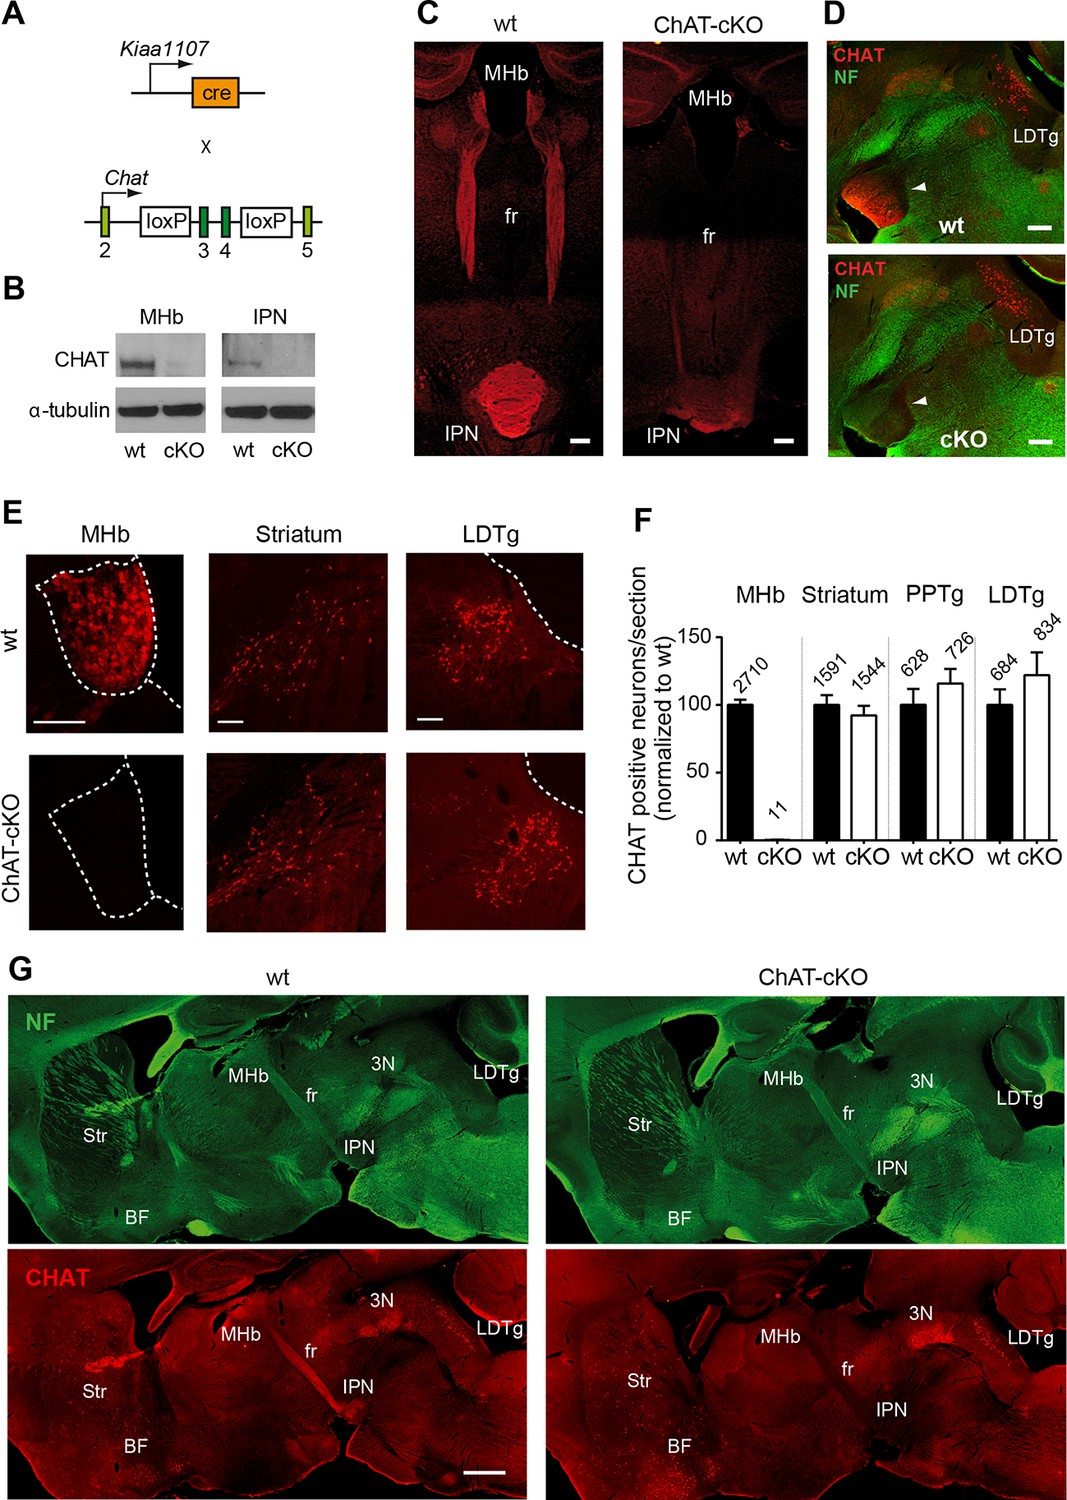
Conditional gene deletion of Chat in cholinergic neurons of the MHb.
(A) Mouse breeding scheme of the Cre-recombinase Kiaa1107 line crossed to Chatflox/flox mice to generate ChAT-cKO mice with conditional gene deletion of Chat in habenular neurons. (B) Western blot analysis with CHAT and α-tubulin antibodies in MHb and IPN extracts from wt and ChAT-cKO mouse brains. (C) Angled sections of the midbrain immunostained for CHAT (red). In wt mice (left panel), CHAT is highly expressed in MHb neurons, along their axons in the fasciculus retroflexus (fr) and in their axonal terminals in the IPN. In ChAT-cKO mice (right panel), CHAT immunoreactivity is no longer detected in the MHb-fr-IPN tract. Scale bars: 300 µm. (D) Sagittal sections of the midbrain immunostained for CHAT (red) and neurofilament (green). CHAT immunoreactivity is strong in the IPN (arrowhead) of wt mice (upper panel), and absent in ChAT-cKO brains (lower panel) while the laterodorsal tegmental nucleus (LDTg) - an efferent target of the IPN - and adjacent third cranial nerves (3N) show similar CHAT expression in wt and ChAT-cKO mice. Scale bars: 300 µm. (E) Immunostaining analyses in wt and ChAT-cKO show that CHAT immunoreactivity (red) is no longer detected in the MHb of ChAT-cKO mice. Wt and ChAT-cKO mice show similar CHAT immunoreactivity in striatum and LDTg. Scale bars: MHb and striatum 100 µm, LDTg 200 µm. (F) Quantification of CHAT positive neurons in the indicated cholinergic areas. ChAT-cKO mice do not express CHAT in the MHb, while striatum, PPTg and LDTg show comparable number of neurons positive for CHAT (percentage of the number of cells counted per section normalized to wt is shown in bars. MHb wt: 100.1 ± 3.676, number of sections=22; MHb ChAT-cKO: 0.3326 ± 0.1380, n=22; unpaired t-test p<0.0001; Striatum wt: 100.0 ± 7.233, n=22; Striatum ChAT-cKO: 92.27 ± 7.112, n=22; unpaired t-test p=0.45; PPTg wt: 100.1 ± 11.70, n=14; PPTg ChAT-cKO: 115.8 ± 10.78, n=14; unpaired t-test=0.33; LDTg wt: 100.0 ± 11.50, n=13; LDTg ChAT-cKO: 122.0 ± 16.86, n=13; unpaired t-test=0.29. The total number of neurons counted per brain area is shown above the bars; n=3 mice per genotype). (G) Sagittal brain sections immunostained for CHAT (red) and neurofilament (green). The axonal projections and general anatomy of the fr, IPN and surrounding tegmental areas are comparable between wt (left panels) and ChAT-cKO (right panels). ChAT-cKO mice lack CHAT-immunoreactivity in the MHb-fr-IPN projection but show similar CHAT expression as wt mice in other brain areas, such as the LDTg, third cranial nerve (3N), striatum (Str) and BF. Scale bar: 800 µm. BF: Basal forebrain; cKO: Conditional knockout; IPN: Interpeduncular nucleus; LDTg: Laterodorsal tegmental nucleus; MHb: Medial habenula.
Figure 3
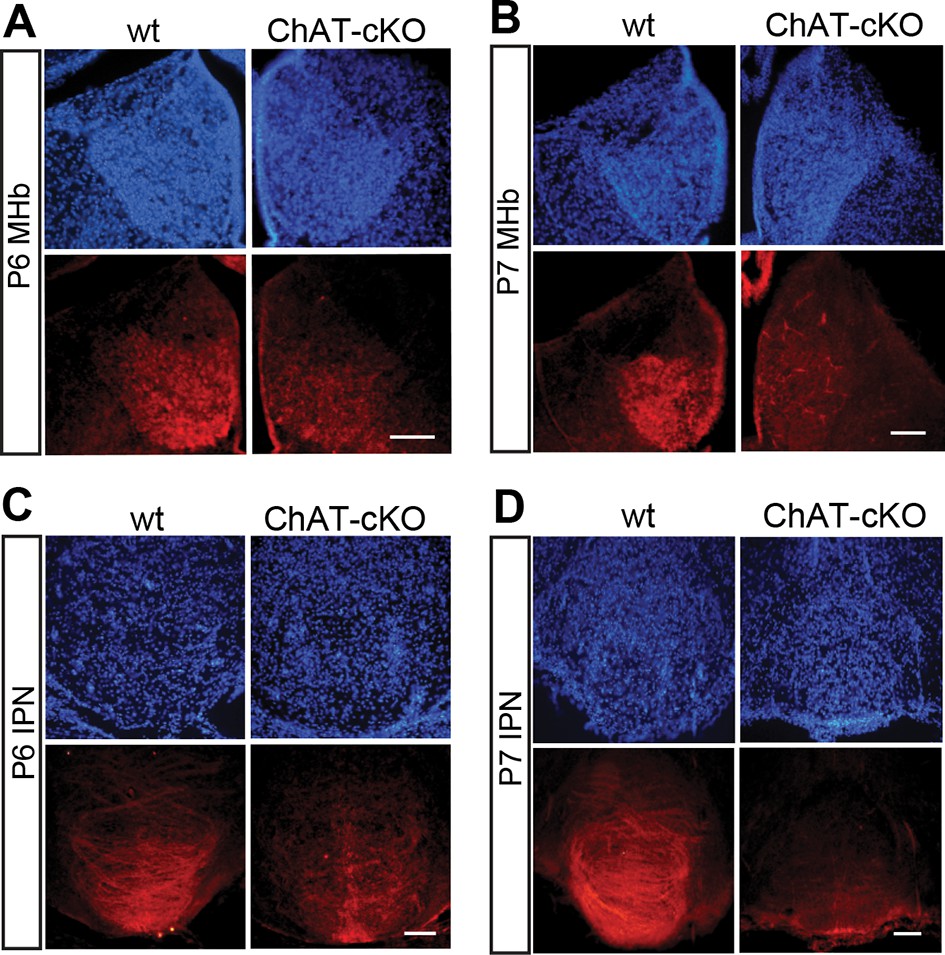
Conditional gene deletion of Chat driven by Kiaa1107 Cre-recombinase line is specific for the MHb-IPN tract and occurs during the first postnatal week.
(A–D) Immunostaining with CHAT (red) and counterstaining with DAPI (blue) shows progressive loss of CHAT signal in MHb neurons and their axonal terminals in the IPN at postnatal day 6 (P6) and postnatal day 7 (P7). IPN: Interpeduncular nucleus; MHb: Medial habenula.
Figure 4

Distribution of cholinergic and glutamatergic axonal terminals in IPN subnuclei.
(A) Schematic representation of the segregated projections of medial habenular neurons to IPN subnuclei. The dorsal part of the MHb (dMHb, blue) consists of peptidergic neurons (positive for substance P, SP) that project to the lateral part of the IPN (IPL, blue). The ventral part of the MHb (vMHb, red) contains cholinergic neurons (positive for CHAT, red) that project to the rostral (IPR), intermediate (IPI) and central (IPC) subnuclei of the IPN (red). Both types of projections co-release glutamate (VGLUT, green). (B–M) Double immunostaining and Manders’ colocalization coefficient analyses of glutamatergic and cholinergic markers in different subnuclei of the IPN. M1: index of colocalization and P: significance of correlation were measured in the indicated dotted squares which are located: 1 in IPR, 2 in IPI, 3 in IPC and 4 in IPL. (B–G) In wt mice, VGLUT1 (green) and CHAT (red) show the strongest index of colocalization in the IPC and no colocalization in the IPL. CHAT immunoreactivity signal is absent in the IPN of ChAT-cKO mice. (H–M) Analyses of VGLUT1 (green) and VACHT (violet) show the highest colocalization index also in the IPC of both wt and ChAT-cKO, and no colocalization in the IPL. The M1 and the P values shown below panels 1–4 were calculated from one image for each IPN subnucleus. cKO: Conditional knockout; IPN: Interpeduncular nucleus; MHb: Medial habenula; wt: Wild type.
Figure 5
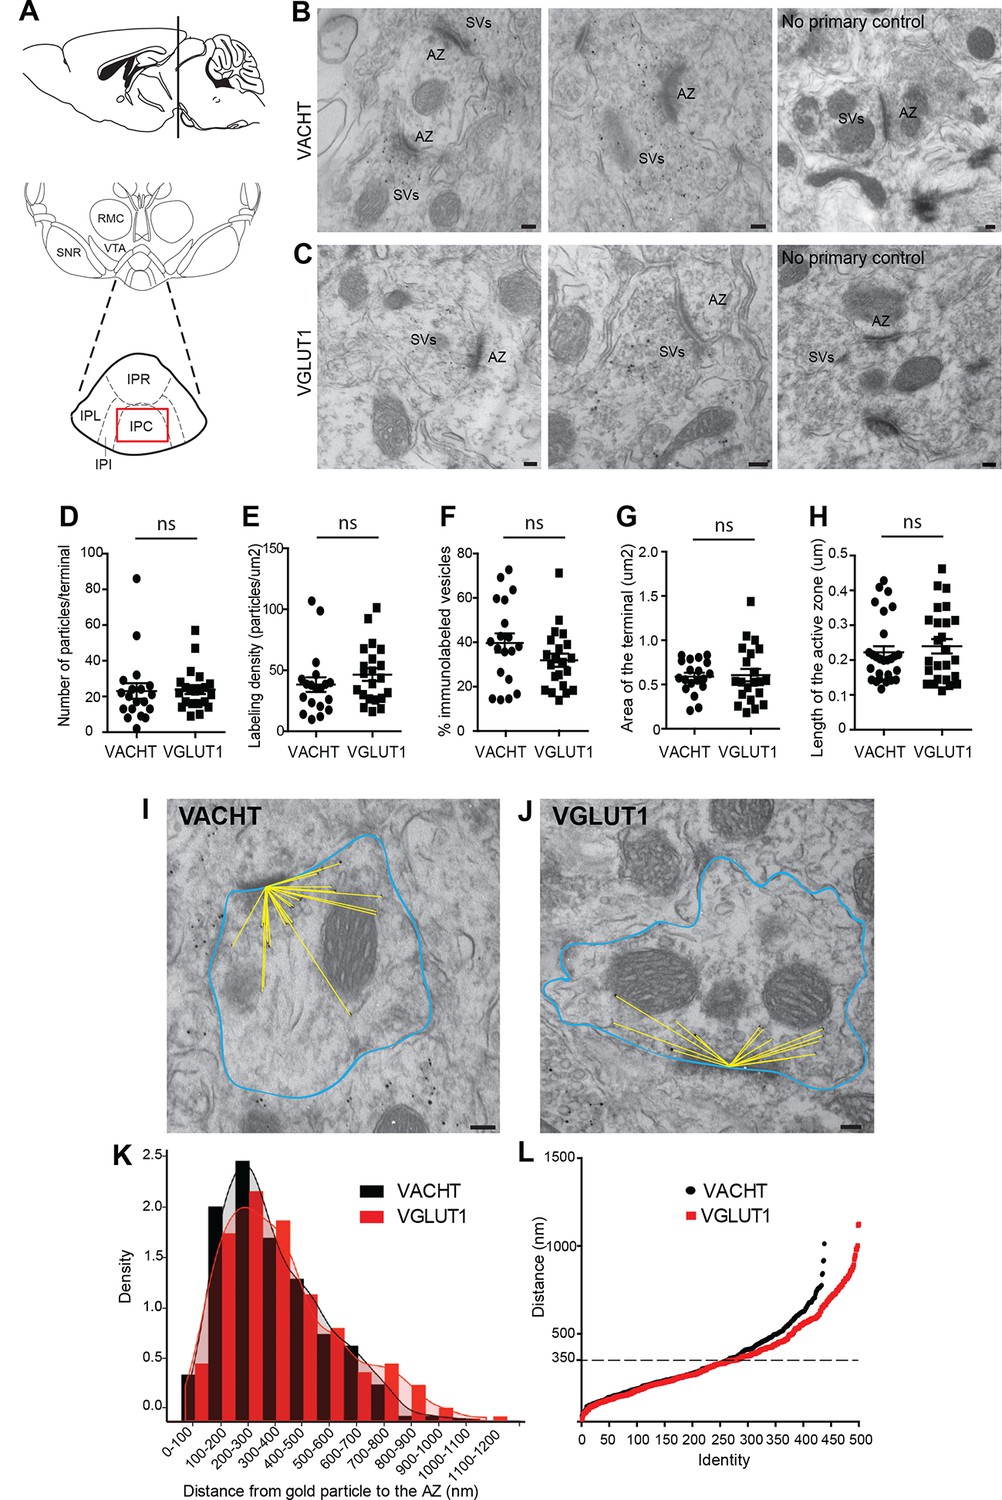
VACHT and VGLUT1 are located in synaptic vesicles of axonal terminals in the central IPN.
(A) Scheme of the brain area dissected for Electron Microscopy (EM) analyses. The red square over the IPC indicates the region analyzed by EM. (B–C) Representative micrographs of single pre-embedding immunogold EM analyses of VACHT (B) and VGLUT1 (C) showing immunogold particles in synaptic vesicles (SVs) grouped together at presynaptic terminals identifiable by the dense active zone (AZ). The micrographs on the right column (no primary control) correspond to control experiments in which sections were treated following the same procedure while omitting the primary antibody. Scale bar: 100 nm. (D–H) Quantitative analysis of single pre-embedding immunogold electron micrographs. (D) The number of gold particles labeled either by VACHT or VGLUT1 antibodies per terminal is not statistical different between antibodies (VACHT=23.05 ± 4.37, n=19 terminals; VGLUT1= 23.86 ± 2.51, n=21 terminals; unpaired t-test p=0.87). (E) The labeling density (number of gold particles per terminal/area of the terminal) is not significantly different between VACHT and VGLUT1 positive terminals (VACHT= 38.31 ± 5.95, n=19; VGLUT1= 46.48 ± 5.175, n=21; unpaired t-test p=0.3). (F) No difference is observed in the percentage of VACHT or VGLUT1 immunolabeled vesicles (labeled vesicles/ total number of vesicles*100) per terminal (VACHT= 39.73 ± 4.30, n=19; VGLUT1= 31.91 ± 2.97, n=21; unpaired t-test p=0.13). (G) The area of the presynaptic terminals labeled with either VACHT or VGLUT1 gold particles is not significantly different (VACHT= 0.58 ± 0.04, n=19; VGLUT1= 0.61 ± 0.07, n=21; unpaired t-test p=0.84). (H) No difference is observed in the length of the active zone of presynaptic terminals labeled with either VACHT or VGLUT1 gold particles (VACHT= 0.22 ± 0.02, n=28; VGLUT1= 0.24 ± 0.02, n=25; unpaired t-test p=0.52). (I–L) For quantification of the distances of immunogold labeled SVs to the AZ, the area of each presynaptic terminal was delineated (blue) and the distance of each gold particle within a terminal to the center of the active zone (yellow lines) was measured for VACHT (I) and VGLUT1 (J). Scale bar: 100 nm. (K) Density plot of the distances of VACHT (black bars) and VGLUT1 (red bars) labeled particles to the active zone. (L) Scatter plot of the distances of VACHT and VGLUT1 gold particles to the active zone. Vesicles labeled by either VACHT or VGLUT1 located beyond 350 nm from the active zone are differentially distributed (F(1,935) = 4.634; p<0.05; one-way ANOVA).
Figure 6
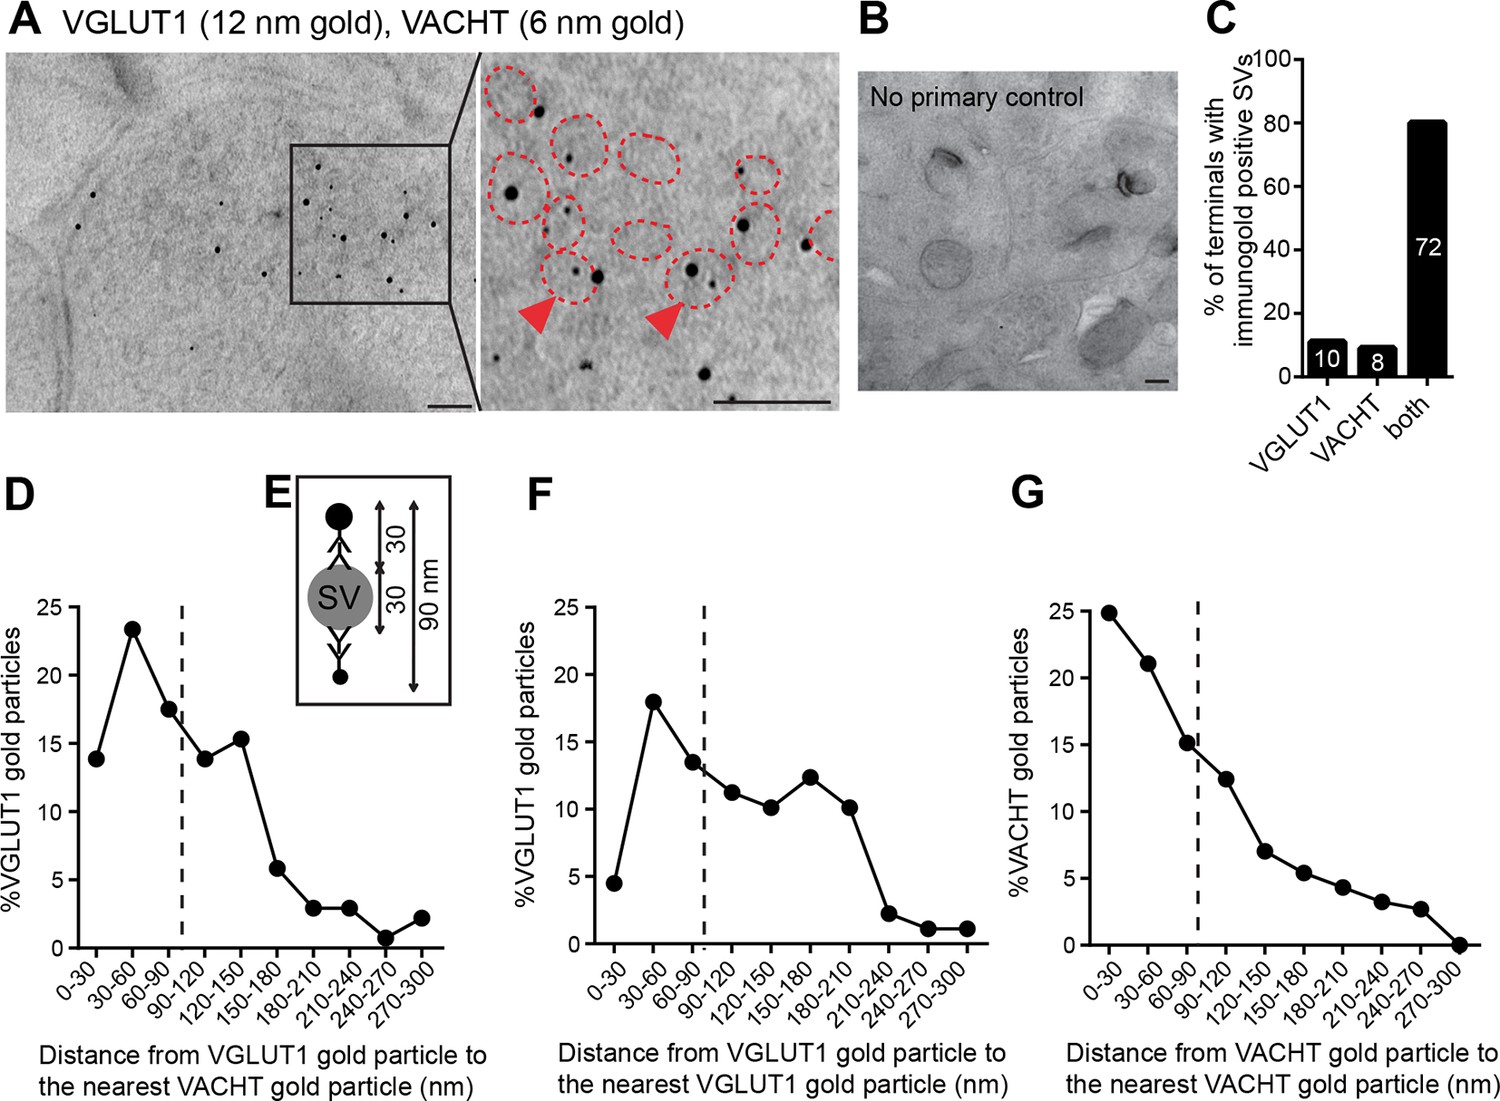
VACHT and VGLUT1 colocalize in the same synaptic vesicles in axonal terminals in the central IPN.
(A,B) Double post-embedding immunogold labeling of VACHT (6 nm gold particles) and VGLUT1 (12 nm gold particles) shows colocalization of both transporters in the same synaptic vesicles. The right panel is a higher magnification of the boxed area. Synaptic vesicles are outlined in red. Arrowheads indicate synaptic vesicles that contain both transporters. Scale bar: 100 nm. In control experiments sections were treated following the same procedure while omitting the primary antibodies. Scale bar: 100 nm. (C) Percentage of axonal terminals that contain VGLUT1 or/and VACHT immunolabeled SVs. The number of counted terminals is shown inside each bar of the graph: from 109 visualized terminals, 10 terminals contain only VGLUT1 positive SVs, 8 terminals contain only VACHT positive SVs, 72 terminals contain SVs positive for VGLUT1 and VACHT, and 19 terminals showed no immunogold particles. (D) Frequency histogram showing the percentage of VGLUT1 particles located at the indicated distances (30 nm bins) from the nearest VACHT gold particle. (E) Scheme of an SV labeled with two primary antibodies and secondary antibodies conjugated to a gold particle. According to the indicated size of an SV and conjugated antibodies, the maximum distance between two immunogold particles to potentially label the same synaptic vesicle is 90 nm. (D,F,G) Frequency histograms of the distance distributions between immunogold particles showing the percentage of particles located at the indicated distances (30 nm bins) for VGLUT1 to VACHT (D), for VGLUT1 to VGLUT1 (F) and for VACHT to VACHT (G). Particles located closer than 90 nm apart (on the left side of the dashed line) potentially label the same vesicle. SV: Synaptic vesicle
Figure 7
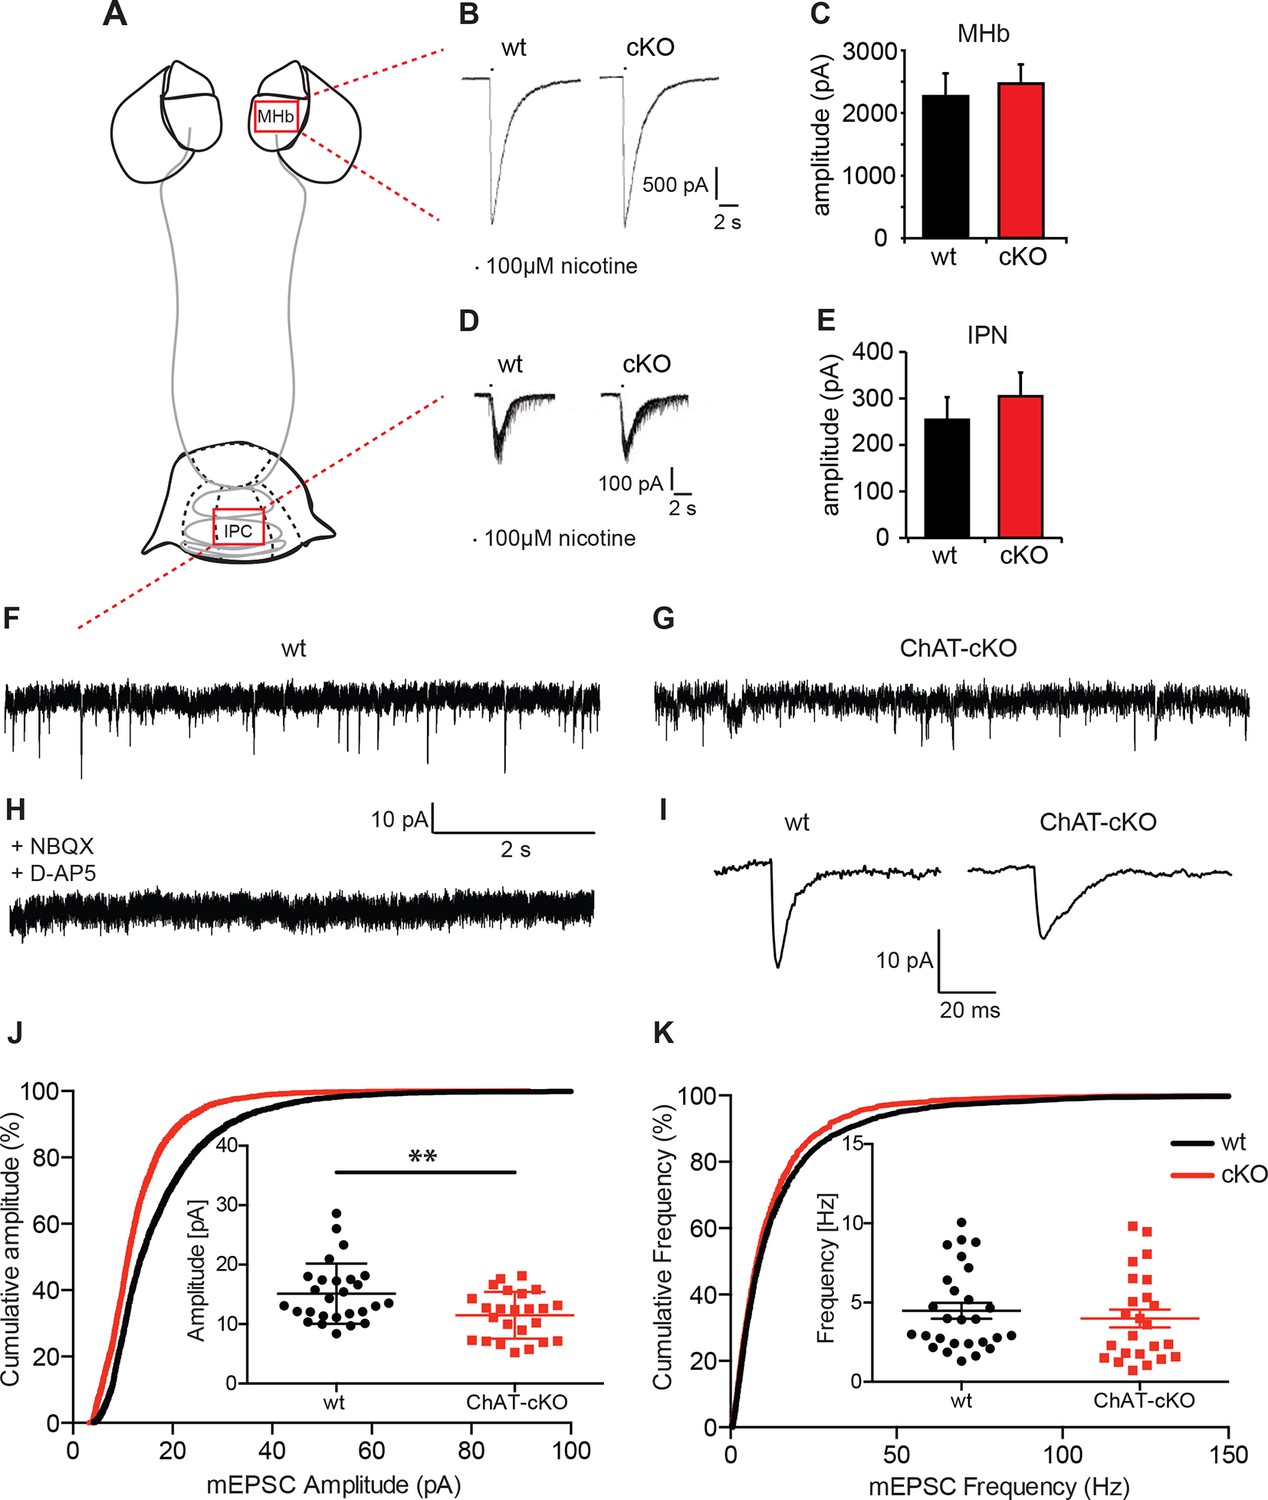
Cholinergic eEPSC are unchanged whereas glutamatergic mEPSC are smaller in central IPN neurons of ChAT-cKO mice.
(A) Schematic representation of the habenula and IPN subnuclei. Red squares over the MHb and IPC indicate the areas where the corresponding electrophysiological recordings were performed. (B–E) Cholinergic representative evoked excitatory postsynaptic currents (eEPSC) of MHb (B) and IPC (D) neurons by local puff application of 100 µM nicotine. Cholinergic, current amplitudes were comparable between wt and ChAT-cKO. (C) n= 18 per genotype, unpaired t-test p=0.465. (E) n= 52 (wt), n= 53 (ChAT-cKO), unpaired t-test p=0.475. (F–I) Representative recordings of glutamatergic miniature excitatory postsynaptic currents (mEPSC) in IPC neurons in wt (F), ChAT-cKO (G), and in wt neurons after addition of the AMPA-R and NMDA-R blockers NBQX and D-AP5 (H). (I) Representative average glutamatergic mEPSC in wt and ChAT-cKO. (J) Cumulative probability plots of the glutamatergic mEPSC amplitudes show a left shift indicating that ChAT-cKO neurons (red line) have significantly smaller amplitudes than wt neurons (black line). Insets represent the average amplitude of mEPSCs per neuron recorded during 1 min (n=24 for wt and n=24 for cKO, unpaired t-test: **p<0.01). (K) Cumulative probability plots of the mEPSC frequency show similar curves for ChAT-cKO neurons (red line) and wt neurons (black line). Insets show no significant differences in the average frequencies per recorded neuron (n=27 for wt and n=24 for cKO). cKO: Conditional knockout; IPN: Interpeduncular nucleus.
Figure 8
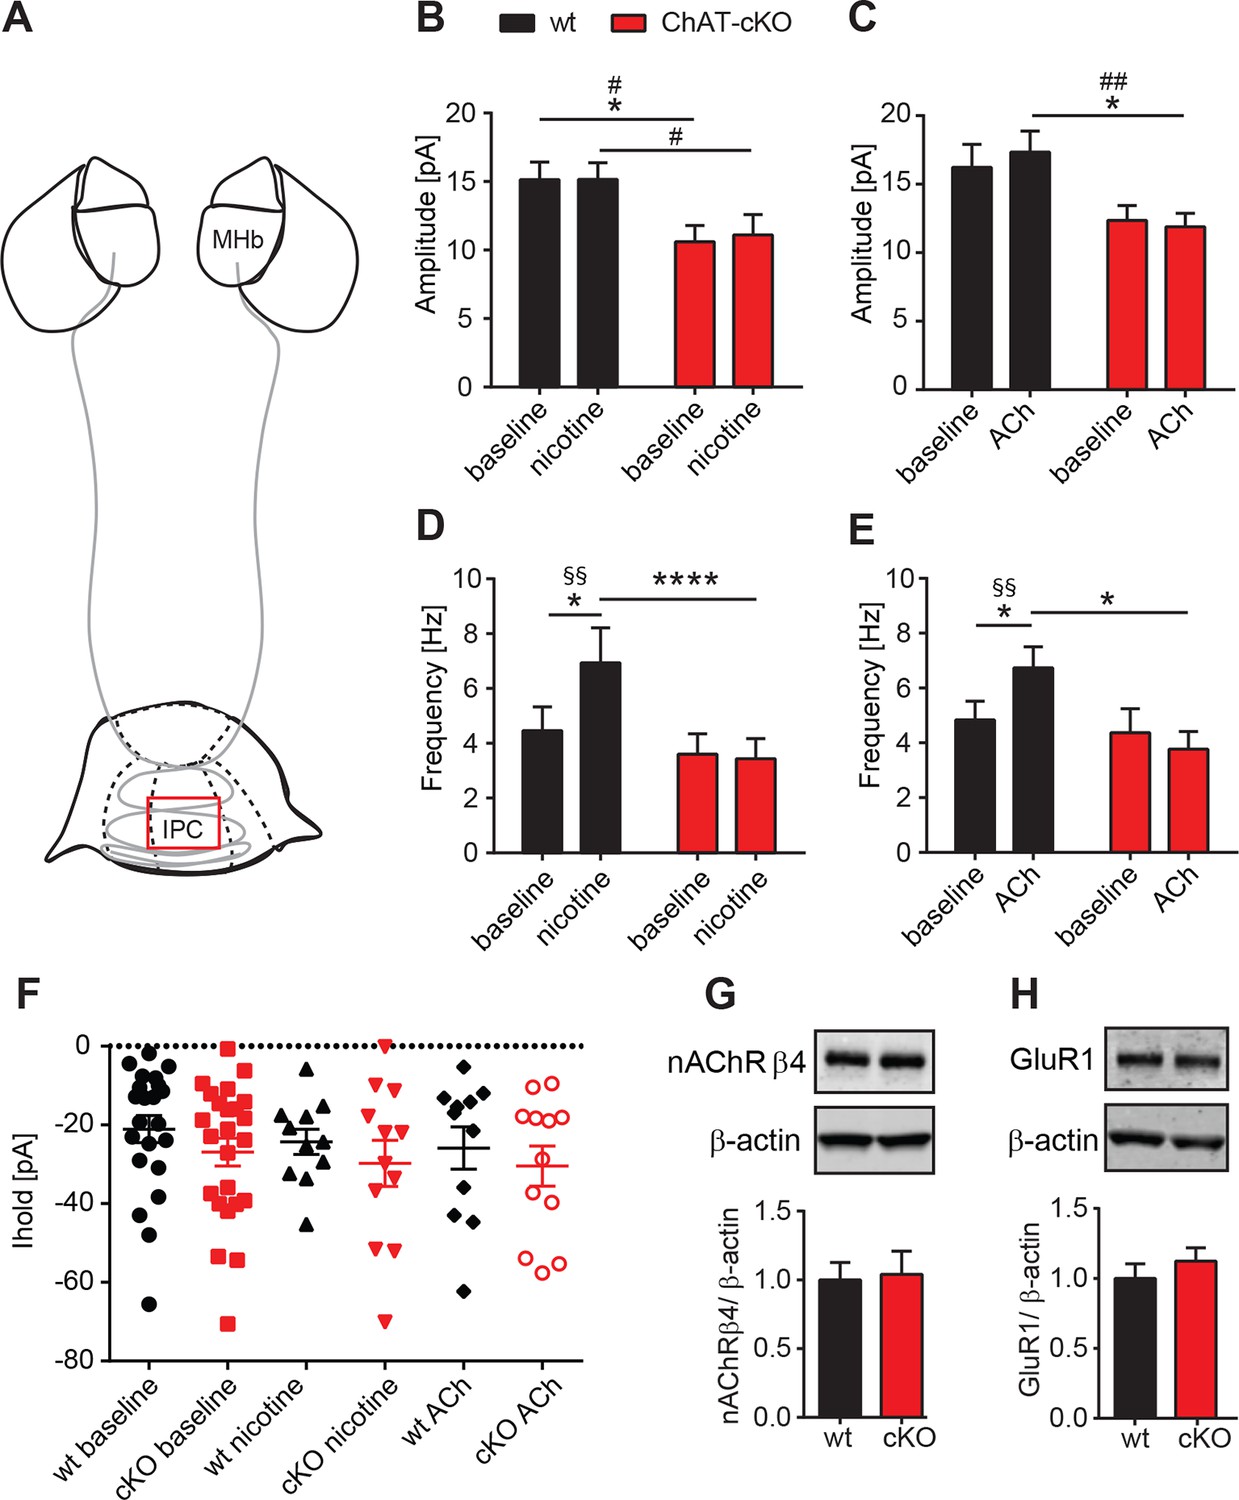
Presynaptic facilitation of glutamate release is absent in ChAT-cKO mice.
(A) Schematic representation of the habenula and IPN subnuclei. Red square over the IPC indicates the area of electrophysiological recordings. (B,C) Superfusion with 250 nM nicotine (B) or 100 µM ACh (C) did not change the glutamatergic mEPSC amplitude within each group (n=22–24 per genotype, n=11–12 per condition). ChAT-cKO neurons show significantly smaller amplitudes than wt neurons in either condition (repeated measures two-way-ANOVA: p<0.05 for genotype (for nicotine and ACh), Bonferroni’s posttest: *p<0.05 and unpaired t-test: # p<0.05, ## p<0.01). (D,E) Bath application of 250 nM nicotine (D) or 100 µM ACh (E) significantly increased the glutamatergic mEPSC frequency in wt, but not in ChAT-cKO (n=22–24 per genotype and n=11–12 per condition, repeated measures two-way-ANOVA: p<0.01 for treatment and p<0.001 for interaction in F and p<0.05 for interaction in G; Bonferroni’s posttest: *p<0.05, ****p<0.0001 and paired t-test: §§ p<0.01). (F) The holding current is similar in wt and cKO and is not altered by bath application of 250 nM nicotine or 100 µM ACh (n=22–24 per genotype, n=11–12 per condition). (G,H) Western blot analyses and quantification of β4 and GluR1 levels in IPN membrane extracts reveal no significant differences between wt and ChAT-cKO mice (n= 3 per genotype).
Figure 9

Glutamatergic mEPSC are unchanged in the lateral part of the IPN.
(A) Schematic representation of IPN subnuclei. Red square over the IPL indicates the area of electrophysiological recordings. The IPL does not receive cholinergic afferents from the ventral part of MHb, but mostly substance P afferents from the dorsal part of MHb. (B) Representative image of three recorded neurons filled with Biocytin (green) in the substance P (SP; red) positive IPL. Scale bar: 100 µm. (C) Higher magnification of neuron 1 in the IPL. Scale bar: 100 µm. (D) Cumulative and average amplitude of glutamatergic mEPSC recordings in the IPL. mEPSC amplitudes were not significantly different between wt (n=12) and ChAT-cKO (n=10; unpaired t-test p=0.556). Marked in grey are the recorded cells 1, 2 and 3 shown in B and C. (E) Cumulative and average frequency of glutamatergic mEPSC recordings in the IPL. There were no significant differences in mEPSC frequency between wt (n=12) and ChAT-cKO (n=10; unpaired t-test p=0.364). Marked in grey are the recorded cells 1, 2 and 3 shown in B and C. cKO: Conditional knockout; IPN: Interpeduncular nucleus; IPL: Lateral interpeduncular nucleus; mEPSC: miniature excitatory postsynaptic currents; MHb: Medial habenula; wt: Wild type.
Figure 10
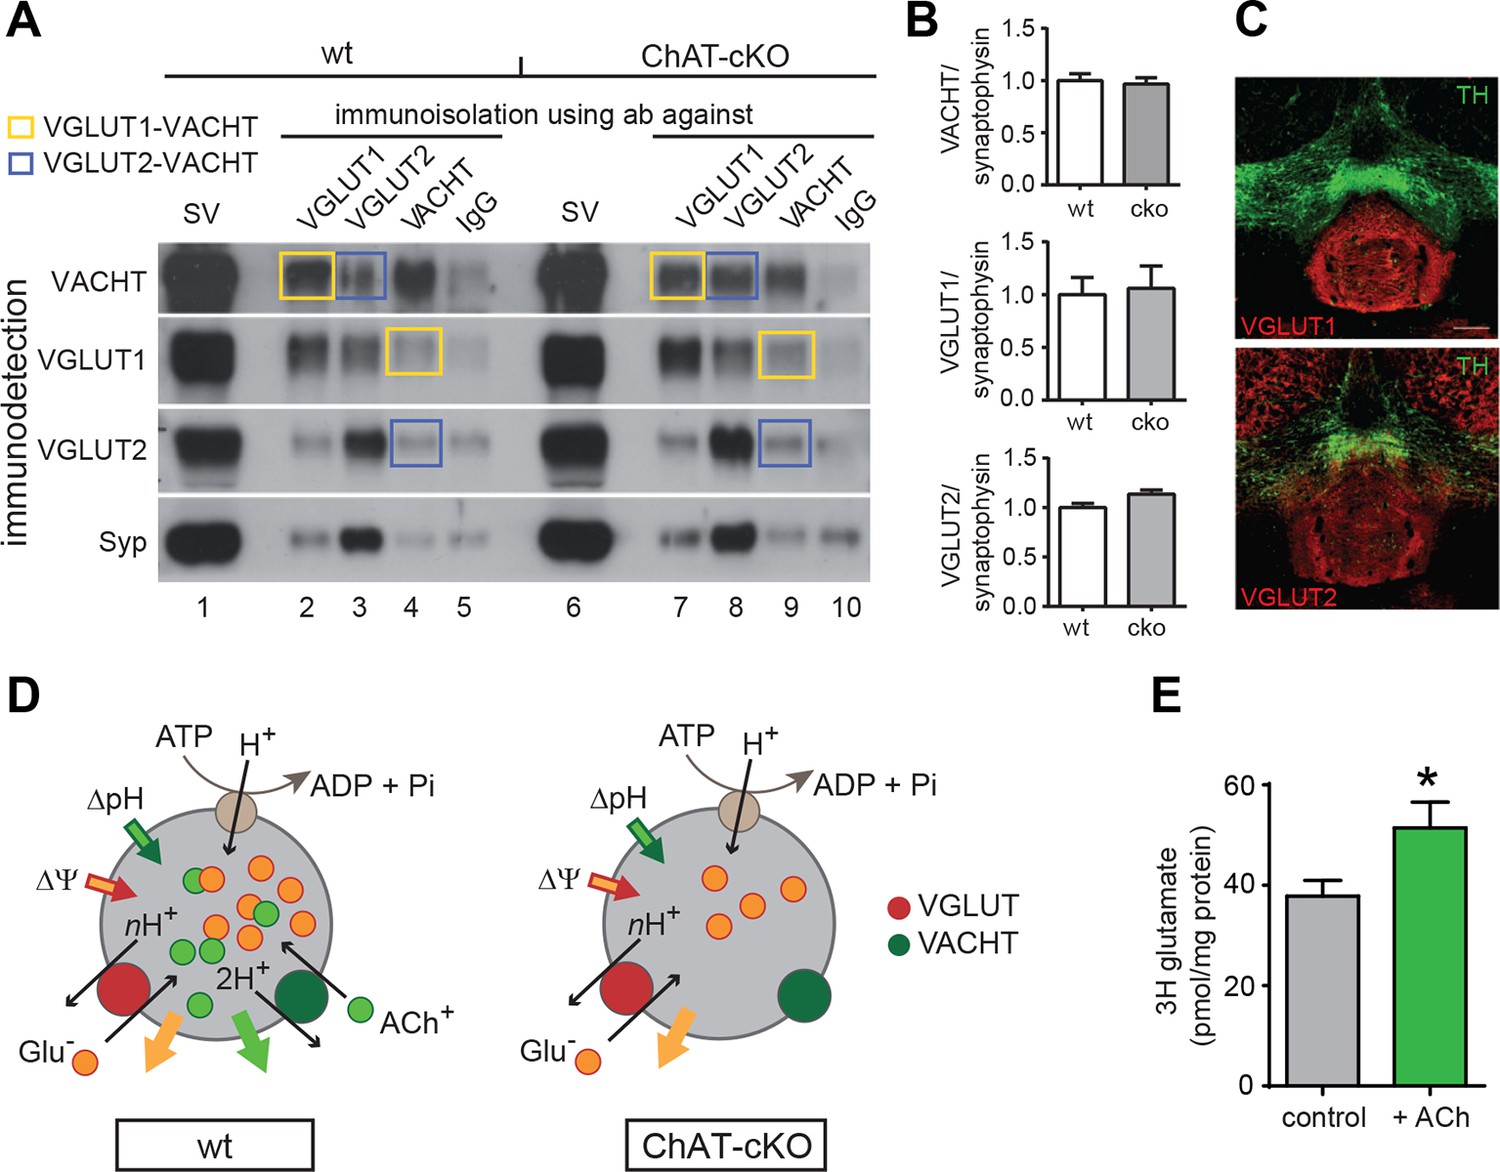
ACh enhances glutamate uptake into synaptic vesicles coexpressing VACHT and VGLUT1/2.
(A) Western blot analyses of synaptic vesicles prepared from the IPN of wt and ChAT-cKO mice using VACHT, VGLUT1, VGLUT2, and Synaptophysin (Syp) antibodies indicated on the left. SVs from the starting material (shown in the first row for each genotype) were immunoisolated with the polyclonal antibodies indicated above, or without primary antibody (IgG) and subsequently immunodetected with the monoclonal antibodies indicated on the left. SVs immunoisolated with VGLUT1 contain VACHT and SVs immunoisolated with VACHT contain VGLUT1 and are indicated by yellow squares. Blue squares indicate VGLUT2/VAChT co-immunoisolates. (B) Quantification of the western blot signal of vesicular proteins in the starting fraction of the immunoisolation shows no significant differences between wt and ChAT-cKO. (C) Immunostaining of mouse brain sections containing the IPN and adjacent dopaminergic VTA region (TH positive in green) shows expression of VGLUT1 (red, upper panel) and VGLUT2 (red, lower panel). (D) Simplified illustration of vesicular synergy: synaptic vesicles are acidified and positively charged by a V-type H+-ATPase (brown circle) that pumps protons into the SV generating a chemical gradient (ΔpH, inward green arrow) and an electrical gradient (ΔΨ, inward red arrow). The activities of vesicular transporters depend to differing extents on ΔpH and ΔΨ due to the charge on the neurotransmitter and the stoichiometry of coupling to H+. VACHT preferentially uses the ΔpH chemical gradient while VGLUT relies more on ΔΨ component. During each transport cycle, VACHT exchanges two protons (H+) for one ACh molecule (ACh+ positively charged) thereby dissipating ΔpH (outward green arrow) twice faster than ΔΨ, a situation promoting VGLUT activity. VGLUT activity exchanges one glutamate molecule (Glu- negatively charged) by nH+ and causes the opposite imbalance dissipating more ΔΨ than ΔpH (outward orange arrow). The transport activity of VGLUT thereby compensates for the bioenergetic imbalance produced by VACHT activity and vice versa. This reciprocal vesicular synergy between transporters allows a maximal accumulation of ACh and glutamate under a constant ΔΨ and ΔpH gradient (see review by Hnasko et al., 2012). In the absence of ACh+ as it occurs in synaptic terminals of ChAT-cKO mice, there is no exchange of ACh+/2H+ and synaptic vesicles progressively become less positively charged and the plateau level of Glu- uptake is reduced. Adapted from (Gras et al., 2008). (E) Glutamate uptake into SV prepared from rat IPN. In the presence of 10 mM ACh iodide (10 mM K-iodide was used for osmotic compensation in control condition), vesicles accumulated significantly more [3H]glutamate (mean ± S.E.M. of 12 control and 10 ACh samples from 4 experiments; unpaired t-test: *p<0.05). Values were corrected for nonspecific uptake in the presence of FCCP (inhibitor of vesicular transporters). ACh: Acetylcholine; cKO: Conditional knockout; IPN: Interpeduncular nucleus; SV: Synaptic vesicle;VTA: Ventral tegmental area
Figure 11

ChAT-cKO mice are insensitive to nicotine-conditioned reward and show no signs of nicotine withdrawal.
(A) Basal activity, measured as locomotion in a novel environment is similar in ChAT-cKO and wt mice (n = 9 per genotype). (B) Day/night locomotor activity measured as number of beam breaks in 1 hr intervals for 72 hr (averaged to 24 hr) was unchanged in ChAT-cKO (n = 6) compared to wt mice (n = 10). (C) Dose-response of acute effects of nicotine injections on hypolocomotor activity. Nicotine i.p. challenges produced significantly more hypoactivity in wt mice compared to ChAT-cKO mice across all nicotine doses tested (n = 8–10 per genotype and dose; two–way ANOVA for genotype: p<0.001). (D) Daily i.p. injection of 0.65 mg/kg nicotine induced tolerance behavior in wt but not in ChAT-cKO mice: hypolocomotion was significantly attenuated in wt after 5 days of treatment compared to the first day of administration (n=6 per genotype, one–way-ANOVA days 1–9: wt F(2.446) = 4.963, p<0.05 and ChAT-cKO F(1,548) = 0.988, n.s.; paired t-test *p<0.05) but ChAT-cKO maintained similar locomotor activity at consecutive days of nicotine treatment. (E-F) Nicotine withdrawal was measured by quantification of (E) somatic signs (including scratching, rearing, head nods, body shakes and grooming) and (F) anxiety-like behavior (as time spent in dark versus light chamber). Signs of nicotine withdrawal were measured in mice drinking saccharin-sweetened water (somatic tests: n=5 per genotype, affective tests: n=8 for wt and n=14 for cKO) or saccharin-sweetened water containing nicotine (somatic tests: n=11 for wt, n=9 for ChAT-cKO; affective: n=11 for wt, n=13 for cKO) for 6 weeks. Precipitation of withdrawal by injection of the nicotinic antagonist mecamylamine elicited somatic and affective signs of withdrawal in wt mice treated with nicotine compared to the saccharin-treated mice (unpaired t-test: *p < 0.05). ChAT-cKO mice treated with saccharin spent less time in the light camber than wt mice treated with saccharin, but this difference was not statistically significant (unpaired t-test; p=0,14). ChAT-cKO mice showed no significant signs of either somatic or affective nicotine withdrawal since there were no differences between the nicotine and control groups (unpaired t-test: **p < 0.01, *p<0.05). (G,H) Nicotine place preference was measured by pairing nicotine or saline injections to different chambers for 3 consecutive days and measuring the time spent in either chamber on the test day. Wt (G) but not ChAT-cKO (H) mice showed robust conditioned place preference after pairing the environment with 1.5 mg/kg nicotine. Each point represents the mean ± S.E.M. of 6–10 mice per group (paired t-test: nicotine vs. saline compartment, **p<0.01; two–way matched ANOVA for substance: **p=0.007 in wt). cKO: Conditional knockout.
Figure 12
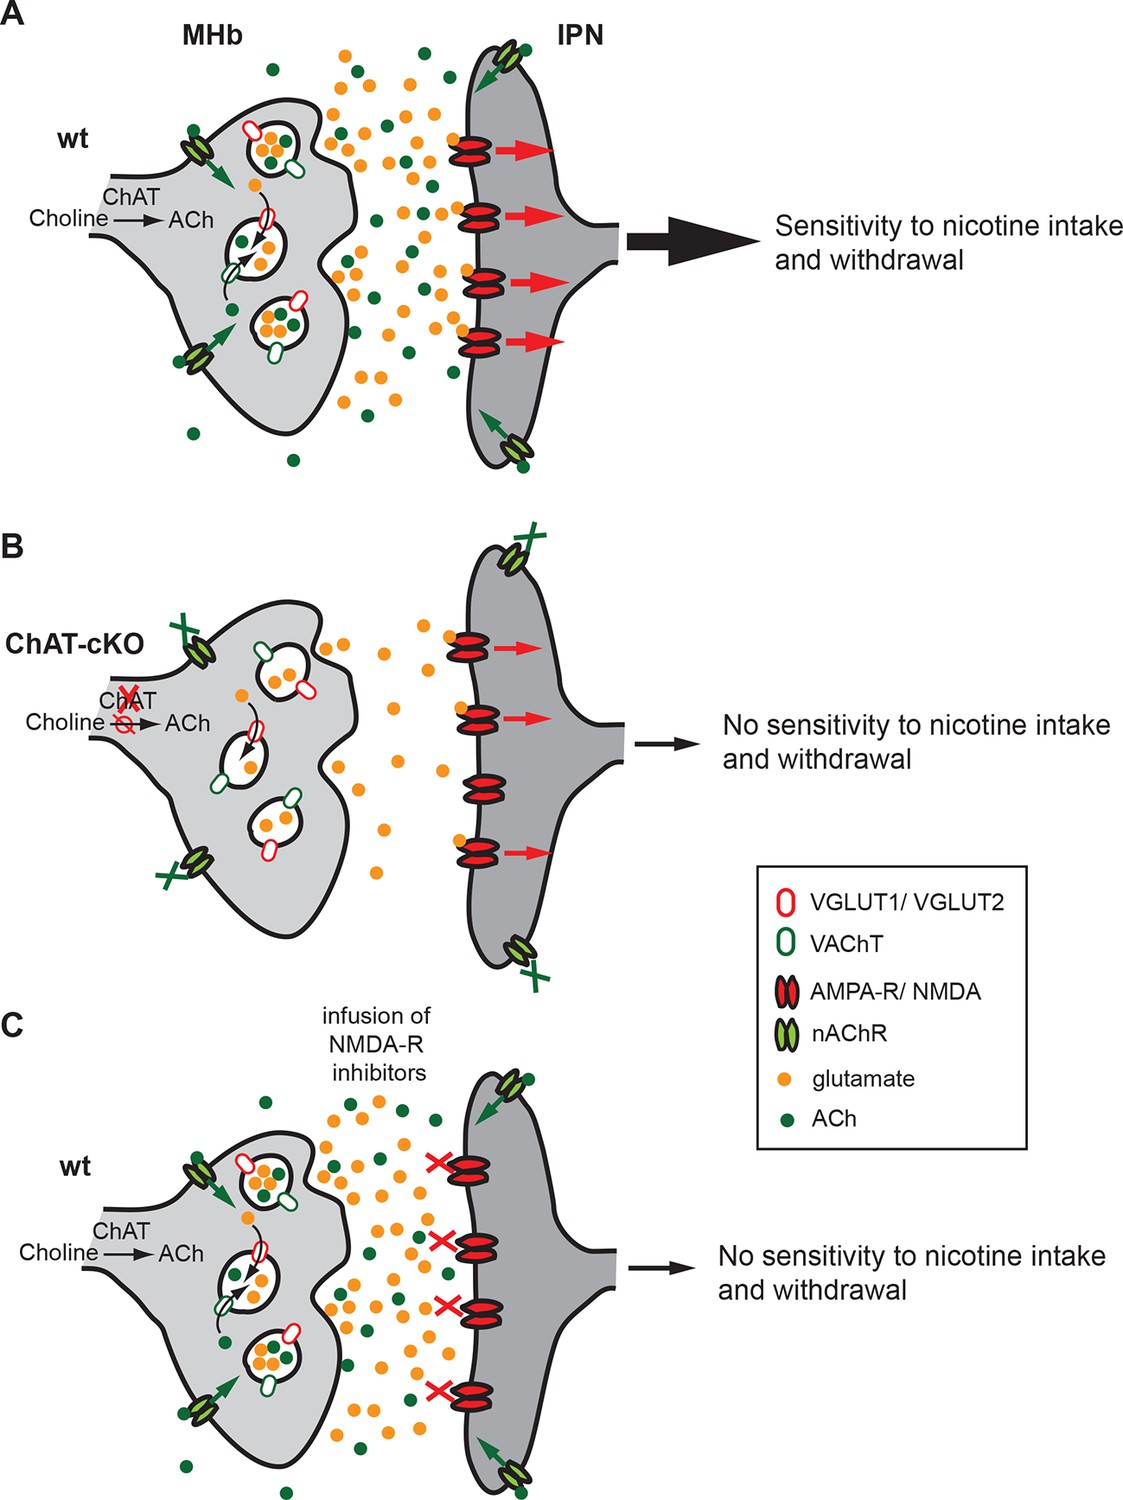
Cholinergic and glutamatergic cotransmission from habenular neurons to the IPN is essential for development of nicotine dependence.
(A–C) Schemes illustrating the co-transmission of glutamate and ACh in three situations: in wt mice (A), in ChAT-cKO mice (B), and in mice injected with glutamate receptor blockers (C). (A) The vesicular transporters VACHT and VGLUT1/2 are colocalized in the great majority of synaptic vesicles at axonal terminals of cholinergic habenular neurons in the IPC. ACh synthesized by cholinergic habenular neurons promotes the uptake of glutamate into SVs by vesicular synergy between neurotransmitter transporters. The simultaneous corelease of ACh and glutamate activates presynaptic nAChR and postsynaptic nAChRs and glutamate receptors and is essential for tapering nicotine intake and producing withdrawal symptoms upon nicotine cessation. (B) In the absence of ACh in ChAT-cKO both presynaptic facilitation of glutamate release and vesicle glutamate quantal content are reduced leading to reduced glutamate release at ChAT-cKO synapses and consequently insensitivity to nicotine consumption and withdrawal effects. (C) Similarly, injections of NMDA-R blockers in the IPN reduce glutamatergic signaling and diminishes sensitivity to nicotine intake and withdrawal (Fowler et al., 2011 and Zhao-Shea et al., 2013). ACh: Acetylcholine; cKO: Conditional knockout; IPC: Central IPN; IPN: Interpeduncular nucleus; nAChR: Nicotinic acetylcholine receptor; SV: Synaptic vesicle.
Download links
A two-part list of links to download the article, or parts of the article, in various formats.
Downloads (link to download the article as PDF)
Open citations (links to open the citations from this article in various online reference manager services)
Cite this article (links to download the citations from this article in formats compatible with various reference manager tools)
An essential role of acetylcholine-glutamate synergy at habenular synapses in nicotine dependence
eLife 4:e11396.
https://doi.org/10.7554/eLife.11396


