Mapping oxygen concentration in the awake mouse brain
- Institut National de la Santé et de la Recherche Médicale, U1128, France
- Université Paris Descartes, France
Figures
Figure 1
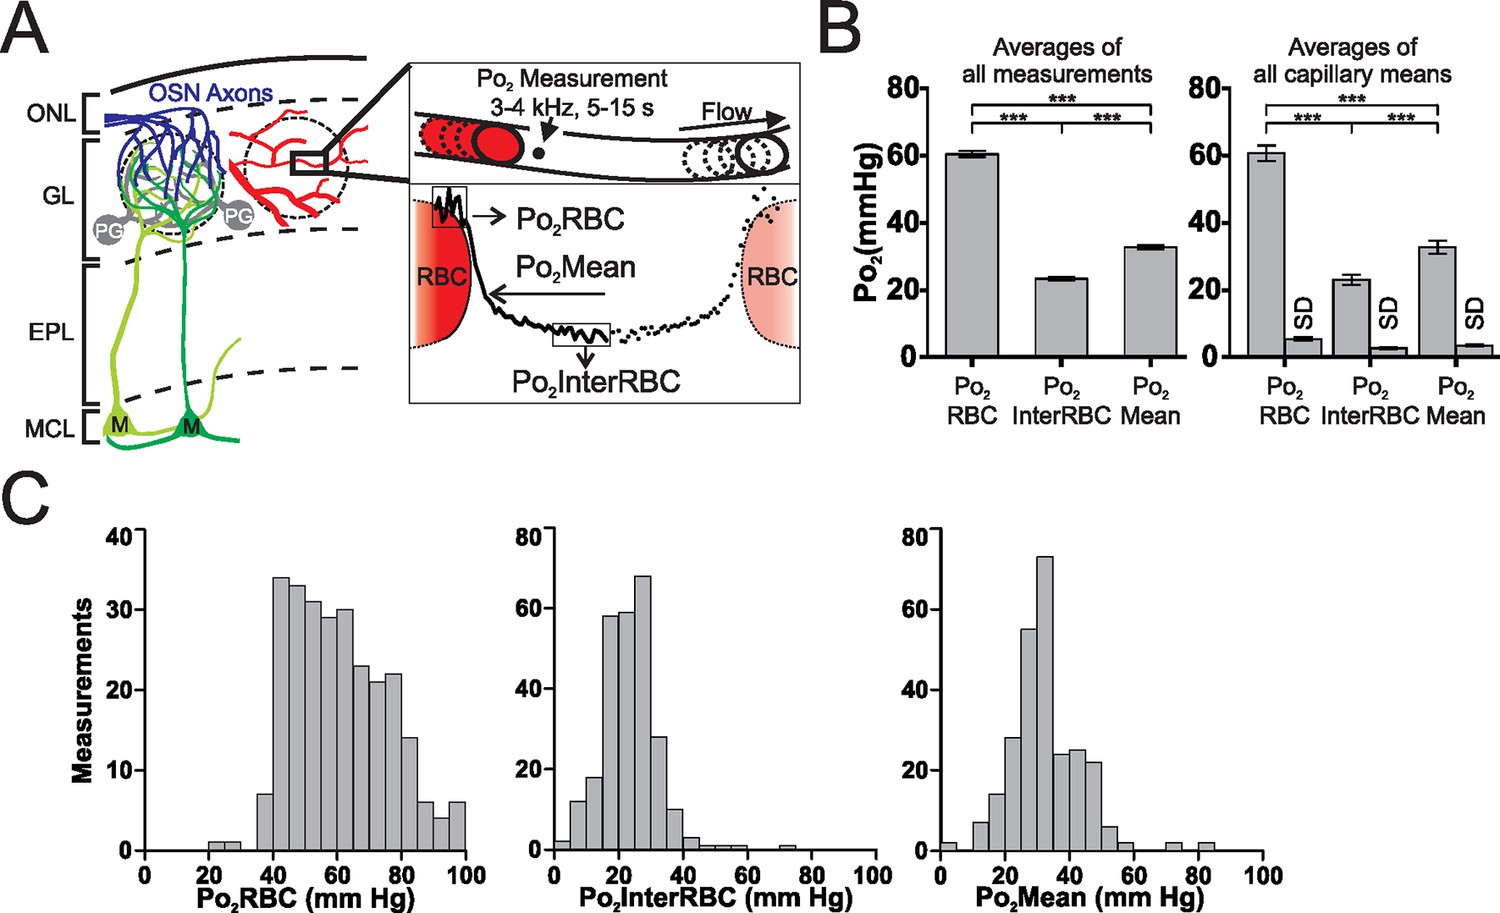
Erythrocyte-associated transients (EATs) in the olfactory bulb glomerular layer of the awake mouse.
(A) Left panel, schematic diagram of the organisation of the olfactory bulb. OSN: olfactory sensory neuron, PG: periglomerular neuron, M: mitral cell, ONL: olfactory nerve layer, GL: glomerular layer, EPL: external plexiform layer, MCL: mitral cell layer. Right panel, top, schematic illustrating the 2PLM Po2 measurement procedure in capillaries. Bottom, diagram showing Po2 values extracted from EATs. The continuous trace represents the Po2 profile relative to the RBC border in one selected capillary: Po2 at the RBC border (Po2RBC, in this case 47.2 mm Hg), Po2 at distance from a RBC (Po2InterRBC, in this case 8.6 mm Hg) which gives an estimate of Po2 in the interstitium of the glomerular layer, and average Po2 in the capillary (Po2Mean, in this case 19 mm Hg). (B) Multiple (~4–8) measurements were made in each capillary. The Po2InterRBC is significantly lower than both Po2Mean and Po2RBC, whether calculated on all measurements (the mean value is the average of all measurements pooled from all capillaries assessed, n = 262, left panel), or on the mean values from each capillary (the mean value is the average of the single mean values for each of the capillaries, n=38, right panel). SD (the average of the SD values for each capillary, presented as mean standard deviation ± SEM) illustrates the fluctuations of Po2 values in each capillary across the multiple measurements. Data presented as mean ± SEM. *p<0.05, ***p<0.001, Kruskal-Wallis test with 2-tailed Dunn's multiple comparison post-hoc test. (C) Frequency distributions of all measurements of Po2RBC (left panel), Po2InterRBC (middle panel), and Po2Mean (right panel). 5 mm Hg bin width. For all plots n = 5 mice.
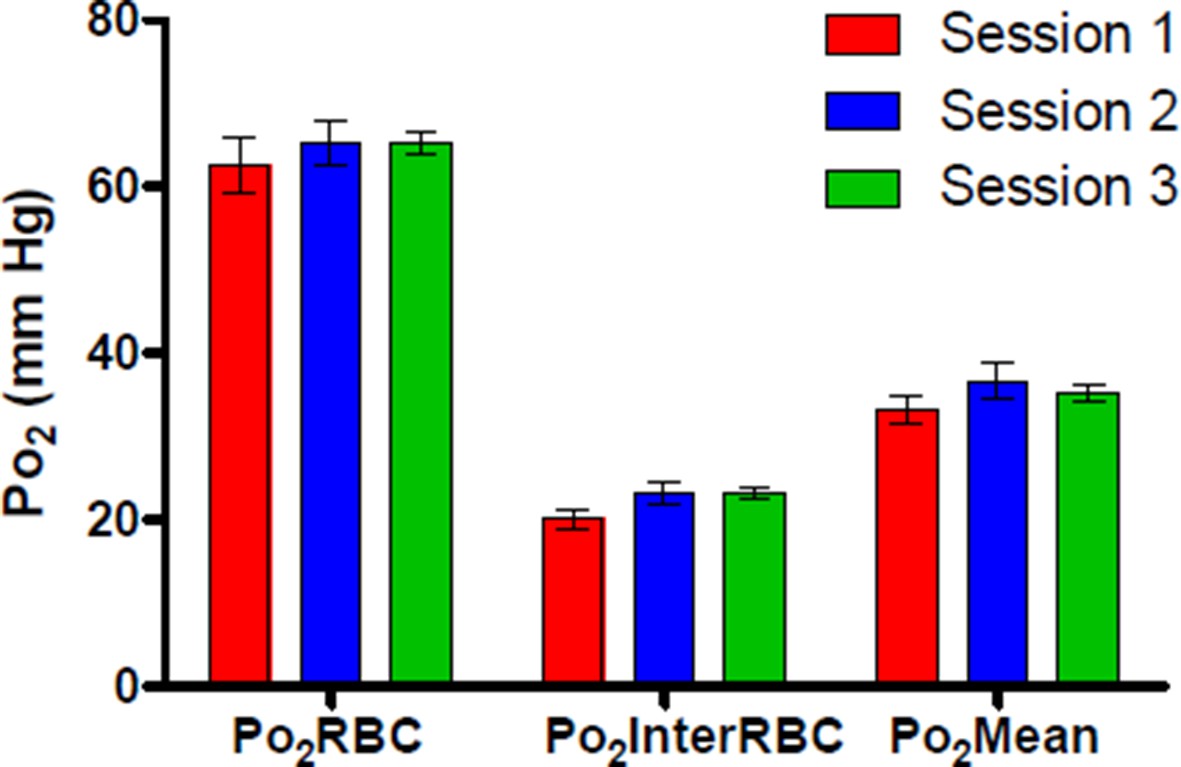
Figure 2
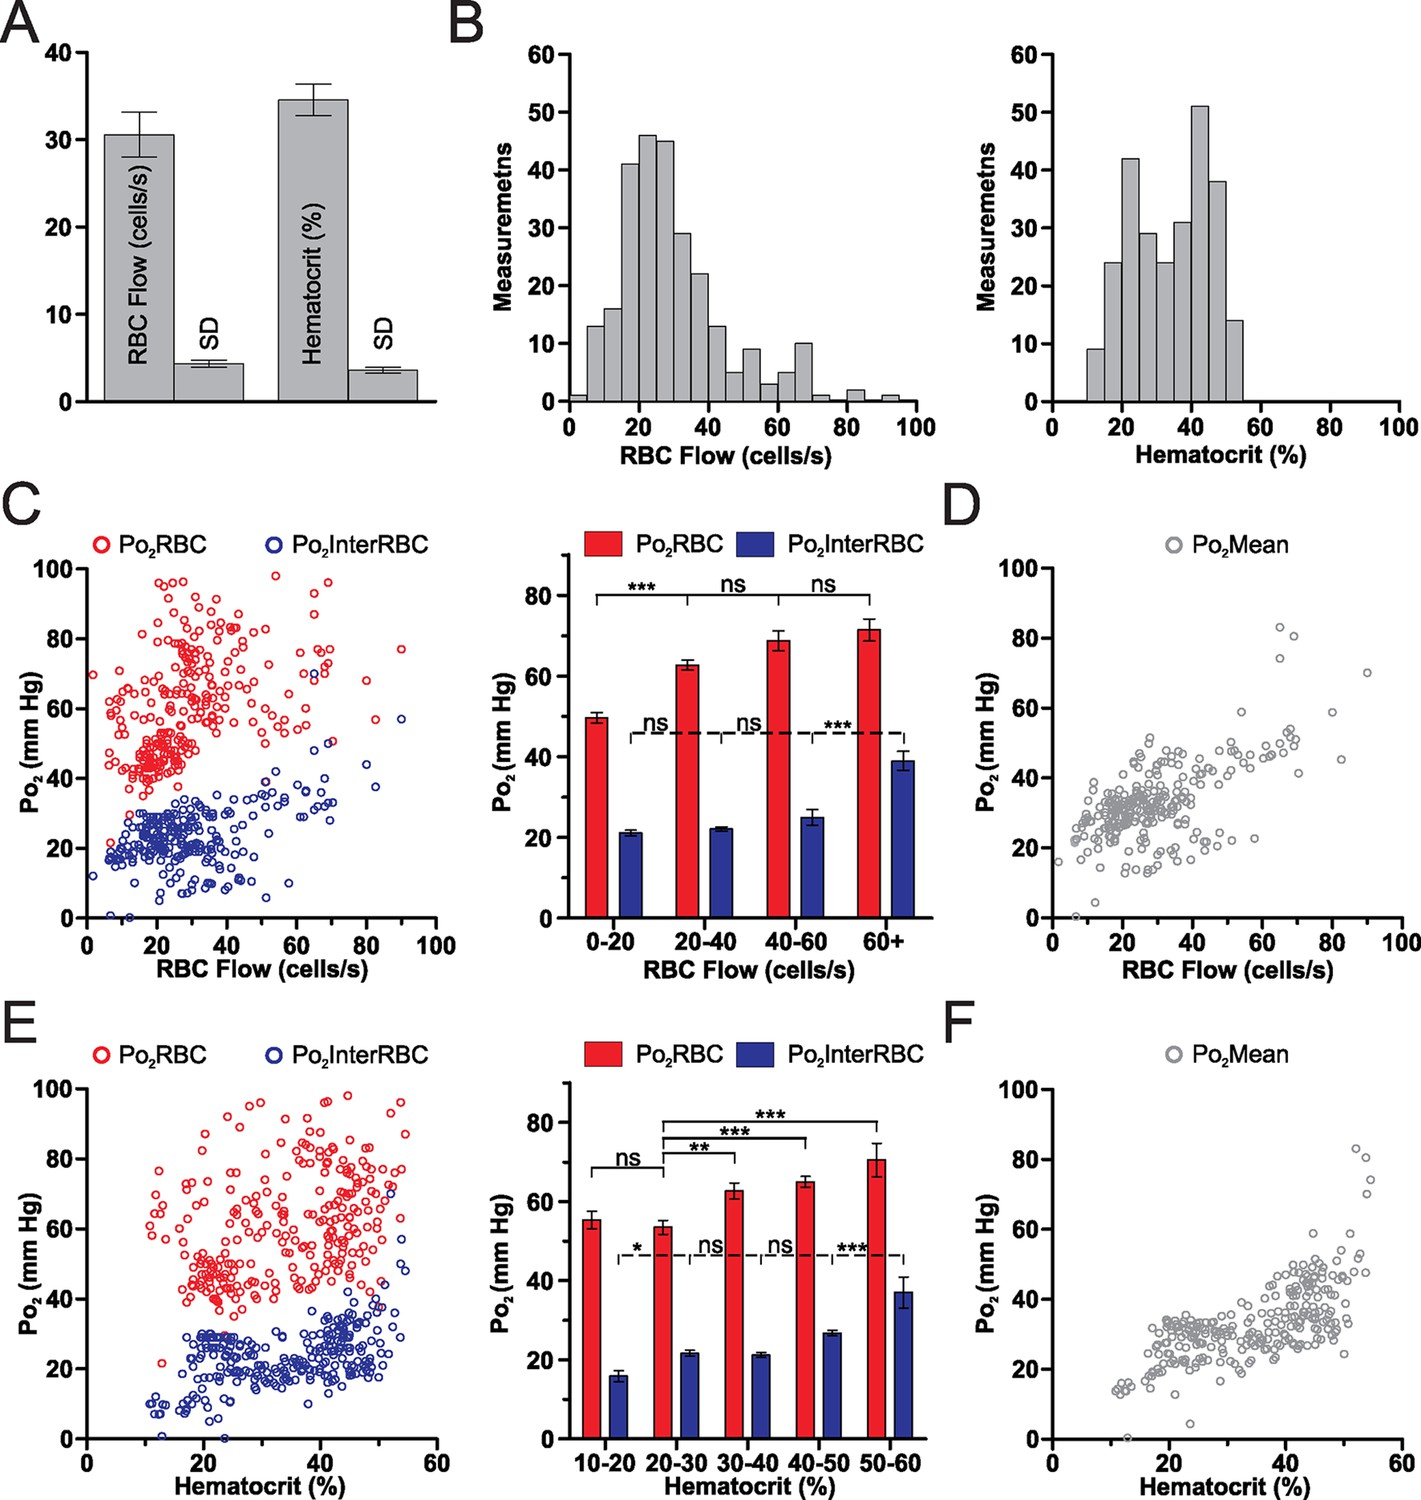
Relationships of capillary blood flow and hematocrit to Po2 values, in the olfactory bulb glomerular layer of the awake mouse.
(A) RBC flow and hematocrit calculated from the mean values of each capillary (n = 38). SD (the average of the SD values for each capillary, presented as mean standard deviation ± SEM) illustrates the fluctuations of RBC flow and hematocrit in each capillary. (B) Frequency distributions of RBC flow and hematocrit (5% bin). (C) Distribution of all Po2RBC and Po2InterRBC measurements as a function of RBC flow. Note that the Po2InterRBC is independent of RBC flow below 60 cells/s while Po2RBC increases with RBC flow below 40 cells/s. (D) Po2Mean as a function of RBC flow. (E) Distribution of Po2RBC and Po2InterRBC as a function of hematocrit. Po2InterRBC is independent of hematocrit from 20 to 50%. Po2RBC increases with hematocrit at low values. (F) Po2Mean as a function of hematocrit. Bar graph data presented as mean ± SEM. *p<0.05, **p<0.01, ***p<0.001. Kruskal-Wallis test with 2-tailed Dunn's multiple comparison post-hoc test. For all plots n = 5 mice.
Figure 3 with 1 supplement
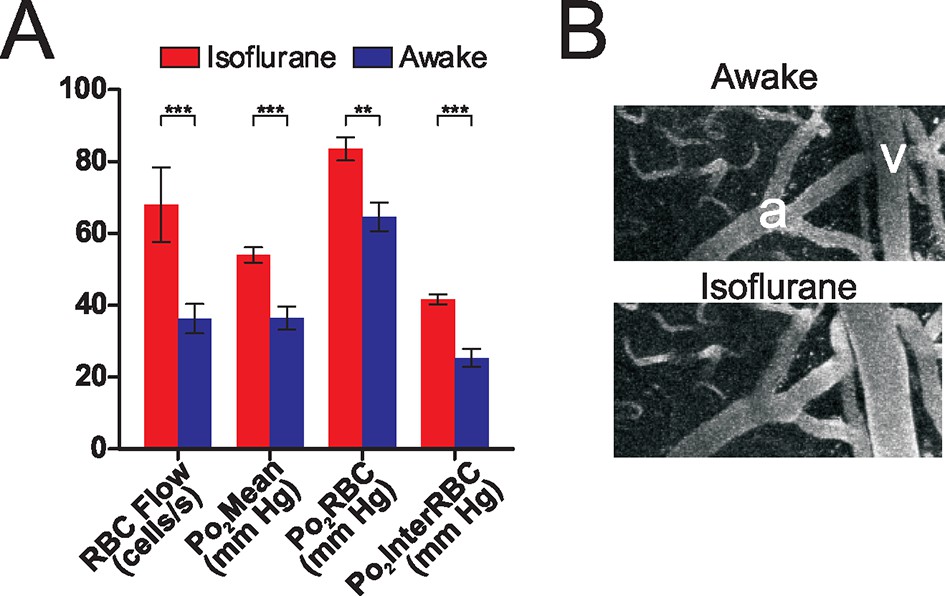
Isoflurane changes the brain oxygenation state.
Po2 and RBC flow were compared in the same sets of olfactory bulb glomerular layer capillaries when the animal was awake, and when the animal was anesthetized with isoflurane (0.75%, delivered in air, no oxygen added). (A) Isoflurane anesthesia increased all RBC flow and Po2 values as compared to the awake state (n = 142 measurements in each condition, 16 capillaries from 3 mice). Bar graph data presented as mean ± SEM., ***p<0.001, paired 2-tailed Wilcoxon signed rank test. (B) Isoflurane anesthesia induced a large dilation of pial vessels (a: artery, v: vein). See also Figure 3—figure supplement 1.
Figure 3—figure supplement 1
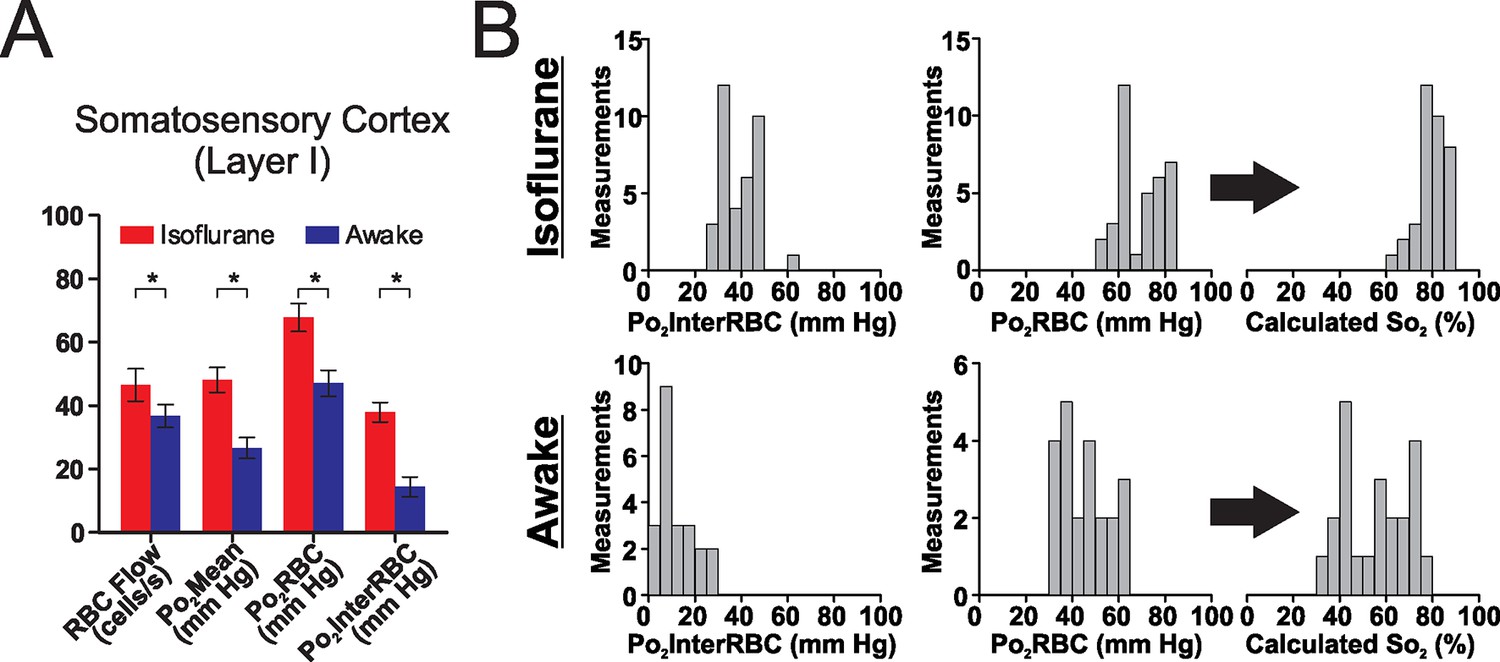
Isoflurane alters oxygenation in the somatosensory cortex.
(A) As in the glomerular layer, isoflurane anesthesia (0.75% delivered in 21% O2 air) increases Po2 and RBC flow in layer I capillaries in the somatosensory cortex relative to the awake state. (B) This isoflurane-induced increase in Po2 was associated in a right-shift in the frequency distribution of measured Po2Mean, Po2InterRBC and Po2RBC along with that of estimated So2. *p<0.05, paired, 2-tailed, Wilcoxon signed rank test. n = 36 measurements under isoflurane and 22 in the awake state, from five capillaries.
Figure 4
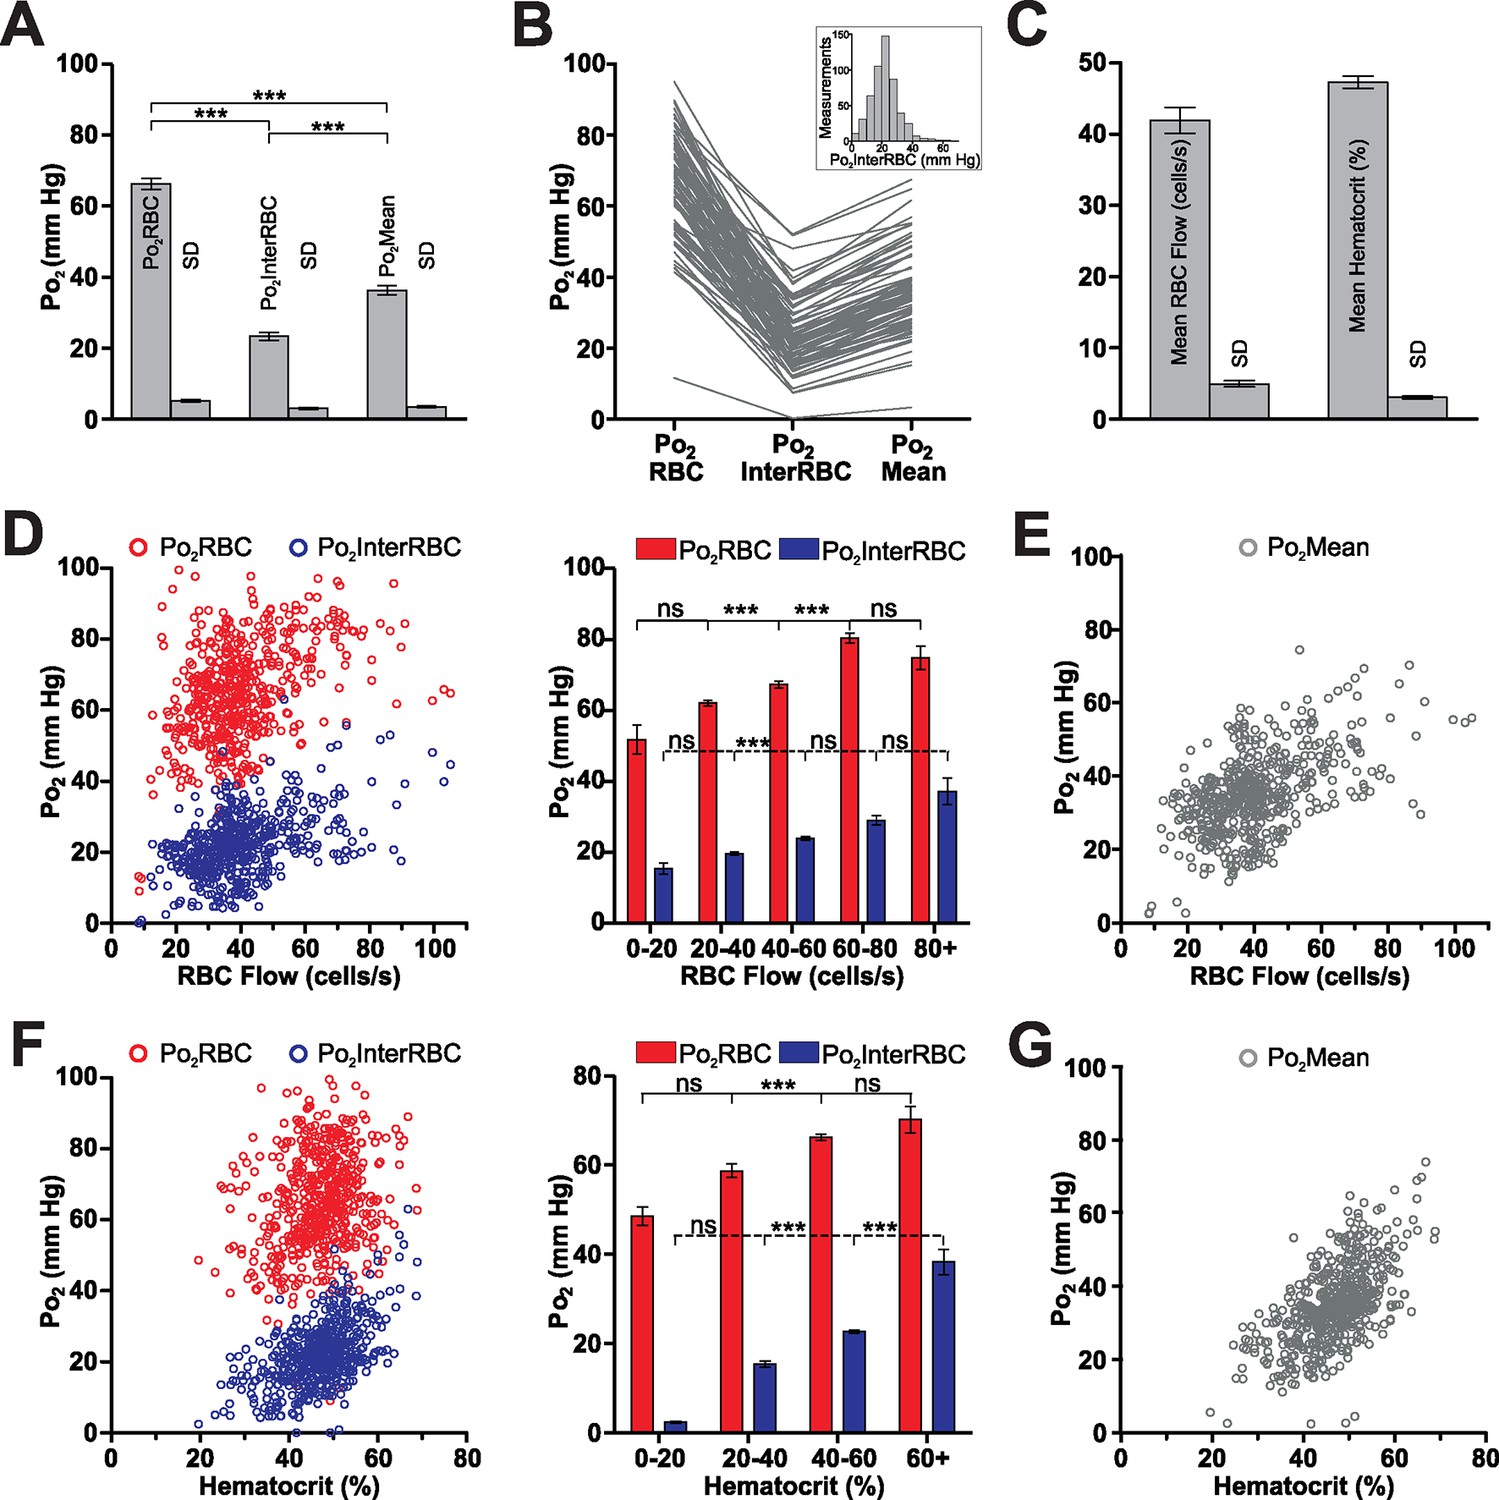
The relationship of Po2 to RBC flow and hematocrit in the somatosensory cortex of the awake mouse.
(A) Average values and SD of Po2 parameters in somatosensory cortex capillaries, calculated from the mean values from each capillary (81 capillaries, 528 measurements, SD = the average of the SD values for each capillary, presented as mean standard deviation ± SEM). (B) Distribution of all capillary Po2 values averaged in (A). Frequency distribution histogram of local tissue Po2 (Po2InterRBC) in inset. 5 mm Hg bin. (C) Average values and SD of RBC flow and hematocrit calculated from the mean values from each capillary. (D) Distribution of all Po2RBC and Po2InterRBC measurements as a function of RBC flow. Note that for most values (from 20 to 60 cells/s), both Po2InterRBC and Po2RBC increase with RBC flow. (E) Po2Mean as a function of RBC flow. (F) Distribution of all Po2RBC and Po2InterRBC measurements as a function of hematocrit. For most values (from 20 to 60% ), both Po2InterRBC and Po2RBC increase with hematocrit. (G) Po2Mean as a function of hematocrit. Bar graph data presented as Mean ± SEM. *p<0.05, **p<0.01, ***p<0.001. Kruskal-Wallis test with 2-tailed Dunn's multiple comparison post-hoc test.
Figure 5
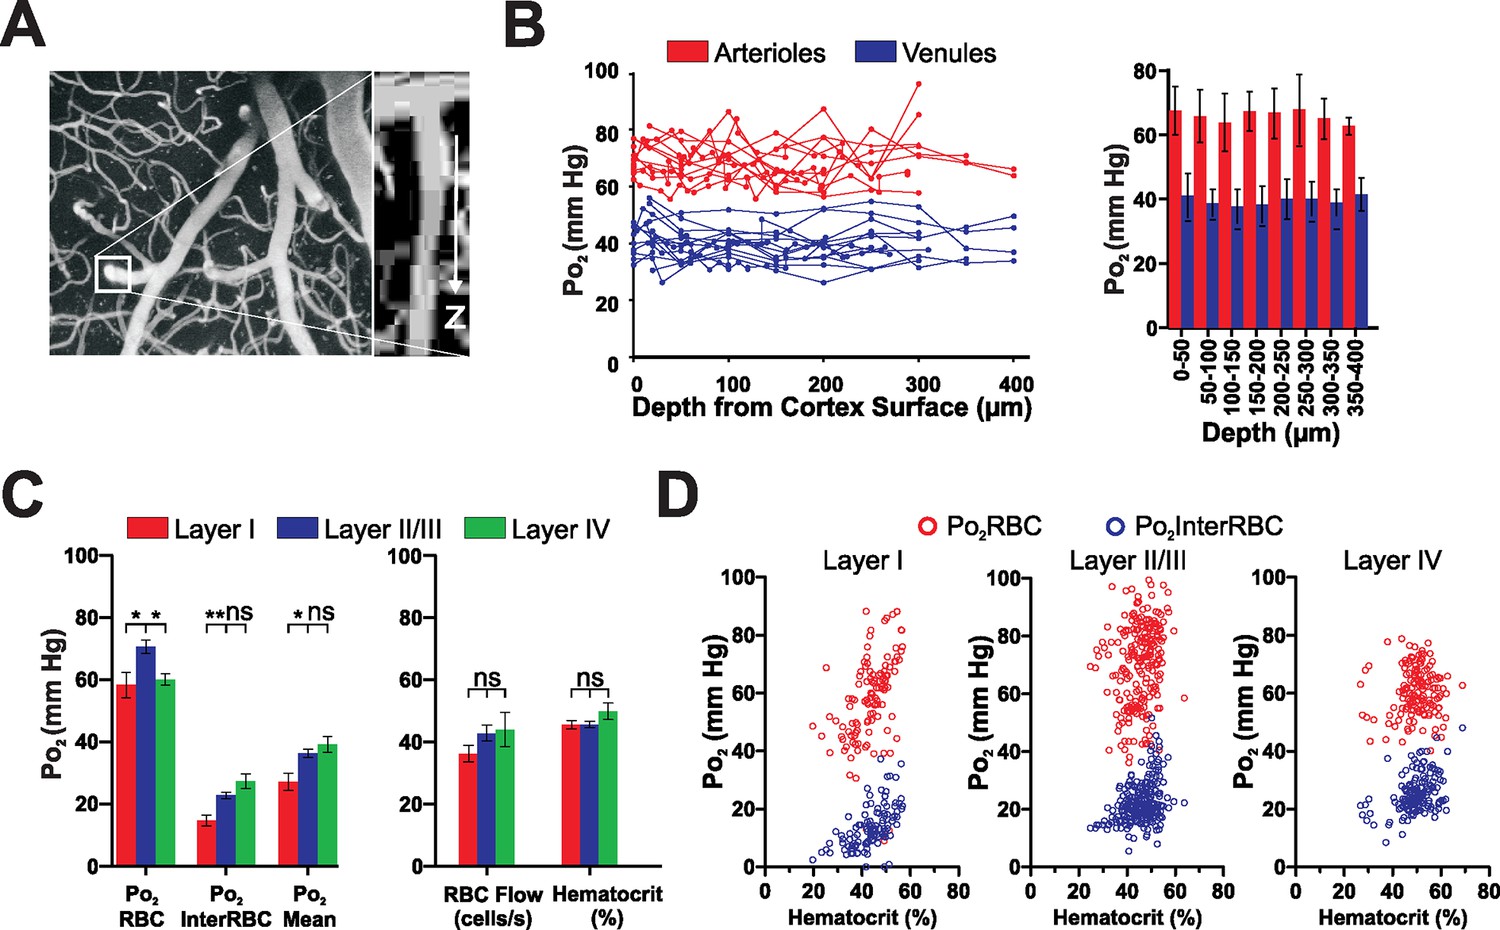
Depth profiles of vascular and local tissue oxygenation in the somatosensory cortex of the awake mouse.
(A) Left panel, maximum intensity projection of superficial portion of the vasculature of the somatosensory cortex, with boxed area highlighting a penetrating arteriole shown in the XZ projection (right panel). (B) Left panel, Po2 values in penetrating arterioles (red) and venules (blue) as a function of depth from the cortical surface. Each line represents a single vessel. Right panel, mean of all Po2 values recorded from vessels as a function of depth. Note the absence of Po2 gradients with depth (50 µm bin size, 136 measurements in 11 arterioles, 148 measurements in 14 venules, from 6 mice.) Data presented as mean ± SD (C) Comparison of Po2 values (left panel), RBC flow and hematocrit (right panel) in layers I, II/III and IV. Note that capillary Po2Mean and Po2InterRBC are higher in layers II/III and IV than in layer I, although there are no significant differences in either blood flow parameter. Data presented as mean ± SEM. * p<0.05, **p<0.01, Kruskal-Wallis test with 2-tailed Dunn's multiple comparison post-hoc test. n = Layer I: 113 measurements in 17 capillaries, Layer II/III: 230 measurements in 41 capillaries, Layer IV: 151 measurements in 15 capillaries (D) Po2RBC and Po2InterRBC as a function of hematocrit in layers I, II/III and IV.
Figure 6
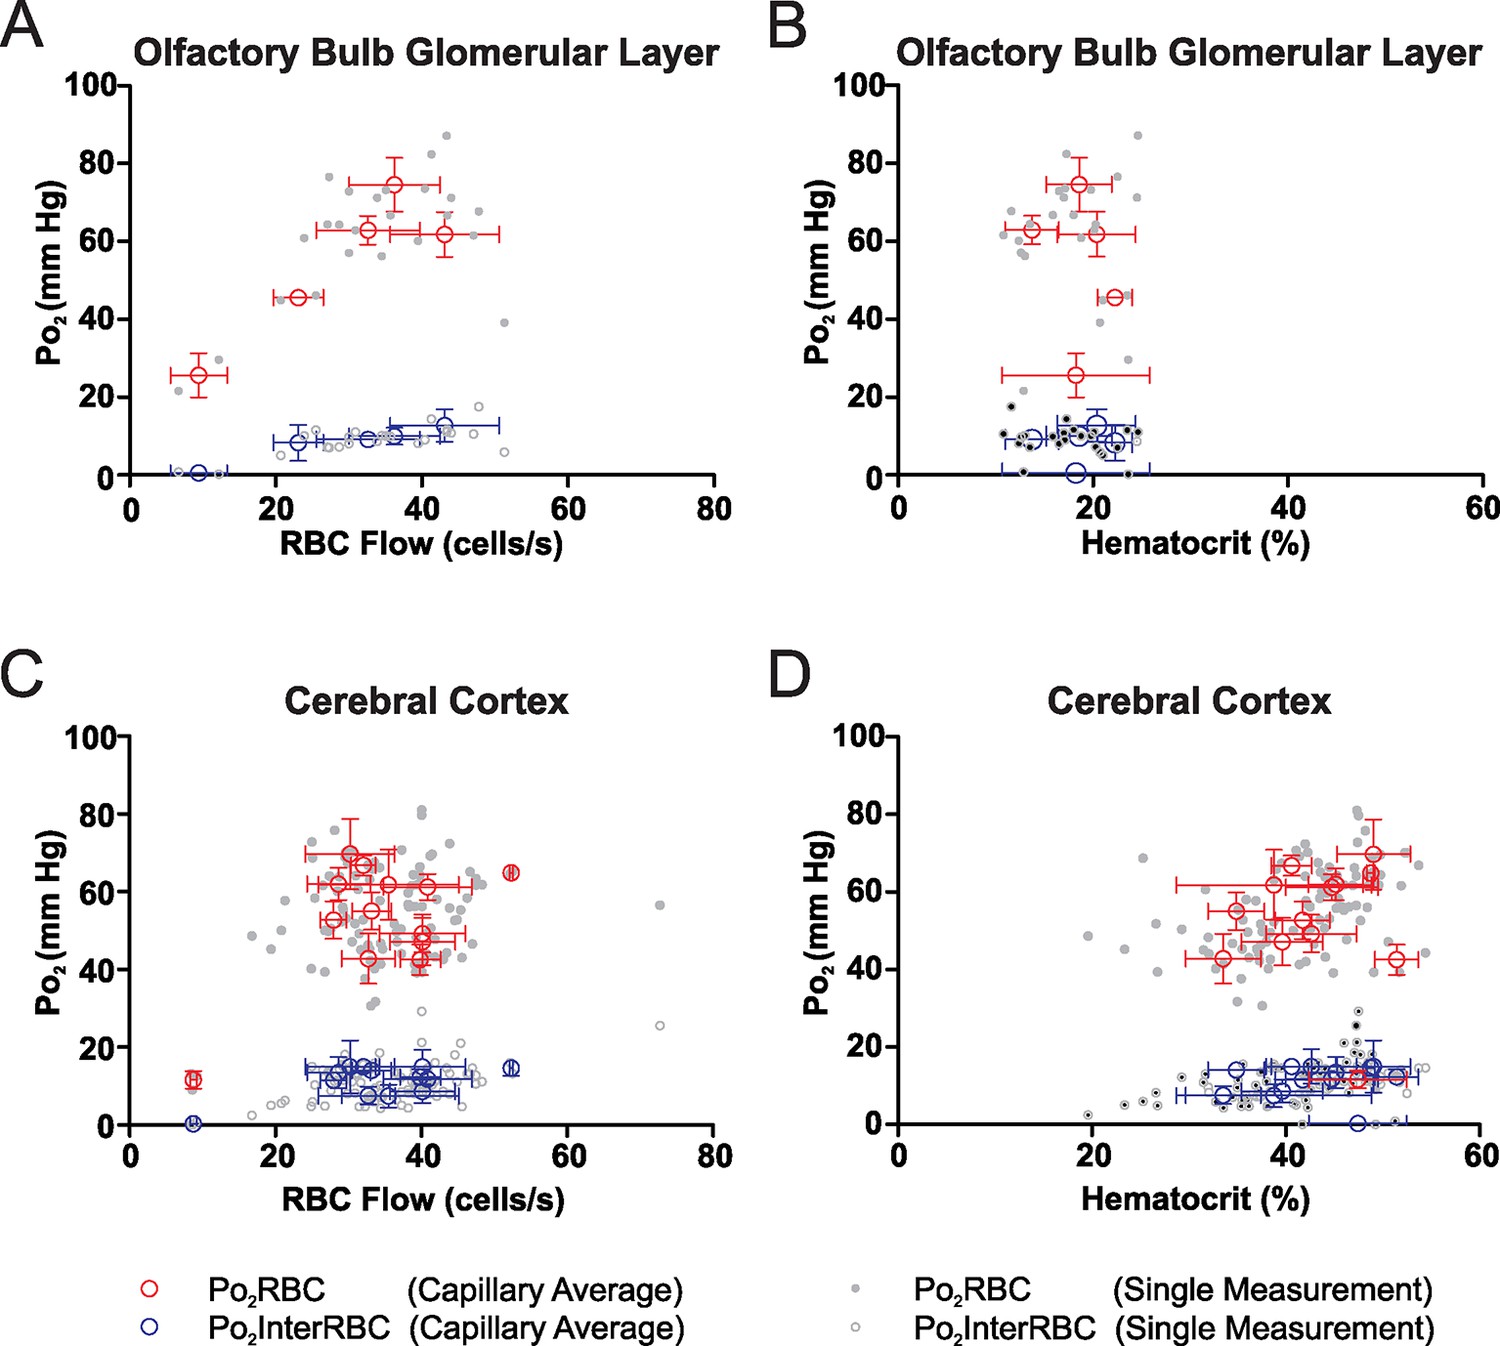
In the awake mouse, low interstitial Po2 in the olfactory bulb glomerular layer is associated with low hematocrit capillaries.
Po2 values from all glomerular layer capillaries with average Po2InterRBC values of <15 mm Hg (n = 24 measurements in capillaries) are plotted as a function of RBC flow (A) and hematocrit (B). The RBC flow rates in these capillaries were distributed across a wide range, whereas in all cases capillary average hematocrit was <25%, suggesting that, in the glomerular layer, areas of low interstitial Po2 are supplied by capillaries with relatively low hematocrit values (hematocrit of these capillaries = 18.6 ± 1.4%, n = 5; hematocrit of all other capillaries = 37 ± 1.7%, n = 33; p = 0.002, unpaired t-test. mean ± SEM). Conversely, cortical capillaries with average Po2InterRBC <15 mm Hg (n = 13 capillaries, 101 measurements) had wide ranges of both RBC flow (C) and hematocrit (D). However, the majority (10 of 13) of these capillaries were located in layer I. In all plots, single measurement values and mean ± SD of all measurements in each capillary shown.
Figure 7
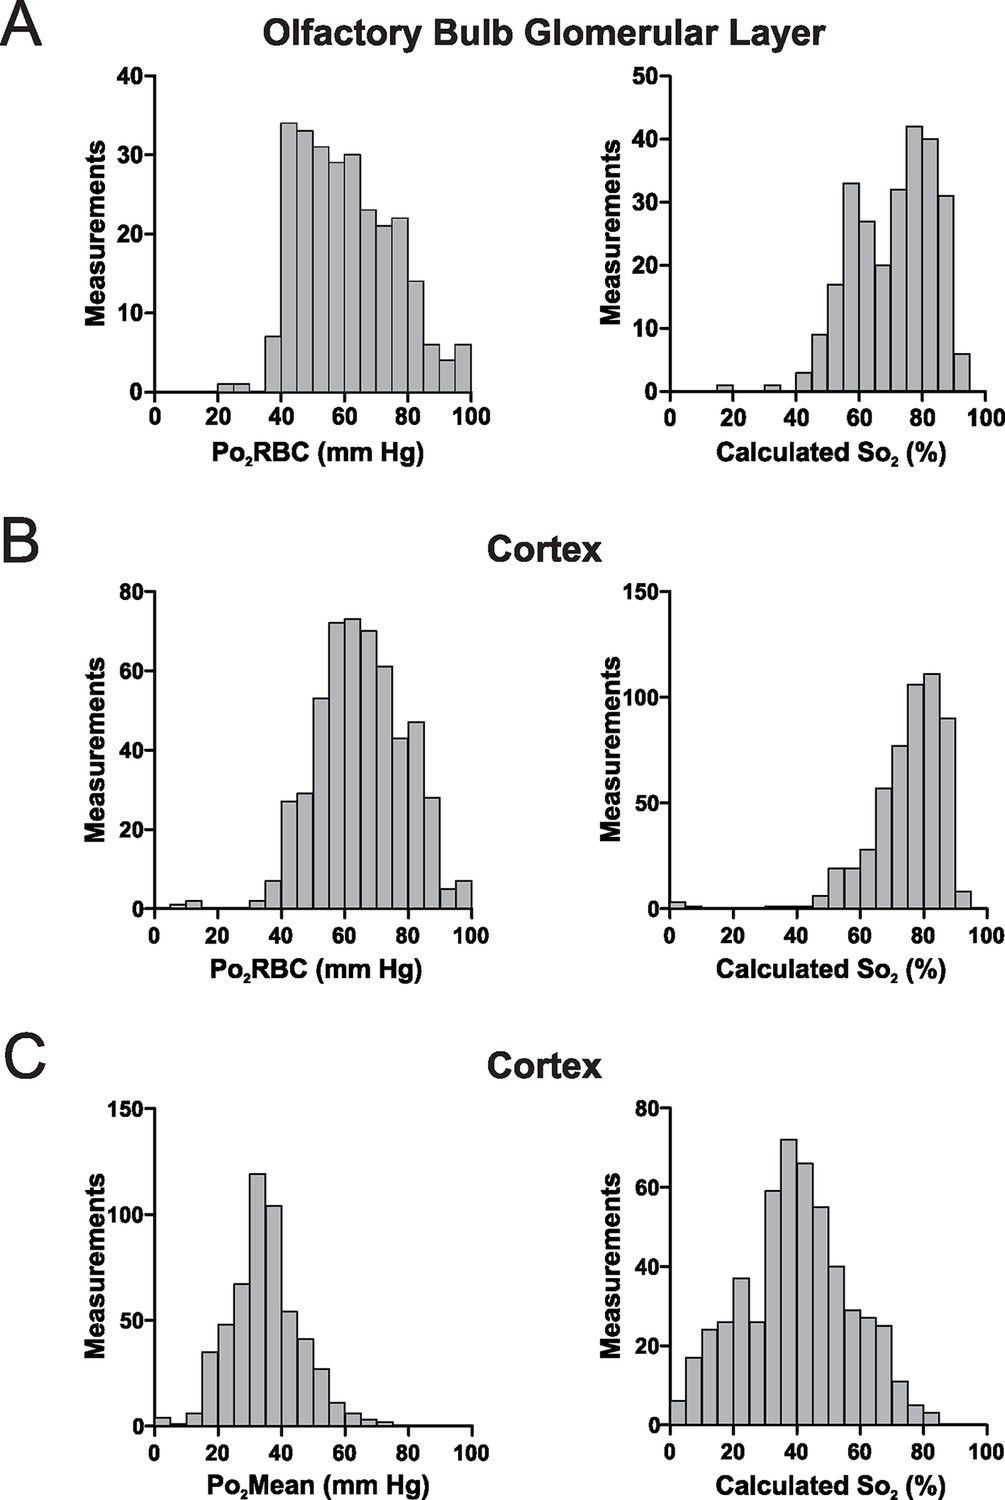
In the awake mouse, the majority of hemoglobin in cerebral capillaries is oxygenated.
(A) Left panel, frequency distribution of Po2RBC values measured in the glomerular layer of awake mice, which were used to compute So2 values (right panel). (B) Equivalent Po2RBC (left panel) and So2 distributions (right panel) from the cerebral cortex. In both structures > 90% of the measurements have So2 values of >50% (94.7% and 98.5% of measurements in the glomerular layer and the cortex respectively) with ~60% of So2 values in the cortex being >75%. (C) Left panel, frequency distribution of Po2Mean values from cerebral cortex capillaries, with the So2 distribution that would be computed were these lower Po2 values considered to represent those present at the hemoglobin molecules in RBCs (right panel). Glomerular layer: n = 262 measurements in 38 capillaries. Somatosensory cortex: n = 528 measurements from 81 capillaries. Bin size 5 mm Hg and 5% for Po2 and So2 respectively.
Author response image 1
Download links
A two-part list of links to download the article, or parts of the article, in various formats.
Downloads (link to download the article as PDF)
Open citations (links to open the citations from this article in various online reference manager services)
Cite this article (links to download the citations from this article in formats compatible with various reference manager tools)
Mapping oxygen concentration in the awake mouse brain
eLife 5:e12024.
https://doi.org/10.7554/eLife.12024


