A family of photoswitchable NMDA receptors
- University of California, Berkeley, United States
- Université de Nice Sophia Antipolis, France
- University of Munich, Germany
- Lawrence Berkeley National Laboratory, United States
Figures
Figure 1 with 3 supplements
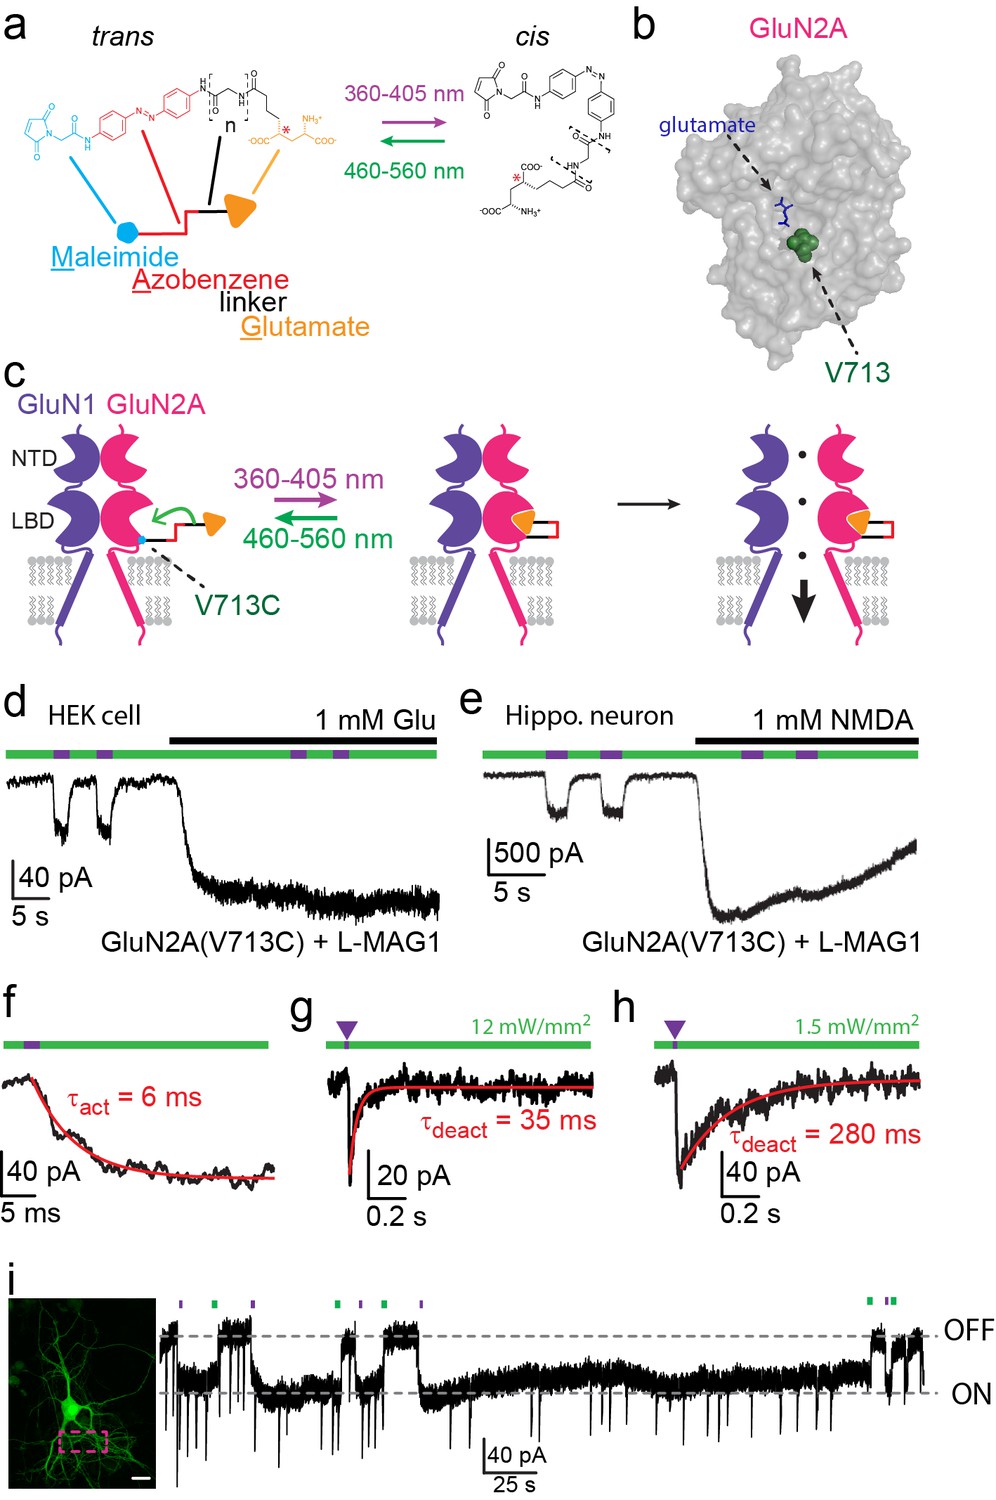
Photo-agonism of NMDA receptors in HEK293 cells and hippocampal neurons.
(a) MAG photoswitches showing chemical structure and cartoon depiction. MAG0 and MAG1 differ in length (brackets, n = 0, 1) (Gorostiza et al., 2007), whereas L-MAG and D-MAG (Levitz et al., 2013) differ in stereochemistry (red asterisk). Illumination with 360–405 nm light photoisomerizes MAG from the elongated trans- azobenzene (red) configuration to the bent cis configuration; illumination at ~460–560 nm returns MAG to the trans isomer, as does slow thermal relaxation in the dark. The maleimide group (cyan) allows attachment to an engineered cysteine. (b) Space filled, crystal structure of GluN2A’s Ligand Binding Domain (LBD, PDB-2A5S (Furukawa et al., 2005)) showing the site of glutamate binding (blue sticks) as well as the nearby V713 position (green spheres), which was mutated to a cysteine to which maleimide tethers and yields photo-agonism. (c) Cartoon depiction of a photo-agonized NMDA receptor showing, for simplicity, only one of the two LiGluN1a-wt subunits (purple) co-assembling with one of the two engineered LiGluN2A subunits (pink). The MAG photoswitch (color-coded sticks; as shown in a) is covalently attached to the LBD (cyan dot) to endow the channel with light-sensitivity. The cis configuration allows docking of the glutamate headgroup (orange triangle) into the binding pocket (middle cartoon), inducing LBD closure and channel opening (rightward cartoon). For simplicity the ligand of the GluN1 subunit (glycine) is not shown. Light- and glutamate/NMDA-induced currents in (d) HEK293 cells or (e) hippocampal neurons (from wt rats) expressing GluN1a-wt and GluN2A(V713C) labeled with L-MAG1. Photo-current is elicited by 380 nm light (~3 mW/mm2) (violet bar) and turned off by 500 nm light (~3 mW/mm2) (green bar). Full activation is induced by application of 1 mM glutamate or NMDA (black bar). (f) Representative trace (averaged from 4 consecutives sweeps) for fast MAG photoisomerization by an intense 375 nm light pulse (2 ms at ~20 W/mm2) leading to rapid activation and opening of GluN2A(V713C) (red trace is a monoexponential fit, τ indicated). (g-h) Representative traces (2 cells) for tuning the off kinetics of the photo-current by applying high intensity (~12 mW/mm2, average of 8 consecutive sweeps) for fast deactivation (g) or low green light intensity (~1.5 mW/mm2, average trace from 4 consecutives sweeps) for slow deactivation (h). (i) Representative image (left, scale bar 10 µm) and trace (right) showing the bistability of the photoswitch in a cultured hippocampal neurons (from wt rats) transfected with GluN2A(V713C)-only. The cis state of MAG is photo-stable, so that following illumination (targeted line-scanning) by a brief 405 nm laser pulse (2 s) over a large region of the dendritic tree (dashed violet box) induces an inward current (black trace, ON) that persists in the dark without visible decay for tens of seconds (see also Figure 1—figure supplement 3). Likewise, following closure of the channel (black trace- OFF) with brief green light (488 nm) illumination (2 sec), the channel remains shut and no current is observed unless triggered anew by violet light. Spontaneous EPSCs are observed during the opening and closing of the channel.
Figure 1—figure supplement 1
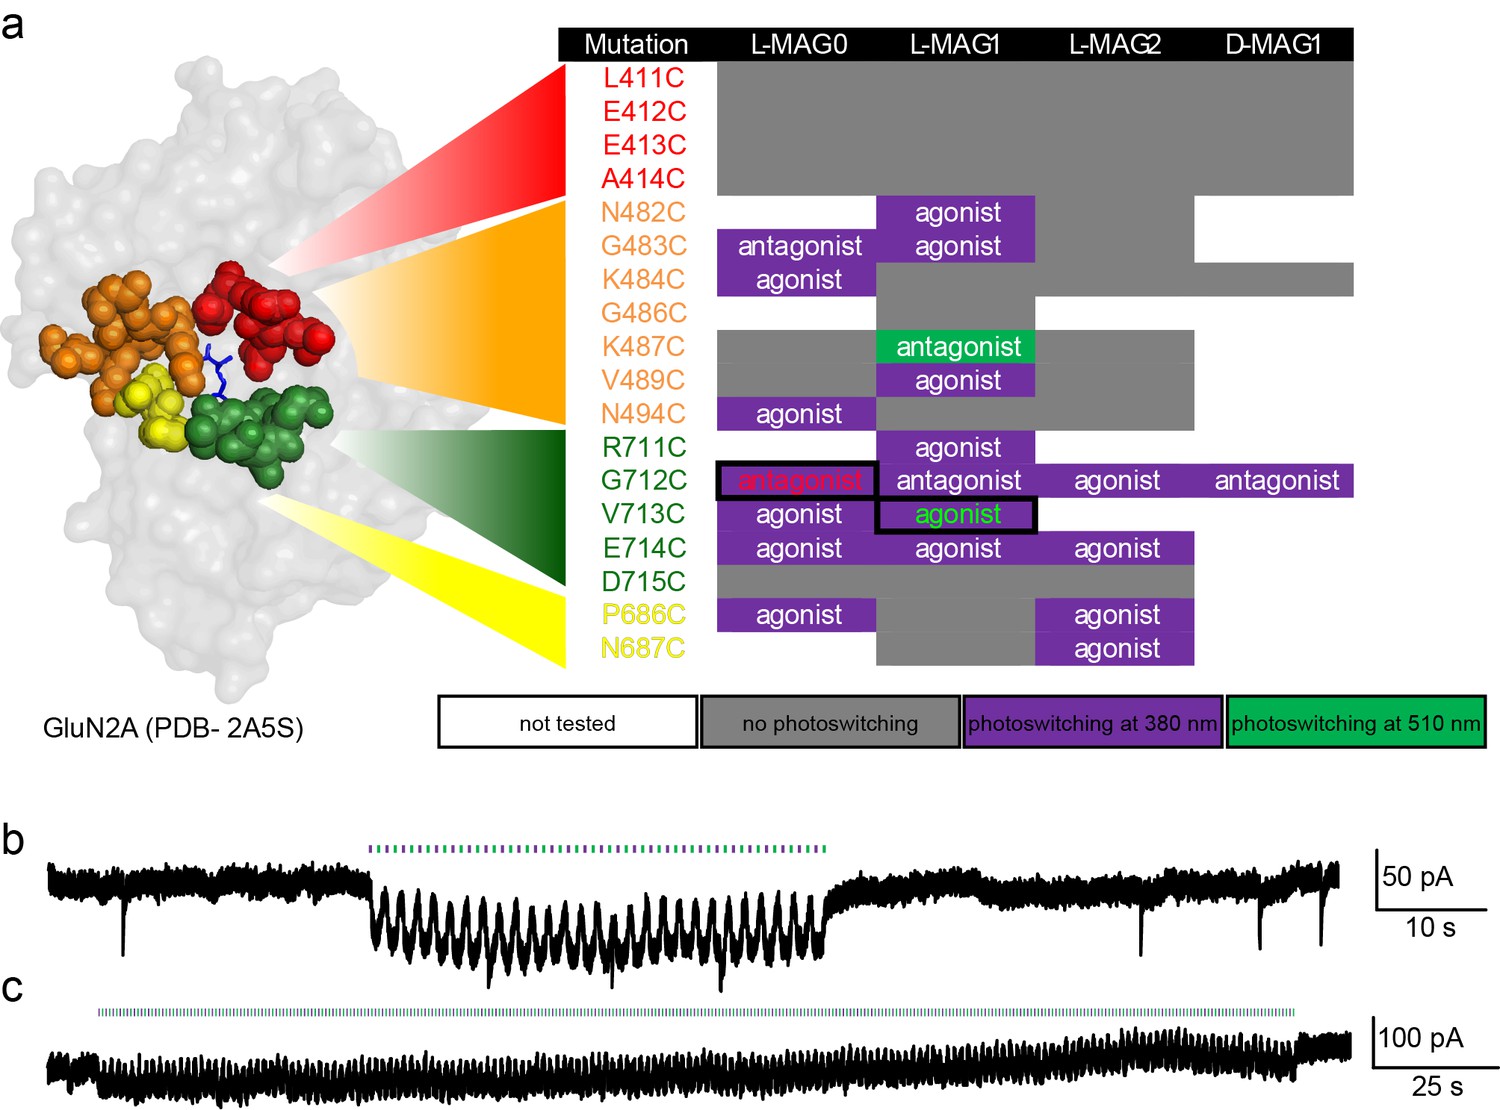
Screen of GluN2A cysteine positions and MAG variants.
(a) Amino acids near the glutamate binding site of GluN2A were individually replaced with cysteine by site-directed mutagenesis, co-transfected with wild-type GluN1a into HEK293 cells, and tested with several MAG variants: L-MAG0, L-MAG1, L-MAG2 and D-MAG1, previously used (Levitz et al., 2013; Volgraf et al., 2006). Photo-responses were detected by calcium-imaging with Fura2-AM and characterized as agonist or antagonist by photo-switching in the absence and presence of 1 mM glutamate, respectively. Most photo-responses, albeit small, were detected during illumination with 380 nm light (violet), one during illumination at 500 nm (green), and several exhibited no photo-response (grey). The colors in the first column correspond to the sites group-colored in the structure of GluN2A’s LBD on the left (PDB-2A5S [Furukawa et al., 2005]). The largest agonistic and antagonistic photo-responses yielded by violet light illumination (emphasized by solid boxes and colored fonts) were GluN2A(V713C) conjugated to L-MAG1 and GluN2A(G712C) conjugated to L-MAG0, respectively, and were subsequently scrutinized using patch clamping techniques (examples shown in b, c and see main figures). (b-c) Repeatable manipulation of photo-switching speed. Near-UV and green light illumination was switched at varying frequencies to mimic different modes of transmissions and or experimental paradigms. Representative traces from cultured hippocampal neurons (from wt rats) showing the versatility of the photo-switching technique and responses in neurons. Illumination at 405 nm (violet bars) is used to open the channels (downward inflection of the current), whereas 488 nm (green bars, upward inflection of the current) to close them. This could be done repeatedly at low (b) or high switching frequency (c).
Figure 1—figure supplement 2
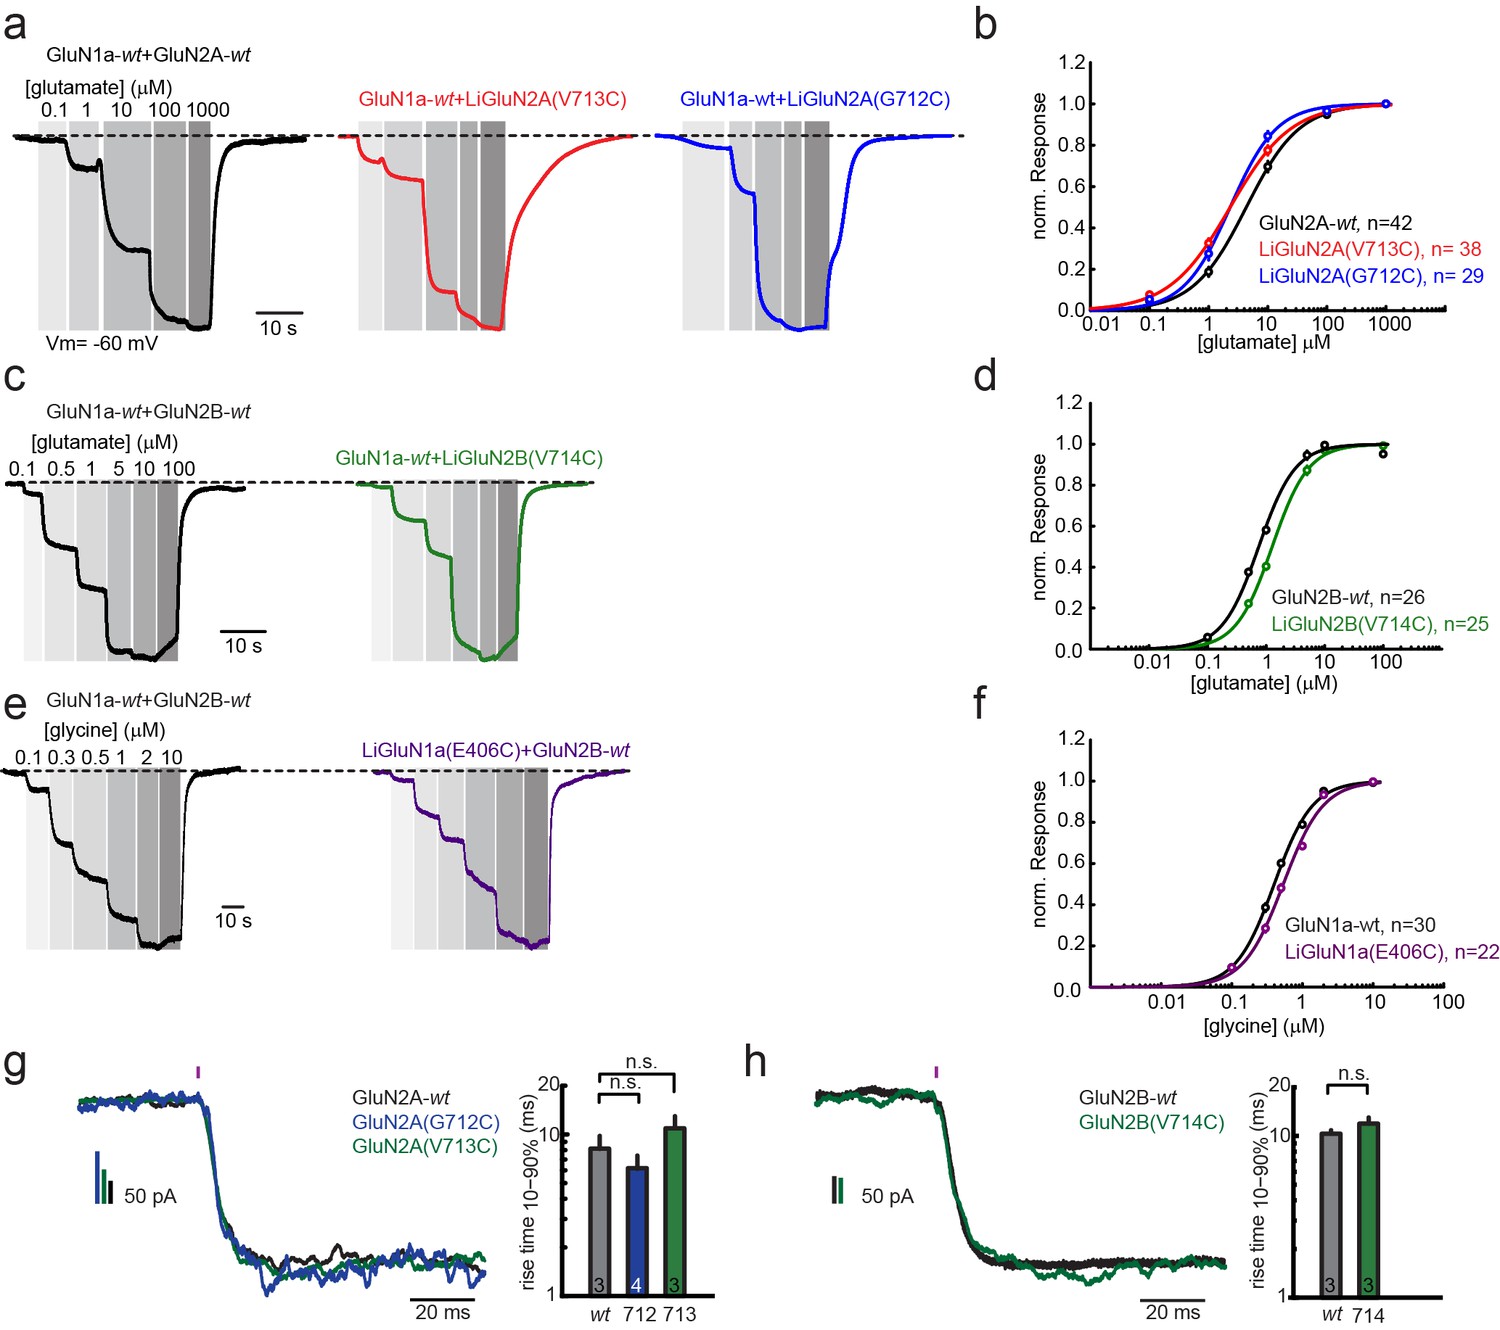
Pharmacological characterization of GluN2A(V713C), GluN2A(G712C), GluN2B(V714C) and GluN1a(E406C).
Wild-type (wt) and engineered GluNRs were expressed in Xenopus oocytes and ligand-induced currents were recorded by two-electrode voltage-clamp (Vm = −60 mV, 0 Mg2+). (a) GluN1a-wt and GluN2A (wt, V713C or 712C) currents (normalized) in response to increasing glutamate concentrations alone (black, red, blue, respectively), summarized in (b). (c) GluN1a-wt and GluN2B (wt or V714C) currents (normalized) in response to increasing glutamate concentrations alone (black, green respectively), summarized in (d). (e) GluN1a (wt or E406C) and GluN2B-wt currents (normalized) in response to increasing glycine concentrations alone (black, purple, respectively), summarized in (f). (g-h) Activation kinetics of GluNRs containing the LiGluNx subunits. Activation kinetics were assessed by fast uncaging of 500 µM MNI-glutamate over the entire HEK293 cells (pink bar- 1 ms pulse, 375 nm, ~50 W/mm2) of (Matsuzaki et al., 2001) during whole cell voltage-clamp recording. The uncaging elicited rapid activation of wt and engineered GluN2A (V713C or G712C) subunits (g) or wt and engineered GluN2B(V714C) subunits (h) co-expressed with GluN1a-wt in HEK293 cells. In g, bar graphs show mean ± SD, n.s., not significant, one way ANOVA, Dunnet post hoc test or h; two-tailed, unpaired t-test, n shown within bars. Non parametric Mann-Whitney Rank Sum Test.
Figure 1—figure supplement 3
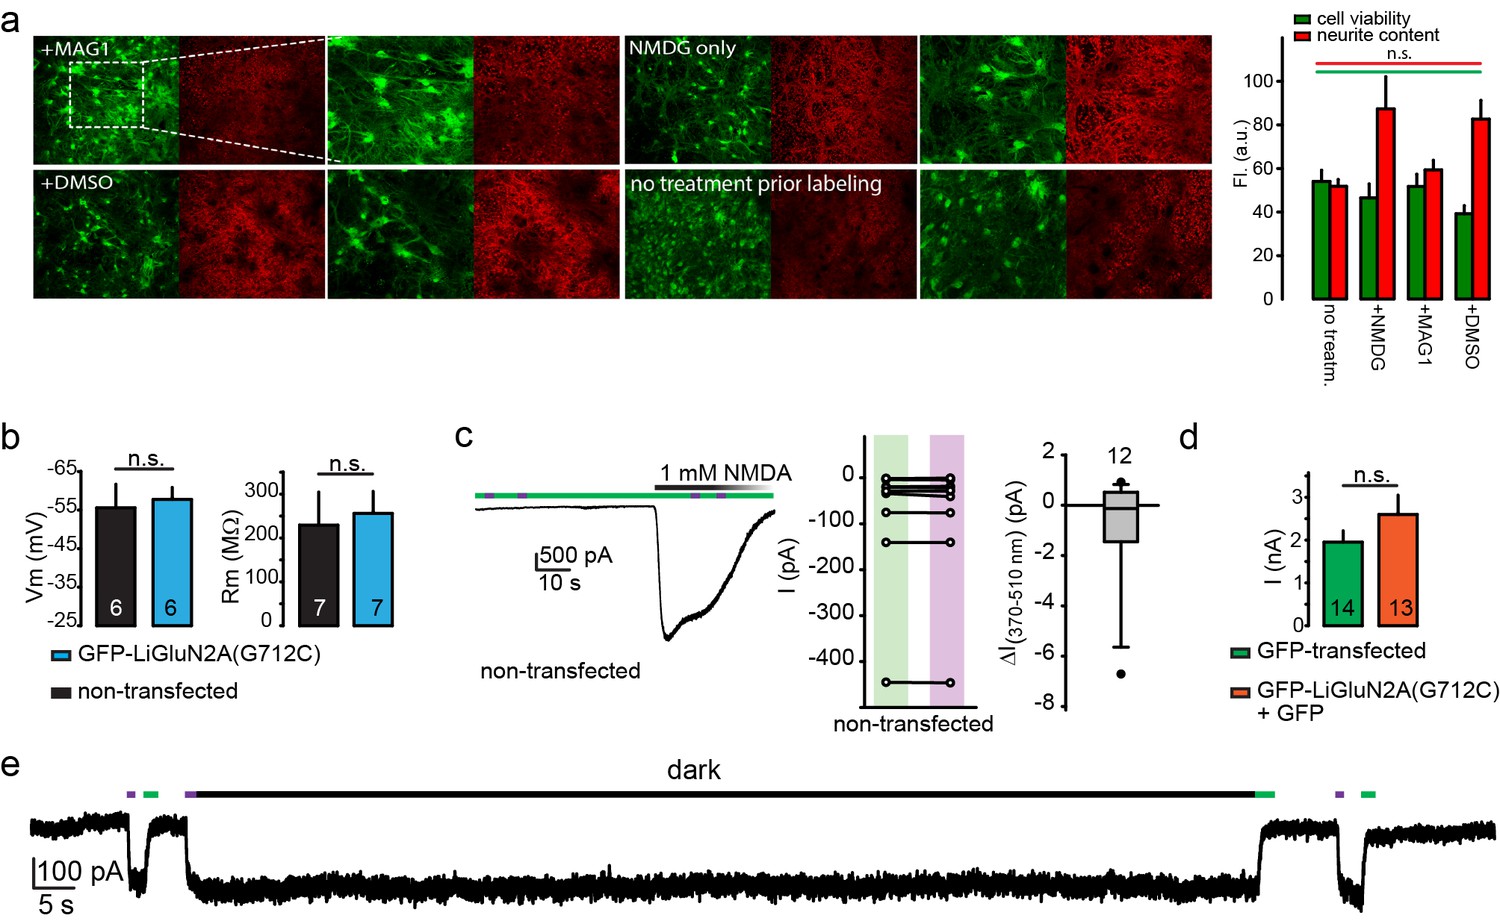
Lack of perturbation of neurons by MAG or LiGluN2A(G712C).
(a) MAG-exposure does not cause cell death or damage membrane integrity of cultured hippocampal neurons. Representative images of neurons (15 DIV) from wt animals following incubation for 45 min with either L-MAG1, 0.3% DMSO (in NMDG buffer) or NMDG buffer alone (see Materials and methods) showed no reduction in cell viability (green labeling) or membrane integrity (red labeling, neurites) compared to untreated cells (no treatment prior labeling) and Summary (right) (N coverslips= no treatment (no treatm.)- 2, +NMDG- 2, +DMSO- 5, +L-MAG1- 9). Values are mean ± SEM (n.s., not significant, one way ANOVA, post hoc Tukey test, all pairwise comparison). (b) Expression of GluN2A(G712C) combined with exposure to L-MAG0 does not perturb electrophysiological properties of neurons (from wt rats) in comparison to non-transfected neurons that were also exposed to MAG. No change in resting potential (left) or resting membrane resistance (right) was observed between non-transfected (black bars) and GFP-NR2A(G712V)-transfected (cyan bars) neurons. (c-d) No effect of MAG on native receptors or channels. (Left) Representative trace showing a non-transfected hippocampal neuron, though treated with L-MAG1, that does not display any light-responses to either 380 nm light (violet bar) or 500 nm light (green bar); before or during application (and washout) of 1 mM NMDA. Summary of the effect of light on the current in individual non-transfected neurons (exposed to L-MAG1, middle panel) and box plot representation with median and outliers (filled circles, right panel) displayed. (d) Transfection of GFP-GluN2A(G712C) (orange bar) did alter GluNR-expression compared to GFP only -transfected neurons (green bar), as no change in total current amplitude induced by 1 mM NMDA was observed. To note, these observations are in line with earlier reports demonstrating that MAG (and related PTLs) do not have non-specific action or adverse effect on neuronal physiology (Caporale et al., 2011; Lemoine et al., 2013; Levitz et al., 2013; Li et al., 2012; Szobota et al., 2007; Tochitsky et al., 2012; Volgraf et al., 2006). (e) Representative trace showing the bistability of the photoswitch. The cis state of MAG is photo-stable, so that following activation by a brief 380 nm light pulse the current persists in the dark without visible decay for 60 s (see also Figure 1i and [Reiner and Isacoff, 2014]). Statistics in panels (b) and (d) are shown as mean ± SEM, tested with two-tailed, unpaired t-test; n.s.- not-significant, n, shown within bars.
Figure 2 with 2 supplements

Rapid development of light-agonized LiGluN2B subunit, based on LiGluN2A.
(a) Partial sequence alignment (left) and overlaid crystal structures (ribbon) of the LBDs of GluN2A (blue, PDB-2A5S (Furukawa et al., 2005)) and GluN2B (grey, PDB- 4PE5 [Karakas and Furukawa, 2014]) showing the high degree of similarity between the two LBDs and the corresponding mutation in GluN2B(V714) to that of LiGluN2A(V713) (dashed circle, Valine; color-coded spheres). (b) Representative trace of photo-agonism of LiGluN2B(V714C). A HEK293 cell transfected with GluN1a and LiGluN2B(V714C), and labeled with L-MAG1, when illuminated with 380 nm light (violet bars) produces an inward photo-current that can be turned off by 510 nm light (green bars). Note the small increase in current during glutamate perfusion, suggesting that L-MAG1 may act as a stronger agonist than glutamate. (c) LiGluN2B(V714C) photocurrents are of similar size, but slower to turn off than those of LiGluN2A(V713C). Hippocampal neurons (from wt rats), transfected with either LiGluN2A (top black trace) or -2B (bottom grey trace) exhibit similar inward photo-currents, during which barrages of spontaneous EPSCs emerge (violet bars), demonstrating that photo-activation of LiGluNs receptors causes action potential firing of presynaptic neurons (see also Figure 4 and Figure 4 supplements). LiGluN2B photocurrents deactivate ~3 times slower than those of LiGluN2A (insets), as well as display consistently longer enduring observable EPSCs, summarized in d-f. (d) Box plot representation of median, outliers (filled circles) and individual data points (filled squares) are displayed. Red trace in (f) is a monoexponential fit, τ indicated. Statistics in panels are shown as Box plots of the data (not normally distributed, see Figure 2—figure supplement 2), showing median, outliers (filled circles) and individual data points (filled squares in d). Significance was tested using a nonparametric Mann-Whitney Rank Sum Test (see Materials and methods), ***p<0.001, n.s.- not-significant, n shown next to plots.
Figure 2—figure supplement 1
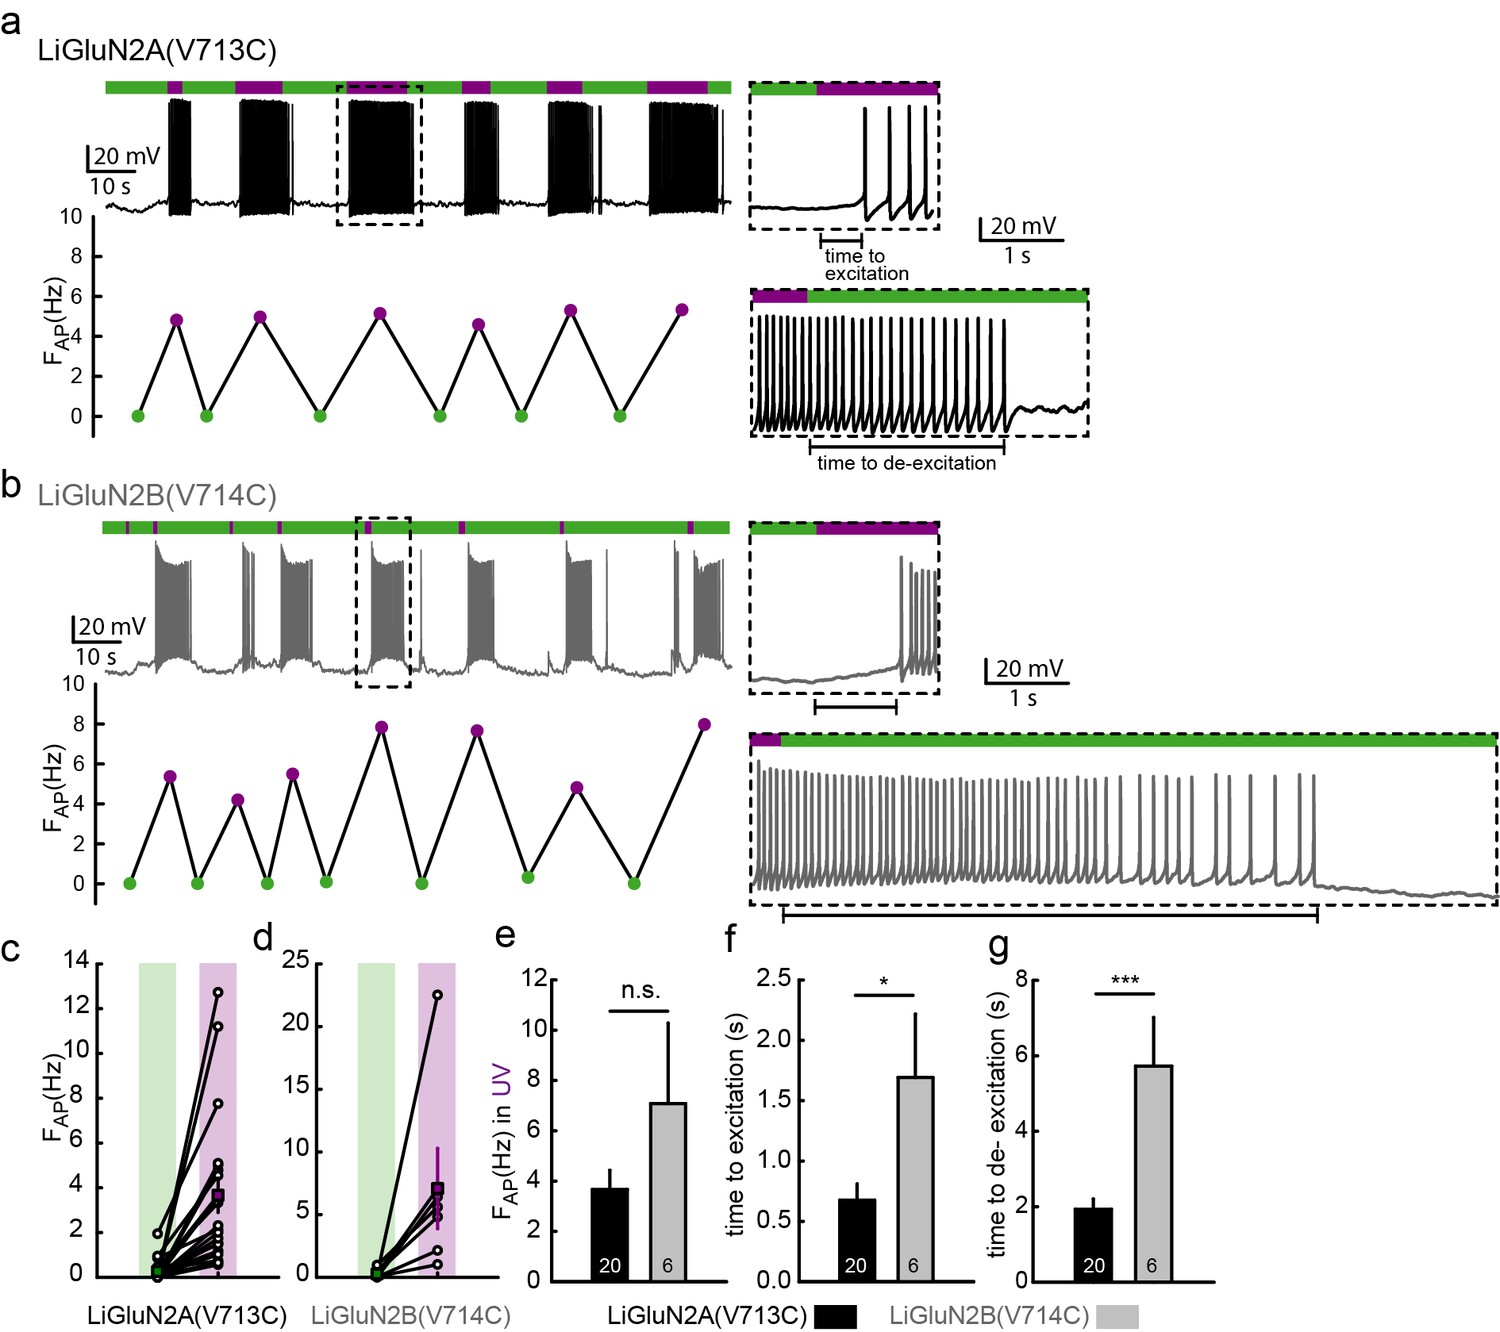
Photo-activation of LiGluN2A and -2B drives action potential firing in hippocampal neurons.
(a-b) Representative traces (current clamp) of neurons transfected with LiGluN2A(V713C) (a, black trace) or LiGluN2B(V714C) (b, grey); labeled with L-MAG1 and illuminated with 380 nm (violet bars) or 510 nm (green bars) light. Neurons (from wt rats), held at -45 to -50 mV, during green light illumination display very little activity (i.e. action potentials, AP). When switching to violet light and photo-activation of LiGluN2A or -2B, neurons display a significant increase in firing frequency (FAP, frequency plots shown below traces), summarized for LiGluN2A(V713C) or -2B(V714C) in panels (c) and (d), respectively. The lag from the appearance of violet light to initiation of an action potential (time to excitation, top insets) and lag to cessation of firing after toggling back to green light (time to de-excitation, bottom insets) are shown and summarized in panels (f) and (g) respectively. (e) No difference in firing frequency was observed between neurons transfected with LiGluN2A(V713C) or -2B(V714C). Statistics in panels are shown as mean ± SEM, tested with two-tailed, unpaired t-test; *p<0.05, ***p<0.001, n.s.- not-significant, n shown within bars.
Figure 2—figure supplement 2
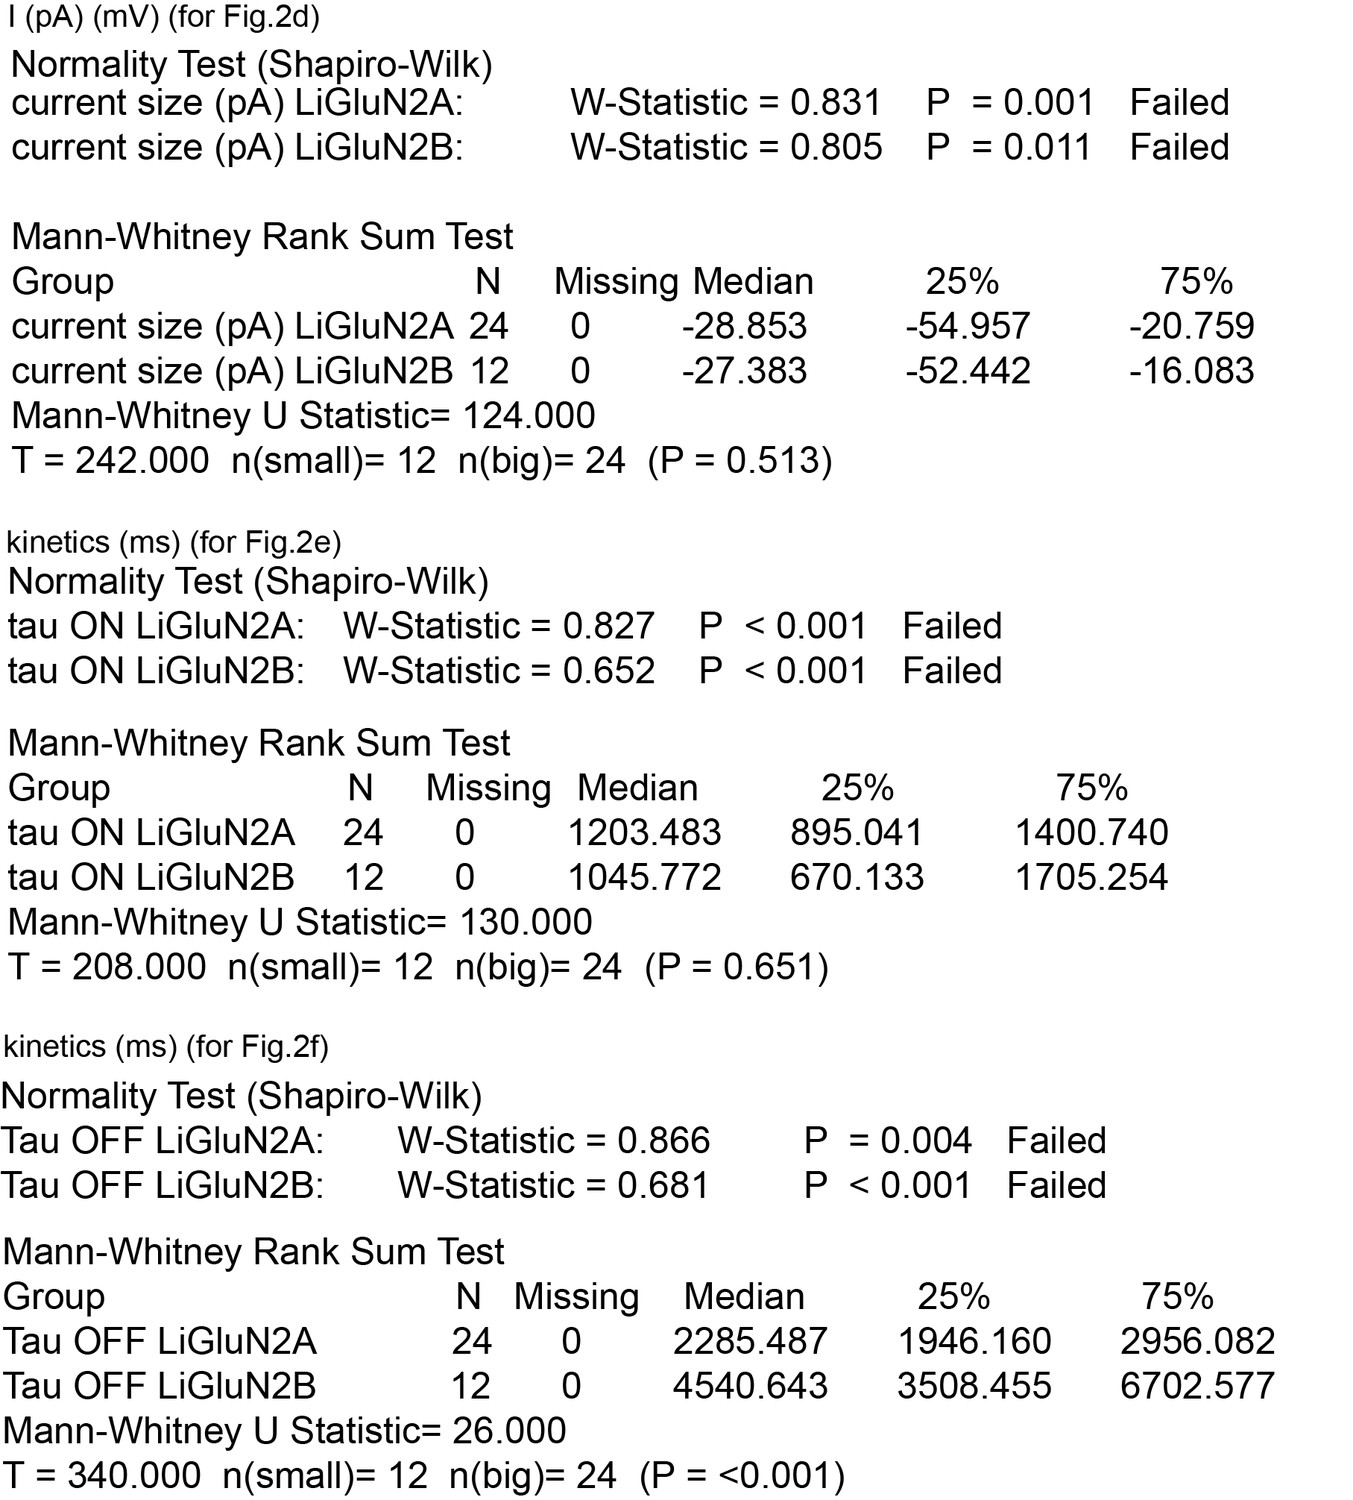
Summary of nonparametric statistics for Figure 2.
Results from Normality and nonparametric Mann-Whitney Rank Sum Tests are displayed for results shown in Figure 2d–f.
Figure 3 with 1 supplement
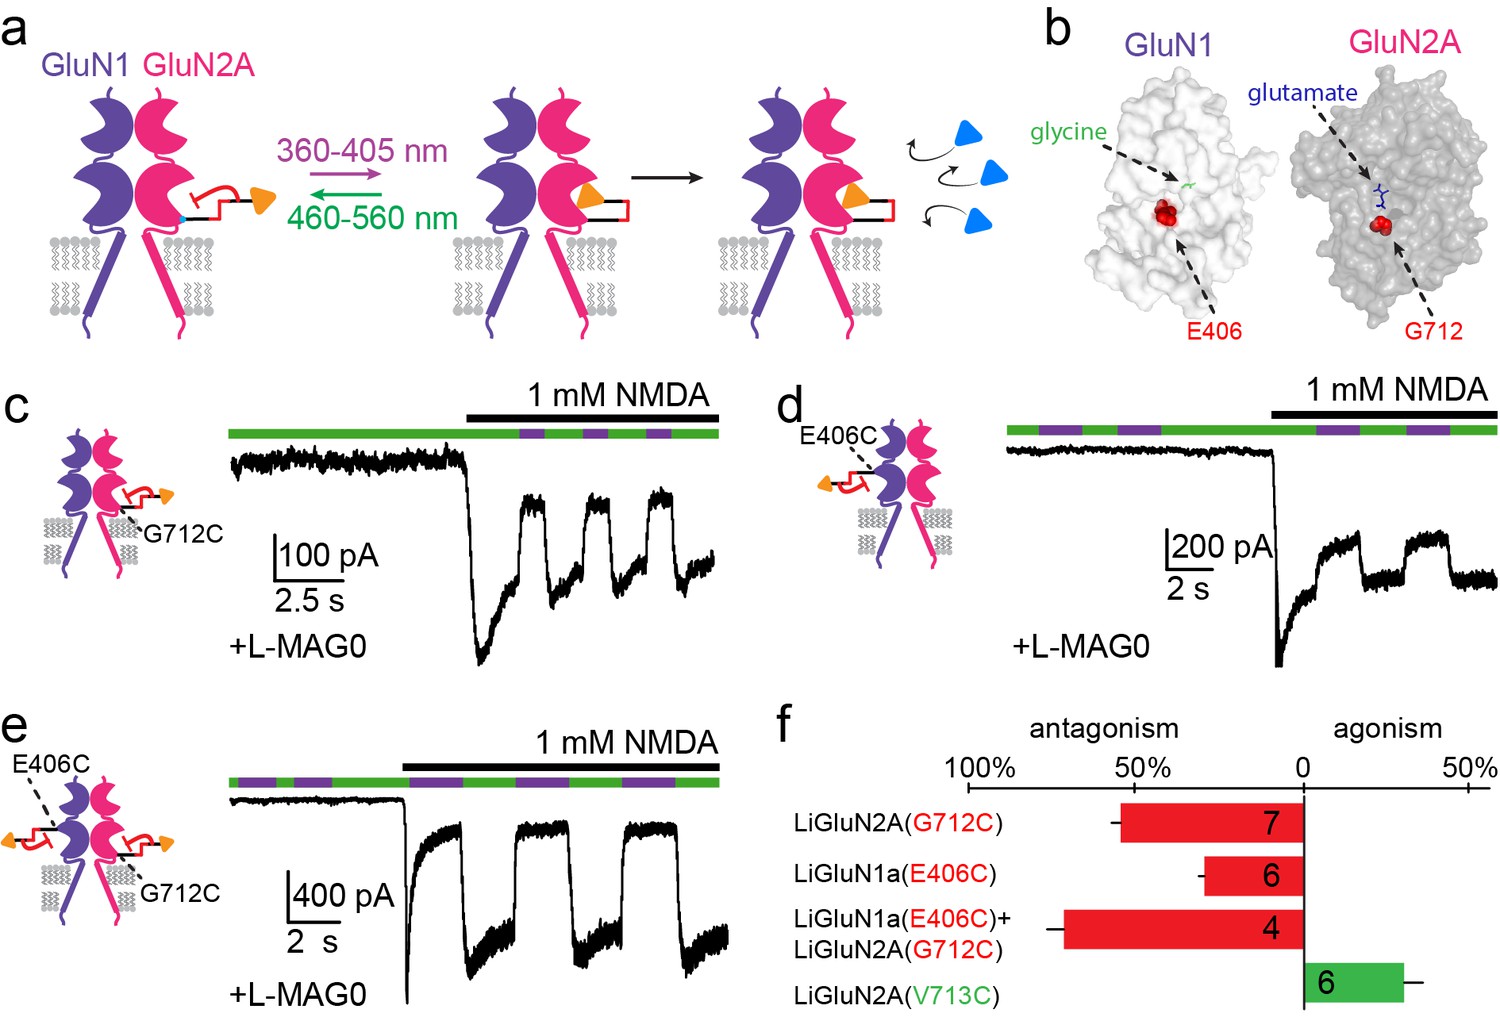
Photo-antagonism of NMDA receptors in hippocampal neurons.
(a) Photo-antagonism with L-MAG0 attached to LiGluN2A(G712C), where the cis-configuration is thought to place the glutamate end of MAG near the binding pocket, where it impedes LBD closure or entry of free glutamate (blue triangles, rightmost cartoon), leaving the channel closed. (b) Space filled, crystal structures of GluN1a (light grey) and GluN2A (dark grey) LBDs (PDB-2A5S, 2A5T(Furukawa et al., 2005), respectively) showing the sites of glycine and glutamate binding (green and blue sticks, respectively) as well as the nearby E406 and G712 positions (red spheres) which, when tethered to L-MAG0, yield photo-antagonism. (c-e) Representative traces of photo-antagonism by 380 nm light (violet bars) of NMDA currents induced by 1 mM NMDA (black bars) in neurons (from wt rats) labeled with L-MAG0 that express either: b- GluN1a-wt and GluN2A(G712C) to photo-block the glutamate binding pocket of the GluN2A subunit; c- GluN1a(E406C) to photo-block the glycine binding site of GluN1a subunit; d- GluN1a(E406C) and GluN2A(G712C) to photo-block both classes of binding sites. (f) Summary of the average (± SEM) photo-antagonism (red bars) and photo-agonism (green bars) observed in neurons. n shown within bars.
Figure 3—figure supplement 1
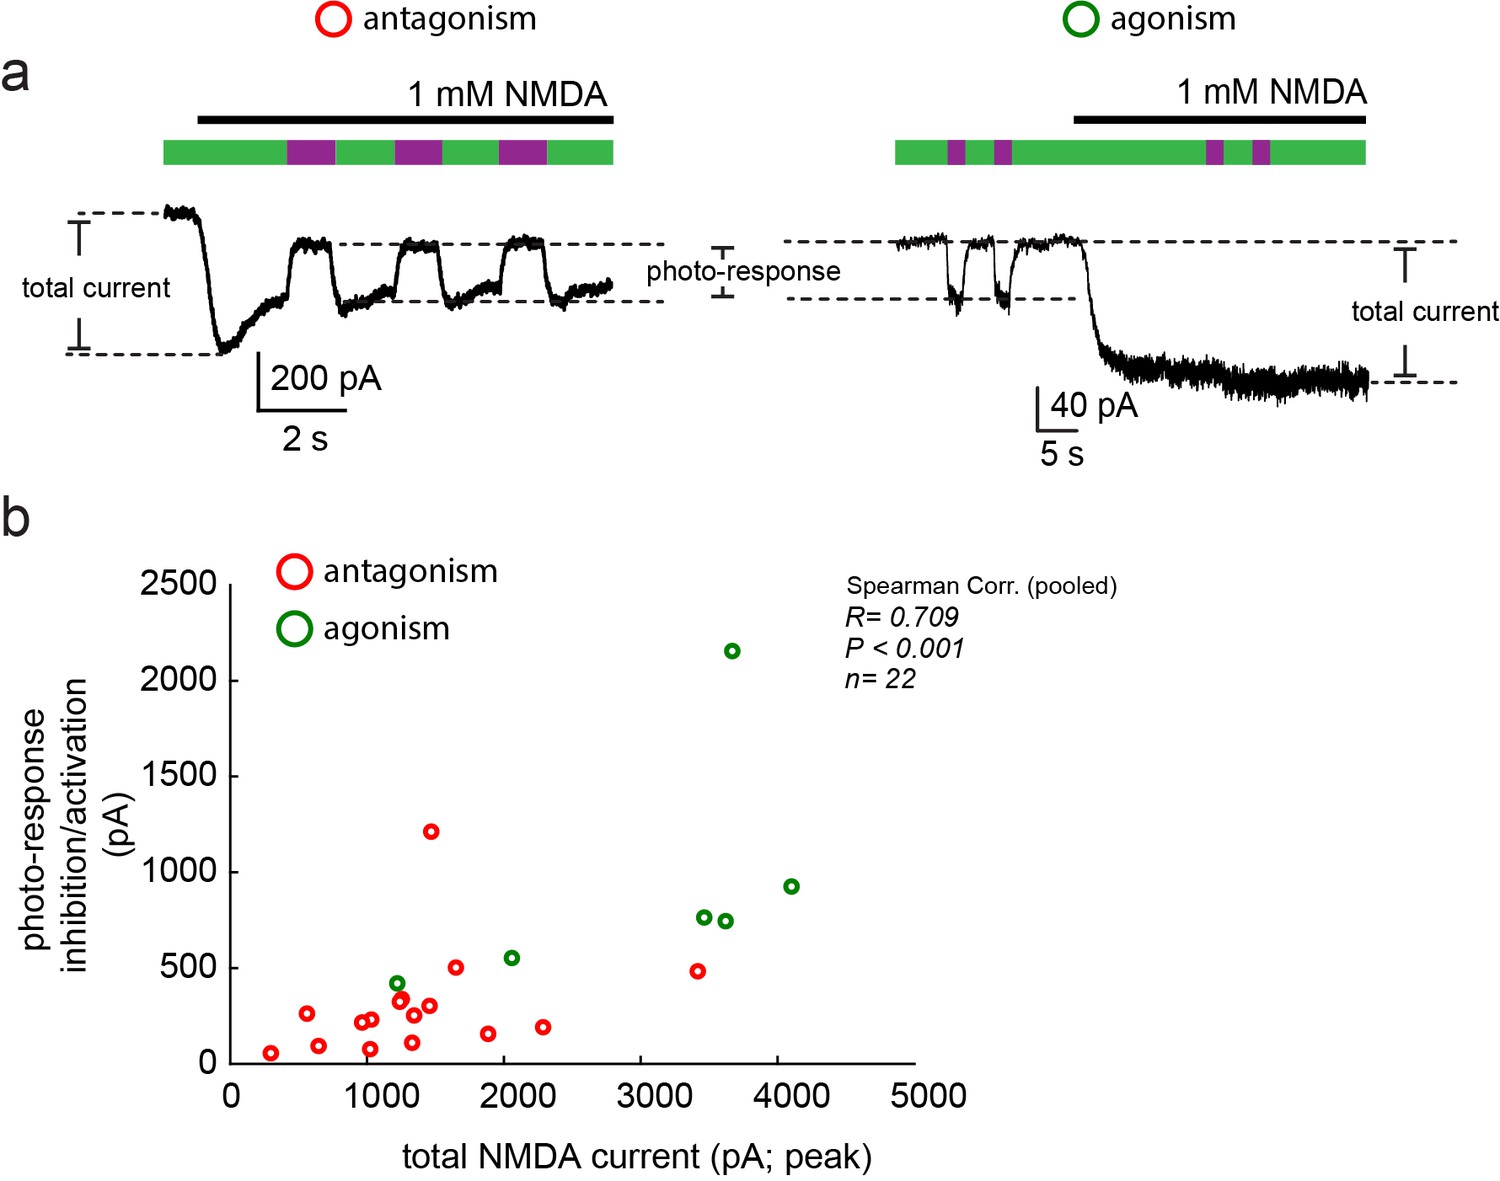
Moderate correlation between total current size and photo-current.
(a) Representative traces of photo-antagonism (left) and photo-agonism (right), displaying the relative sizes of the total NMDA-induced current and the photo-responses (inhibition/activation), plotted in b. (b) A modest correlation (Spearman, R = 0.709, R2 = 0.502), albeit significant (p<0.001), was obtained for the relationship between both types of currents, suggesting that the variation in the photo-current size cannot be fully (~50%) explained by a simple increase in the content of NMDA receptors at the plasma membrane (assuming consistent MAG-labeling efficiency). Variability in photo-current size is likely due to variability in labeling efficiency.
Figure 4 with 2 supplements
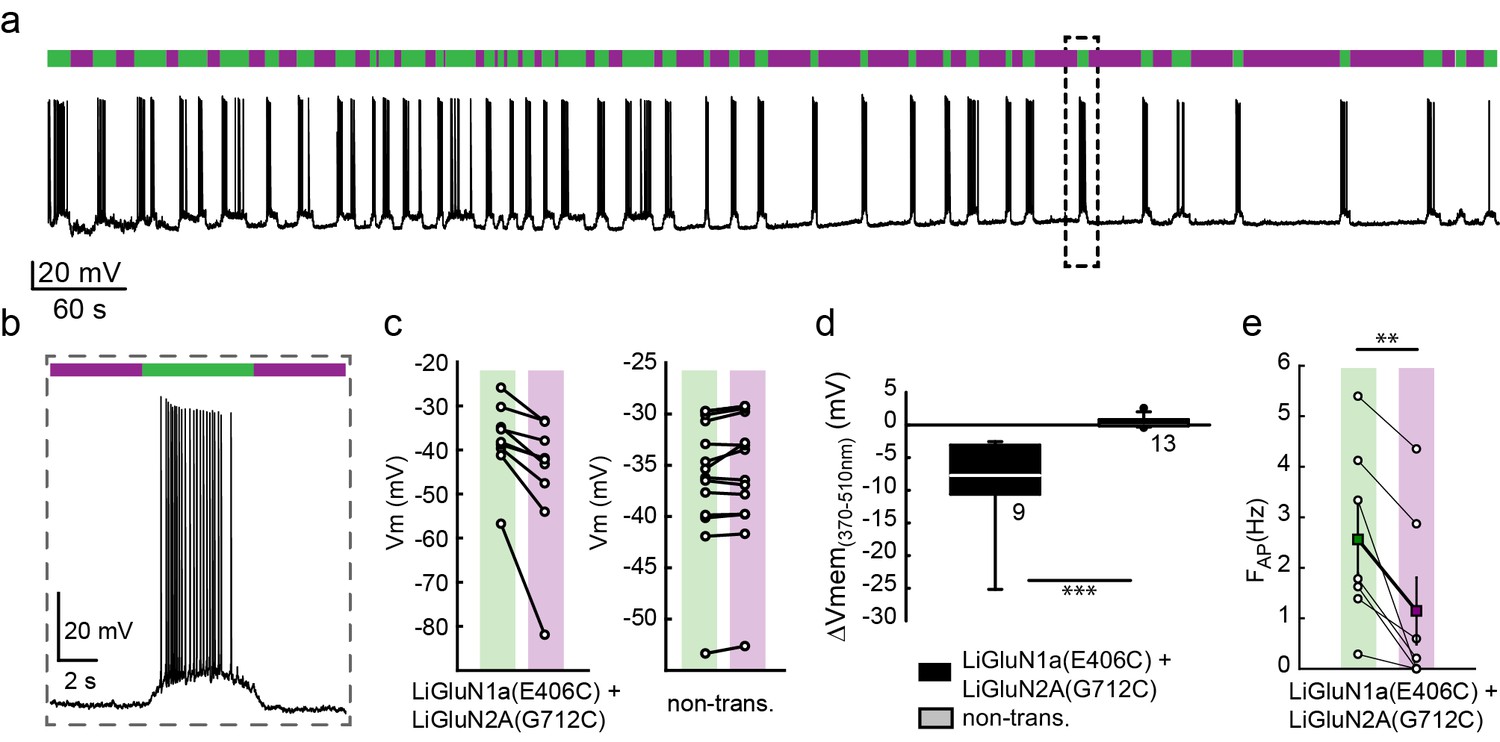
Photo-inhibition of neuronal activity with LiGluN1a and LiGluN2A.
(a) Representative trace showing a long recording (current clamp) of a neuron (from wt rats) transfected with LiGluN1a(E406C) and LiGluN2A(G712C), labeled with L-MAG0, and illuminated with 380 nm (violet bars) or 510 nm (green bars) light (held at −40 mV, Mg2+-free, 20 µM CNQX). During green light illumination, the neuron displayed strong action potential activity that could be faithfully inhibited by near-UV light (i.e. block is ON), as the photo-antagonism hyperpolarized the cell to suppress action potential firing, (b), as typically seen with soluble GluNRs blockers. (c-d) Summary of photo-antagonism on membrane potential on individual transfected- and non-transfected neurons (from wt rats) (c), and summary of the effect on membrane potential (ΔVm) is shown in (d). (e) Summary for the reduction in firing frequency following violet light illumination of individual cells (circles) and averages ± SEM (color-coded filled squares). Statistics in panel d are shown as Box plots of the data (not normally distributed, see Figure 4—figure supplement 2), showing median and outliers (filled circles) followed by a nonparametric Mann-Whitney Rank Sum Test (see methods), ***p<0.001, **p<0.01, n.s.- not-significant, n shown next to plots. Statistics in panel e are shown as mean ± SEM, tested with two-tailed, paired t-test; **p<0.01.
Figure 4—figure supplement 1

Photo-antagonism of NMDA receptors in hippocampal neurons inhibits the development of EPSCs.
(a) Representative trace (voltage clamp, −60 mV) of a hippocampal neuron (from wt rats) transfected with LiGluN1a(E406C) and LiGluN2A(G712C), labeled with L-MAG0. During green light illumination (i.e. no block), spontaneous EPSC can be seen (FEPSC- frequency shown in plot below trace), as well as occasional current potentials (arrow and asterisks in inset). During violet light (i.e. during receptor block), the baseline current is reduced as well as the frequency of EPSCs (shown in plot below trace) and current potentials completely disappear. Note that the current potentials were cut in trace to ease the view of the much smaller EPSCs (inset). (b) Light-induced photo-antagonism reduces the current in individual transfected-, but not in non-transfected (non-trans.), neurons (from wt rats). (c) Average ( ± SEM) of the extent of current reduction in transfected and non-transfected neurons. (d) Reduction in the frequency of EPSCs. During 370 nm illumination (violet bar) individual neurons display a consistent decrease in the frequency of spontaneous EPSCs (filled squares, mean ± SEM). Statistics in panel c are shown as Box plots of the data (not normally distributed, see Figure 4—figure supplement 2), showing median and outliers (filled circles) followed by a nonparametric Mann-Whitney Rank Sum Test (see methods), ***p<0.001. Statistics in panel d are shown as mean ± SEM (filled color-coded squares) and individual cells are displayed (circles). n, when displayed, appears next to bars. Hippocampal neurons obtained from wt rats.
Figure 4—figure supplement 2
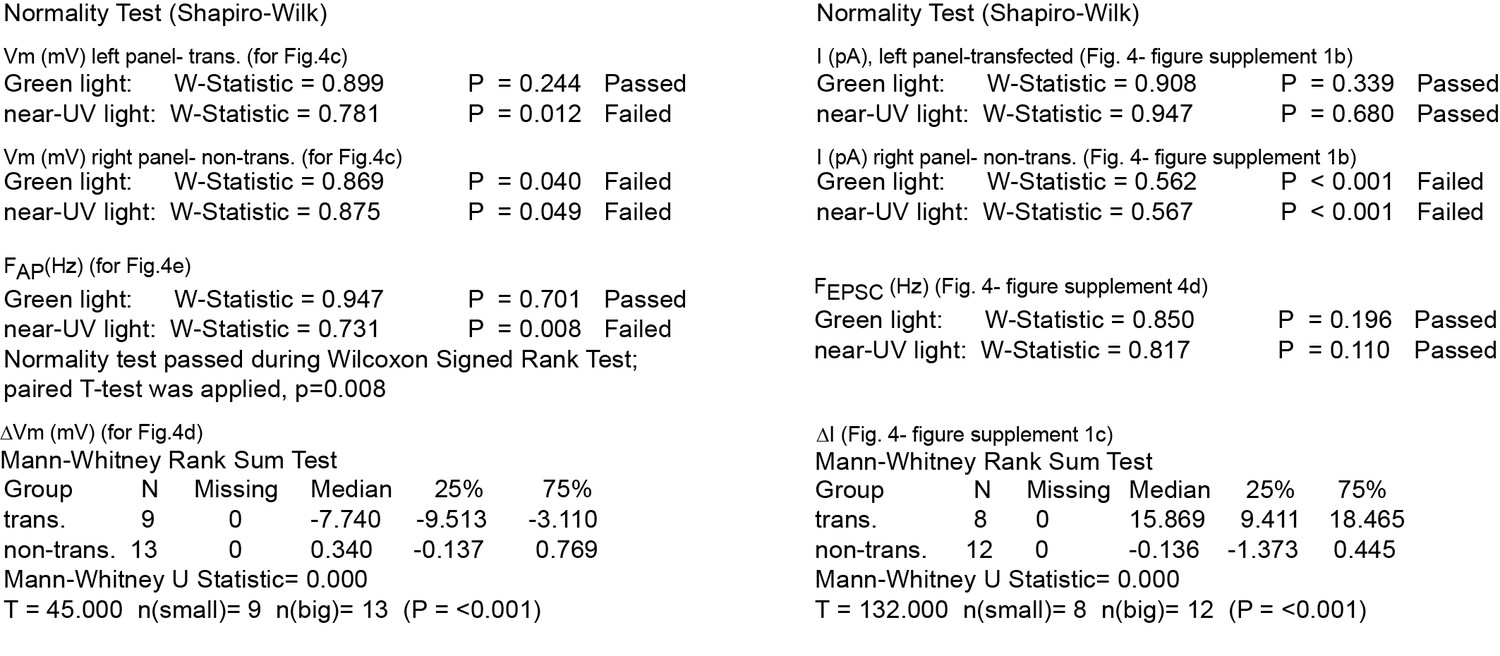
Summary of nonparametric statistics for Figure 4.
Results from Normality and nonparametric Mann-Whitney Rank Sum Tests are displayed for results shown in Figure 4c–e and for Figure 4—figure supplement 1b–d.
Figure 5 with 1 supplement
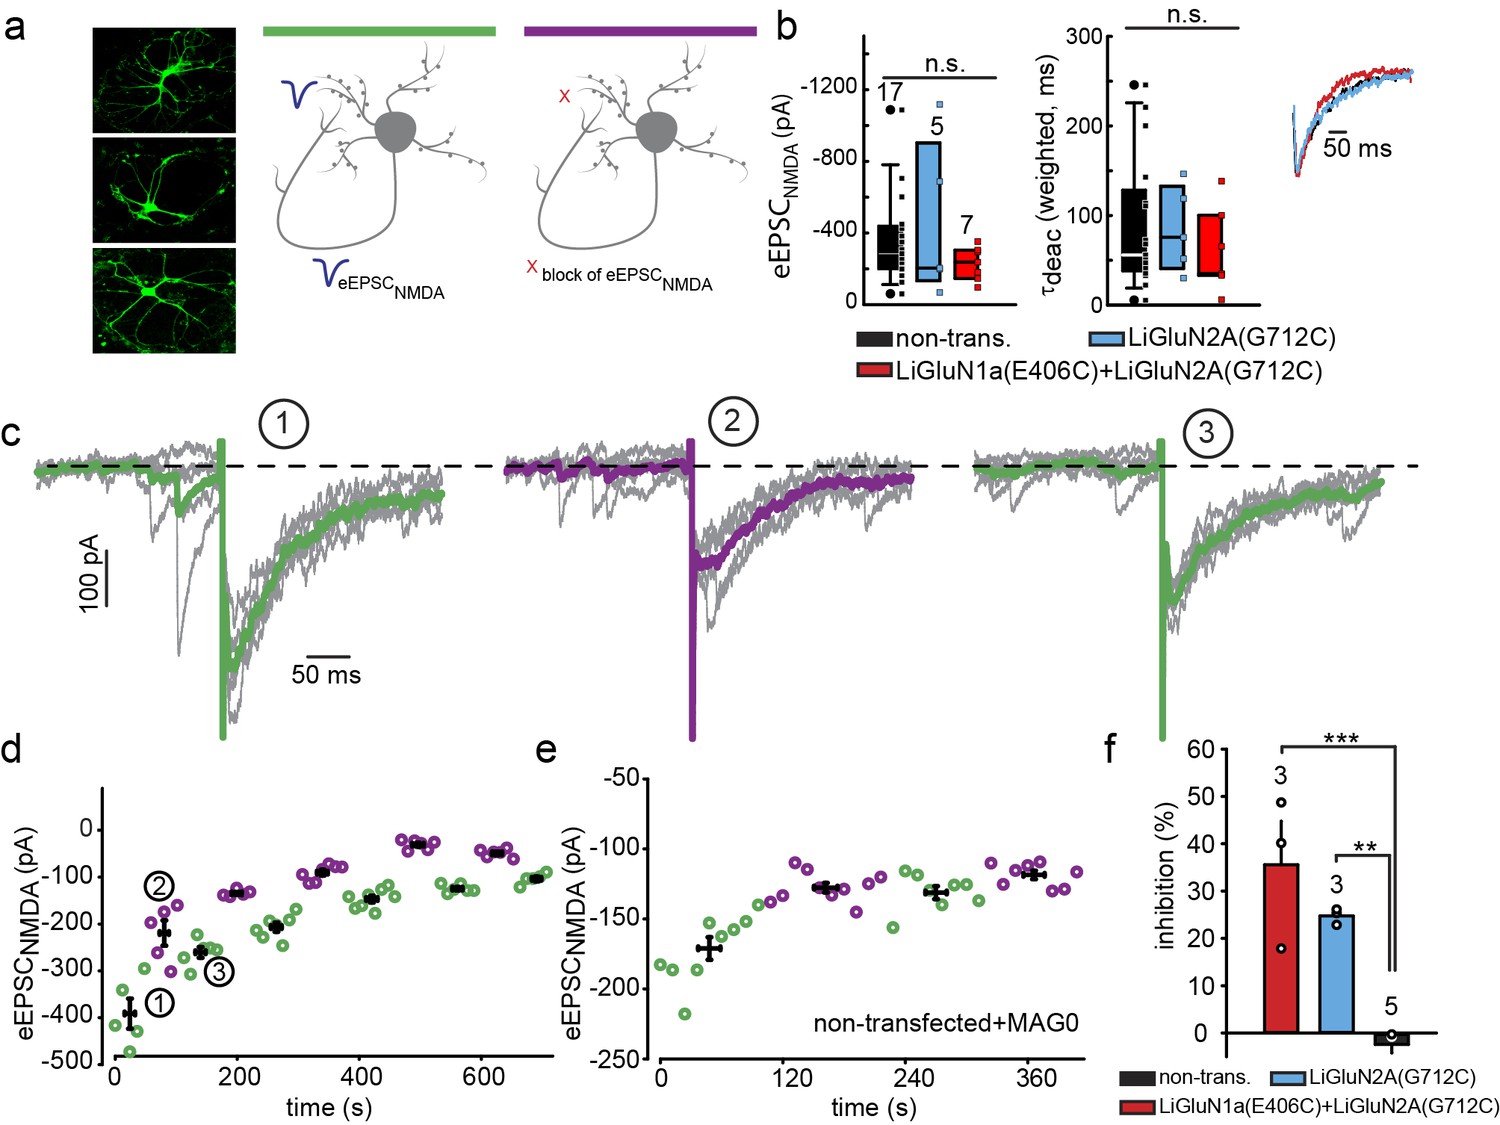
Photo-block of synaptic transmission by LiGluNs in hippocampal autapses.
(a) (left) Representative images of hippocampal neurons (from wt rats) grown in low density forming autapses. (right) Schematics of hippocampal autapse used to measure the effect on the NMDA receptors EPSC (blue trace, evoked NMDA EPSC- eEPSCNMDA) of turning ON (violet bar) and OFF (green bar) the photo-antagonsim of LiGluN. (b) No significant difference in eEPSCNMDA amplitude (left) or deactivation times (bi-exponential weighted τdeact) (right) in autaptic neurons expressing GluN2A(G712C) alone (cyan) or GluN2A(G712C) and GluN1a(E406C) (red) compared to non-transfected control neurons (black) (from wt rats). Inset shows superimposed eEPSCNMDA for the three conditions. (c) Autaptic NMDA receptor’s EPSCs in neurons transfected with GluN2A(G712C) and GluN1a(E406C) before photo-antagonism (1, under 510 nm light). Individual EPSCNMDA (grey) are superimposed with average of 5 consecutive EPSCs (green for 510 nm light; violet for 370 nm light). Photo-antagonism 370 nm light reversibly reduces the amplitude of the eEPSCNMDA. (d) Time series of NMDA receptors EPSC amplitudes for cell shown in (c) reveals repeated reversibility of photo-block of eEPSCNMDA, despite the typical rundown of the responses (see [Goda and Stevens, 1998]). (e) Non-transfected cell exposed to L-MAG0 does not exhibit light-dependent modulation of eEPSCNMDA amplitude. (f) Summary of photo-block (as % inhibition) of autaptic NMDA receptors EPSCs in transfected and non-transfected neurons (color scheme as in b). 4 cells were excluded (see Figure 5—figure supplement 1). Statistics in panels b and c are shown as Box plots displaying medians, outliers (filled circles) and individual data points (filled, color-coded squares), followed by a nonparametric ANOVA on ranks (see Figure 5—figure supplement 1), n.s., not significant. Statistics for panel f are shown as mean ± SEM, tested with one way ANOVA, ***p<0.001, **p<0.01, all pairwise Tukey post hoc test, n shown in parentheses atop bars.
Figure 5—figure supplement 1
Summary of nonparametric and parametric statistics for Figure 5.
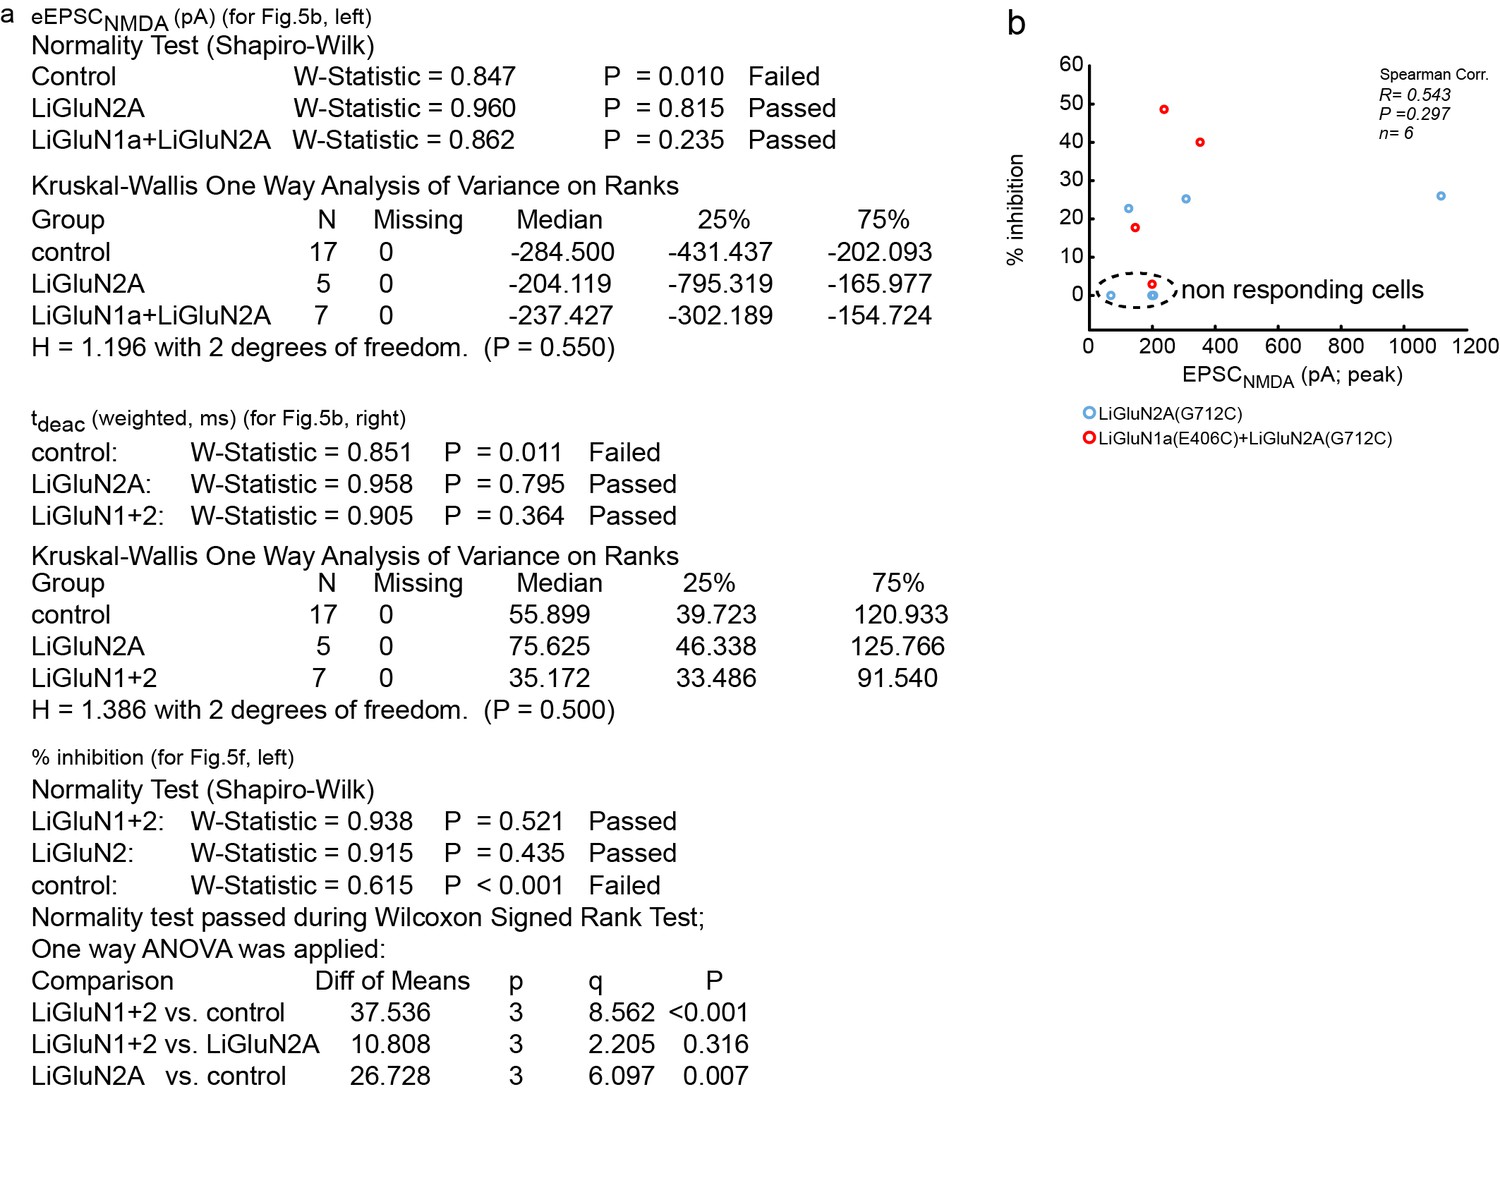
(a) Results from Normality tests and nonparametric Kruskal-Wallis One Way Analysis of Variance (ANOVA on ranks) are displayed for panels shown in Figure 5b and One Way ANOVA for Figure 5f. (b) No correlation (Spearman, R = 0.543, R2 = 0.295, p = 0.297) was obtained for the relationship between the effect of light (i.e. photo-block of the EPSCNMDA;% inhibition) and the total size of the synaptic NMDA-current (EPSCNMDA) pooled for both LiGluN2 and LiGluN1+2 groups. This suggests that the variation in the effect of light (i.e. relative size of the block) has no relationship with the total size of the synaptic current, in line with the observations displayed in Figure 3—figure supplement 1. Dashed region- 4 non responding cells transfected with either LiGluN2A-only or with LiGluN2A and LiGluN1a are shown for: 1- comparison with responsive cells and 2- showing variability in labeling efficiency. Non-responding cells (i.e. transfected neurons and exposed to MAG, but that exhibited less than 5% inhibition) were excluded from the average shown in Figure 5f. This criterion was defined to differentiate between real photo-inhibition from variability in transmission rundown (Goda and Stevens, 1998).
Figure 6
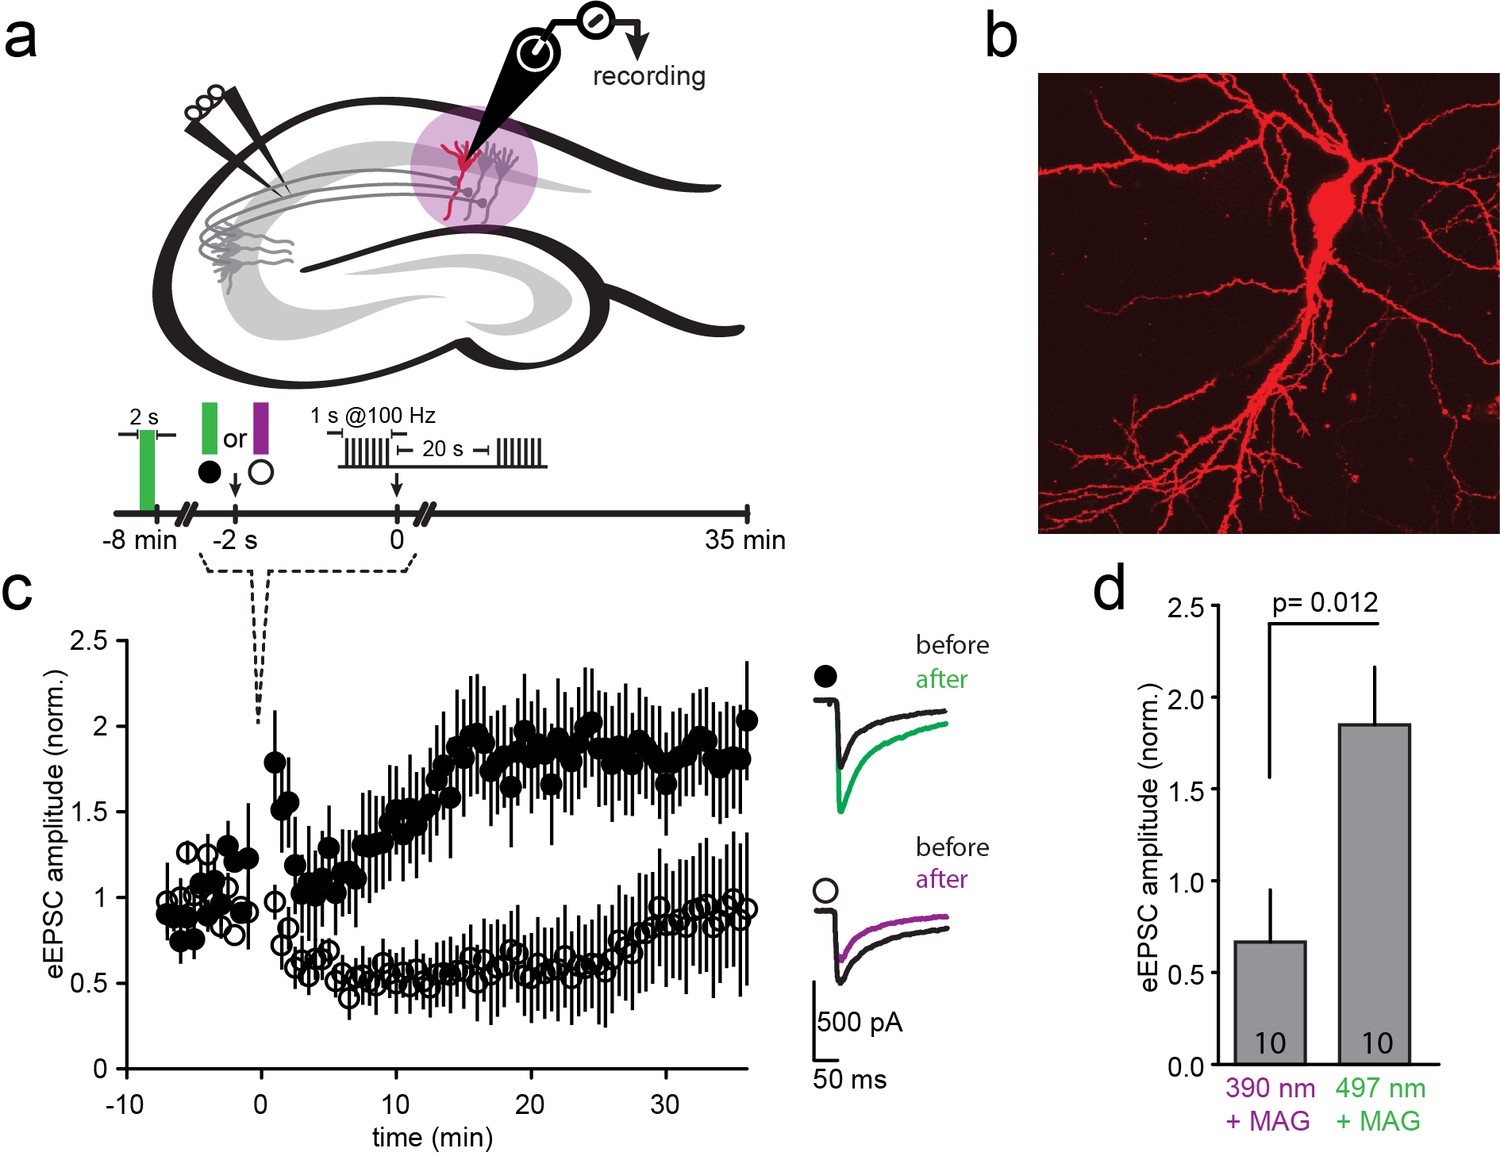
LTP induction blocked by photo-antagonism of LiGluN1a(E406C) and LiGluN2A(G712C) in organotypic hippocampal slice from GluN2A-knockout neonate mice.
(a) Schematic of the hippocampus with stimulating electrode on Schaffer collaterals CA3 pyramidal axons that innervate pyramidal neurons of CA1 and recording pipette on a transfected CA1 neuron from Glu2A-KO mice. (b) Transfected neuron in an organotypic hippocampal slice identified by tdTomato fluorescence after biolistic co-transfection of LiGluN1a(E406C), LiGluN2A(G712C) and tdTomato. (c) Following exposure of the slices to L-MAG0, Schaffer Collaterals were electrically stimulated once every 30 s to obtain a baseline EPSC amplitude (ranging from −8 to 0 min), followed by two high frequency trains (tetanic stimulation: 1-s long trains at 100 Hz, separated by 20 s), followed by a return for 30 min to a one stimulus every 30 s. Normalized mean ± SEM of evoked EPSC amplitudes once every 30 s are shown (ranging from 0 to 35 min). When the tetanic stimulation was preceded by illumination at 497 nm (photo-antagonism OFF; green bar, filled symbols, n = 10) EPSC amplitude approximately doubled, as common for CA3-CA1 LTP. However, illumination at 390 nm (photo-antagonism ON; violet bar, open symbols, n = 10) prevented the generation of LTP. Inset shows representative average EPSCs before (black traces) and after (at t= 20–30 min) the tetanic stimulation (green and violet traces). (d) Summary of the results shown in (c), averaged between t = 20–30 min. Statistics in panels are shown as mean ± SEM, tested with two-tailed, unpaired t-test, p as indicated, n shown within bars.
Figure 7
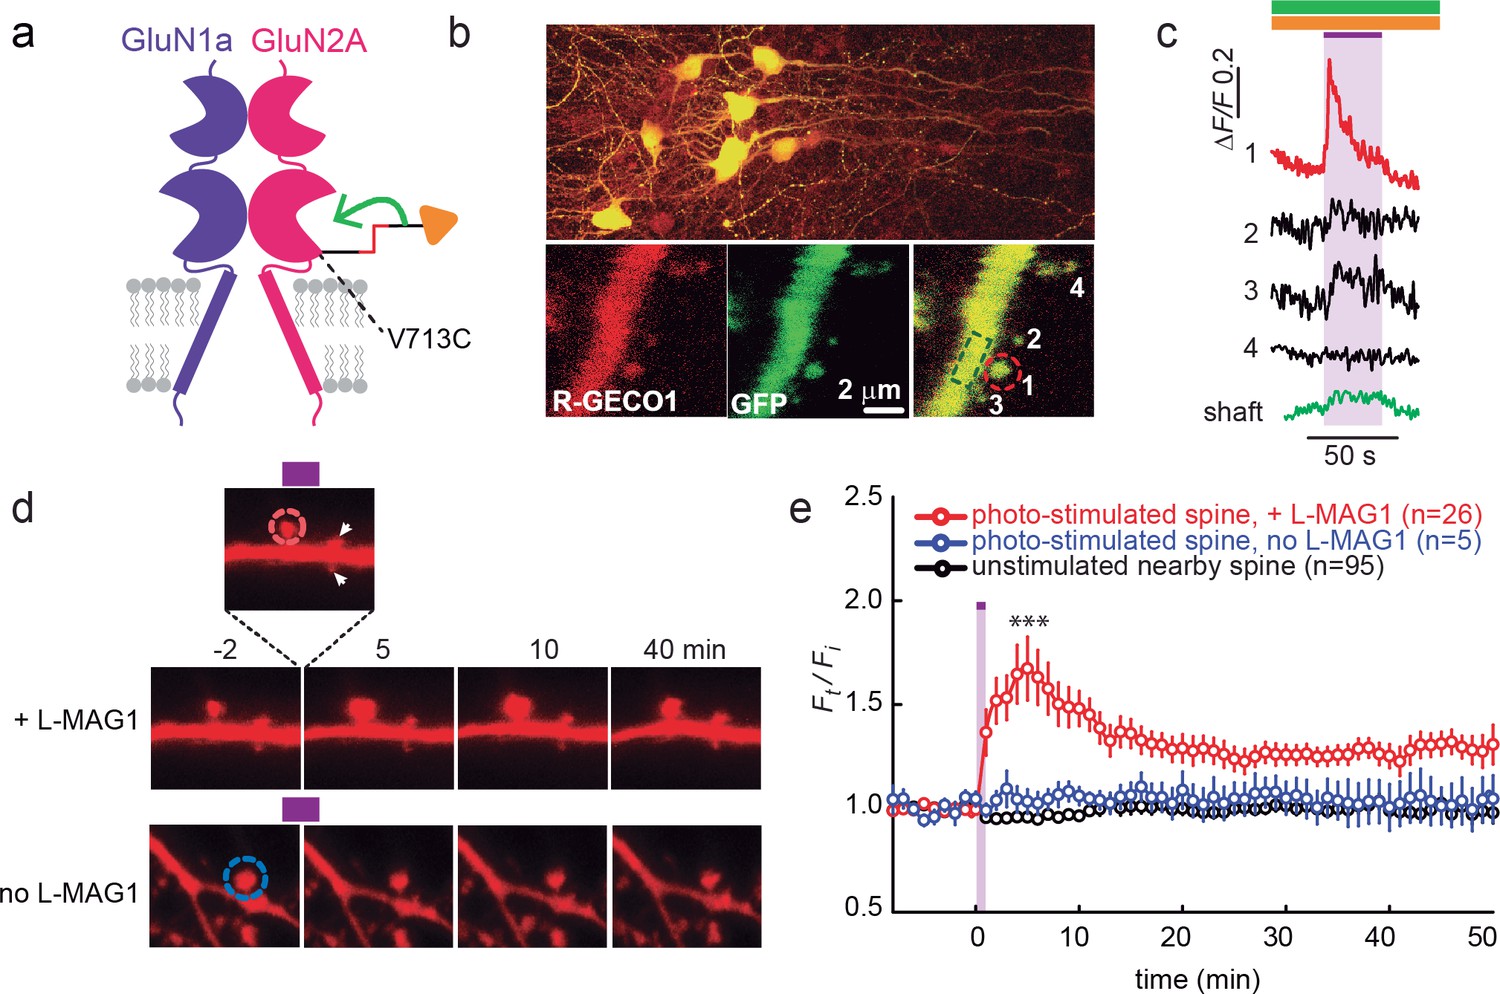
GluN2A(V713C) photo-agonism triggers calcium increase and expansion in single dendritic spines of organotypic hippocampal slice from GluN2A-knockout neonate mice.
(a) Schematic of photo-agonism with L-MAG1 conjugated to the LiGluN2A(V713C) subunit. (b, c) Single-spine calcium rise induced by photo-agonism. (b) CA1 neurons co-expressing LiGluN2A(V713C) fused to R-GECO1.0 [LiGluN2A(V713C)-R-GECO1.0] and soluble R-GECO1.0 (red) as well as GFP (green) in merged low power image showing cluster of transfected neurons (top) and high-magnification image of dendritic shaft with several spines, showing the green, red and merged channels (bottom). Photo-agonism with 405 nm illumination focuses on spine #1 (red dashed circle), while R-GECO1.0 imaging measures calcium in spines # 1–4 and the dendritic shaft (dashed green rectangle). (c) Illumination of spine #1 in (b) at 405 nm (violet bar, with additional excitations at 488 and 561 nm to image eGFP (green bar) and R-GECO1.0 (orange bar), respectively, elicits an increase in R-GECO1.0 fluorescence within the head of spine #1 (red trace), while other spines (black traces) and the dendritic shaft (green trace) display little or no increase in fluorescence. (d) Single spine expansion by photo-agonism of LiGluN2A. Spines from CA1 pyramidal neuron co-expressing GluN2A(V713C) and tdTomato and treated with L-MAG1 were stimulated with repetitive 405 nm laser scanning at the tip of the spine head, at ~1 Hz for a total amount of 1–2 min. (Top) Time lapse of a representative spine undergoing expansion after on-spine stimulation with 405 nm light (violet bar on top of inset, dashed red circle). Non-illuminated, nearby spines (white arrowheads) do not exhibit any change in volume. (Bottom) Representative spine from a slice without L-MAG1 treatment showing no response to 405 nm light (blue dashed circle). Numbers above images indicate time in min relative to photo-stimulation at t = 0. (e) Summary of results. Statistics in panel (e) are shown as mean ± SEM, ***p<0.001, two-tailed, paired t-test compared to baseline, Δt= -10–0 mi. n, from series of experiments as in (d), is shown in parentheses.
Figure 8 with 1 supplement
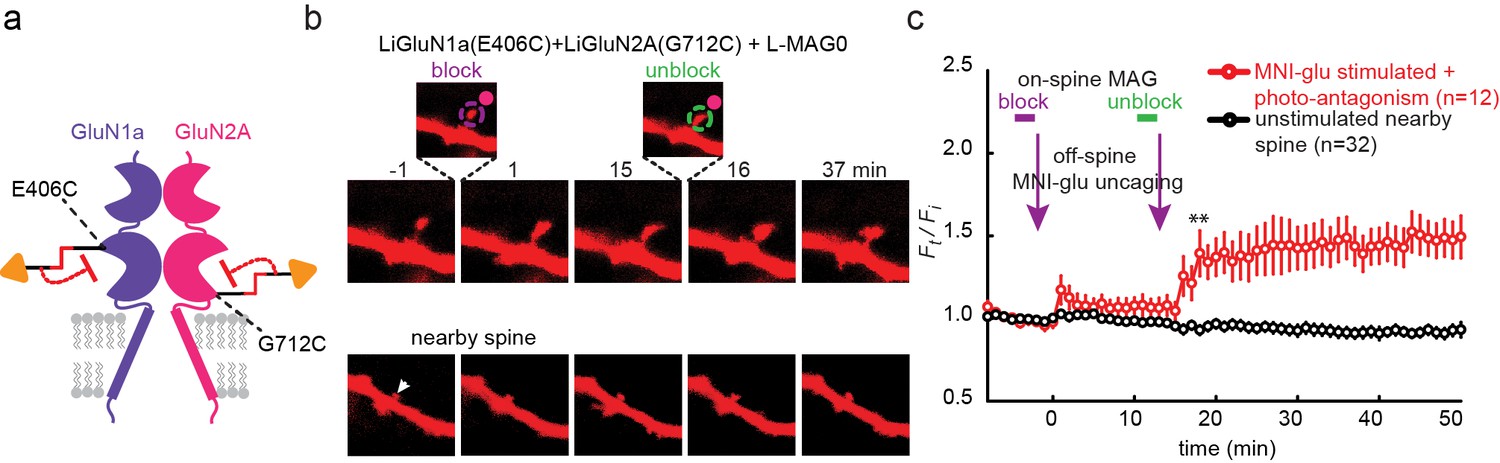
Photo-antagonism prevents glutamate-induced expansion in single dendritic spines of organotypic hippocampal slice from GluN2A-knockout neonate mice.
(a) Schematic of a photo-antagonized NMDA receptors containing LiGluN1a(E406C) and LiGluN2A(G712C) conjugated to L-MAG0. (b) CA1 pyramidal neuron co-expressing LiGluN1a(E406C), LiGluN2A(G712C) and tdTomato following treatment with L-MAG0. (Top) Single spine receiving two bouts of near-spine glutamate-uncaging at 405 nm (magenta spots, insets), the first after photo-antagonism was induced by 405 nm on-spine illumination (violet dashed circle, left inset), the second following removal of the photo-antagonism by 488 nm on-spine illumination (green dashed circle, right inset). Photo-block (and relief of block) of the receptors was done by stimulating the tip of the spine head with repetitive 405 nm (or 488) laser scanning, at ~1 Hz for a total amount of 1 min. MNI-glutamate uncaging was performed slightly away from the spine head (~2 µm) to avoid further stimulation of the receptors found on the spine head. The spine undergoes a small expansion in response to the first glutamate-uncaging (p=0.06, compared to baseline at t= -8 – 0 min), and a large expansion following removal of the photo-antagonism. (Bottom) A nearby non-illuminated spine (arrowhead) does not change size. Numbers above images indicate time in min relative to photo-stimulation at t = 0. (c) Summary of results from a series of experiments as in (b) (mean ± SEM, **p< 0.01, two-tailed, paired t-test compared to baseline at t= 9–15 min, n shown in parentheses).
Figure 8—figure supplement 1
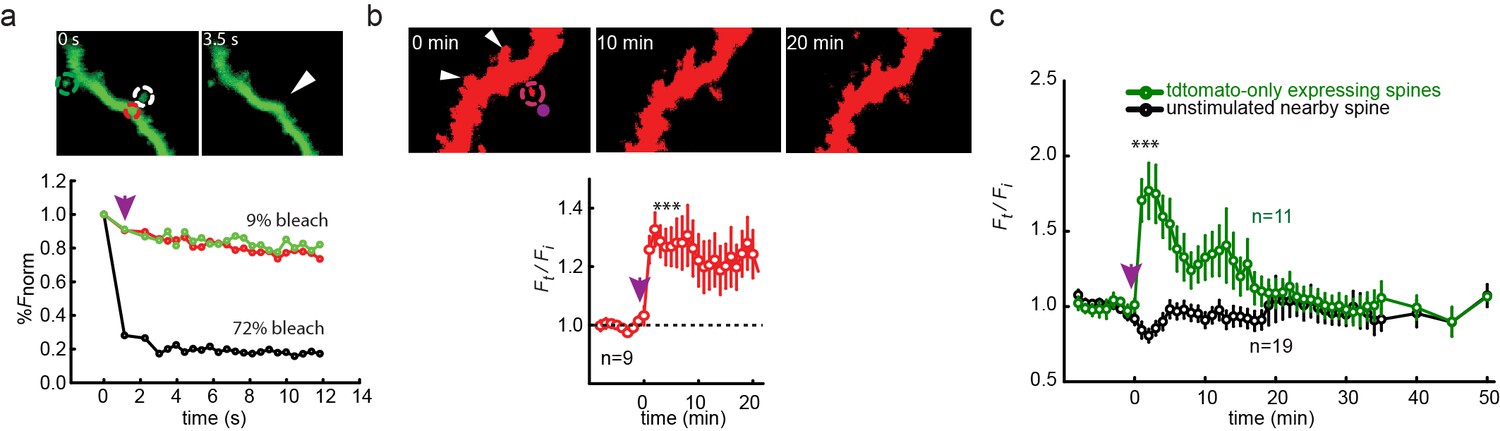
Single spine spatial precision of photocontrol in organotypic hippocampal slice from GluN2A-knockout neonate mice.
(a) Photo-bleaching indicates spatial precision of "on-spine" photo-stimulation. High intensity illumination at 405 nm (magenta arrow) rastered over a single 1 µm diameter spine for 1 s (white dashed circle in images, black symbols in graph) leads to >70% confined bleaching of GFP in that spine (white arrowhead in right image taken 3.5 s following the bleaching) and only marginal bleaching (<10%) of the neighboring dendritic shaft (red dashed circle in images, red symbols in graph) or nearby spine (green dashed circle in images, green symbols in graph). Numbers above images indicate time in seconds (0 before bleaching, 3.5 s after bleaching). (b) (Top) Uncaging of MNI-glutamate (2.5 mM in nominally Mg2+-free solution, see Materials and methods) near a single spine (magenta spot in left image at time 0 or magenta arrow shown in plot) of a CA1 pyramidal neuron from a cultured GluN2A-KO mice organotypic slice, biolistically-transfected with GluN1a(E406C), GluN2A(G712C) and tdTomato, but not treated with L-MAG0, triggers expansion of targeted spine (magenta dashed circle), but not of nearby spines (white arrowheads). Numbers above images indicate time in minutes (0 before uncaging, 10 and 20 min after uncaging). (Bottom) Summary of results from series of experiments as in (Top). Slices, biolistically-transfected with GluN2A(G712C) but unexposed to MAG, following 1–2 min incubation with 2.5 mM MNI-glutamate exhibit long-lasting expansion, demonstrating the sufficiency of this time window to deliver the compound to spines and rescue of long lasting expansion. (c) Spines, of CA1 neurons from a cultured GluN2A-KO mice organotypic slice, biolistically transfected with td-tomato only and unexposed to MAG, do not maintain increased volume following MNI-glu uncaging (magenta arrow), reminiscent of earlier findings showing reduced hippocampal LTP (Sakimura et al., 1995). Statistics in panels are shown as mean ± SEM, tested with two-tailed, paired t-test; ***p<0.001, n displayed in plots.
Figure 9 with 1 supplement
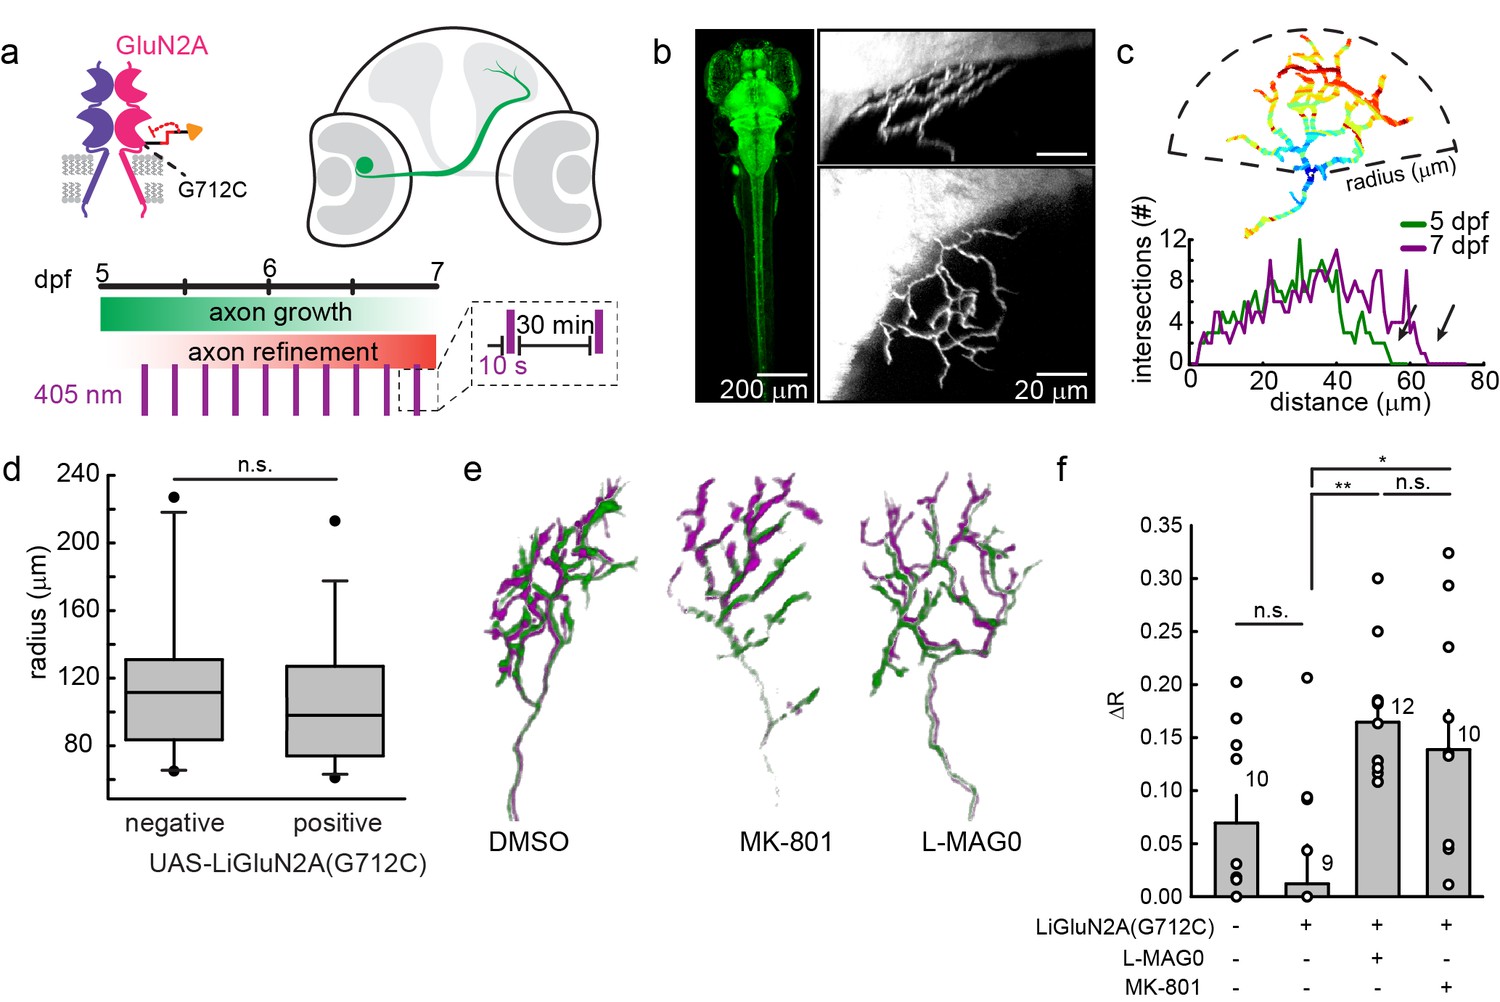
GluN2A(G712C) photo-antagonism disrupts refinement of retinal ganglion cell axon arbors in larval zebrafish in vivo.
(a) Cartoons depicting GluN2A(G712C) photo-antagonism (top left), development of retinal ganglion cell projection (top, right) and timeline of the photo-antagonism assay (bottom). (b) (Left) Dorsal view of 5 dpf larva showing pan-neuronal expression pattern driven by s1101t-gal4 visualized by expression of UAS-GCaMP3. Transverse (right, top) and dorsal (right, bottom) tectal projection of a retinal ganglion cell axon arbor labeled by mosaic expression of pou4f3:mGFP at 7 dpf. (c) Axon arbors were traced and arbor radius measured by a 3-dimensional Sholl analysis counting the number of intersections encountered by concentric spheres centered on the first branch point. Arrows indicate arbor radius (R) at 5 dpf and 7 dpf. (d) Prior to antagonism, Tg[s1101t-gal4; UAS:GluN2A(G712C)] animals have a comparable distribution of arbor radii at 5 dpf as non-expressing animals (without UAS, but mix of s1101t +/-) (n.s., p >0.6, Mann-Whitney Rank Sum Test, n = 19, GluN2A(G712C)-expressing axons and 10 non-expressing axons). Box plot whiskers indicate 5% and 95% percentiles. Dots above whiskers represent outliers. (e) Representative selection of retinal ganglion cell axon arbors in transgenic animals at 5 dpf (green) and 7 dpf (magenta). Larvae were treated at 5 dpf with either 150 µM L-MAG0 in 0.3% DMSO, 0.3% DMSO alone, or 25 µM MK-801, and subjected to 10 s flashes of 405 nm light at 30 min intervals from 128–168 hpf. (f) In animals where GluN2A(G712C) was photo-antagonized by MAG, retinal ganglion cell axon arbors grew significantly more compared to DMSO-treated control groups (left-to-right: ΔR = 6.9%, n = 10 axons, ΔR = 1.2%, n = 9 axons; ΔR = 16.4%, n = 12 axons). This overgrowth was comparable to the change in arbor radius observed in animals treated with MK-801 (ΔR = 13.8%, n = 10 axons). For statistical analysis of the relative change in arbor radius (ΔR = (R7dpf-R5dpf)/R5dfp), we initially compared untreated –wt animals and untreated transgenic animals (two left bars) and observed no statistical difference (mean ± SEM, n.s. not significant, two-tailed, unpaired t-test). This enabled the comparison between the animals from the same transgenic background (second to fourth bar) for the effect of photo-inhibition on radius (mean ± SEM, n.s. not significant, **p<0.01, *p<0.05, tested with one way ANOVA, all pairwise Tukey post hoc test (see Figure 9—figure supplement 1c). Individual data points are shown for f (open circles).
Figure 9—figure supplement 1
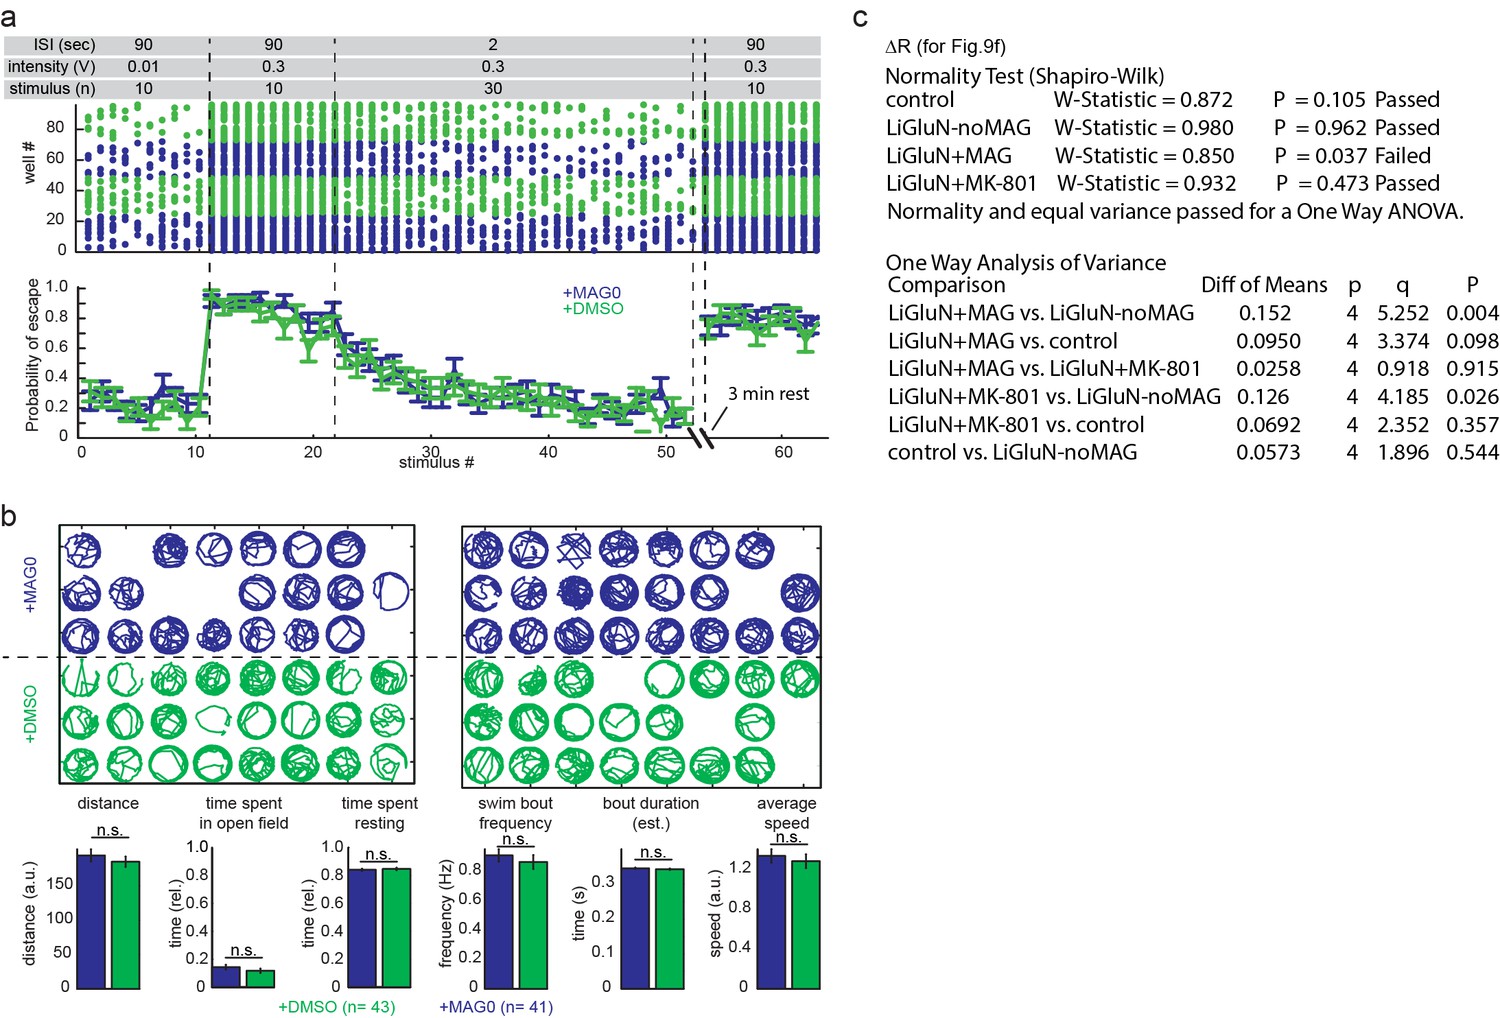
MAG treatment of zebrafish larvae in the absence of LiGluN2A expression does not affect behavior.
Wildtype larvae were treated at 5 dpf with either 150 µM MAG0 in 0.3% DMSO (n = 48) or 0.3% DMSO alone (n = 48) for 40 min, rinsed thoroughly in fresh fish water, and allowed to develop as two separate groups without further treatment in large common dishes of E3. (a) MAG treatment in the absence of LiGluN2A expression does not affect innate escape reflex or the habituation of this reflex. Zebrafish at 7dpf were subjected to an acousto-vibrational stimulus protocol (top) designed to assay (i) sensitivity, (ii) responsiveness, (iii) habituation in response to repeated stimuli, and (iv) spontaneous dishabitutation (n = 48 animals). Movies were scored for response within 60 ms of the stimulus. Escape probabilities were calculated as the mean number of responders per group (mean ± SEM). No significant difference was seen between the MAG-treated (blue) and DMSO-treated groups (green) in any phase of the assay. (b) At 7 dpf, individual fish were transferred to single wells of 48-well plates and spontaneous swimming was filmed at 10 fps. Fish were tracked in each well (blue = MAG-treated; green = DMSO-treated) by detecting changes in pixel intensity between movie frames using Matlab (see Materials and methods). Empty wells represent fish that were excluded from statistical analysis if the automated tracking algorithm failed for more than 15% of the 10 min imaging session (manual inspection revealed that the automated tracking failed when fish spent extended time near a partially obscured well edge; in total, 10% were excluded). (bottom) Summary shows that MAG and DMSO treated animals showed no significant difference in cumulative distance traveled during spontaneous swim bouts, swim bout frequency or duration, or average speed, or time spent resting. (n=41 for MAG0, n=43 for DMSO-treated animals, n.s., not significant, two-tailed, unpaired t-test). Values mean ± SEM. (c) Statistical results of a one way ANOVA (all pairwise Tukey post hoc test), performed for Figure 9f.
Download links
A two-part list of links to download the article, or parts of the article, in various formats.
Downloads (link to download the article as PDF)
Open citations (links to open the citations from this article in various online reference manager services)
Cite this article (links to download the citations from this article in formats compatible with various reference manager tools)
A family of photoswitchable NMDA receptors
eLife 5:e12040.
https://doi.org/10.7554/eLife.12040


