Ring finger protein 10 is a novel synaptonuclear messenger encoding activation of NMDA receptors in hippocampus
- Università degli Studi di Milano, Italy
- Leibniz Institute for Neurobiology, Germany
- Università degli Studi del Piemonte Orientale "Amedeo Avogadro", Italy
- Institut de Génomique Fonctionnelle, France
Figures
Figure 1
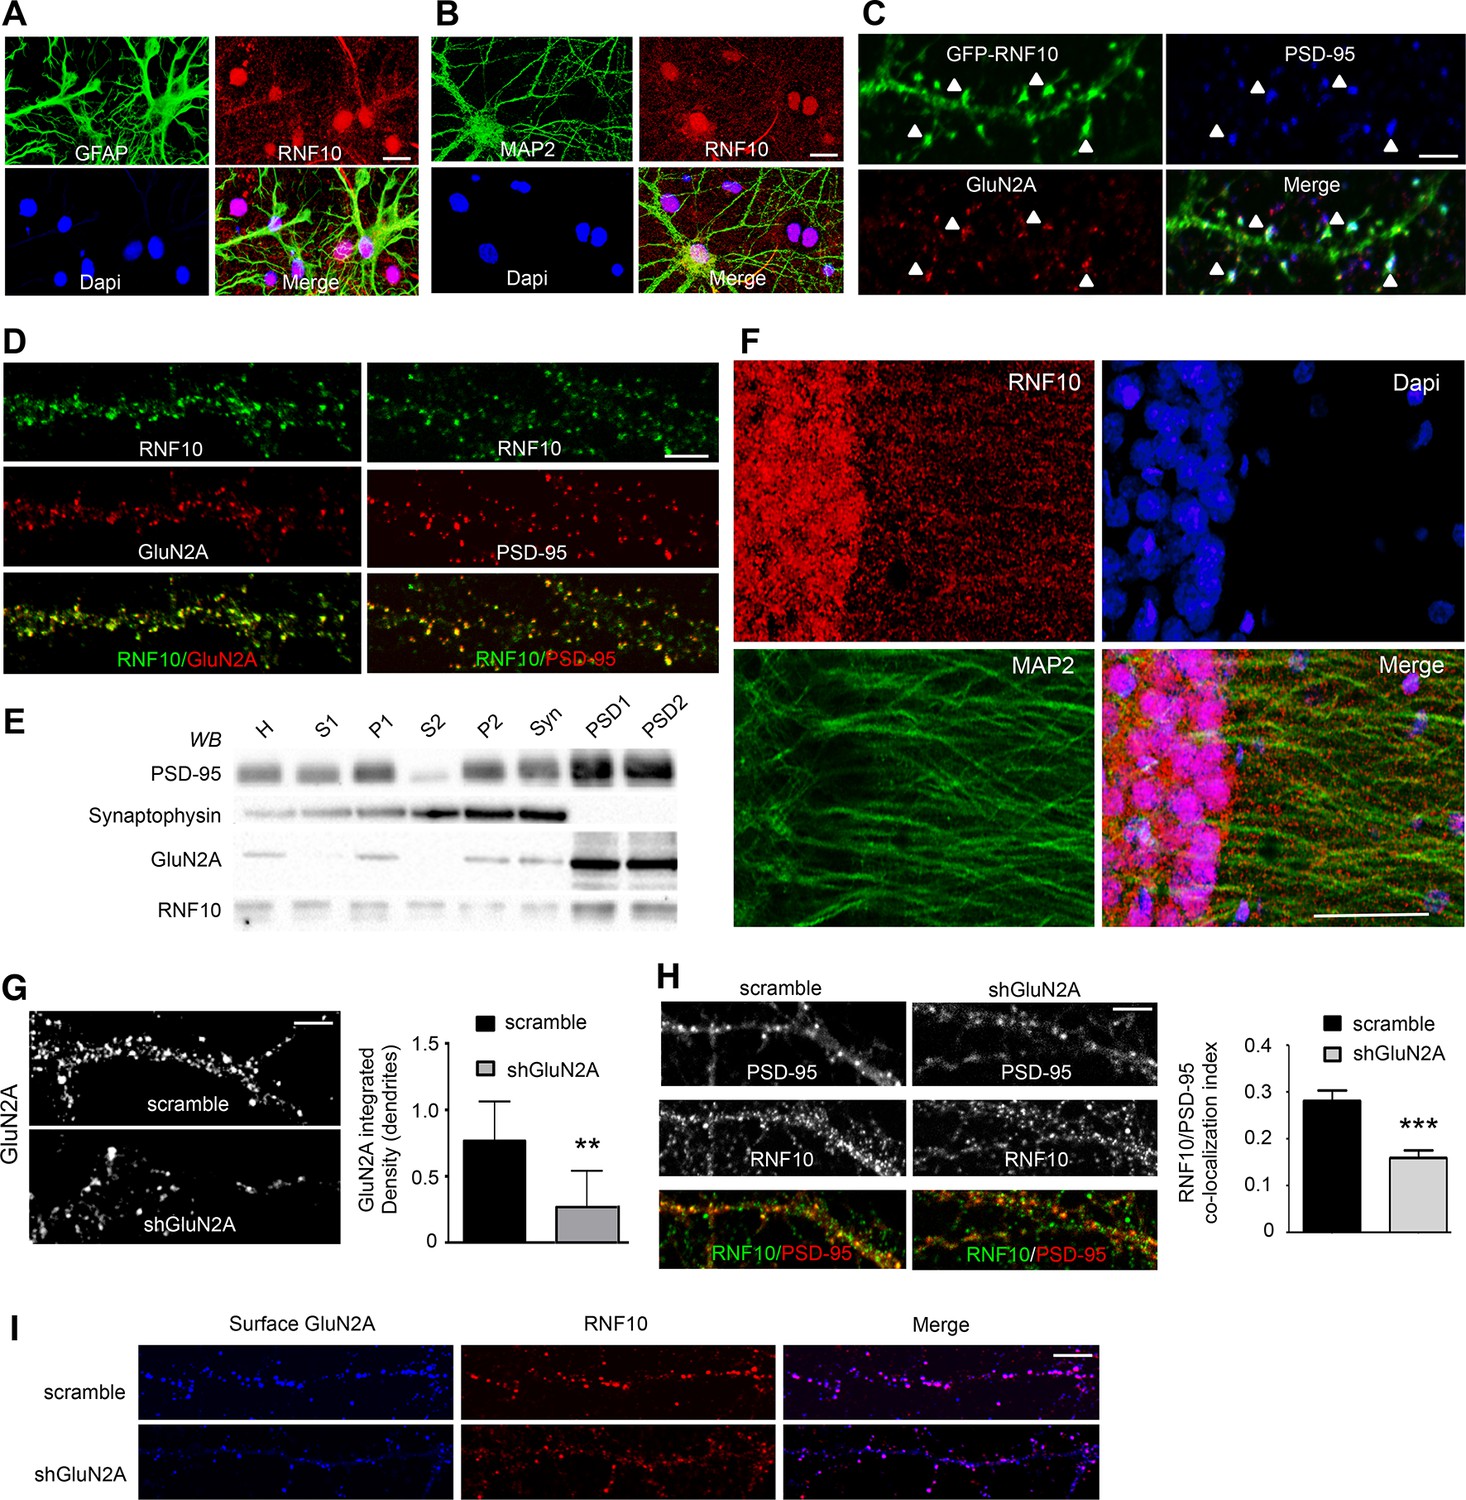
RNF10 subcellular distribution in neurons.
(A,B) Mixed primary hippocampal cultures (DIV14) immunolabeled with antibodies for RNF10 (red), glial marker GFAP (A; green) or the neuronal marker MAP2 (B; green), and Dapi (blue) to stain the nucleus; scale bar: 20 μm. (C) Dendrite of hippocampal neuron transfected with GFP-RNF10 (DIV7) and immunolabeled at DIV14 for GFP (green), GluN2A (red) and PSD-95 (blue); scale bar: 3 μm. (D) High-magnification confocal images of neuronal dendrites (DIV14) immunolabeled for endogenous RNF10 (green) and GluN2A (red; left panels) or PSD-95 (red; right panels); scale bar: 4 μm. (E) RNF10 and markers of the presynaptic (synaptophysin) and postsynaptic compartment (PSD-95, GluN2A) were analyzed by WB in various subcellular compartments (H: Homogenate fraction; S1: supernatant 1; P1: nuclear fraction; S2: cytosolic fraction 2; P2: crude membrane fraction 2; Syn: synaptosomal fraction; PSD1: Triton Insoluble postsynaptic fraction; PSD2: postsynaptic density fraction). (F) Representative confocal images of adult rat hippocampal CA1 pyramidal layer sections showing immunohistochemical labeling for RNF10 (red), MAP2 (green), and Dapi (blue); scale bar: 40 μm. (G) Confocal images of dendrites from hippocampal neurons (DIV14) transfected at DIV7 with shGluN2A or scramble vector and immunolabeled for GluN2A; scale bar: 4 μm. The histogram shows the quantification of GluN2A integrated density in dendrites (n=7, **p=0.0069 scramble vs shGluN2A; unpaired Student’s t-test). (H) GluN2A silencing induces a reduction of RNF10 enrichment at the glutamatergic synapse. Confocal images of primary hippocampal neurons transfected with pGFP-V-RS-scramble (left panels) or with pGFP-V-RS-shGluN2A (right panels) plasmids and immunolabeled (DIV14) for RNF10 (green) and PSD-95 (red); scale bar: 4 μm. The histogram shows the quantification of RNF10 co-localization with PSD-95-positive puncta (n=30, ***p<0.001; unpaired Student’s t-test). (I) Confocal images of dendrites from hippocampal neurons (DIV14) transfected at DIV7 with shGluN2A or scramble vector and immunolabeled for surface GluN2A (blue) and RNF10 (red); scale bar: 4 μm.
Figure 2
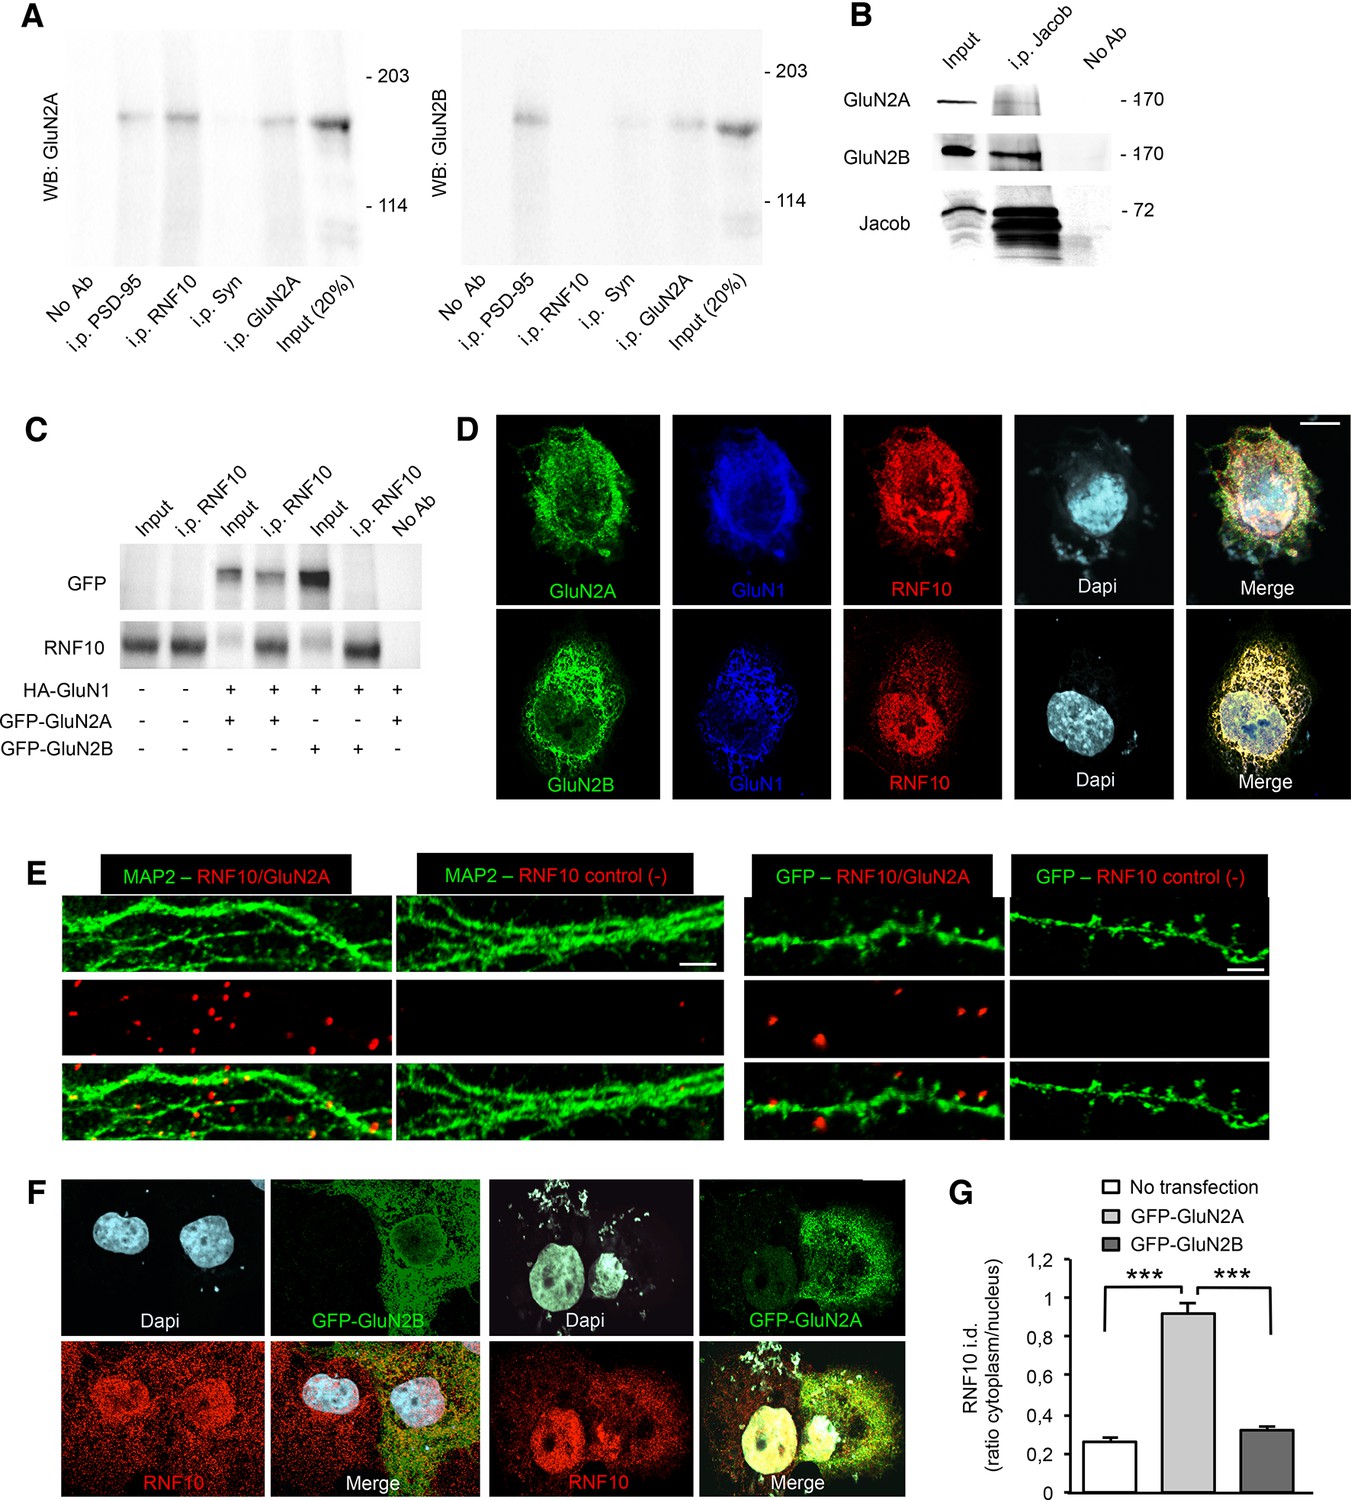
RNF10 interaction with GluN2A-containing NMDARs.
(A) Co-immunoprecipitation (co-i.p.) assay performed in P2 crude membrane fractions by using antibodies against PSD-95, RNF10, synaptophysin (Syn) and GluN2A. WB analysis shows the levels of GluN2A (left panel) and GluN2B (right panel) in the co-immunoprecipitated material. No ab lane: control lane in absence of antibodies during the co-i.p. assay. (B) Jacob is a part of the GluN2B receptor complex. Affinity purified pan-Jacob antibodies co-immunoprecipitate GluN2B. (C) Co-i.p. assay performed by using an anti-RNF10 antibody from COS-7 cell extracts transfected with HA-GluN1 and GFP-GluN2A or GFP-GluN2B. WB analysis was performed by using anti-GFP and anti-RNF10 antibodies. No ab lane: control lane in absence of antibodies during the co-i.p. assay. (D) COS-7 cells expressing RNF10 were transfected with HA-GluN1 and GFP-GluN2A or GFP-GluN2B constructs and immunolabeled for GFP (green), GluN1 (blue), Dapi (cyan) and endogenous RNF10 (red); scale bar: 10 μm. (E) In situ detection of proximity between RNF10 and GluN2A (red) along MAP2 (green; left panels) or GFP-positive (green; right panels) dendrites. In control experiments (-), primary hippocampal neurons were labeled with only RNF10 primary antibody and thus only unspecific PLA signals are generated; scale bars: 5 μm (MAP2) and 3 μm (GFP). (F, G) COS-7 cells expressing RNF10 were transfected with GFP-GluN2A (right panels) or GFP-GluN2B (left panels) constructs and immunolabeled for GFP (green), Dapi (cyan) and endogenous RNF10 (red); scale bar: 10 μm. The histogram shows the quantification of RNF10 integrated density (i.d.) expressed as cytoplasm/nucleus ratio (n=10; ***p<0.001; one-way ANOVA, followed by Bonferroni post-hoc test).
Figure 3

RNF10 N-terminal domain interacts with the juxtamembrane region of GluN2A C-tail.
(A) Scheme showing GST-GluN2A fusion proteins used in the pull-down assay. (B) GST and GST-GluN2A fusion proteins were incubated in a pull-down assay with rat hippocampal extracts. WB analysis was performed with RNF10 antibody. (C) Confocal images of COS-7 cells transfected with GFP-GluN2A (1–1049) and immunolabeled for GFP (green), Dapi (cyan) and RNF10 (red); scale bar: 10 μm. (D) Co-i.p. assay performed from lysates of COS-7 cells transfected with GFP-GluN2A or GFP-GluN2A(1–1049). WB analysis was performed by using a GFP antibody (JL-8). (E) GST and GST-RNF10 full-length (FL) fusion proteins were incubated in a pull-down assay with rat hippocampal extracts in presence or absence of calcium (2 mM). WB analysis was performed with GluN2A antibody. (F) GST and GST-GluN2A(839–1464) fusion proteins were incubated in a pull-down assay with rat hippocampal extracts in presence or absence of calcium (2 mM). WB analysis was performed with RNF10 and CaM antibodies. (G) GST and GST-GluN2A(839–1049) fusion proteins were incubated in a pull-down assay with rat hippocampal extracts with CaM (0.1 μM) in the presence or absence of calcium (2 mM). WB analysis was performed with RNF10 and CaM antibodies. (H) Co-i.p. assay performed from lysates of COS-7 cells transfected with GFP, GFP-GluN2A or GFP-GluN2B in the presence or absence of calcium (2 mM)/CaM (0.1 μM). WB analysis was performed by using RNF10 and CaM antibodies. (I) Co-i.p assay performed by using a GFP antibody from lysates of COS-7 cells transfected with RNF10 FL, RNF10(221–802) and GFP-GluN2A. WB analysis was performed by using a Myc antibody. No ab lanes: control lanes in absence of antibodies during the co-i.p. assay. (J) Co-i.p assay performed by using a Myc antibody from lysates of COS-7 cells transfected with RNF10 truncation mutants and GFP-GluN2A. WB analysis was performed by using a GFP antibody (JL-8). (K,L) COS-7 cells expressing RNF10 were transfected with GFP-GluN2A and Myc-RNF10 FL or Myc-RNF10 (221–802) constructs and immunolabeled for GFP (green), Myc (red) and Dapi (blue) (G); scale bar: 10 μm. The histogram (H) shows the quantification of Myc/EGFP co-localization index [n=10; ***p<0.001 RNF10 FL vs RNF10(221–802); unpaired Student’s t-test]. (M) GST and GST-RNF10 fusion proteins were incubated in a pull-down assay with rat hippocampal extracts. WB analysis was performed with GluN2A antibody.
Figure 4
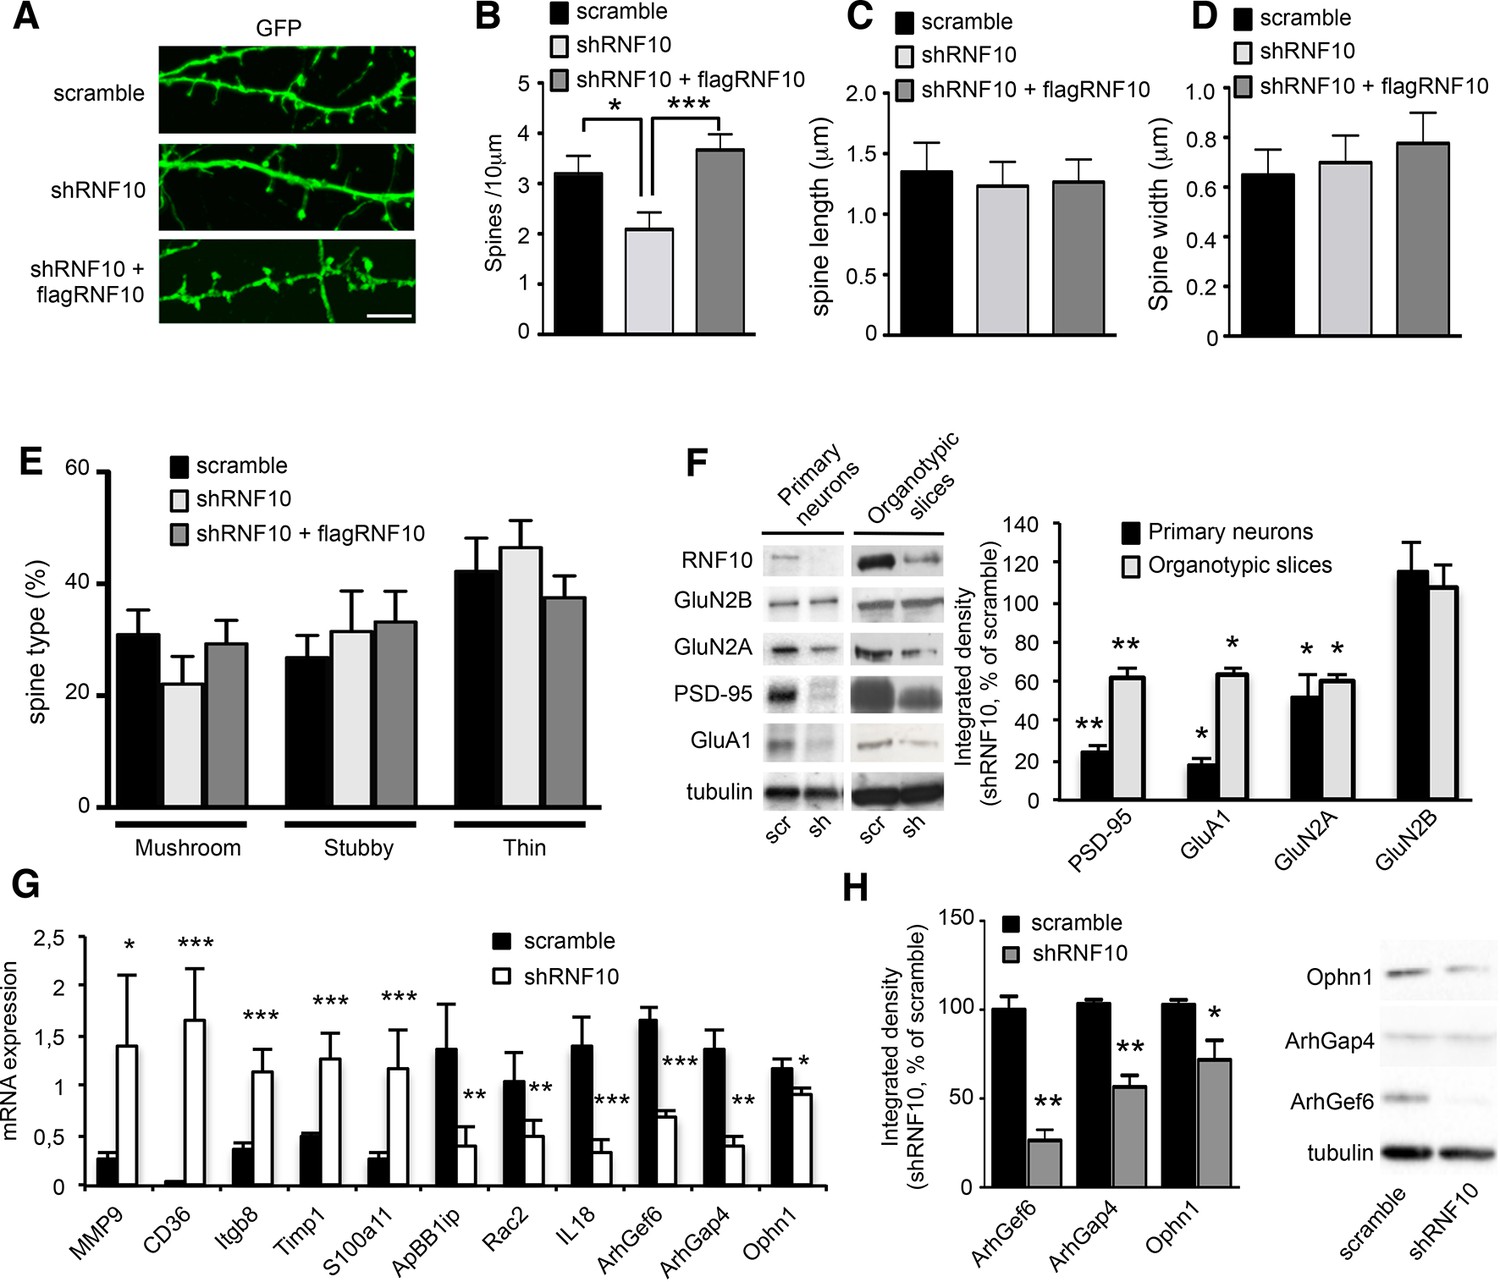
RNF10 silencing induces molecular and morphological modifications of the glutamatergic synapse.
(A) Confocal images of primary hippocampal neurons (DIV14) transfected at DIV7 with pGIPZ-scramble, shRNF10 and shRNF10 plus flagRNF10 and immunolabeled for GFP (green); scale bar: 5 μm. (B-E) Histograms showing the quantification of dendritic spine density (B) (n=6–10; *p<0.05, scramble vs shRNF10; ***p<0.001, shRNF10 vs shRNF10 + flagRNF10; one-way ANOVA, followed by Tukey post-hoc test), dendritic spine length (C), dendritic spine head width (D) and dendritic spine type (E). (F) WB analysis from homogenates of primary hippocampal neurons (DIV14) and organotypic hippocampal slices (DIV14) lentivirally infected with pGIPZ-scramble sequence (scramble) as control or with pLKO-shRNF10 (shRNF10). The histogram shows the quantification of the expression levels of GluN2A, GluA1, PSD-95 and GluN2B in shRNF10-infected neurons and slices, normalized on tubulin and expressed as % of scramble (n=6; *p<0.05; **p<0.01; unpaired Student’s t-test). (G) mRNA expression levels of genes associated with synaptic transmission or dendritic spine morphology by real-time PCR from DIV14 organotypic hippocampal slices lentivirally infected (DIV4) with pGIPZ-scramble sequence (scramble) as control or with pLKO-shRNF10 (shRNF10) (n=4, ***p<0.001; **p<0.01; *p<0.05; unpaired Student’s t-test). (H) WB for ArhGef6, ArhGap4, Ophn1 and tubulin from cell lysates of organotypic hippocampal slices infected with pGIPZ-scramble or with pLKO-shRNF10. The histogram shows the quantification of protein levels from shRNF10 samples with respect to pGIPZ-scramble, following normalization on tubulin (n=3, *p<0.05; **p<0.01; unpaired Student’s t-test).
Figure 5
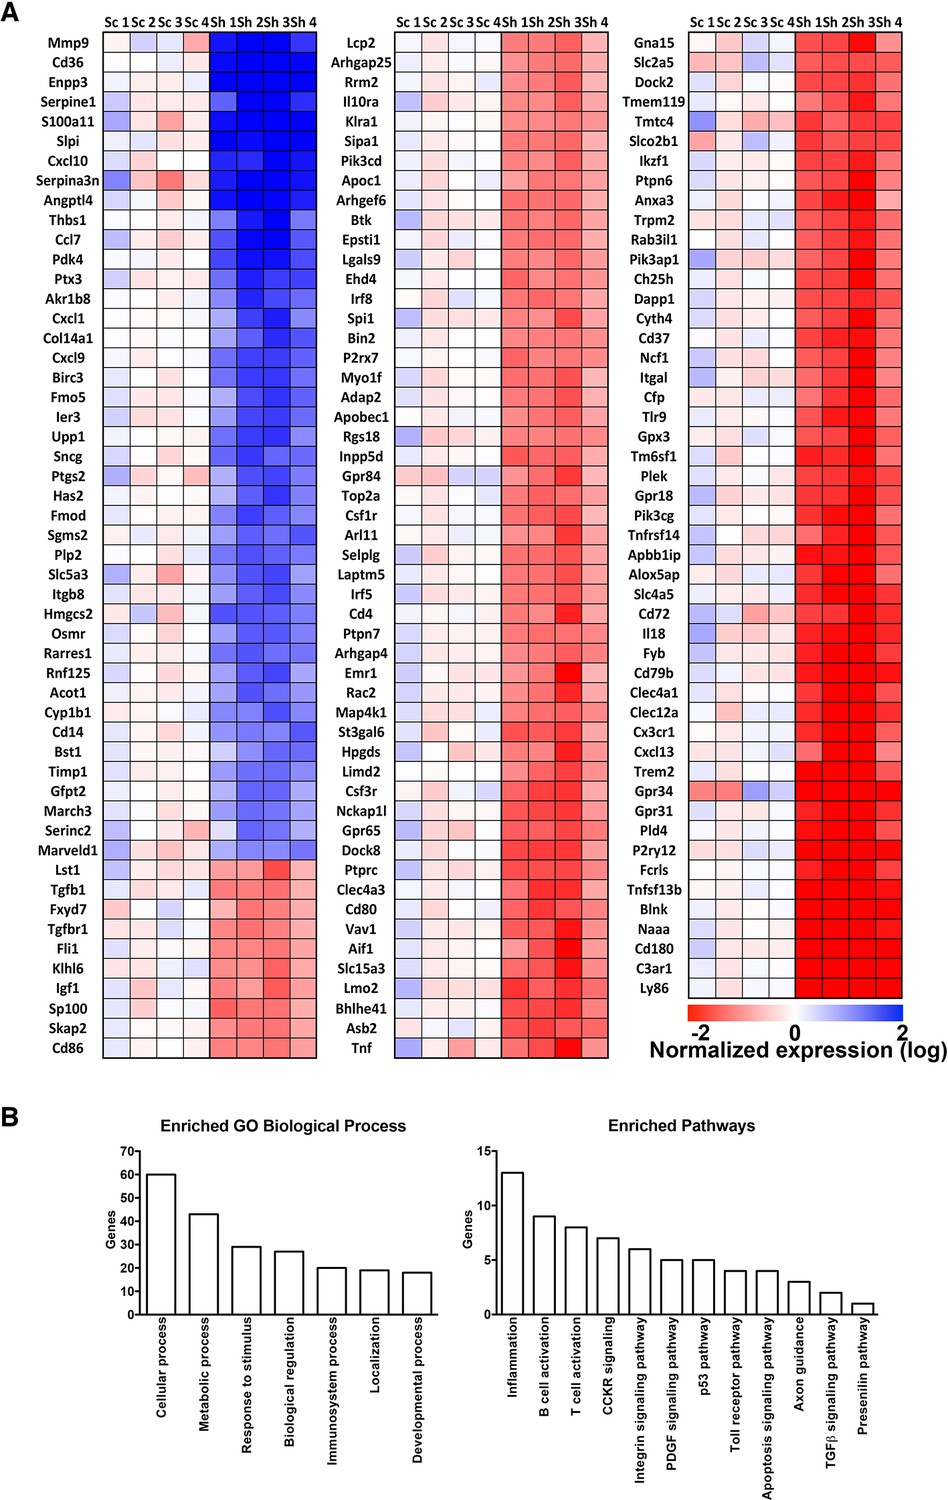
Heat map and gene ontology of differentially expressed genes identified in microarray experiments.
(A) Heat map of differentially expressed genes. Expression data are reported as log2 and blue color indicates high expression values and red color low expression value. Sc represents the different scramble control (1–4), while Sh represents the shRNA against RNF10 (5–8). (B) Gene ontology analysis of biological processes and enriched pathways analysis of differentially regulated genes in absence of RNF10.
Figure 6
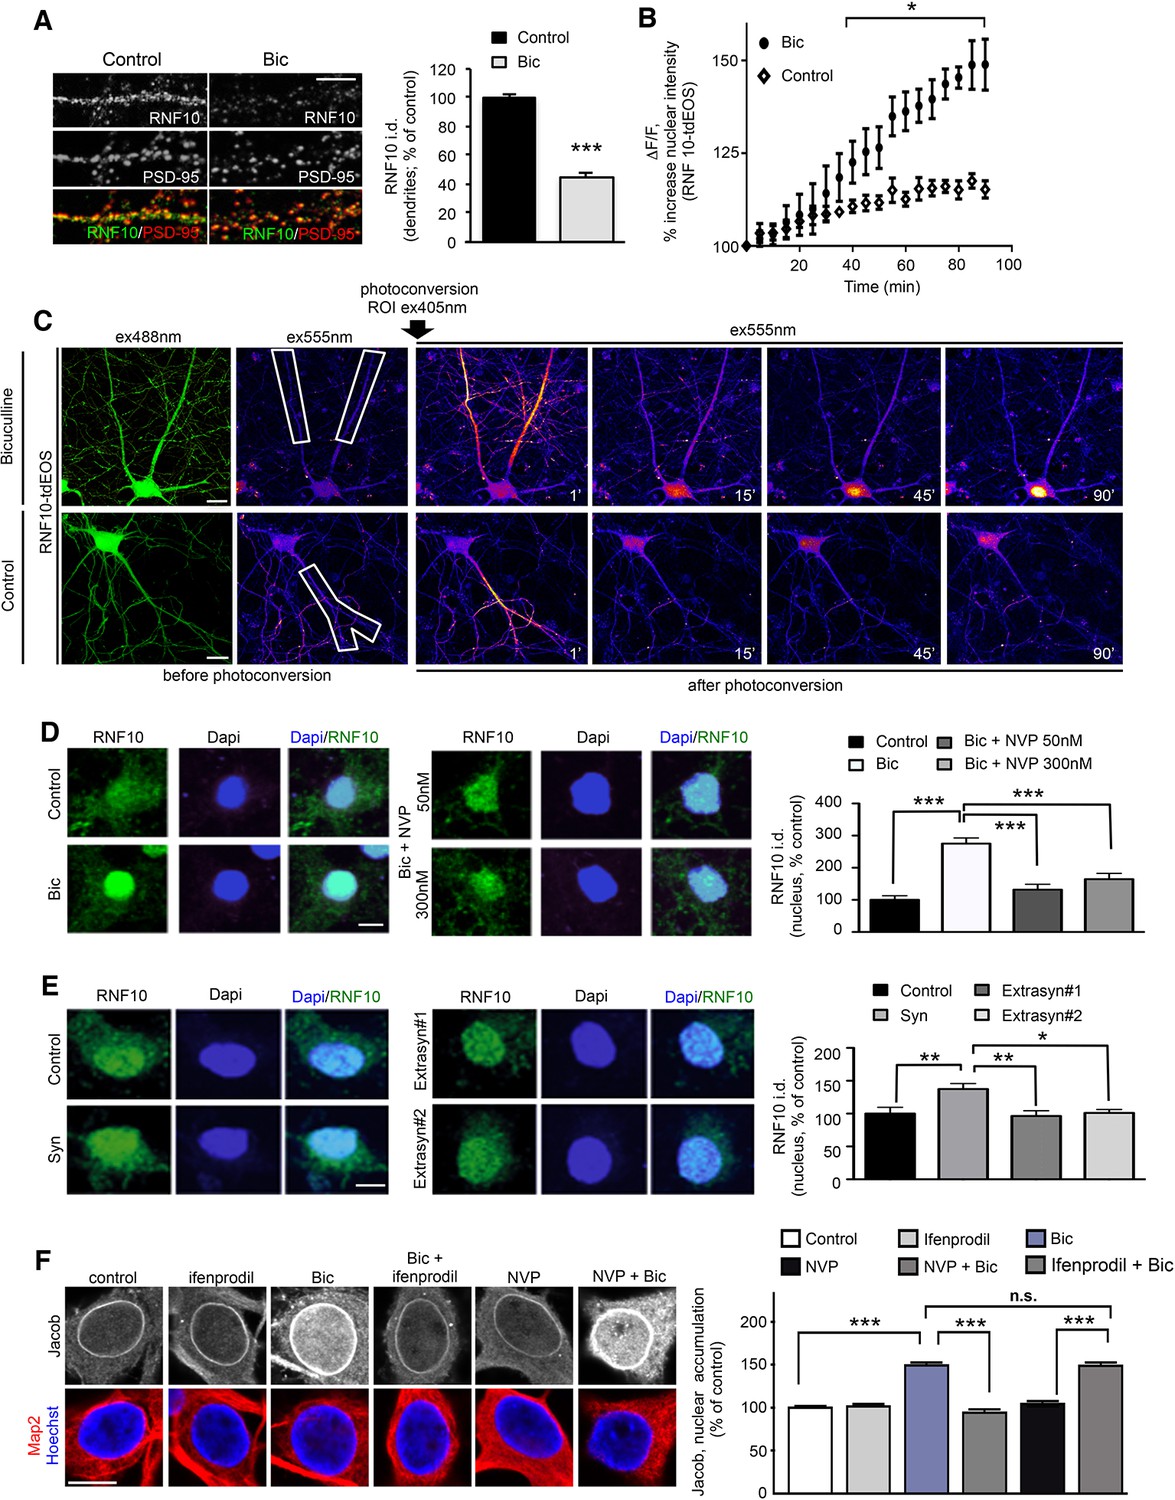
Activation of synaptic NMDARs triggers RNF10 translocation to the nucleus.
(A) Hippocampal neurons (DIV14) were incubated for 24 hr with 50 μM Bicuculline and 2.5 mM 4-AP ('Bic') and immunolabeled for RNF10 (green) and PSD-95 (red). The histogram shows the quantification of RNF10 levels along dendrites 24 hr after treatment (n=30, ***p<0.001; unpaired Student’s t-test); scale bar: 4 μm. (B,C) Bic treatment induces RNF10-tdEOS translocation from distal dendrites to the nucleus in hippocampal neurons. (B) The histogram shows a significant increase in RNF10-tdEOS photoconverted fluorescent intensities in the nucleus following Bic treatment (n=6; p<0.05 Bic vs. control, from 40' to 90'; unpaired Student’s t-test). (C), left panels: Baseline confocal image of RNF10-tdEOS expressing hippocampal neuron illuminated sequentially with 488 nm and 555 nm laser excitation wavelengths showing no emitted signal in the red spectra (ex555nm; left panels). Distal dendrite (ROI) selected for photoconversion was illuminated with UV laser (405 nm wavelengths) repetitively through the image z-stack. (C), right panels: Depicted are confocal max intensity projection images at respective time points in control after Bic treatment or in control (untreated) neurons; scale bar: 20 μm. (D) Hippocampal neurons (DIV14) were treated with Bic in presence of the GluN2A inhibitor NVP-AAM007 at different concentrations (50 and 300 nM), immunolabeled for RNF10 (green) and stained with Dapi (blue). The histogram shows the quantification of RNF10 integrated density in the nucleus expressed as % of control neurons (n=10, ***p<0.001 control vs Bic, Bic vs Bic+NVP 50 nM and Bic vs Bic+NVP 300 nM; one-way ANOVA followed by Bonferroni post-hoc test); scale bar: 10 μm. (E) Hippocampal neurons (DIV14) treated with 'Syn' (50 μM Bicuculline; 2.5 mM 4-AP; 5 μM Ifenprodil, 8 hr), with 'Extrasyn#1' or 'Extrasyn#2' protocols (see Materials and methods), immunolabeled for RNF10 (green) and stained with Dapi (blue). Histogram showing the quantification of RNF10 integrated density in the nucleus expressed as % of control neurons (n=8, *p<0.05 Extrasyn#2 vs Syn, **p<0.01 Syn vs Extrasyn#1 and Syn vs. control; one-way ANOVA followed by Bonferroni post-hoc test); scale bar: 10 μm. (F) Depicted are representative laserscans averaged from three confocal sections of the nucleus of DIV16 hippocampal primary neurons immunolabeled with affinity purified antibodies against pan-Jacob (rabbit) and co-labeled with anti-MAP2 antibodies as a neuronal specific marker. Neuronal nuclei are outlined with the DNA stain Hoechst 34580. Scale bar: 10 µm. Relative fluorescence intensities of Jacob 30 min of synaptic stimulation with and without selective inhibitors were normalized to untreated non-stimulated control (n=31–70, ***p<0.001; one-way ANOVA followed by Bonferroni post-hoc test).
Figure 7
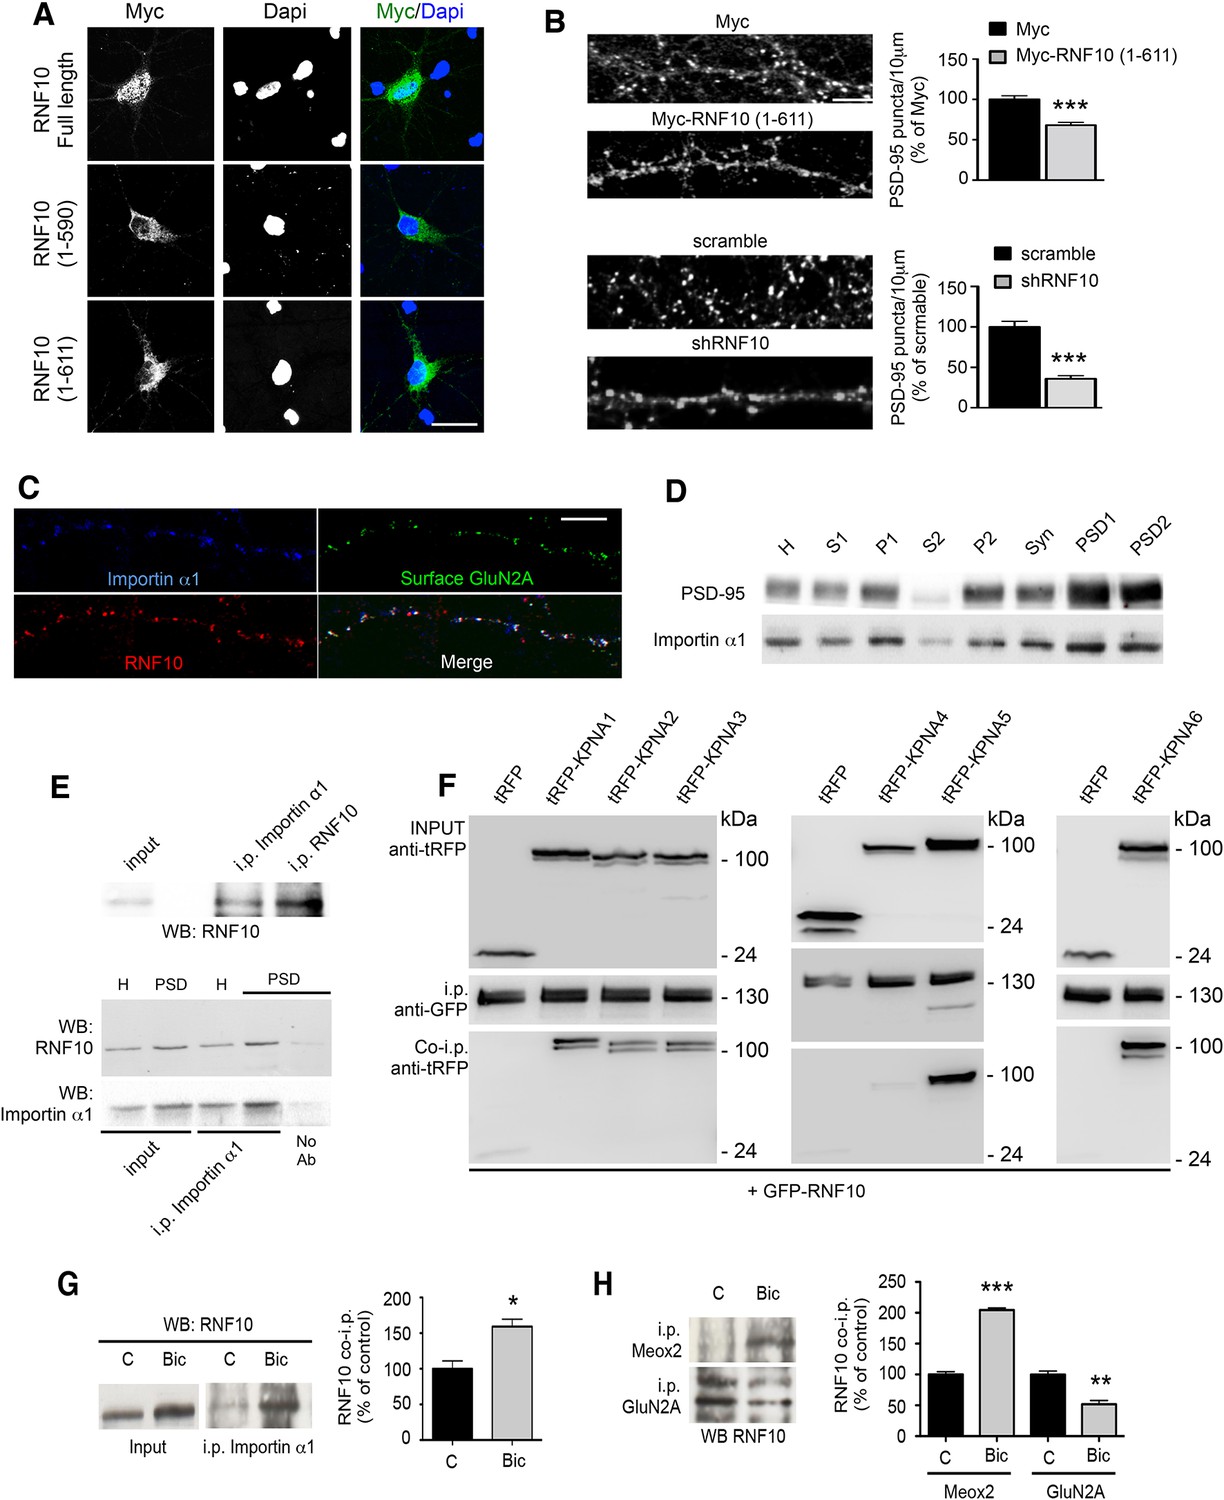
RNF10 translocates into the nucleus through NLS2-dependent interaction with importin α1.
(A) Confocal images of primary hippocampal neurons transfected with Myc-RNF10 full-length (FL) or Myc-RNF10 truncated mutants and immunolabeled for Myc (green) and Dapi (blue); scale bar: 20 μm. (B) Primary hippocampal neurons transfected with Myc, Myc-RNF10 (1–611), pGIPZ-scramble or with shRNF10 were immunolabeled (DIV14) for PSD-95. The histograms show the quantification of PSD-95-positive puncta expressed as % of Myc (upper histogram) or scramble (lower histogram) transfected neurons (n=50–88, ***p<0.001, Myc-RNF10 (1–611) vs Myc and shRNF10 vs scramble; unpaired Student’s t-test); scale bar: 4 μm. (C) Confocal images of dendrites of hippocampal neurons (DIV14) immunolabeled for RNF10 (red), surface GluN2A (green) and importin α1 (blue); scale bar: 4 μm. (D) Importin α1 and PSD-95 protein levels were analyzed by means of WB analysis in various subcellular compartments purified from rat hippocampal tissue (H: Homogenate fraction, S1: supernatant 1, P1: nuclear fraction, S2: cytosolic fraction 2, P2: crude membrane fraction 2, Syn: synaptosomal fraction, PSD1: Triton insoluble postsynaptic fraction, PSD2: postsynaptic density fraction). (E) Representative co-i.p. assay showing the interaction between RNF10 and importin α1 in hippocampal tissue homogenate (upper and lower panel) and PSD fraction (lower panel). No Ab lane: control lane in absence of the antibody. WB analysis was performed with RNF10 and importin α1 antibodies. (F) RNF10-tagged with GFP was co-expressed with multiple importin α isoforms (KPNA1-KPNA6) tagged with tagRFP in HEK293T cells. RNF10-GFP was immunoprecipitated from cell extract using anti-GFP MicroBeads. Co-immunoprecipitated importinerase - α isoforms were detected in complex with RNF10 using anti-tagRFP antibodies. (G) Co-i.p. assay performed by using an importin α1 antibody from cell homogenates of control (C) neurons or treated with Bic. WB analysis was performed with RNF10 antibody. The histogram shows the quantification of RNF10/importin α1 interaction expressed as % of control (n=3, *p<0.05; unpaired Student’s t-test). (H) Representative co-i.p. assay from cell homogenates of control (C) neurons or treated with Bic. WB analysis was performed with RNF10 antibody. The histogram shows the quantification of RNF10 interaction with GluN2A and Meox2 expressed as % of control (n=3, ***p<0.001, Meox2, Bic vs control; **p<0.01, GluN2A, Bic vs control; unpaired Student’s t-test).
Figure 8
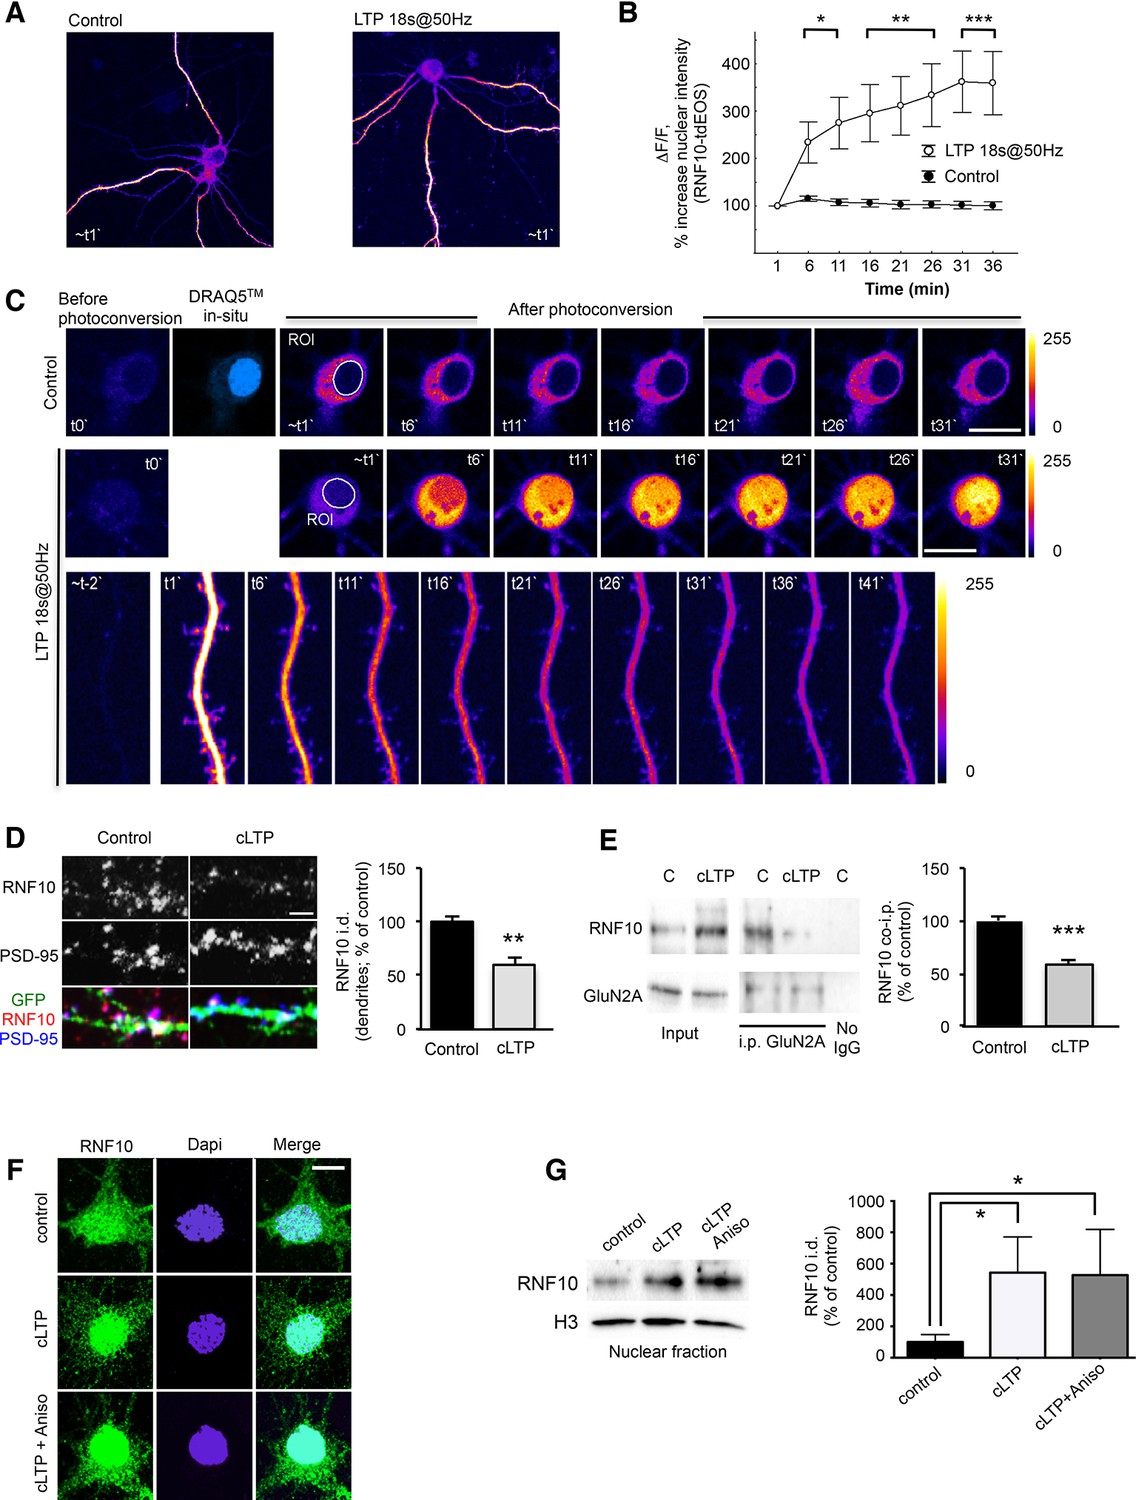
LTP induction triggers RNF10 translocation to the nucleus.
(A–C) RNF10-tdEOS translocates from distal dendrites to the nucleus in mature hippocampal neurons upon high-frequency 18s@50Hz field synaptic stimulation. Distal dendrites (ROIs) selected for photoconversion were illuminated with UV laser (405 nm wavelengths) repetitively through the image z-stack (image t0`). (A) Representative images of control and stimulated RNF10-tdEOS expressing hippocampal neurons illuminated with 568 nm laser excitation wavelength 1 min following photoconversion. (B) The histogram shows a significant increase in RNF10-tdEOS photoconverted fluorescent intensities in the nucleus following high frequency 18s@50Hz field synaptic stimulation (n=9, *p<0.05, **p<0.01, ***p<0.001; unpaired Student’s t-test). (C) Depicted are confocal max intensity projection images of control and stimulated RNF10-tdEOS expressing hippocampal neurons at respective time points after stimulation. Lower panels: magnified image sequence of UV illuminated dendritic segment with multiple spines is represented showing the decrease in distal dendrites upon field stimulation. All experiments were performed in a presence of anisomycin (7.5 µM). (D) Confocal images of dendrites of hippocampal neurons (DIV14) transfected with GFP (green) to visualize neurites and immunolabeled for RNF10 (red) and PSD-95 (blue). The histogram shows the quantification of RNF10 signal in dendrites 2 hr after induction of cLTP (see Materials and methods) expressed as % of control (n=5, **p<0.01; unpaired Student’s t-test); scale bar: 4 μm. (E) Co-i.p. assay from hippocampal extracts performed with an antibody against GluN2A. WB analysis was performed using antibody for RNF10 and GluN2A. The graph shows the effect of cLTP induction on RNF10 interaction with GluN2A expressed as % of control (n=4, ***p<0.001; unpaired Student’s t-test). (F) Representative confocal images of hippocampal neurons (DIV14) after the induction of cLTP in the presence or absence of 7.5 μM anisomycin and immunolabeled for RNF10 (green) and Dapi (blue); scale bar: 10 μm. (G) WB analysis for RNF10 from P1 nuclear fraction purified from hippocampal neurons after the induction of cLTP in the presence or absence of 7.5 μM anisomycin. The histogram shows the quantification of RNF10 integrated density normalized on Histone-H3 (n=4, *p<0.05, control vs cLTP and control vs cLTP+Anisomycin; one-way ANOVA, followed by Tukey post-hoc test).
Figure 9

NLS2 peptide but not anysomicin blocks RNF10 accumulation in the nucleus after induction of cLTP.
(A) Confocal images from living hippocampal neurons transfected with dTomato (DIV10) and treated with TAT-TF2 or NLS2-TF2 coniugated peptide (DIV14). Samples were illuminated with 543 nm and 488 nm to visualize respectively neurons and peptide. The representative image shows the presence of peptide (green) within the neuron (red, DTOMATO), demonstrating the capability of crossing the plasmatic membrane; scale bar: 10 μm. (B) Representative co-i.p. assay performed by using anti-RNF10 antibody and showing the interaction between RNF10 and importin α1 in primary hippocampal neurons (DIV14) treated with NLS2 peptide (active) or TAT (control) peptide. No IgG lane: control lane in absence of the antibody. WB analysis was performed with importin α1 and RNF10 antibodies. The histogram shows the quantification of importin α1 interaction with RNF10 expressed as % of control (TAT; n=3; *p<0.05; unpaired Student’s t-test). (C, E) Hippocampal neurons (DIV14) were treated with NLS2 peptide (active) or TAT (inactive) peptide for 24 hr and then cLTP was induced in the presence of the same peptides. Confocal images show the immunolabeling for RNF10 (green) and the staining for Dapi (blue) in the nucleus (C) or PSD-95 (red) along dendrites (E); scale bars: 10 μm (C) and 4 μm (E). (D, F) The histograms show the quantification of RNF10 signal in the nucleus (D) and along dendrites (F) after the induction of cLTP in the presence of TAT or NLS2 peptides expressed as % of control [n=10,11 (D), n=17–19 (F)]; *p<0.05; **p<0.01; *p<0.001; one-way ANOVA, followed by Tukey post-hoc test). (G, H) WB analysis for RNF10 from P1 crude nuclear fraction purified from hippocampal neurons after the induction of cLTP in the presence of NLS2 or TAT peptide (G). The histogram (H) shows the quantification of RNF10 integrated density normalized on Histone-H3 and expressed as % of control (n=4, *p<0.05; one-way ANOVA, followed by Tukey post-hoc test). (I) Representative co-i.p. assay performed with an antibody against RNF10 from cell lysates of hippocampal neurons following induction of cLTD. WB analysis was performed using antibody for RNF10 and GluN2A. (J) Confocal images of the soma of hippocampal neurons (DIV14) treated with a protocol to induce cLTD and then immunolabeled for RNF10 (green) and stained with Dapi (blue). Scale bar: 10 μm.
Figure 10
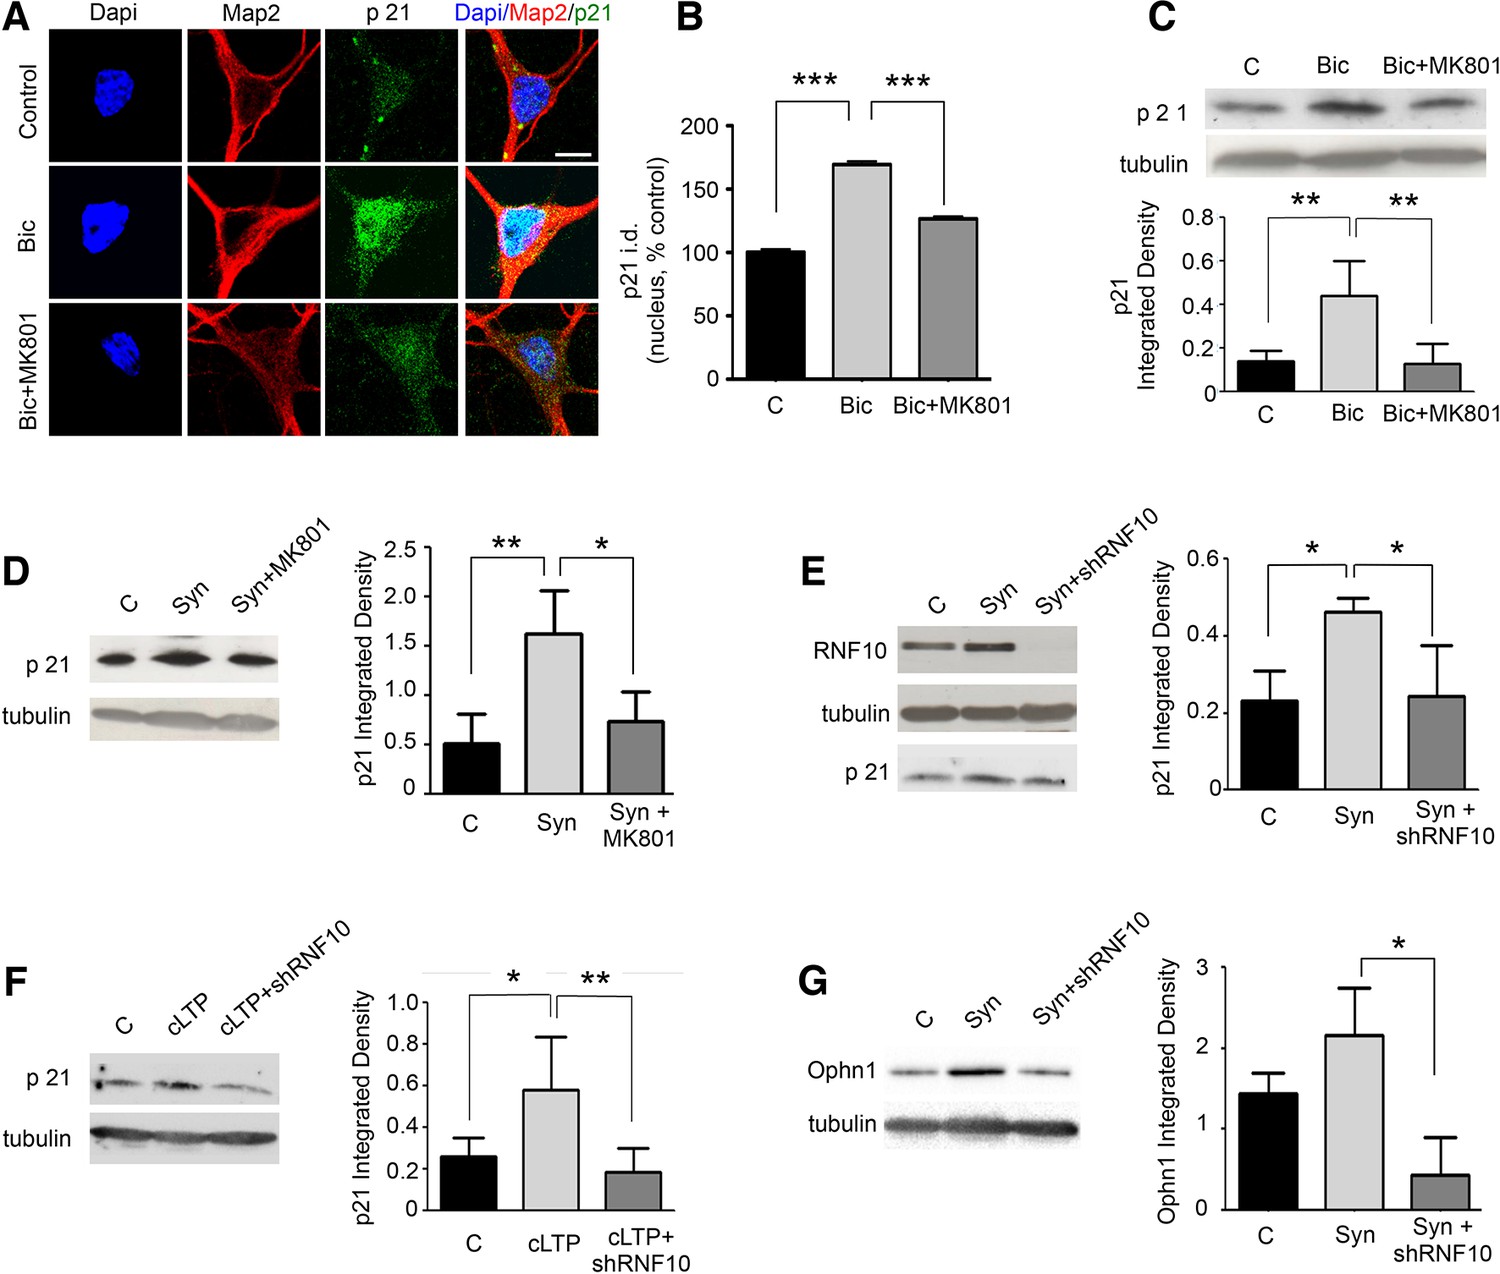
RNF10 nuclear trafficking regulates the expression level of specific target genes.
(A) Hippocampal neurons (DIV14) were treated with Bic in the presence or absence of MK801, immunolabeled for MAP2 (red), p21WAF1/cip1 (green) and stained with Dapi (blue); scale bar: 10 μm. (B) Histogram showing the quantification of p21WAF1/cip1 signal in the nucleus expressed as % of control (n=15, ***p<0.001 Bic vs control and Bic+MK801 vs Bic; one-way ANOVA, followed by Bonferroni post-hoc test). (C) WB analysis from cell lysates of hippocampal neurons treated with Bic in presence or absence of MK801. The histogram shows the quantification of p21WAF1/cip1 integrated density normalized on tubulin (n=5, **p<0.01 Bic vs control and Bic+MK801 vs Bic; one-way ANOVA, followed by Bonferroni post-hoc test). (D) WB analysis for p21WAF1/cip1 and tubulin performed on cell lysates from DIV14 hippocampal neurons treated for synaptic stimulation (Syn; see Materials and methods) in the presence or absence of MK801. The histogram shows the quantification of p21WAF1/cip1 levels normalized on tubulin (expressed as integrated density) (n=5, **p<0.01, Syn vs control; *p<0.05 Syn+MK801 vs Syn; one-way ANOVA, followed by Bonferroni post-hoc test). (E) WB analysis for RNF10, p21WAF1/cip1 and tubulin performed on cell lysates from hippocampal neurons virally infected with pLKO-shRNF10 or control vector and treated at DIV14 for Syn. The histogram shows the effect of RNF10 silencing on p21WAF1/cip1 expression levels normalized on tubulin (n=4, *p<0.05, Syn vs control and Syn+shRNF10 vs Syn; one-way ANOVA, followed by Bonferroni post-hoc test). (F) WB analysis for p21WAF1/cip1 and tubulin from hippocampal extracts following induction of cLTP in the presence or absence of viral infection with pLKO-shRNF10. The graph shows the modulation of p21WAF1/cip1 levels (following normalization on tubulin) (n=5, *p<0.05, cLTP vs control, **p<0.01, cLTP + pLKO-shRNF10 vs cLTP; one-way ANOVA, followed by Bonferroni post-hoc test). (G) WB analysis for Ophn1 and tubulin performed on cell lysates from hippocampal neurons virally infected with pLKO-shRNF10 or control vector and treated at DIV14 for Syn. The histogram shows the effect of RNF10 silencing on Ophn1 expression levels normalized on tubulin (n=3, *p<0.05, Syn+shRNF10 vs Syn; one-way ANOVA, followed by Bonferroni post-hoc test).
Figure 11
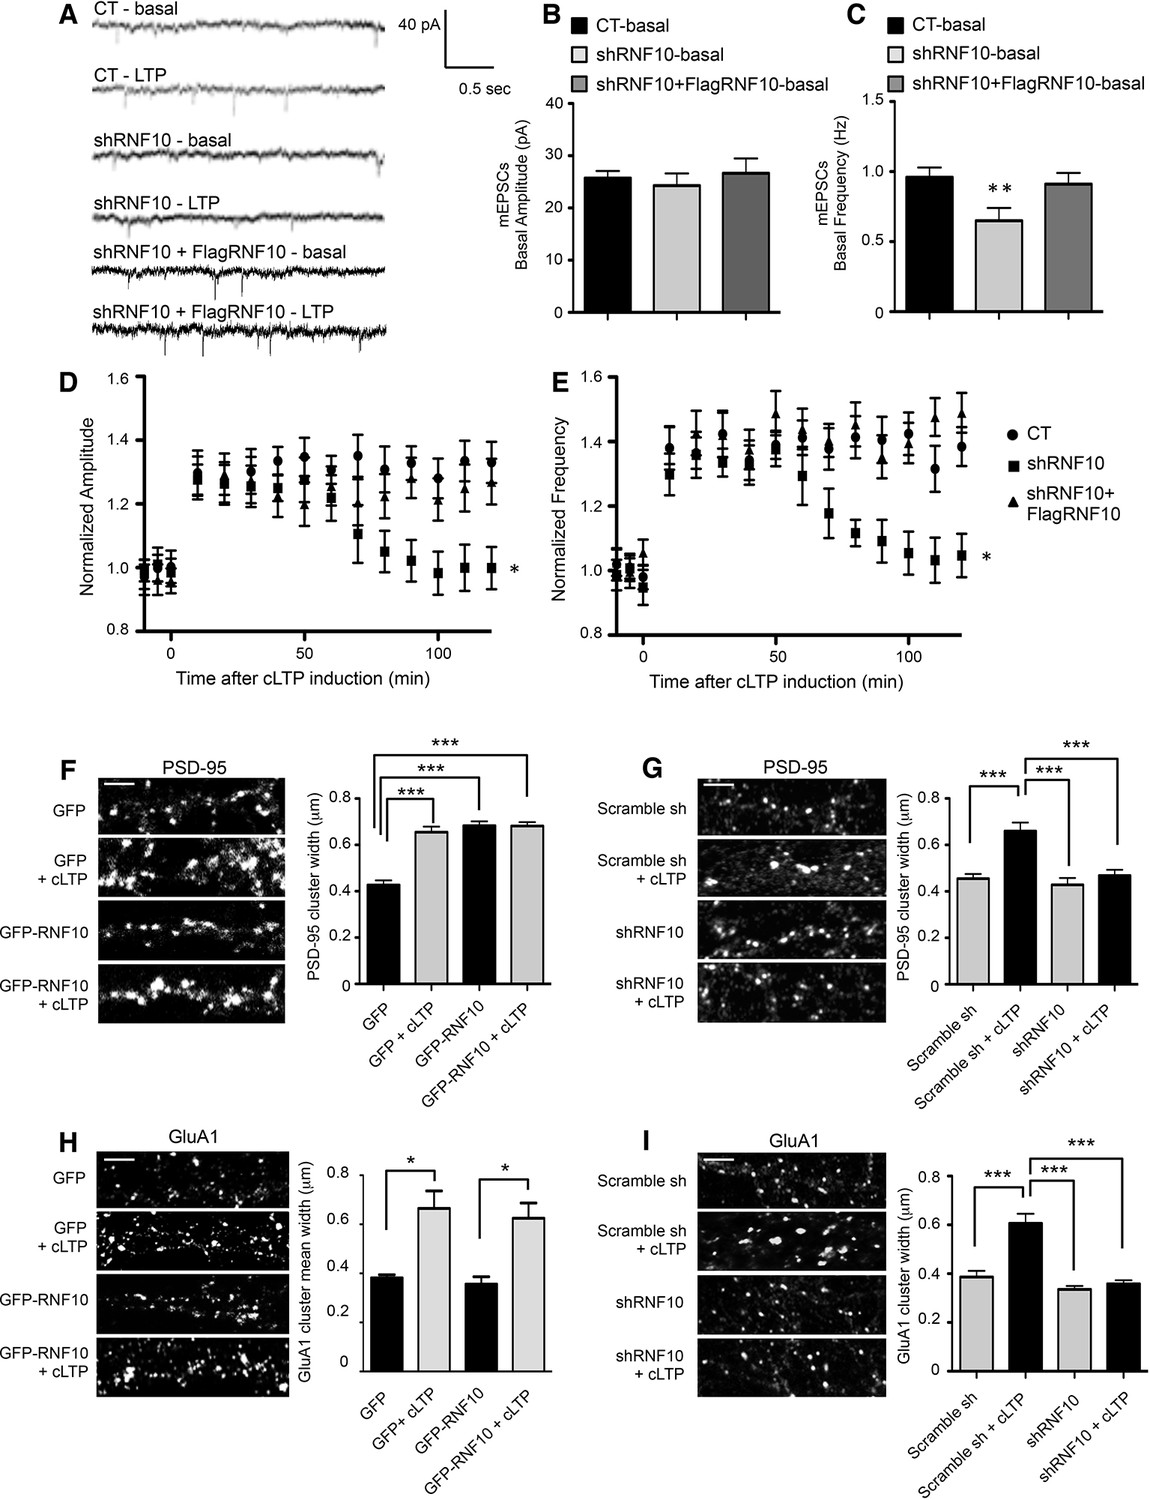
Down-regulation of RNF10 expression prevents cLTP expression.
(A) mEPSCs recorded at -60 mV before (basal), and after cLTP induction in hippocampal neurons transfected or not (CT) with shRNF10 or with shRNF10 + FlagRNF10. (B, C) Basal amplitude (B) and frequency (C) of mEPSCs, prior cLTP induction (**p<0.01, shRNF10 vs CT). (D, E) Time-course of amplitude (D) and frequency (E) of mEPSC following cLTP induction (*p<0.05, shRNF10 vs CT). (F, H) Effects of RNF10 overexpression on cLTP-induced modifications of dendritic spine morphology. Confocal images of hippocampal neuron dendrites (DIV14) transfected at DIV7 with GFP or GFP-RNF10, treated for cLTP induction and immunolabeled for PSD-95 (F) or GluA1 (H); scale bar: 4 μm. The histograms show the quantification of PSD-95 (F) and GluA1 (H) clusters width (PSD-95: n=6, ***p<0.001; GluA1: n=8–10, *p<0.05; one-way ANOVA, followed by Bonferroni post-hoc test). (G, I) Effects of RNF10 silencing on cLTP-induced modifications of dendritic spine morphology. Confocal images of hippocampal neuron dendrites (DIV14) transfected at DIV7 with scramble sh or shRNF10, treated for cLTP induction and immunolabeled for PSD-95 (G) or GluA1 (I); scale bar: 4 μm. The histograms show the quantification of PSD-95 (G) and GluA1 (I) clusters width (PSD-95: n=6, ***p<0.001; GluA1: n=8–10, ***p<0.001; one-way ANOVA, followed by Bonferroni post-hoc test).
Download links
A two-part list of links to download the article, or parts of the article, in various formats.
Downloads (link to download the article as PDF)
Open citations (links to open the citations from this article in various online reference manager services)
Cite this article (links to download the citations from this article in formats compatible with various reference manager tools)
Ring finger protein 10 is a novel synaptonuclear messenger encoding activation of NMDA receptors in hippocampus
eLife 5:e12430.
https://doi.org/10.7554/eLife.12430


