Electrical and Ca2+ signaling in dendritic spines of substantia nigra dopaminergic neurons
- National Institute of Neurological Disorders and Stroke, National Institutes of Health, United States
Figures
Figure 1
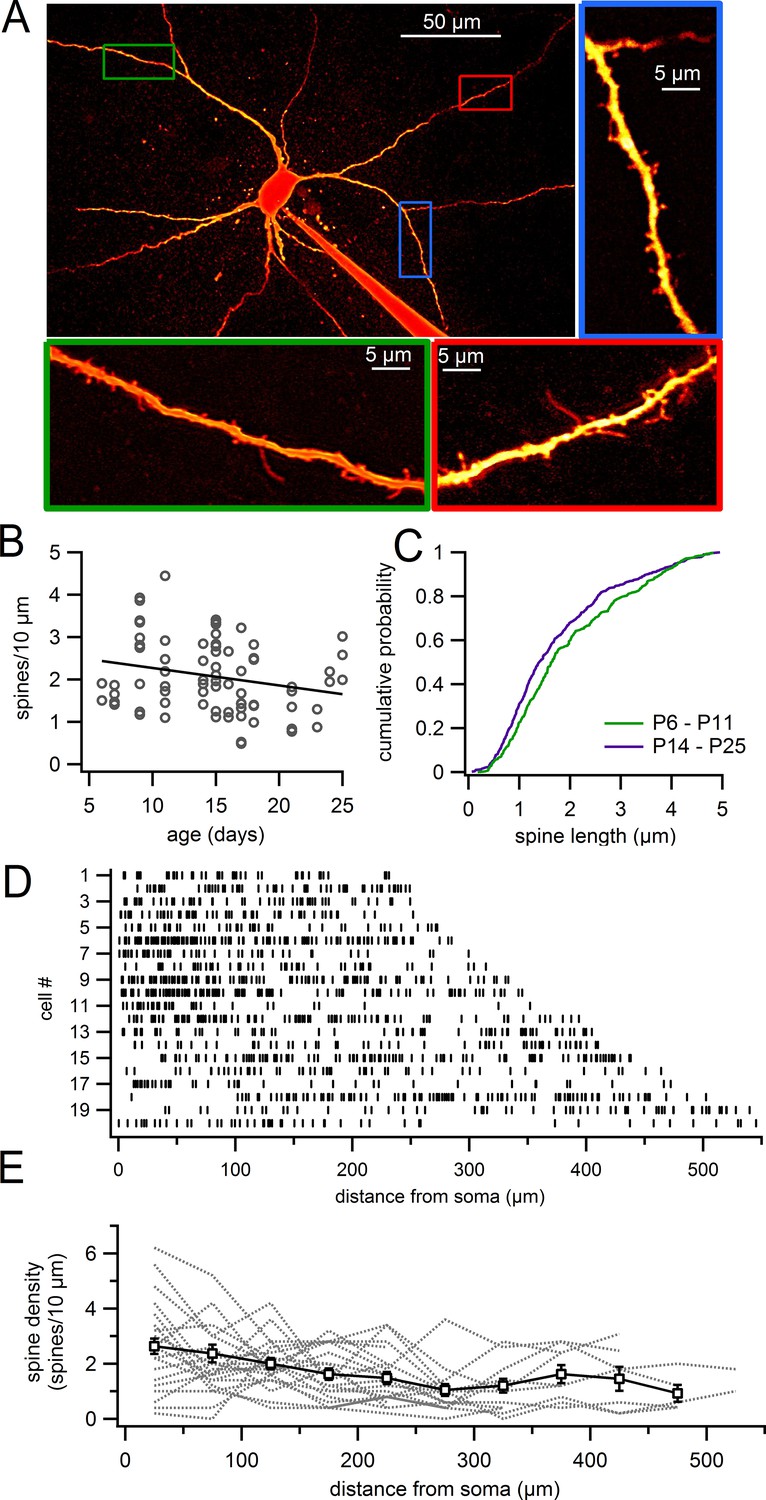
Dendritic spines on SNc dopamine neurons visualized in live slices.
(A) SNc dopamine neuron filled with Alexa-594 via patch pipette, visualized on a two-photon microscope. Higher magnification of selected dendritic segments are shown in green, blue and red boxes. (B) Plot of spine density versus age for dendritic segments visualized in live slices. (C) Cumulative histogram showing distribution of spine lengths for P6 – P11 (green) and P14 – P25 (purple) mice. (D) Distribution of spines (indicated by vertical lines) along continuous stretches of dendrite from 20 different cells. (E) Plot of spine density versus distance from the 20 dendrites in previous panel (gray dashed lines) and averages with s.e.m. (white boxes).
Figure 2
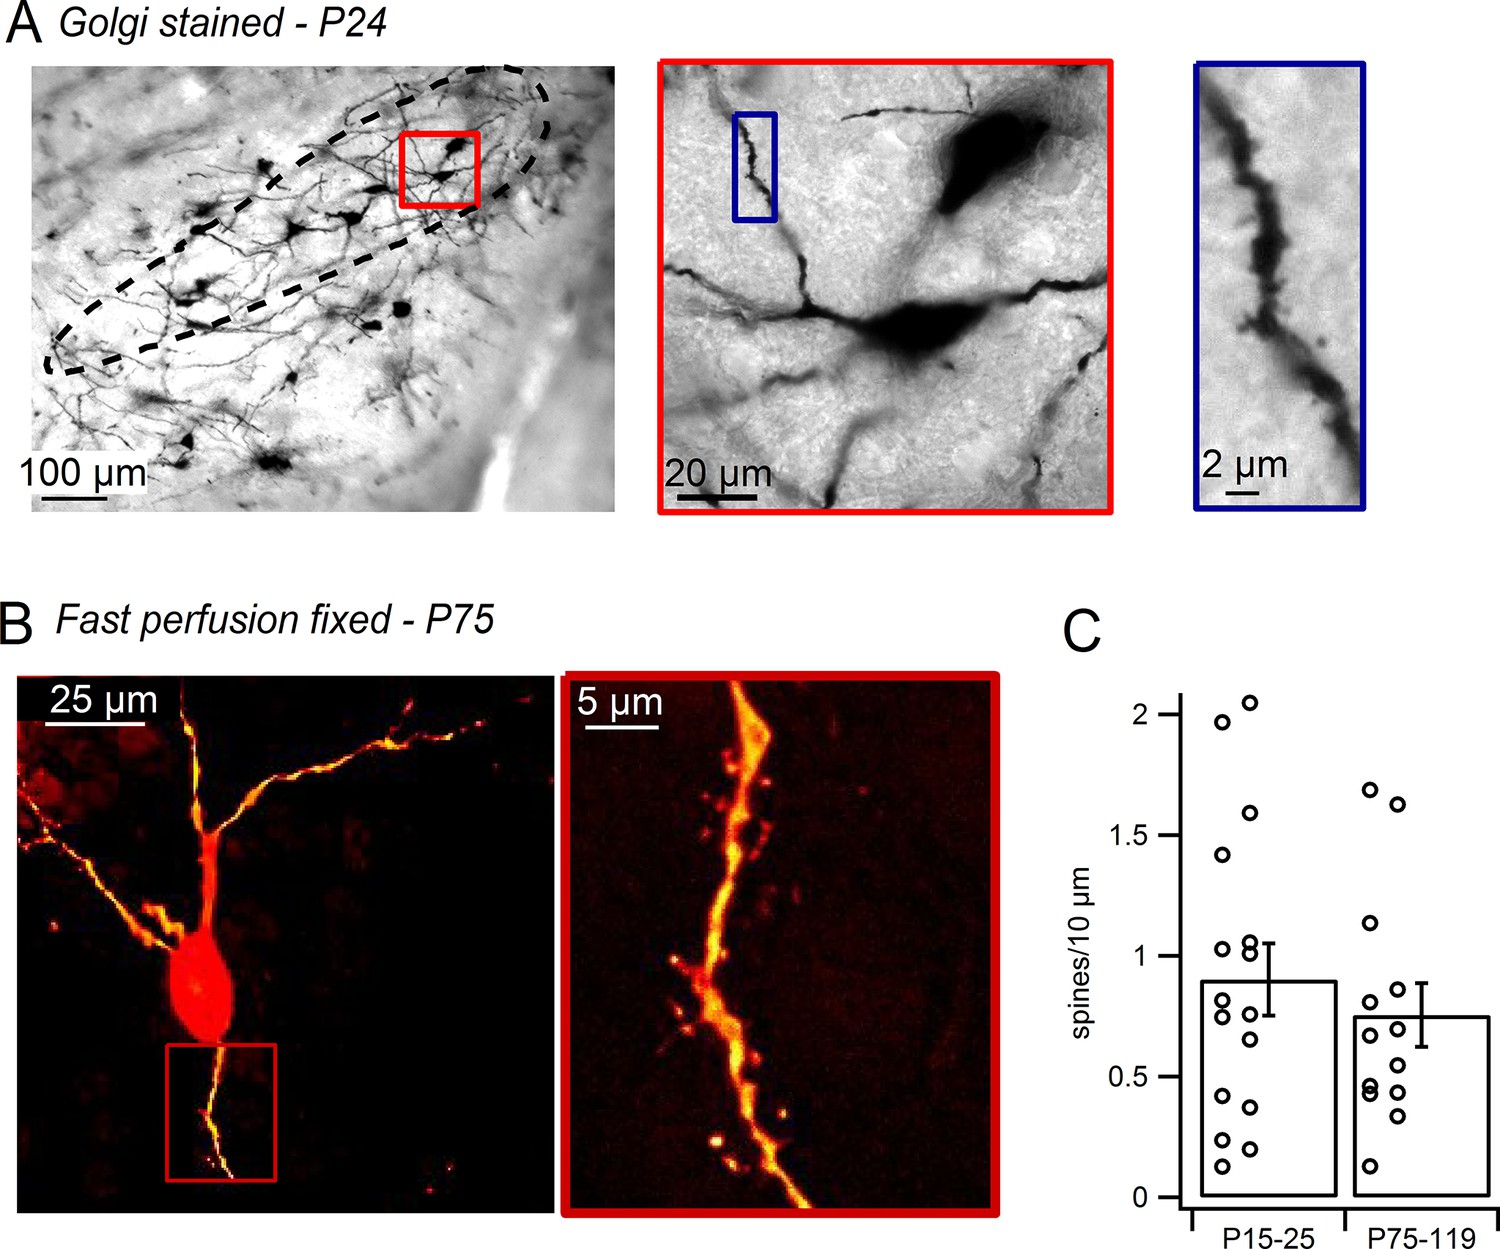
Dendritic spines on SNc dopamine neurons visualized in perfusion-fixed slices.
(A) Golgi stained sagittal slice from P24 mouse. SNc indicated by black outline. Red box shows a putative dopamine neuron at higher magnification. Blue box shows selected dendritic segment with dendritic spines. (B) SNc dopamine neuron from brain of transcardially-perfused, P75 mouse visualized by juxtacellular labeling with Alexa-594. Red box shows spiny dendritic segment at higher magnification. (C) Bar plot of average SNc dopamine neuron spine densities measured in perfusion-fixed brain slices.
Figure 3
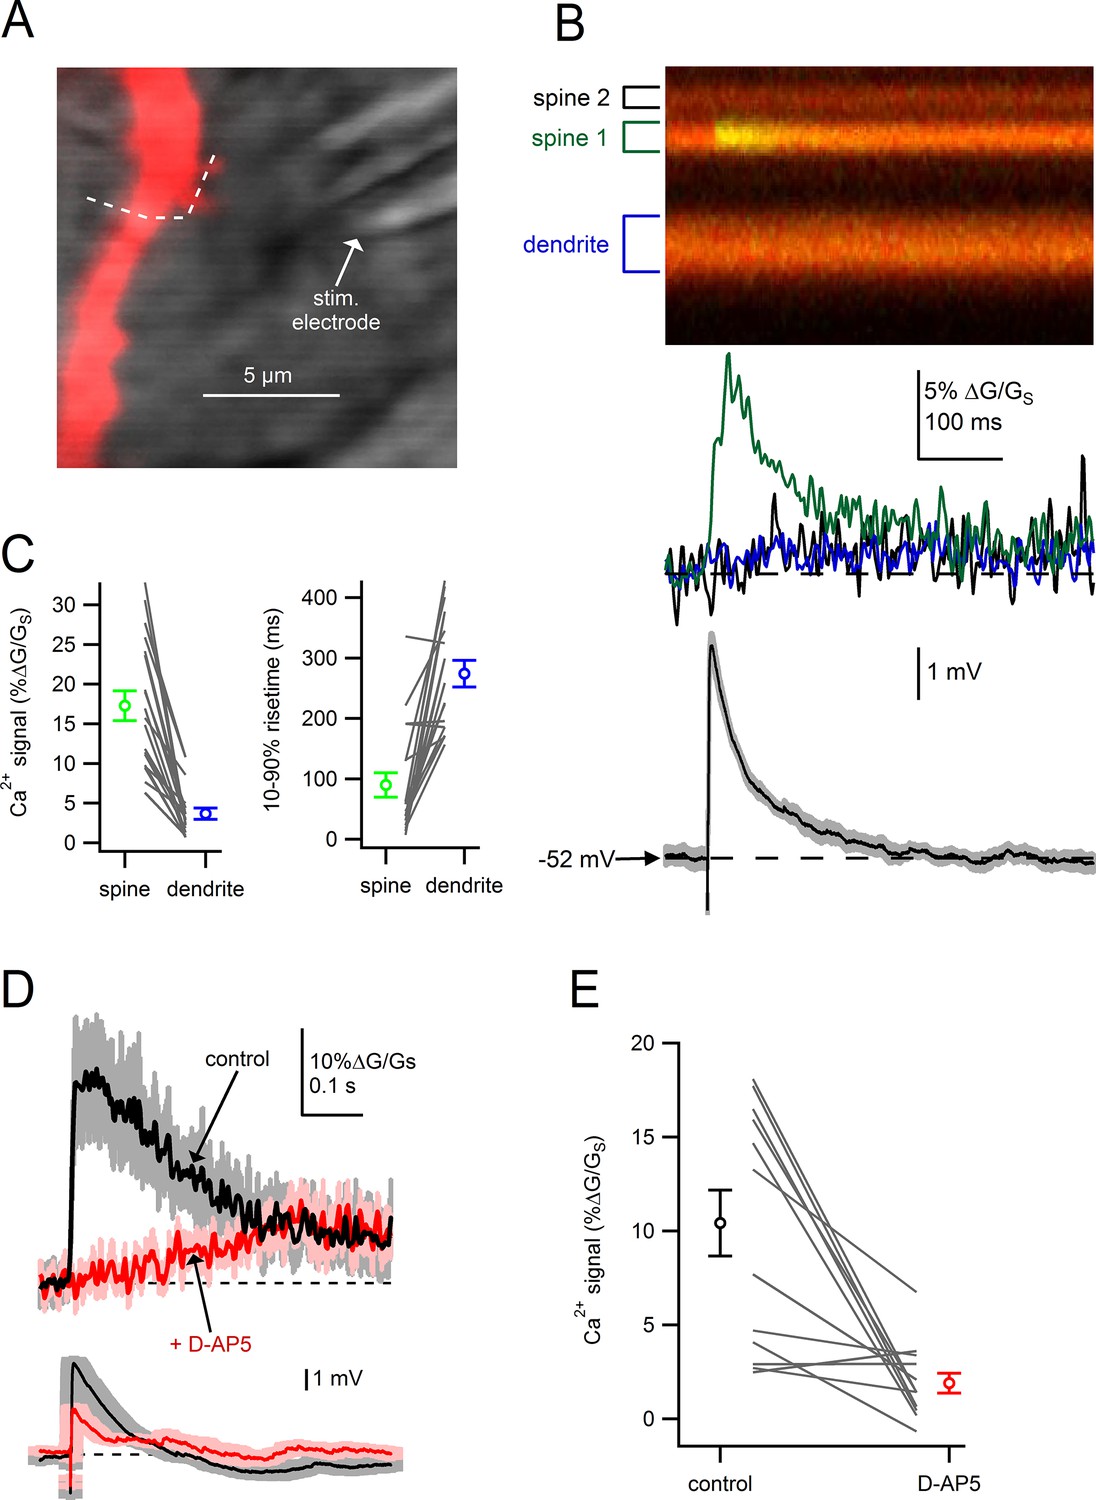
Dendritic spines on SNc dopamine neurons are sites of glutamatergic synaptic inputs.
(A) Dendritic segment visualized with Alexa-594 and Dodt contrast image to visualize the stimulation electrode. White dashed line indicates path of linescan. (B) Linescan images of Alexa-594 (red) and Fluo5F (green) and quantified Ca2+ signals in spine 1 (green), spine 2 (black) and the dendrite (blue). Simultaneously recorded somatic EPSP shown below. (C) Peak amplitudes and rise times of synaptically-evoked Ca2+ signals into a spine and parent dendrite for all spines tested (black lines). Average values and s.e.m. for spine (green) and dendrite (blue) shown in outer circles. (D) top: Ca2+ influx into the spine head in response to synaptic stimulation in control conditions (black) and after wash on of 50 µM D-AP5 (red). bottom: Corresponding somatically recorded EPSPs. (E) Peak amplitude of spine Ca2+ signal before and after application of D-AP5.
Figure 4 with 1 supplement

Comparison of uEPSPs for short and long spines.
(A) Dendritic segment with neighboring spines of different lengths visualized by Alexa-594 (bottom spine = 4.2 µm, top spine = 1.6 µm). Sites of glutamate uncaging are indicated by blue and orange circles. (B) Glutamate uncaging-evoked responses of spines in A. Blue traces correspond to the long spine, orange traces correspond to the short spine. Top: glutamate-evoked spine Ca2+ signals. Bottom: uEPSPs. (C) Amplitude of spine Ca2+ signal plotted against spine length for all spines tested (dots) and linear regression. (D) uEPSP amplitudes of neighboring short (<2 µm) and long (>2 µm) spines. Circles represent mean and s.e.m. (E) Amplitudes of uncaging-evoked EPSPs plotted against spine length for all spines tested (dots) and linear regression.
Figure 4—figure supplement 1
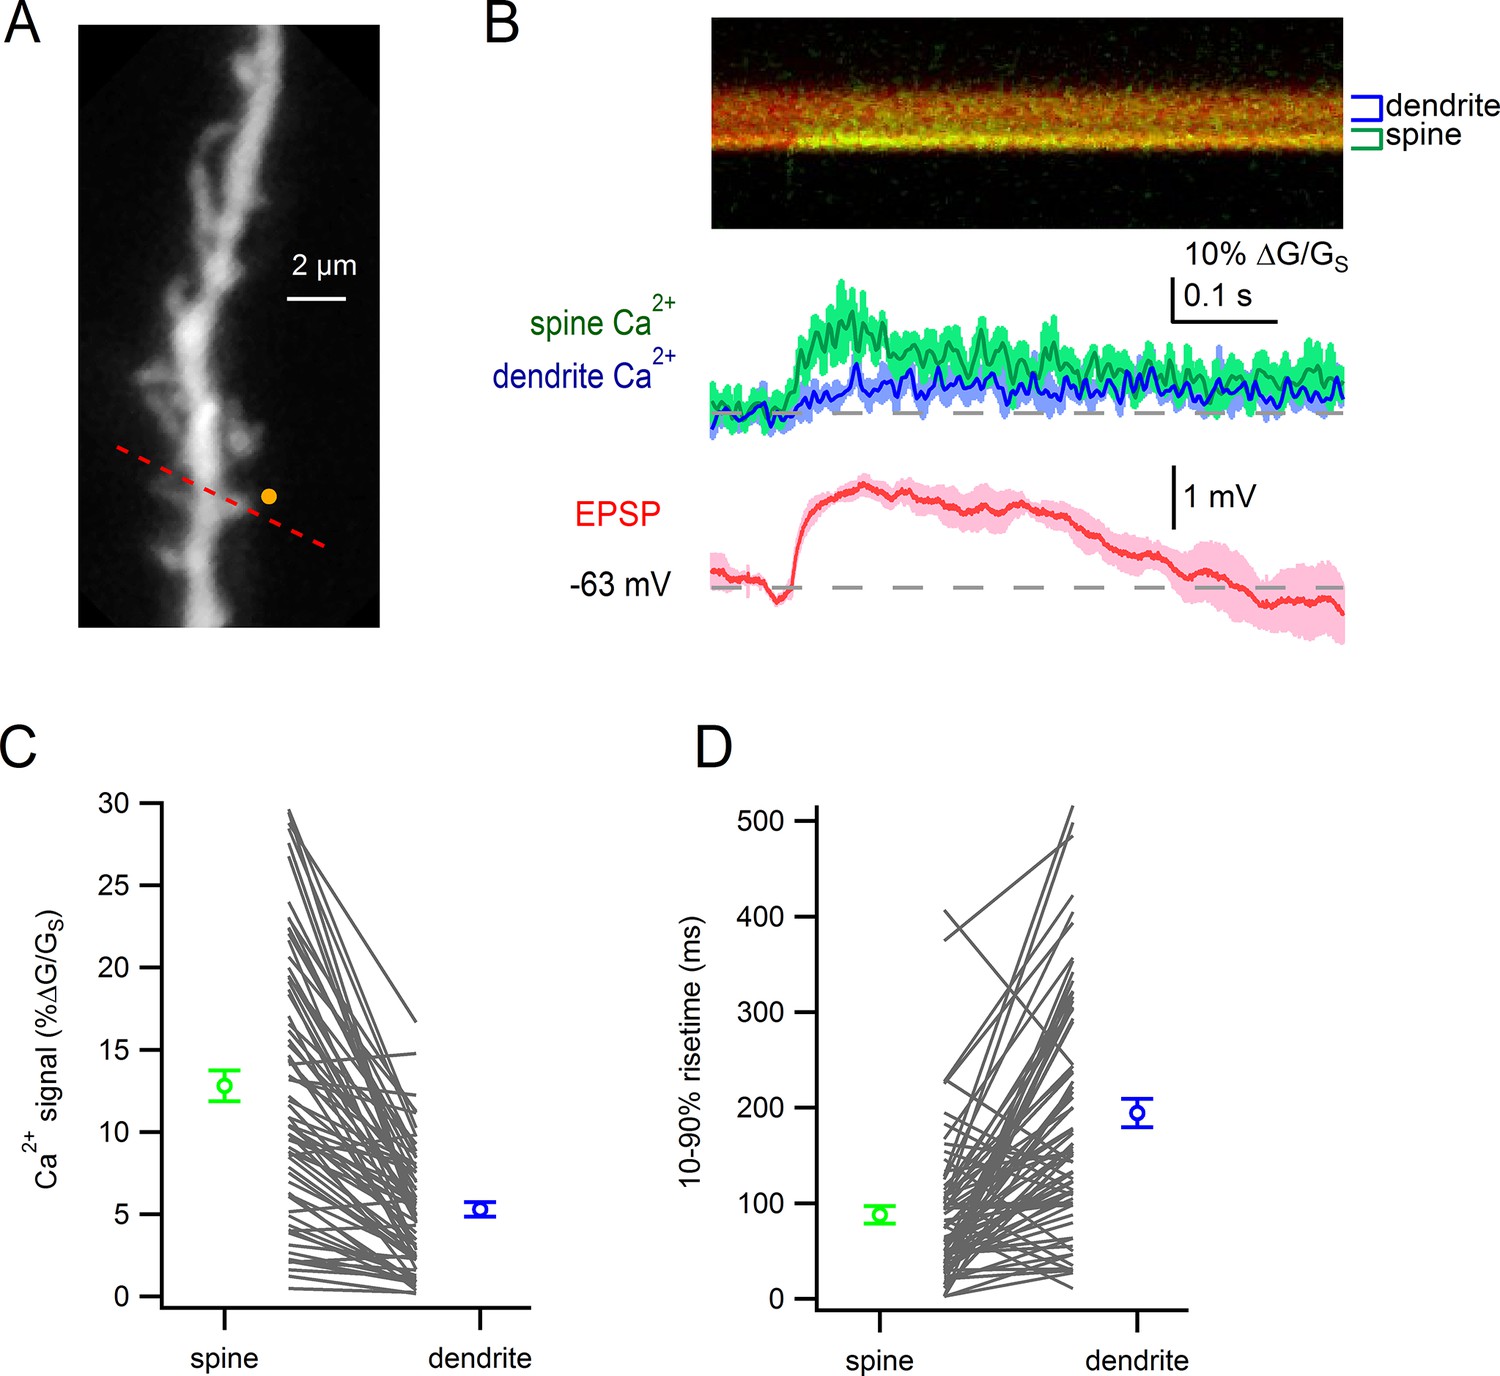
Glutamate uncaging-evoked responses of dendritic spines.
(A) Dendritic segment visualized by Alexa-594. Site of glutamate uncaging indicated by yellow circle. (B) Glutamate uncaging-evoked responses. Green trace: spine Ca2+ signal; blue trace: dendrite Ca2+ signal; red trace: somatic EPSP. (C) Peak amplitudes of uncaging-evoked Ca2+ signals into a spine and parent dendrite for all spines tested (black lines). Average values and s.e.m. for spine (green) and dendrite (blue) shown in outer circles. Amplitudes were significantly larger in the spines than in nearby dendrites (p=4.7e-15). (D) Rise times of uncaging-evoked Ca2+ signals into a spine and parent dendrite for all spines tested (black lines). Average values and s.e.m. for spine (green) and dendrite (blue) shown in outer circles. Rise times were significantly faster in the spines than in nearby dendrites (p=3.4e-10)
Figure 5

Spine length correlates with chemical compartmentalization.
(A) Frame scan of assayed spine, path of linescan (red line), and site of photobleaching (yellow). (B) Spine fluorescence intensity following selective photobleaching of spine head. Timing of photobleaching pulse indicated by vertical yellow line. Subsequent recovery of fluorescence was fit with a double-exponential function (purple). (C) Time constant of FRAP plotted against spine length with linear regression (purple line). (D) Time constant of FRAP plotted against spine head volume with linear regression (purple line). (E) uEPSP evoked from spine shown in A. (F) uEPSP amplitude plotted against estimated spine neck resistance with linear regression for all data (solid red line). Linear regression for all data except the 2 spines with the highest estimated neck resistance indicated by dashed line.
Figure 6
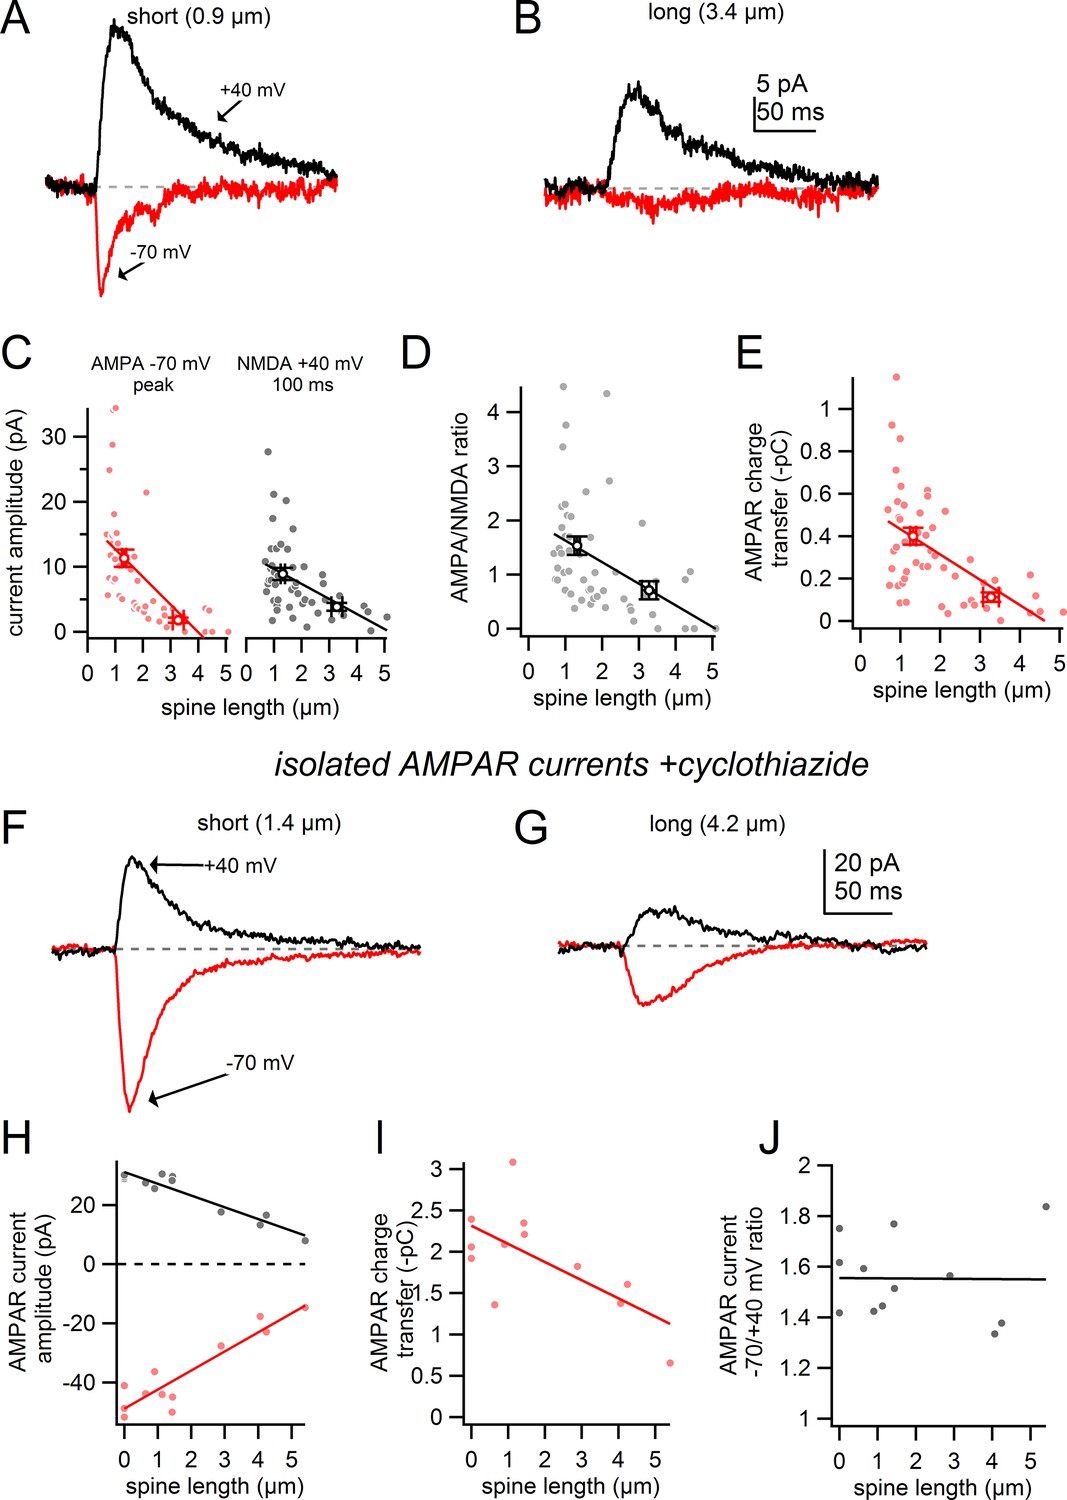
Comparison of AMPA/NMDA ratio for short and long spines.
(A) Uncaging-evoked currents recorded at -70 mV (red) and +40 mV (black) from targeting a short spine (0.9 µm). (B) Uncaging-evoked currents as in A from targeting a nearby long spine (3.4 µm). (C) Plot of AMPAR (red) and NMDAR (black) – mediated current amplitudes versus spine length for all spines tested and corresponding linear regressions. (D) Plot of AMPA/NMDA ratio versus spine length for all spines tested and linear regression. Circles indicate mean and s.e.m. for short and long spines. (E) Plot of AMPAR charge transfer versus spine length for all spines test and linear regression. (F) Uncaging-evoked currents as in A in the presence of CTZ and D-AP5 while targeting a short spine (1.4 µm). (G) Uncaging-evoked currents as in F from targeting a nearby long spine (4.2 µm). (H) Plot of AMPAR– mediated current amplitudes measured at −70 mV and +40 mV in the presence of CTZ and corresponding linear regressions. (I) Plot of AMPAR charge transfer versus spine length and linear regression. (J) Plot of the ratio of AMPAR current amplitudes measured at -70 and +40 mV versus spine length and linear regression.
Figure 7 with 1 supplement
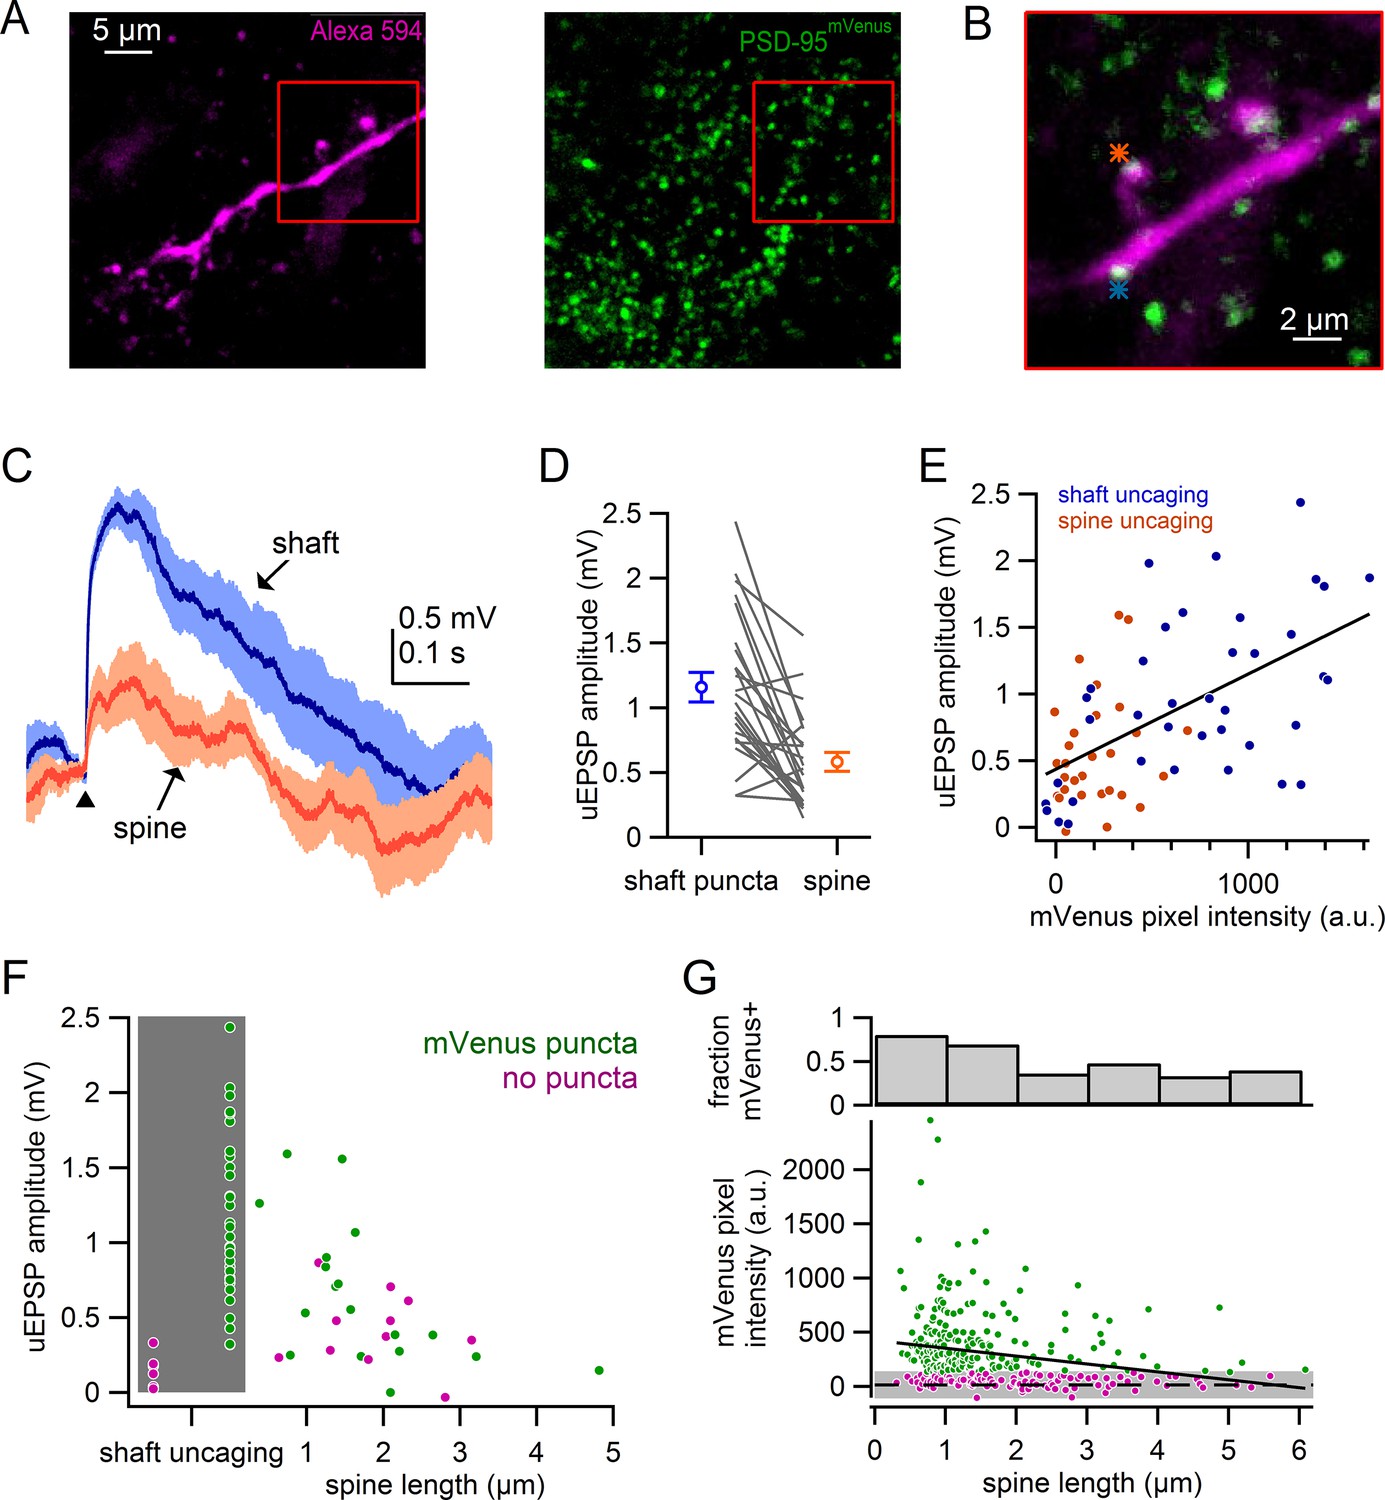
Comparison of spine and shaft synapses.
(A) Maximum intensity projections of two photon images from a recorded neuron in DAT-Cre x PSD-95-ENABLED mouse.Left: Alexa-594-filled dendrite. Right: PSD-95mVenus puncta. Red boxes indicate region shown in B. (B) Overlay of a single slice of the z-stack from images in A, asterisks indicate sites of glutamate uncaging targeting a spine (orange) and a shaft synapse (blue). (C) uEPSPs evoked in response to targeting of a shaft puncta (blue) and spine (orange) located on the same dendrite. (D) Comparison of uEPSP amplitudes when targeting shaft synapses or nearby spines. Circles represent averages and s.e.m. (E) Plot of uEPSP amplitude versus mVenus pixel intensity for shafts (blue) and spines (orange). (F) Plot of uEPSP amplitude versus spine length with shaft uncaging sites indicated by grey box. Green circles indicate that mVenus pixel intensity was >2 standard deviations above background green pixel intensity. Magenta circles indicate that the spine or shaft did not display significant mVenus signal. (G) Plot of mVenus pixel intensity and the fraction of mVenus-positive spines against spine length. Grey box indicates average background mVenus signal ± 2 standard deviations. Green and magenta circles indicate spines with or without significant mVenus signal.
Figure 7—figure supplement 1

Plot of the measured spine density versus the measured shaft synapse density for individual dendritic segments (filled circles) and average values (empty circle).
Dashed line indicates equal densities.
Figure 8
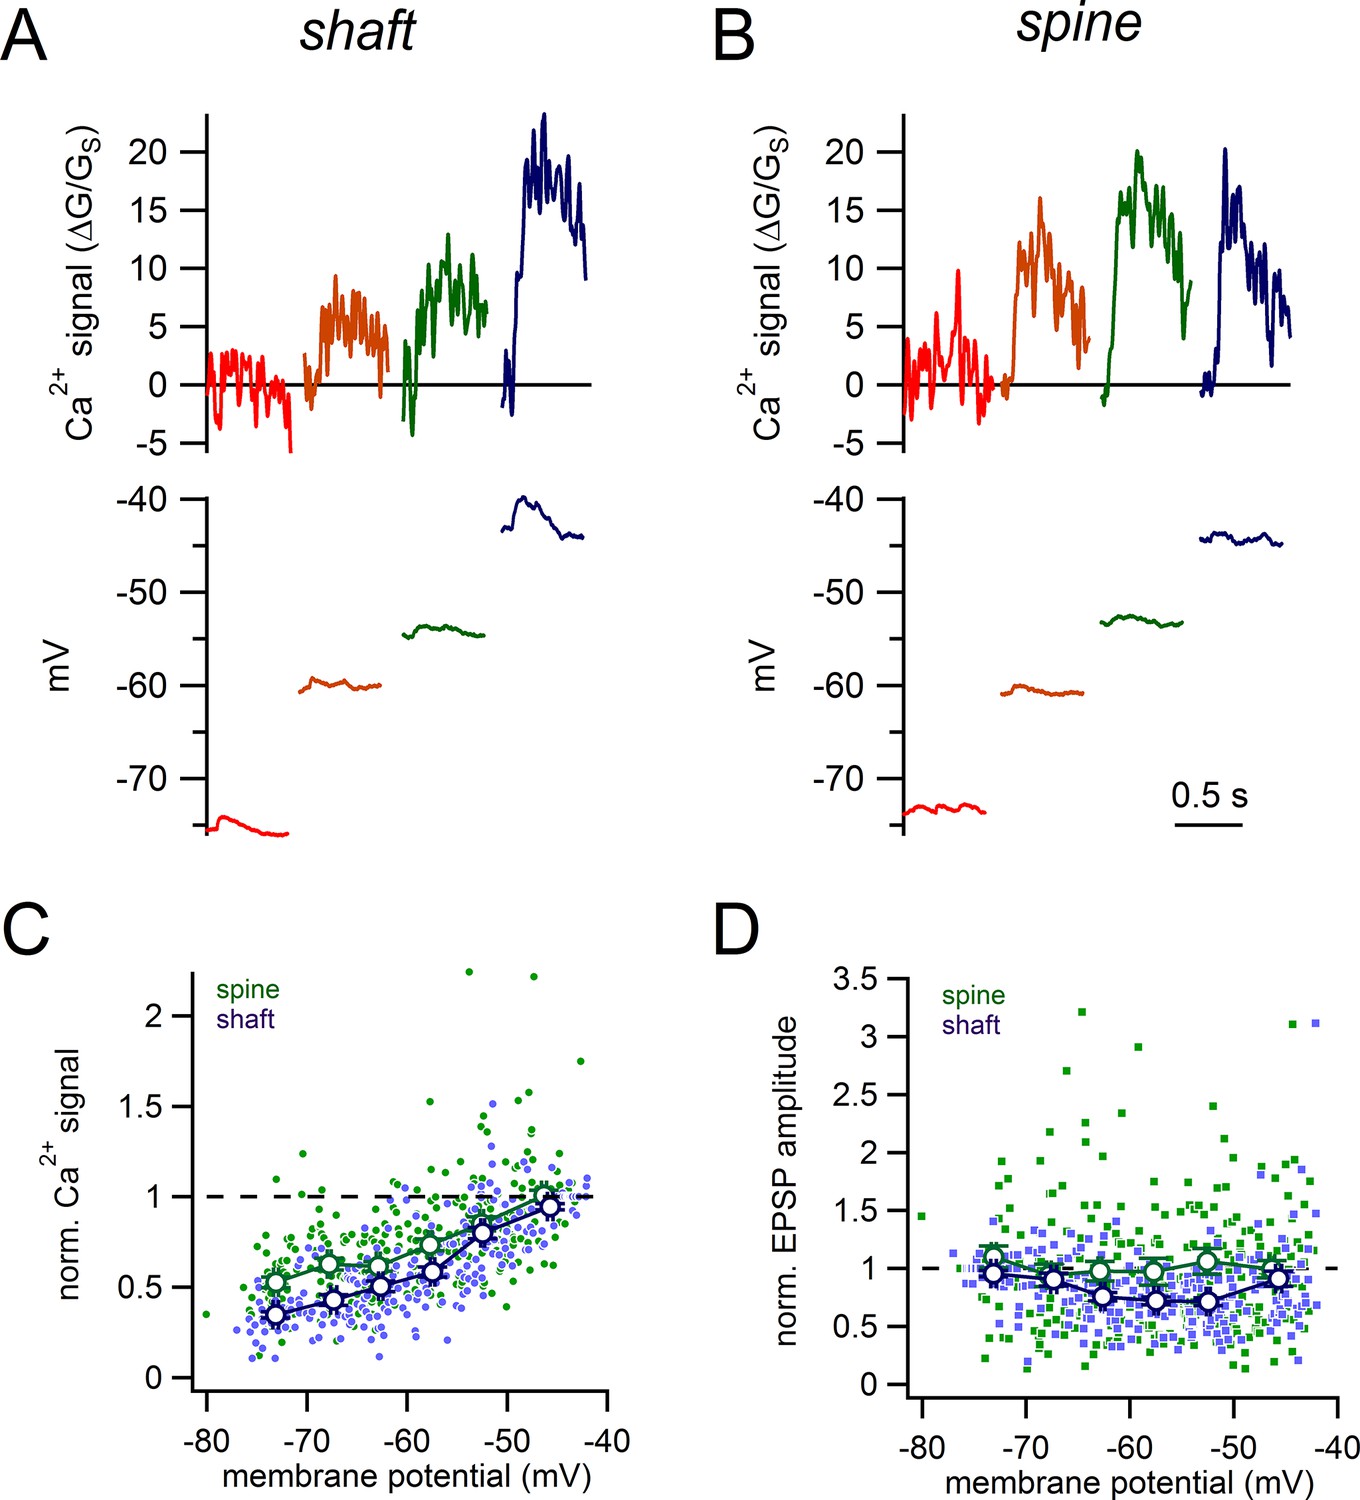
Voltage-dependence of shaft and spine synaptic responses.
(A) Examples of glutamate-evoked Ca2+ signals and uEPSPs evoked from 4 different stable membrane potentials for a single shaft synapse. (B) Examples of glutamate-evoked Ca2+ signals and uEPSPs evoked from 4 different stable membrane potentials for a single spine. (C) Plot of normalized Ca2+ signal amplitudes against starting membrane potential for spines (green dots and lines) and shaft synapses (purple dots and lines). (D) Plot of normalized uEPSP amplitudes against starting membrane potential for spines (green dots and lines) and shaft synapses (purple dots and lines).
Figure 9
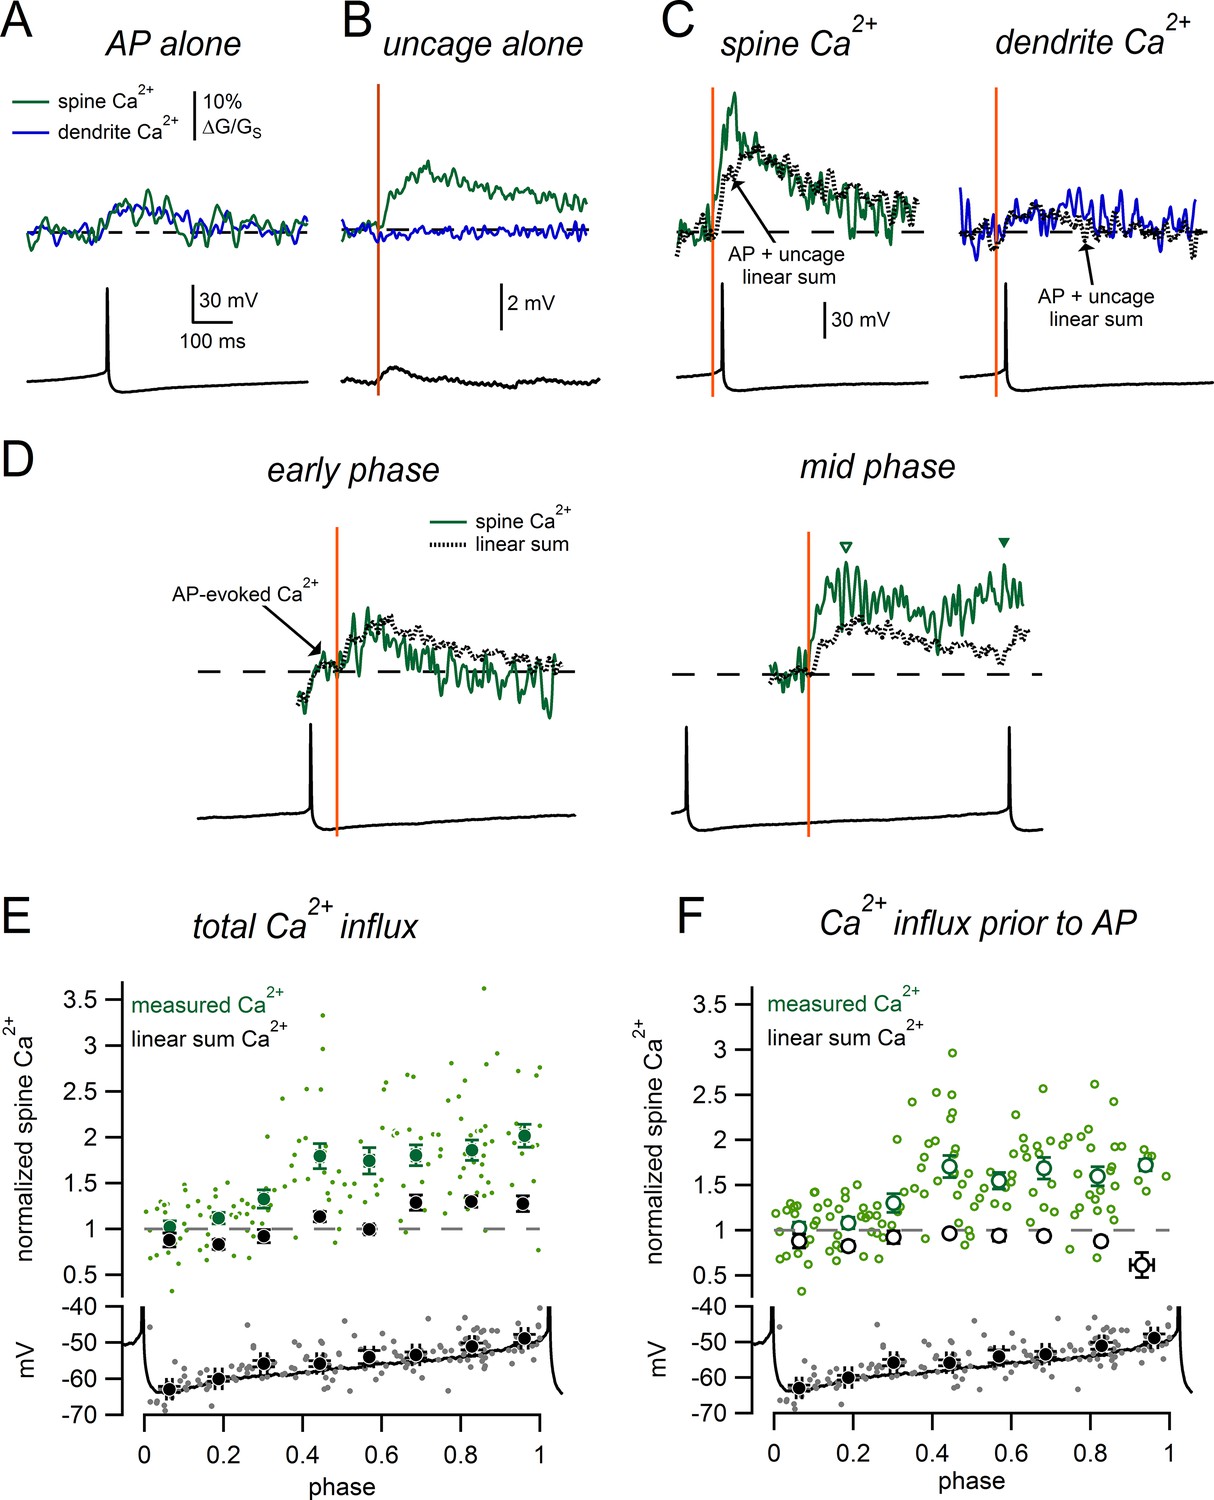
Phase-dependent enhancement of glutamate-evoked Ca2+ signals during tonic firing.
(A) AP-evoked Ca2+ signals measured in a spine (green) and nearby dendrite (blue) during tonic firing. Signals are averages of 3 individual AP-evoked Ca2+ transients. (B) Ca2+ signals as in A, for glutamate uncaging near the spine head while holding at −63 mV. Signals are averages of 6 uncaging trials. (C) Spine and dendrite Ca2+ signals evoked by uncaging glutamate during tonic firing. Dotted lines represent the ‘linear sum’, defined as ‘AP-alone’ plus ‘uncage- alone’ signals from panels A and B. (D) Comparison of spine Ca2+ signals and corresponding linear sums for trials in which glutamate uncaging occurred at either an early phase (left) or intermediate phase (right) of the firing cycle. Data are from the same spine as panels A–C. Dashed lines indicate baseline signals before the uncaging pulse. In the early phase example, the Ca2+ signal displayed an AP-evoked increase before the uncaging pulse that was not measured as part of the glutamate-evoked response (arrow). Inverted triangles in the mid-phase example indicate the peaks of the glutamate-evoked Ca2+ signal measured before (open symbol) and after the subsequent AP (closed symbol). (E) Top: Normalized spine Ca2+ amplitude plotted against the phase at which glutamate uncaging occurred for measured data (green) and linear sums (black). Bottom: Plot of membrane potential immediately prior to glutamate uncaging versus phase. The black trace shows a typical interspike interval. (F) As in E, except glutamate-evoked Ca2+ signals were only measured before the onset of the subsequent AP.
Figure 10
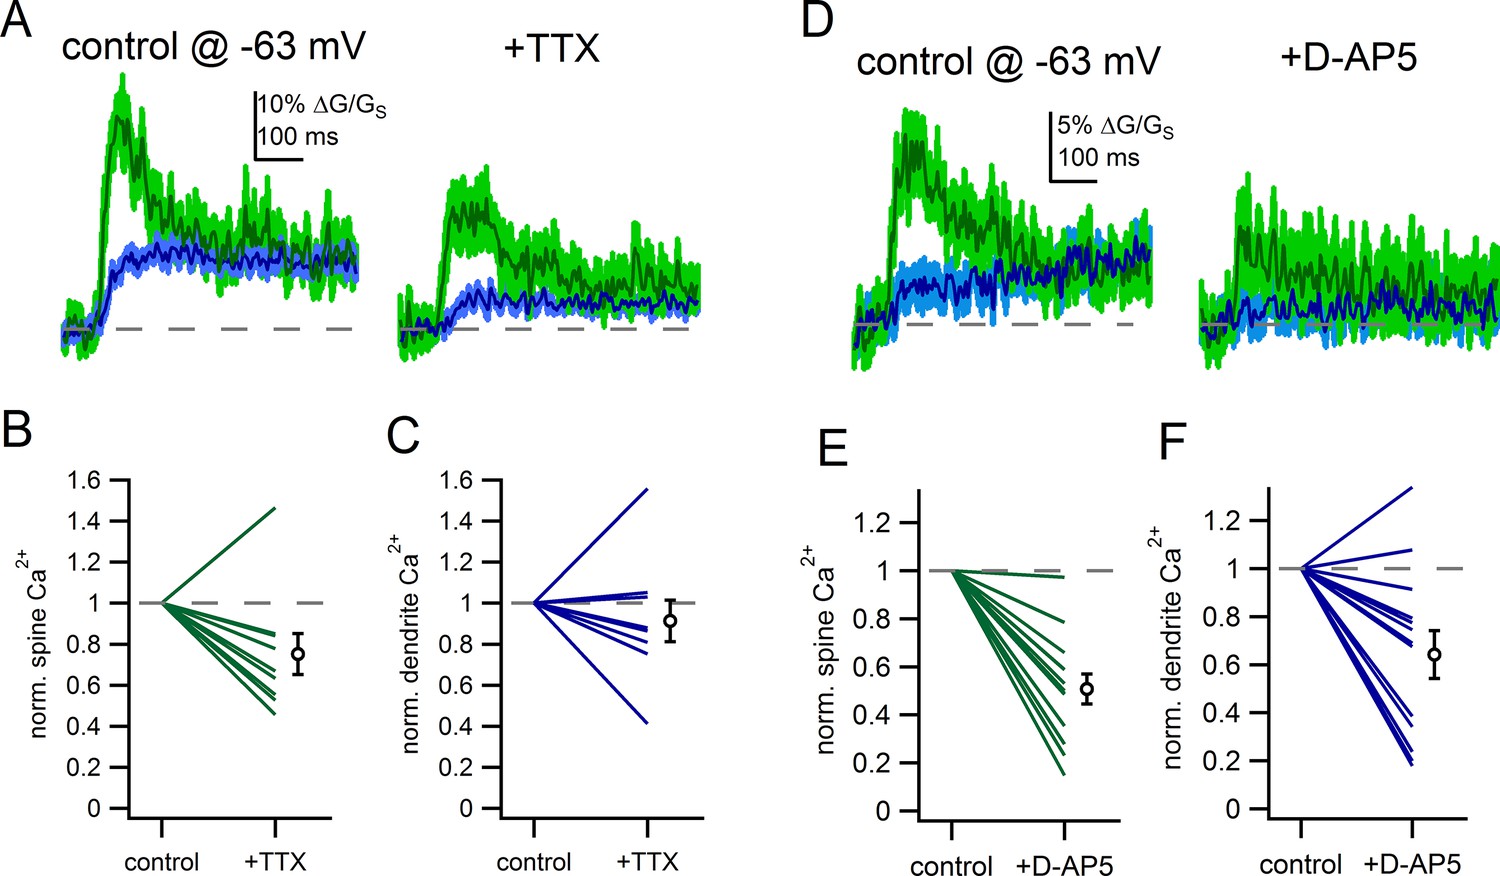
Voltage-gated sodium channels and NMDAR shape spine Ca2+ signals.
(A) Example of uncaging evoked Ca2+ signals in control conditions and following application of TTX (500 nM). (B) Plot of the effect of TTX on spine Ca2+ signals. (C) Plot of the effect of TTX on dendrite Ca2+ signals. (D) Example of uncaging evoked Ca2+ signals in control conditions and following application of D-AP5 (50 µM). (E) Plot of the effect of D-AP5 on spine Ca2+ signals. (F) Plot of the effect of D-AP5 on dendrite Ca2+ signals.
Download links
A two-part list of links to download the article, or parts of the article, in various formats.
Downloads (link to download the article as PDF)
Open citations (links to open the citations from this article in various online reference manager services)
Cite this article (links to download the citations from this article in formats compatible with various reference manager tools)
Electrical and Ca2+ signaling in dendritic spines of substantia nigra dopaminergic neurons
eLife 5:e13905.
https://doi.org/10.7554/eLife.13905


