NOVA2-mediated RNA regulation is required for axonal pathfinding during development
- Howard Hughes Medical Institute, The Rockefeller University, United States
- New York Genome Center, United States
- University of Iowa, United States
- University of Colorado, Boulder, United States
- Faculty of Medicine, University of Montreal, Canada
Figures
Figure 1 with 2 supplements
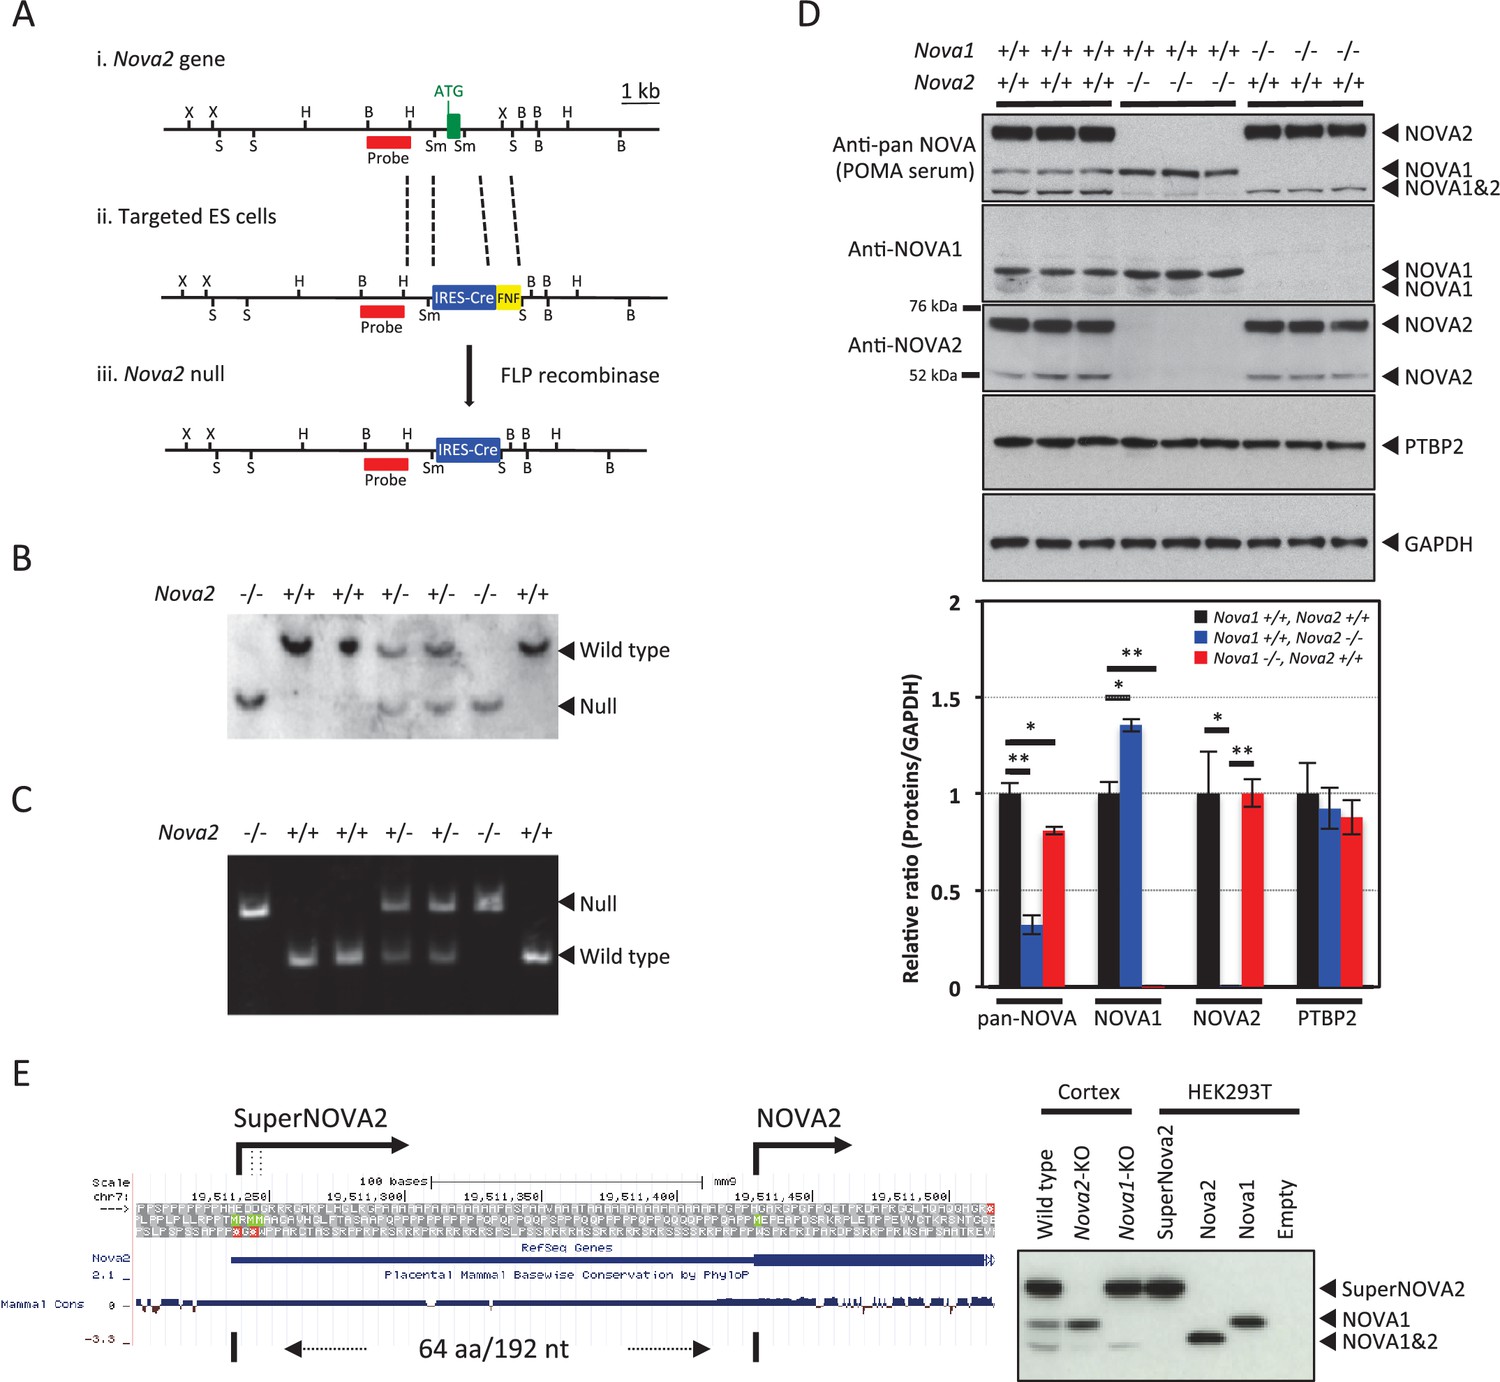
Generation of Nova2 null mice and characterization of SuperNOVA2.
(Ai) The wild-type Nova2 locus illustrated contains the first exon (green box, with initiator ATG indicated). (Aii) A targeting construct was generated harboring a genomic fragment (left: 2.2 kb) flanking the initiator methionine, an IRES-Cre FRT-NEO-FRT (FNF) insertion, and an intronic genomic fragment flanking the first coding exon (right: 6 kb). (Aiii) The Nova2 null locus following FLP-mediated excision of FNF cassette. Restriction enzyme sites were indicated for BamHI (B), HindIII (H), SacI (S), SmaI (Sm) and XbaI (X). The probes position used for Southern blot was indicated in red. (B) Genotypic analysis of Nova2 null mice. Southern blot analysis was performed on tail DNA digested with BamHI, using the probe described in (A). (C) Genotyping PCR analysis of Nova2 null mice. (D) Western blot analysis of NOVA1 and NOVA2 proteins. Extracts of mouse cortex (10 μg/lane) were made from age-matched P0 wild-type, Nova2-/-, and Nova1-/- mice, loaded on SDS-PAGE gels, and blotted with anti-pan NOVA (POMA antisera), anti-NOVA1 specific, anti-NOVA2 specific, anti-PTBP2, and anti-GAPDH antibodies. Quantification and comparison of NOVA1 and NOVA2 proteins expression amounts in the cortex of wild-type, Nova2-/-, and Nova1-/- mice. Data are presented as mean ± SD. *p<0.05, **p<0.01 (n = 3, Tukey’s multiple comparison test). (E) Characterization of superNOVA2. Left Diagram showing a putative superNOVA2 initiator methionine (green) positioned 192 nt upstream of the known Nova2 initiator methionine. Right panel showing the NOVA proteins mobility on electrophoresis.
Figure 1—figure supplement 1
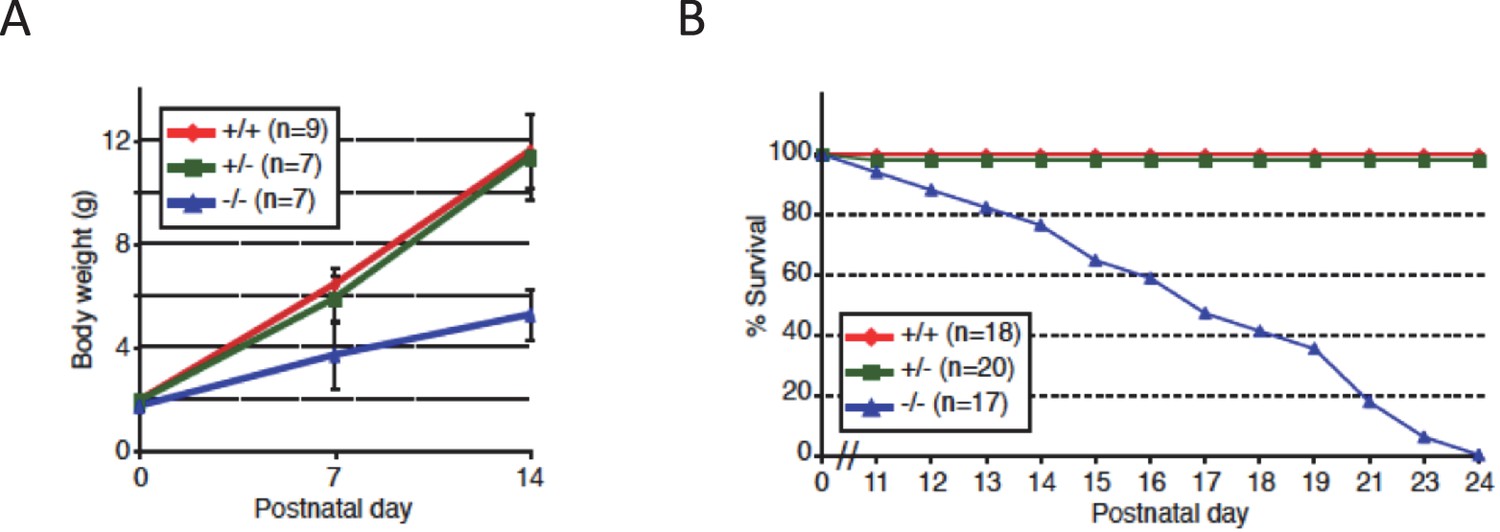
Growth retardation of Nova2-/- mice.
(A) Growth curves of Nova2-/-, Nova2+/-, and Nova2+/+ littermates. Weights of Nova2-/- (blue), Nova2+/- (green), and Nova2+/+ (red) mice were studied from birth to age 14 days (n > = 7). Data are presented as mean ± SD. (B) Survival curves of Nova2-/- (blue), Nova2+/- (green), and Nova2+/+ (red) littermates. Nova2-/- mice died on average between P14-P18, whereas Nova2+/- showed no difference in survival from Nova2+/+ mice. Data are presented as mean ± SD.
Figure 1—figure supplement 2
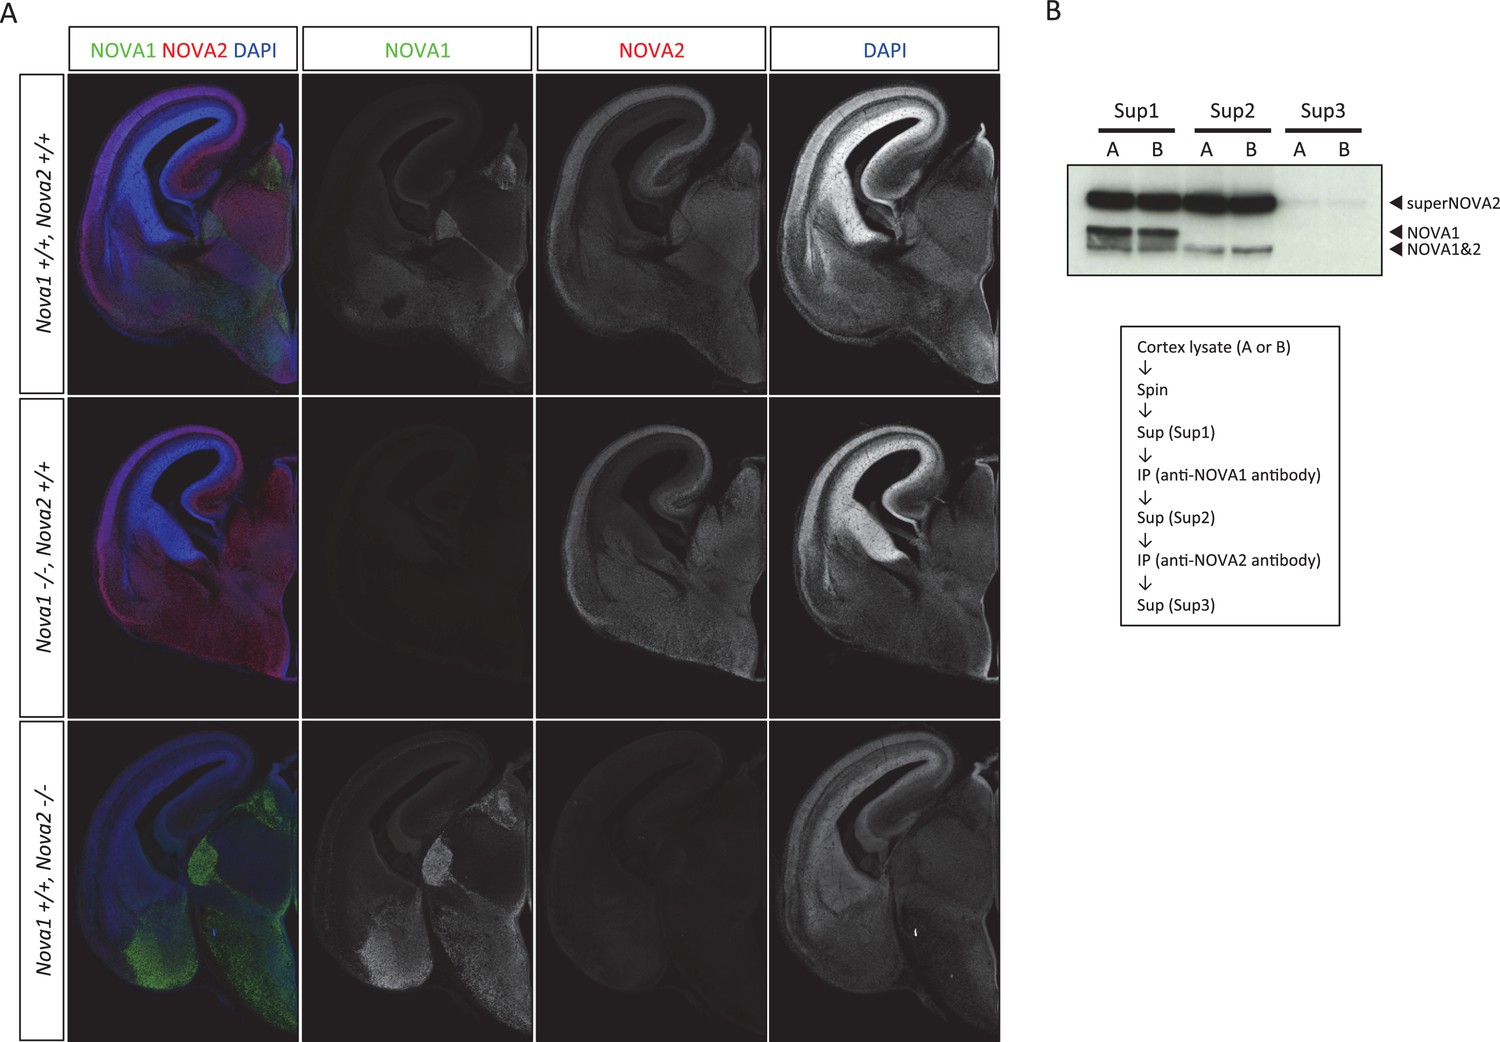
Anti-NOVA2 and anti-NOVA1 antibodies specificity.
Coronal brain sections of E16.5 wild-type, Nova1-/-, and Nova2-/-, stained for NOVA1 (green), NOVA2 (red), and DAPI (blue). Scale bar; 500 μm. (B) Specificity of antibodies for immunoprecipitation.
Figure 2 with 3 supplements
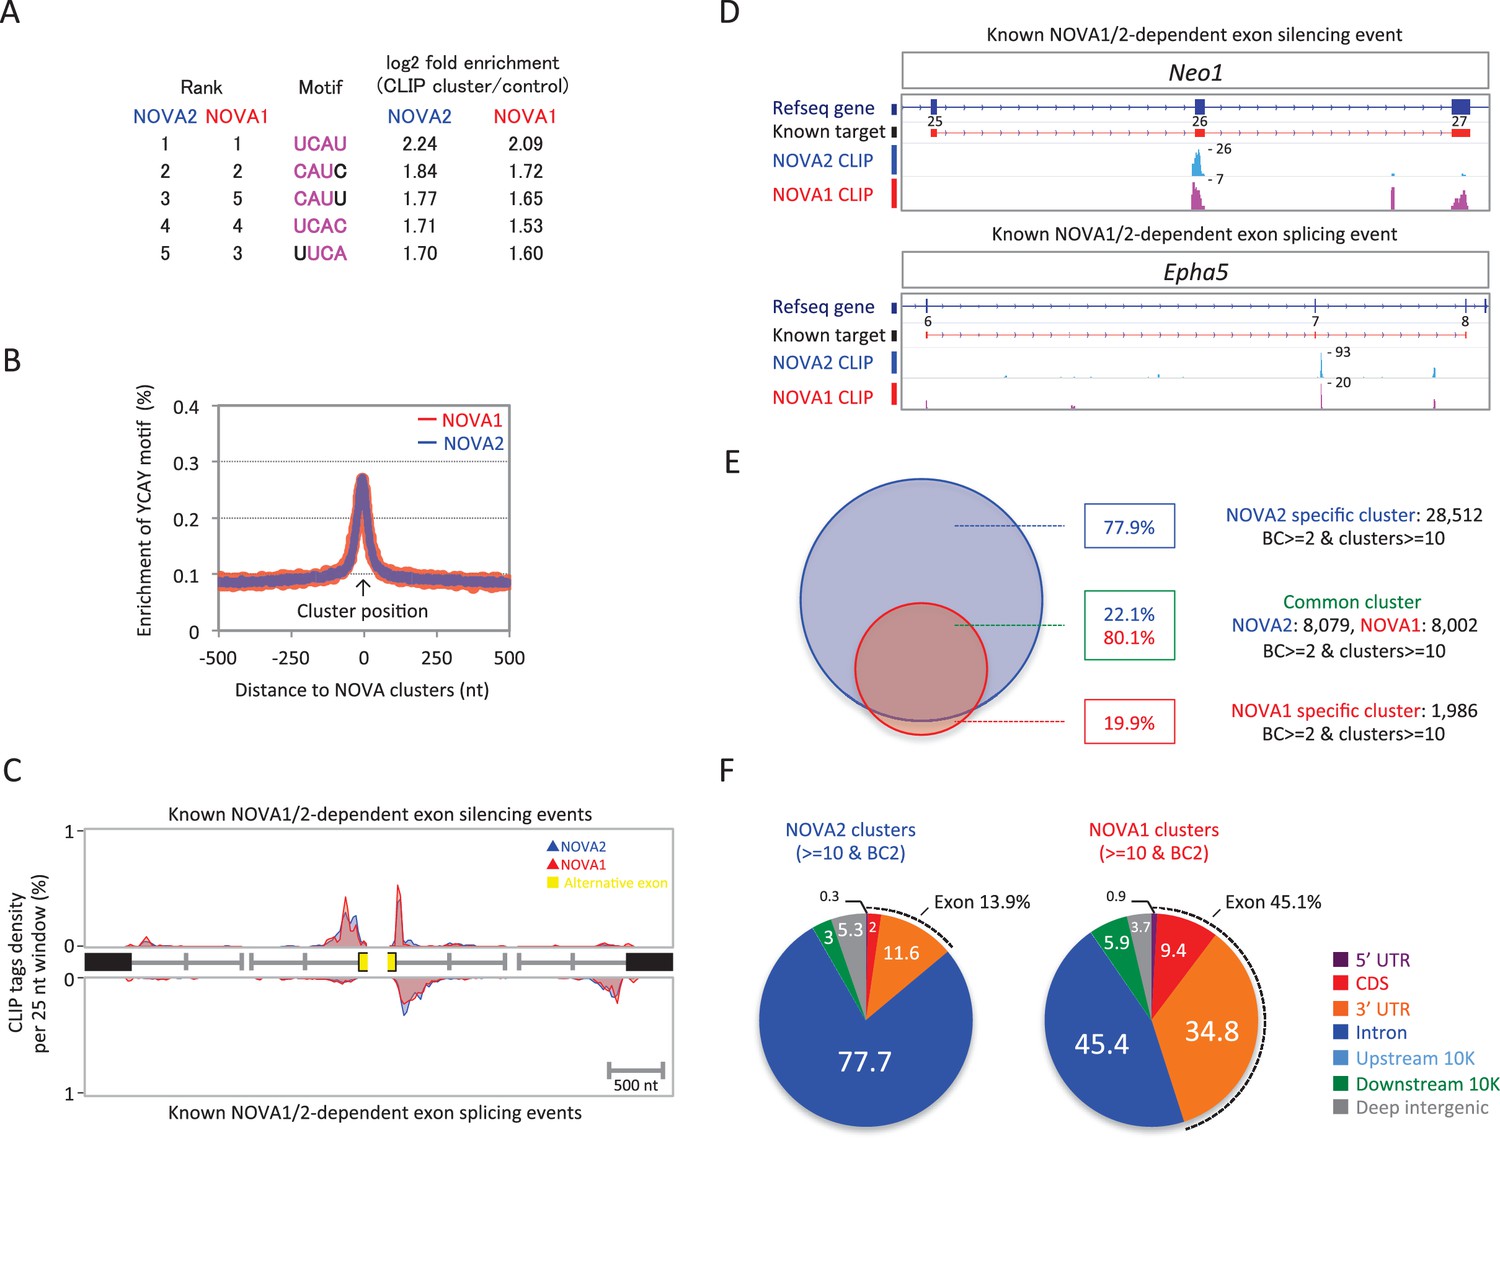
NOVA2 and NOVA1 HITS-CLIP.
(A) Top 5 tetramers present in BC2 NOVA2 and NOVA1 sequences compared with the shuffled control sequences. The sequences corresponding to YCAY motif were high-lighted with magenta. (B) Enrichment of YCAY motif near NOVA2 (blue) and NOVA1 (red) clusters. (C) Distribution of BC2 NOVA2 (blue) and NOVA1 (red) CLIP tags (Y-axis: CLIP tags density in each 25 nt window) near known NOVA1/2 targeted alternative exons silencing (top panel) and splicing (bottom panel) events. (D) Examples of NOVA2 and NOVA1 CLIP cluster location near known NOVA1/2-target alternative splicing exon (top panel; silencing event, Neo1 exon 25–27, bottom panel; splicing event, Epha5 exon 6–8). (E) Summary of robust NOVA2 (blue) and NOVA1 (red) CLIP BC2 clusters consisted of a minimum of 10 tags. (F) Genomic distribution of BC2 NOVA2 (left) and NOVA1 (right) clusters consisted of a minimum of 10 tags.
Figure 2—figure supplement 1
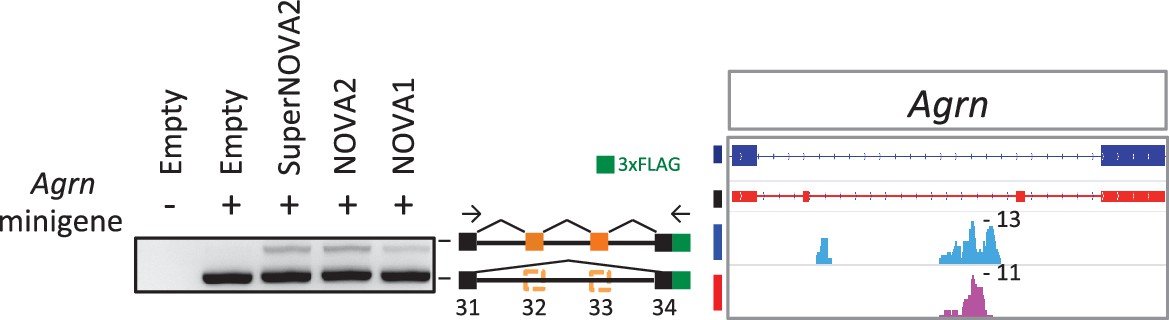
Alternative splicing regulation of Agrn minigene by NOVA proteins.
Alternative splicing impact on Agrn minigene was examined in HEK293T cells with or without NOVA proteins conditions.
Figure 2—figure supplement 2
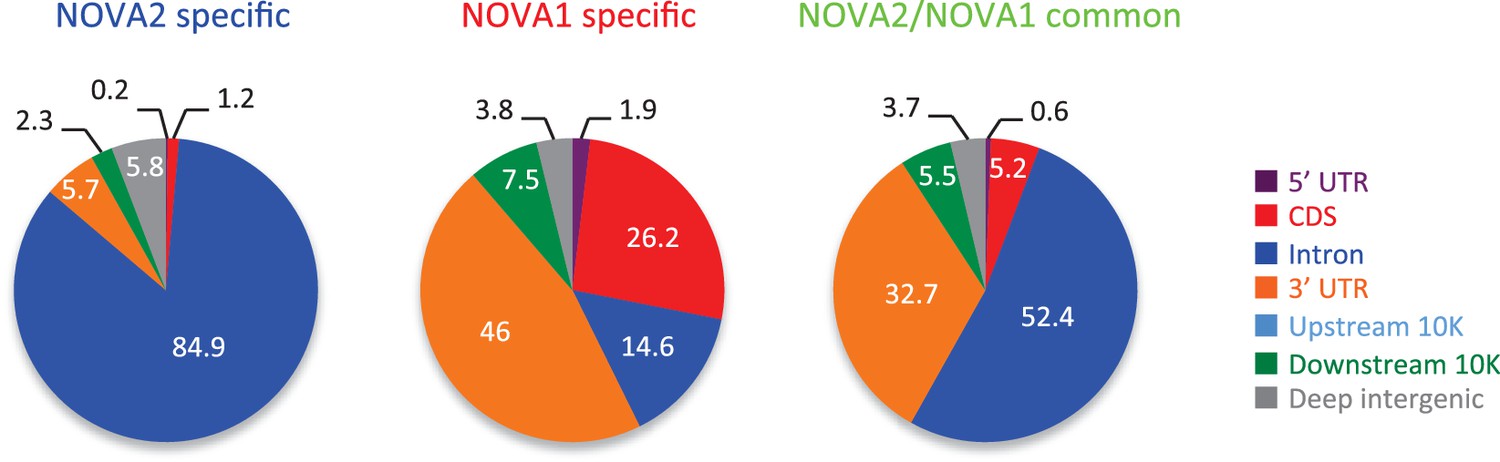
Genomic distribution of BC2 NOVA2 specific (left), NOVA1 specific (middle), and NOVA2/NOVA1 common clusters consisted of a minimum of 10 tags.
https://doi.org/10.7554/eLife.14371.008
Figure 2—figure supplement 3
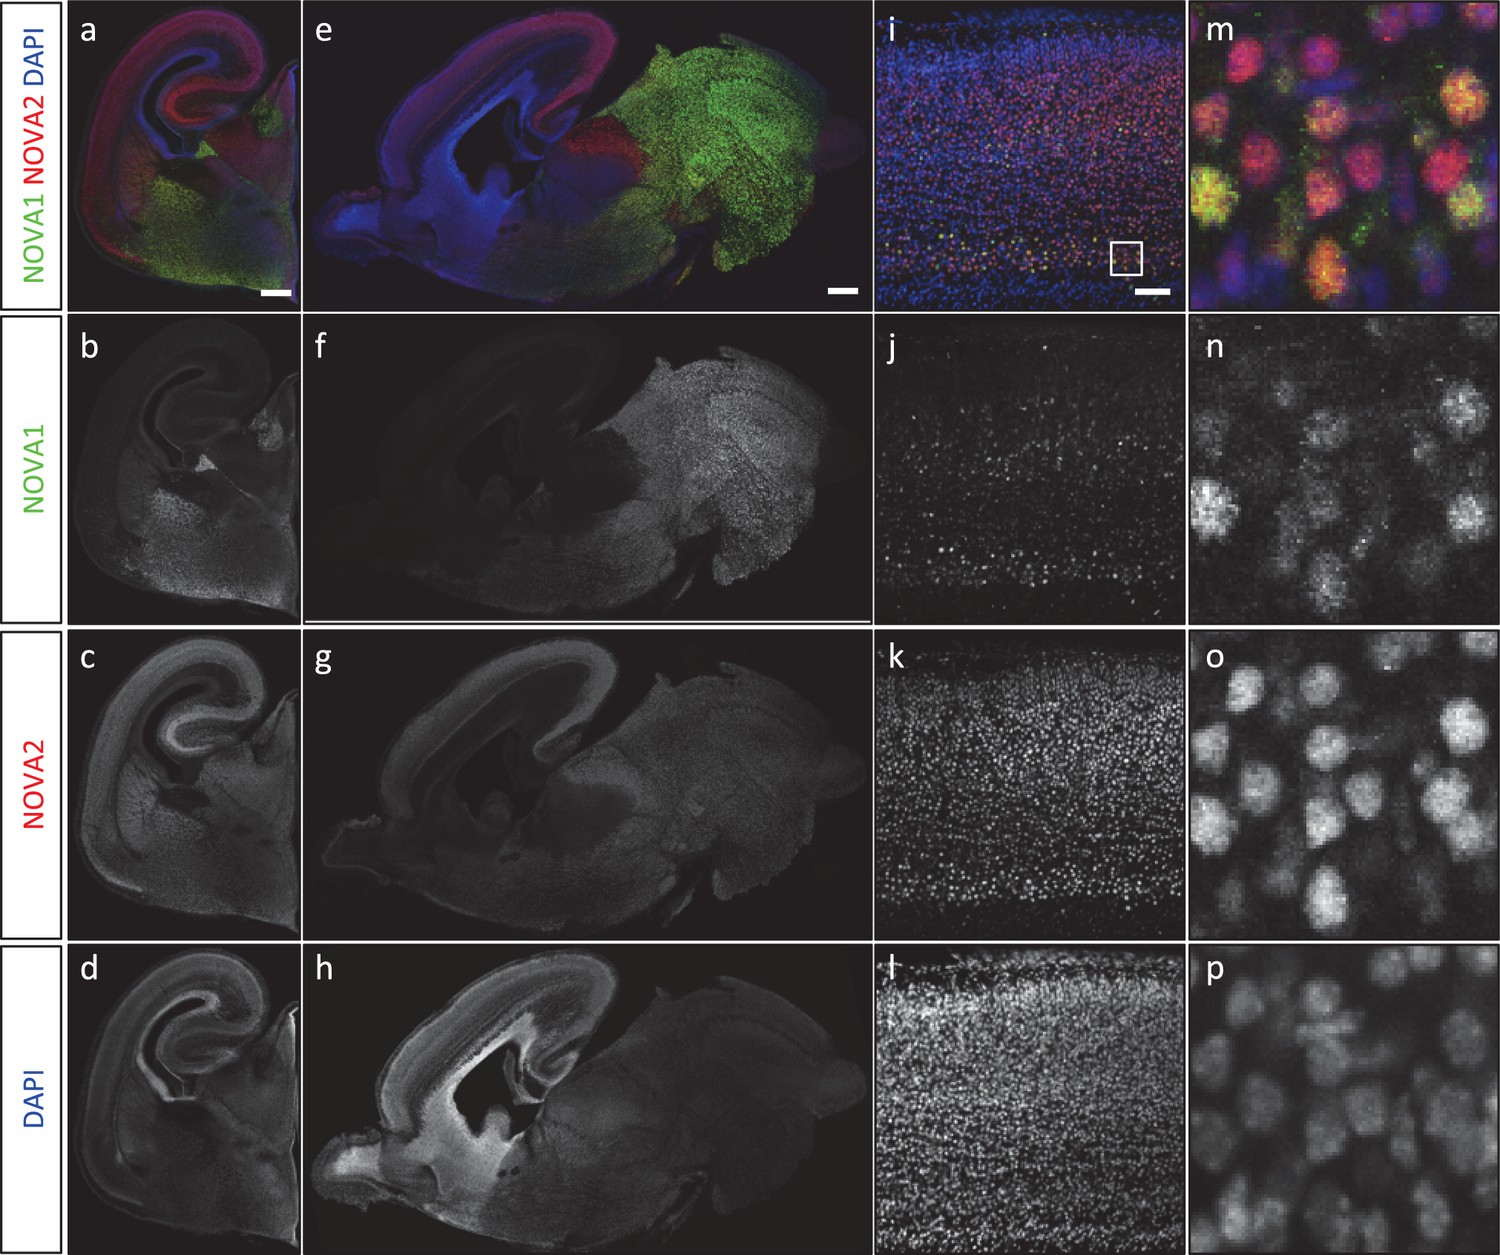
NOVA1 and NOVA2 expression in the mouse embryonic brain.
(A) Immunohistochemistry of NOVA1 (b, f, j, n: green) and NOVA2 (c, g, k, o: red) in E18.5 coronal sections (a–d), sagittal sections (e–h), neocortex (i–p). Scale bars; 500 μm (a–h), 50 μm (i–l).
Figure 3 with 4 supplements

RNA-seq analysis in either Nova2-/- or Nova1-/- versus littermate wild-type control.
(A) RNA abundance changes in Nova2-/- and Nova1-/- mice cortex and comparison of its correlation in Nova2-/- with in Nova1-/- mice. X-axis and Y-axis indicated log2(Nova2-KO/wild-type fold change (FC)) and log2(Nova1-KO/wild-type FC), respectively. Transcripts significantly changed in Nova2-/- and Nova1-/- mice cortex were shown in blue and red, respectively (FDR<0.05 and log2|FC|>=1). (B) Summary of NOVA2- and NOVA1-dependent alternative splicing changes that showed |ΔI| >= 0.1 (FDR < 0.1) (Ule et al., 2005b) and that contained YCAY motif(s) within BC2 NOVA1 or NOVA2 HITS-CLIP clusters on alternative splicing exons and/or its upstream/downstream introns. 1991 NOVA2-target alternative splicing events on 540 genes (known [Zhang et al., 2010]; 780 events, novel; 1211 events), 58 NOVA1-target events on 20 genes (known; 0 events, novel 58 events). (C) Correlation of Nova2- and Nova1-deficient impact on alternative splicing events. X-axis and Y-axis indicated ΔI of wild-type (WT) vs Nova2-/- and vs Nova1-/-, respectively.
-
Figure 3—source data 1
Gene Ontology (GO) terms associated with NOVA2-target alternative splicing exons.
Summary of GO analysis of NOVA2-regulated genes performed using DAVID Bioinformatics Resources (https://david.ncifcrf.gov) (FDR<0.05).
- https://doi.org/10.7554/eLife.14371.011
-
Figure 3—source data 2
The transcriptome abundance of the neuronal differentiation markers in the E18.5 cortex of Nova1-/- and Nova2-/- mice.
log2FC: log2 (Nova1 or Nova2 mutants/wild-type) fold change.
- https://doi.org/10.7554/eLife.14371.012
Figure 3—figure supplement 1
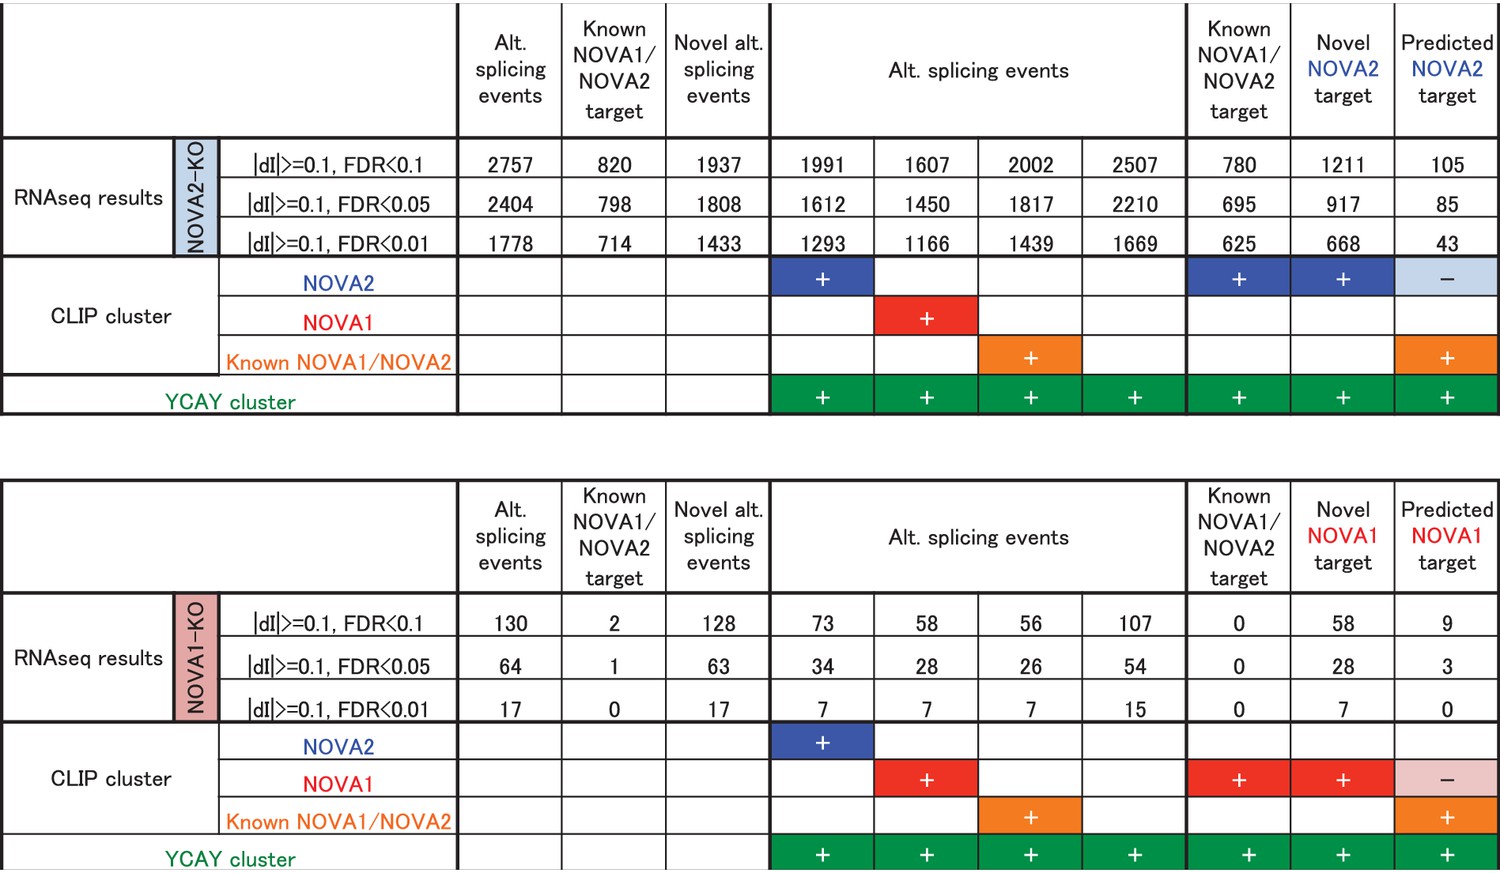
Summary of the number of alternative splicing events detected by RNA-seq analysis with/without NOVA2 or NOVA1 CLIP clusters and/or YCAY clusters.
https://doi.org/10.7554/eLife.14371.013
Figure 3—figure supplement 2
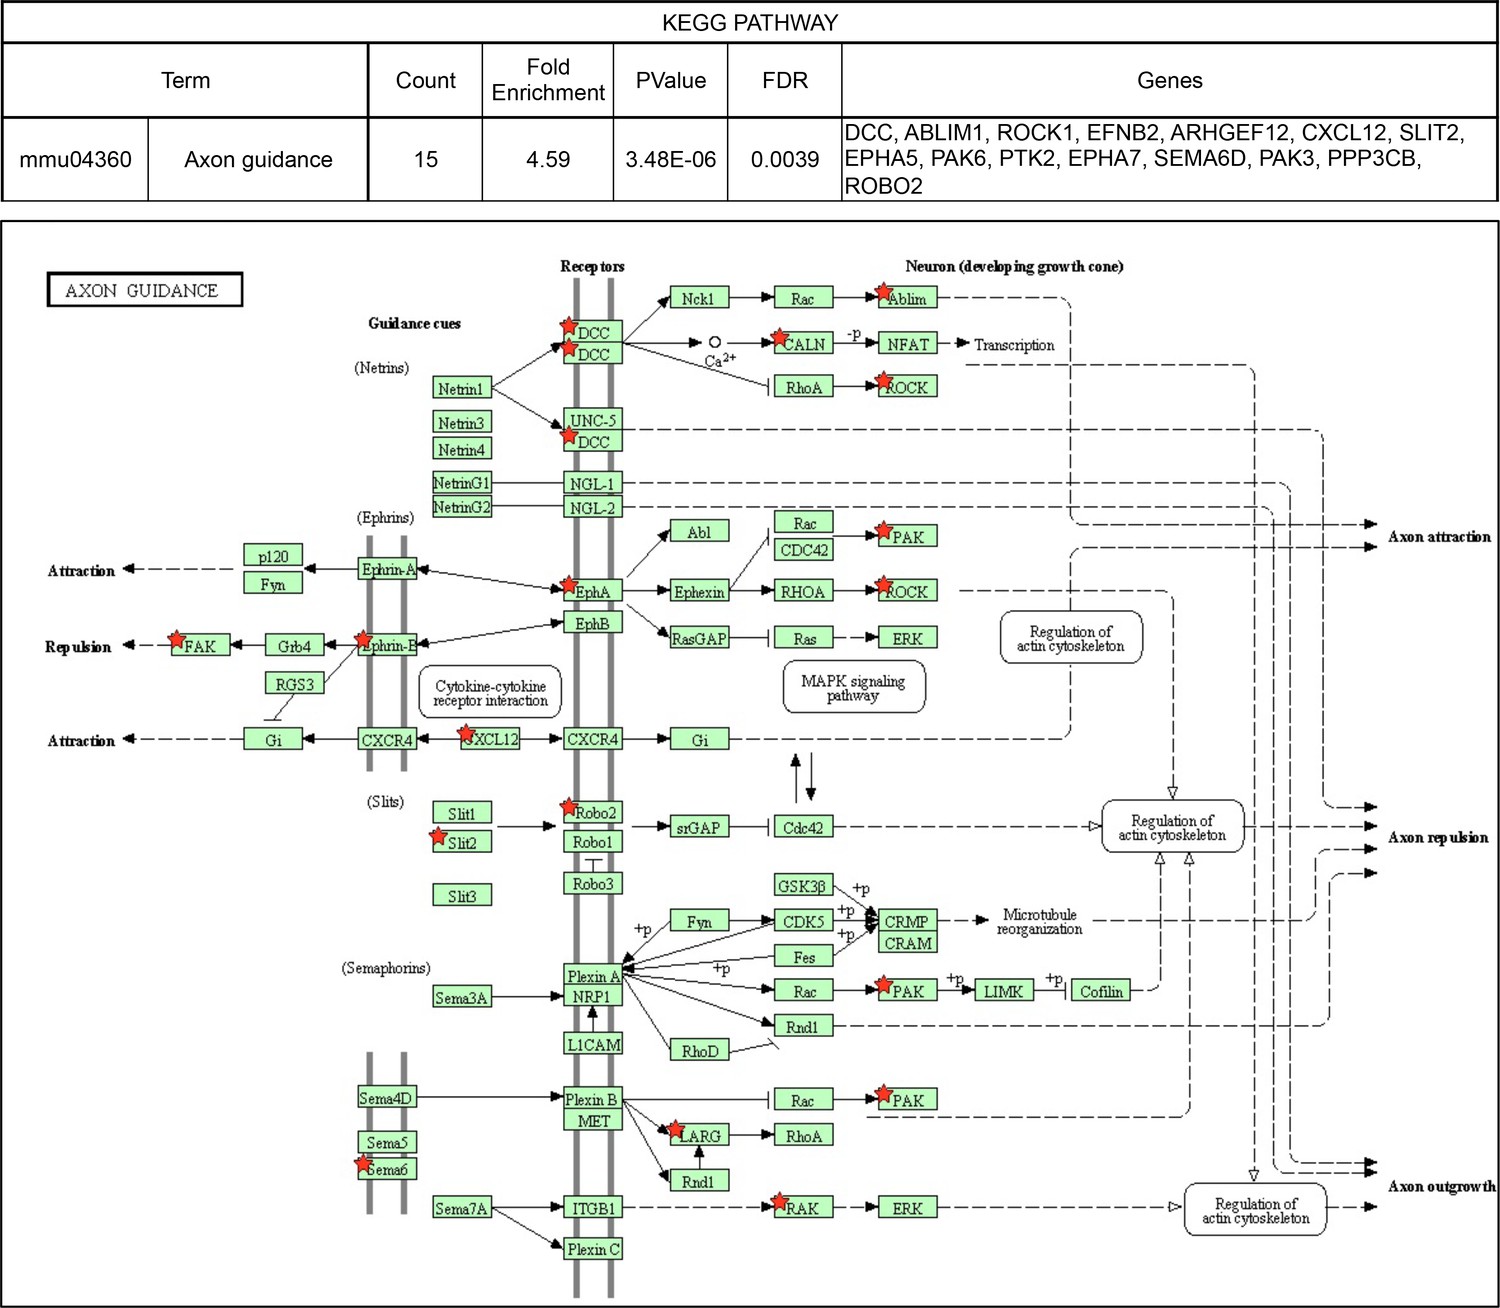
KEGG pathways over-represented among NOVA2-target genes.
Axon guidance pathway (FDR<0.05). Red stars indicating NOVA2-target alternative splicing genes identified by combining RNA-seq with NOVA2 HITS-CLIP analysis. Figures obtained from GO analysis using DAVID Bioinformatics Resources (https://david.ncifcrf.gov).
Figure 3—figure supplement 3
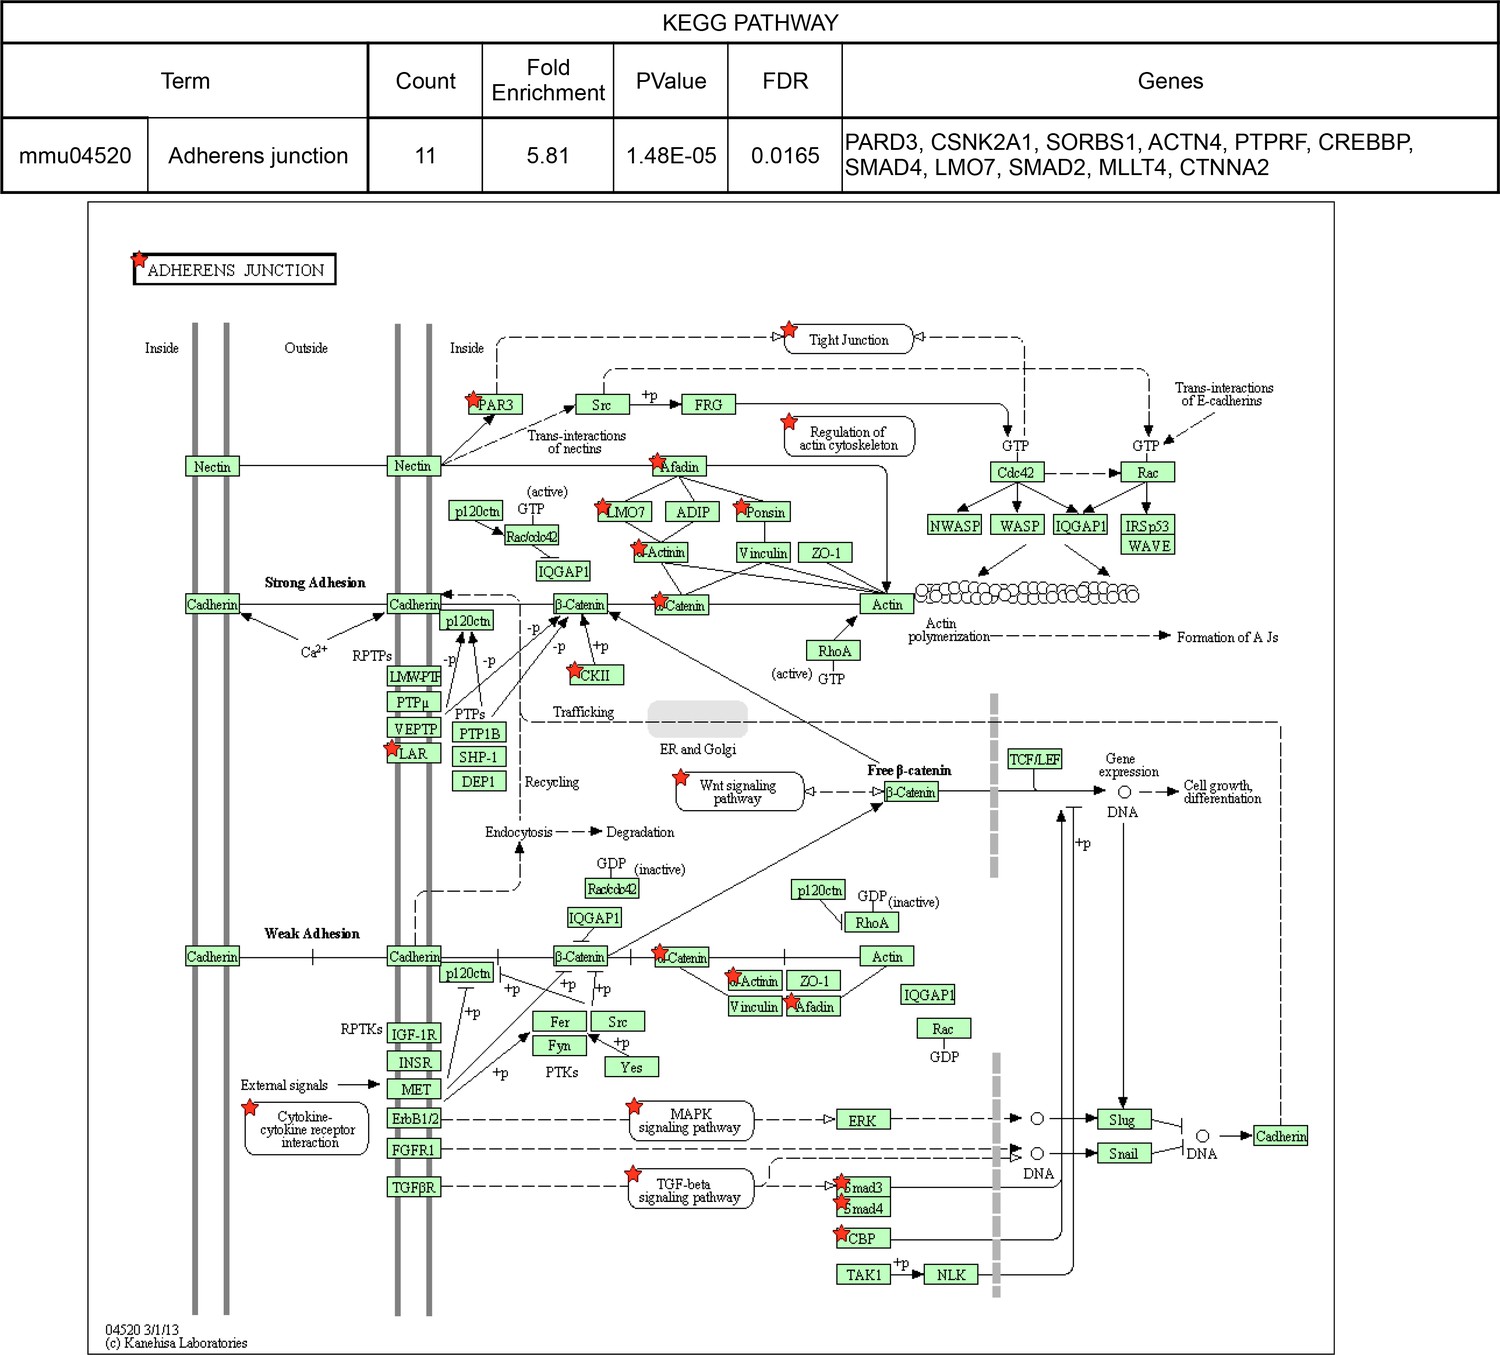
KEGG pathways over-represented among NOVA2-target genes.
Adherens junction pathway (FDR<0.05). Red stars indicating NOVA2-target alternative splicing genes identified by combining RNA-seq with NOVA2 HITS-CLIP analysis. Figures obtained from GO analysis using DAVID Bioinformatics Resources (https://david.ncifcrf.gov).
Figure 3—figure supplement 4
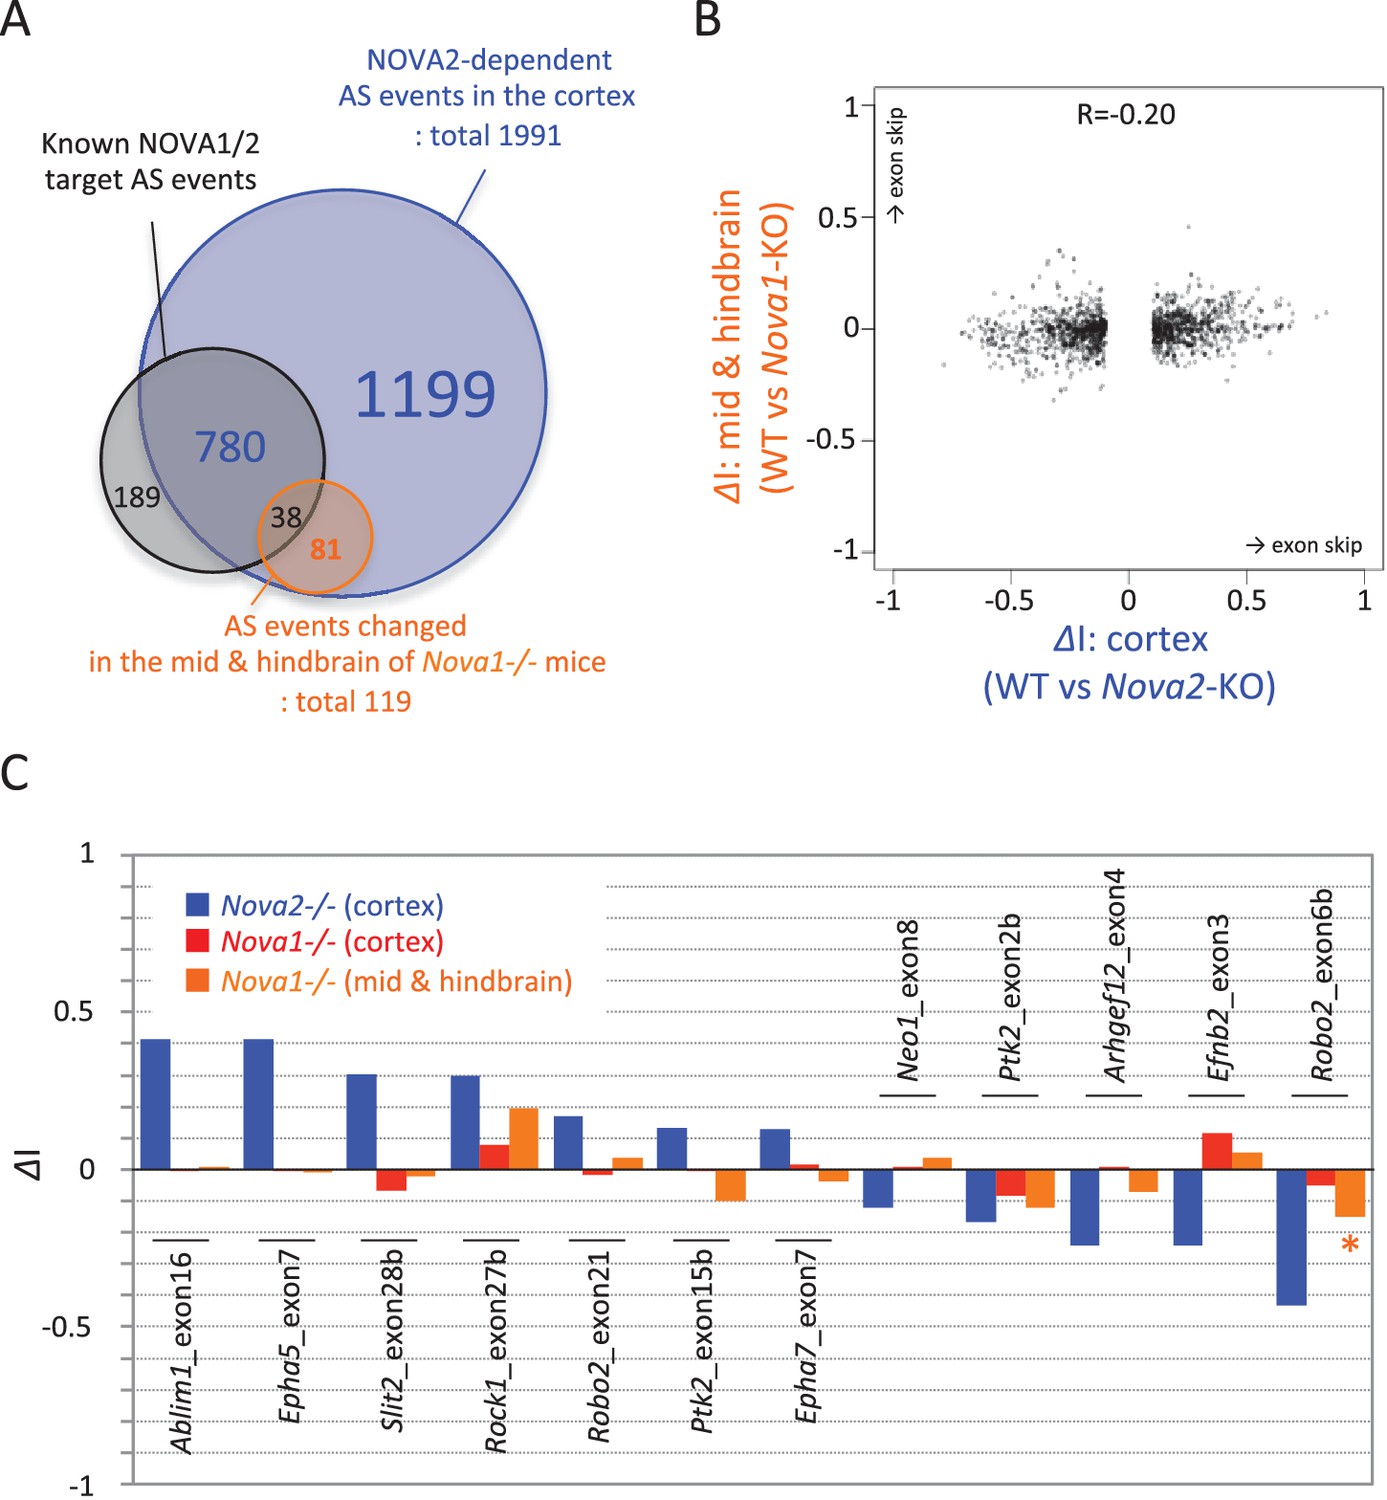
RNA-seq analysis in the midbrain and hindbrain of Nova1-/- versus littermate wild-type control.
(A) Summary of NOVA2-dependent (cortex) and NOVA1-dependent (midbrain and hindbrain) alternative splicing changes that showed |ΔI|>=0.1 (FDR<0.1). (B) Correlation of Nova2-deficient (cortex) and Nova1-deficient (midbrain and hindbrain) impact on alternative splicing events. X-axis and Y-axis indicated ΔI of wild-type vs Nova2-/- (cortex) and vs Nova1-/- (midbrain and hindbrain), respectively. (C) Examples of alternative splicing changes of the NOVA2-regulated axon guidance genes in the cortex of Nova2-/- and Nova1-/- and in the midbrain and hindbrain of Nova1-/- mice. Low expression genes in midbrain and hindbrain samples were filtered out. Y-axis indicated ΔI. Blue; Nova2-/- (cortex), red; Nova1-/- (cortex), orange; Nova1-/- (midbrain and hindbrain). *p<0.05.
Figure 4 with 1 supplement

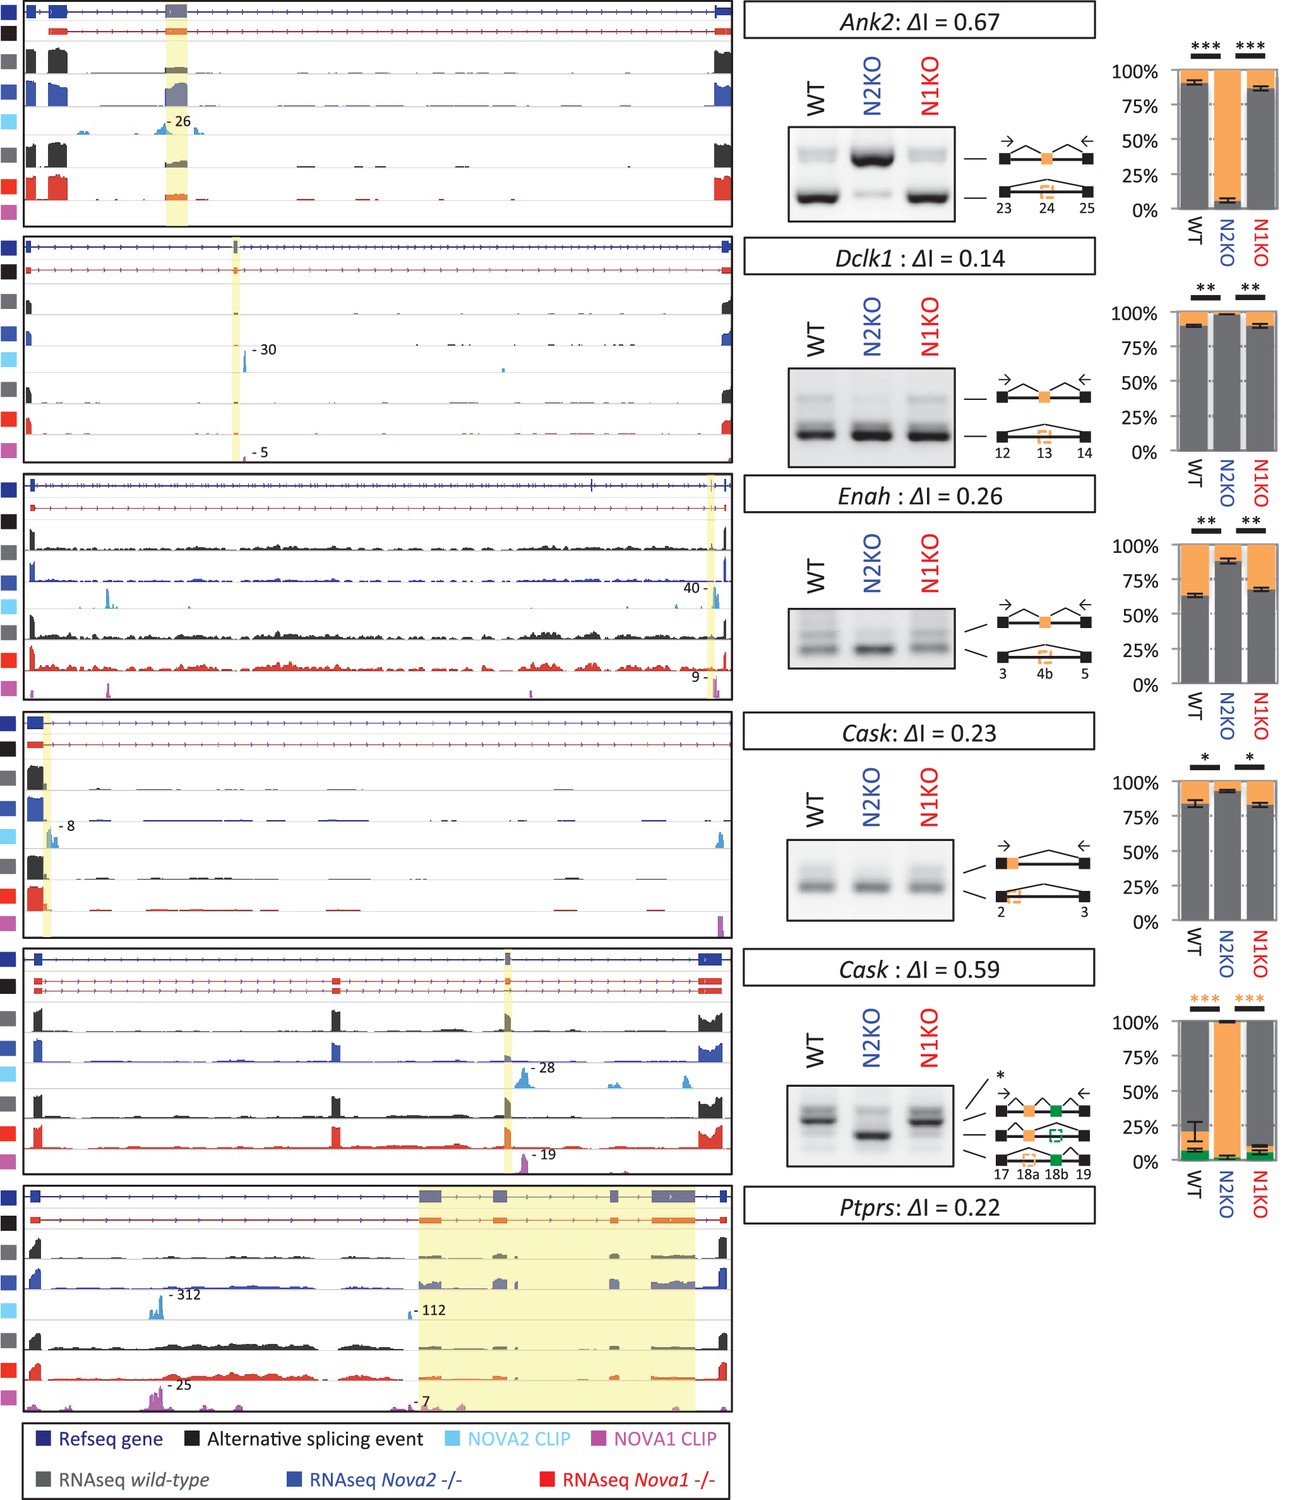
NOVA2 unique alternative splicing events of axon guidance related genes in E18.5 mice cortex.
Left Diagrams showing RefSeq annotation genes, changed alternative splicing events, RNA-seq results of wild-type (grey) and Nova2-/- (blue), NOVA2 CLIP clusters (light blue), RNA-seq results of wild-type (grey) and Nova1-/- (red), and NOVA1 CLIP clusters (pink). Right panels and graphs showing RT-PCR results and quantification data in E18.5 wild-type, Nova2-/-, and Nova1-/- mice cortex, respectively. *p<0.05, **p<0.01 (n = 3, Tukey’s multiple comparison test). Data are presented as mean ± SD.
Figure 4—figure supplement 1
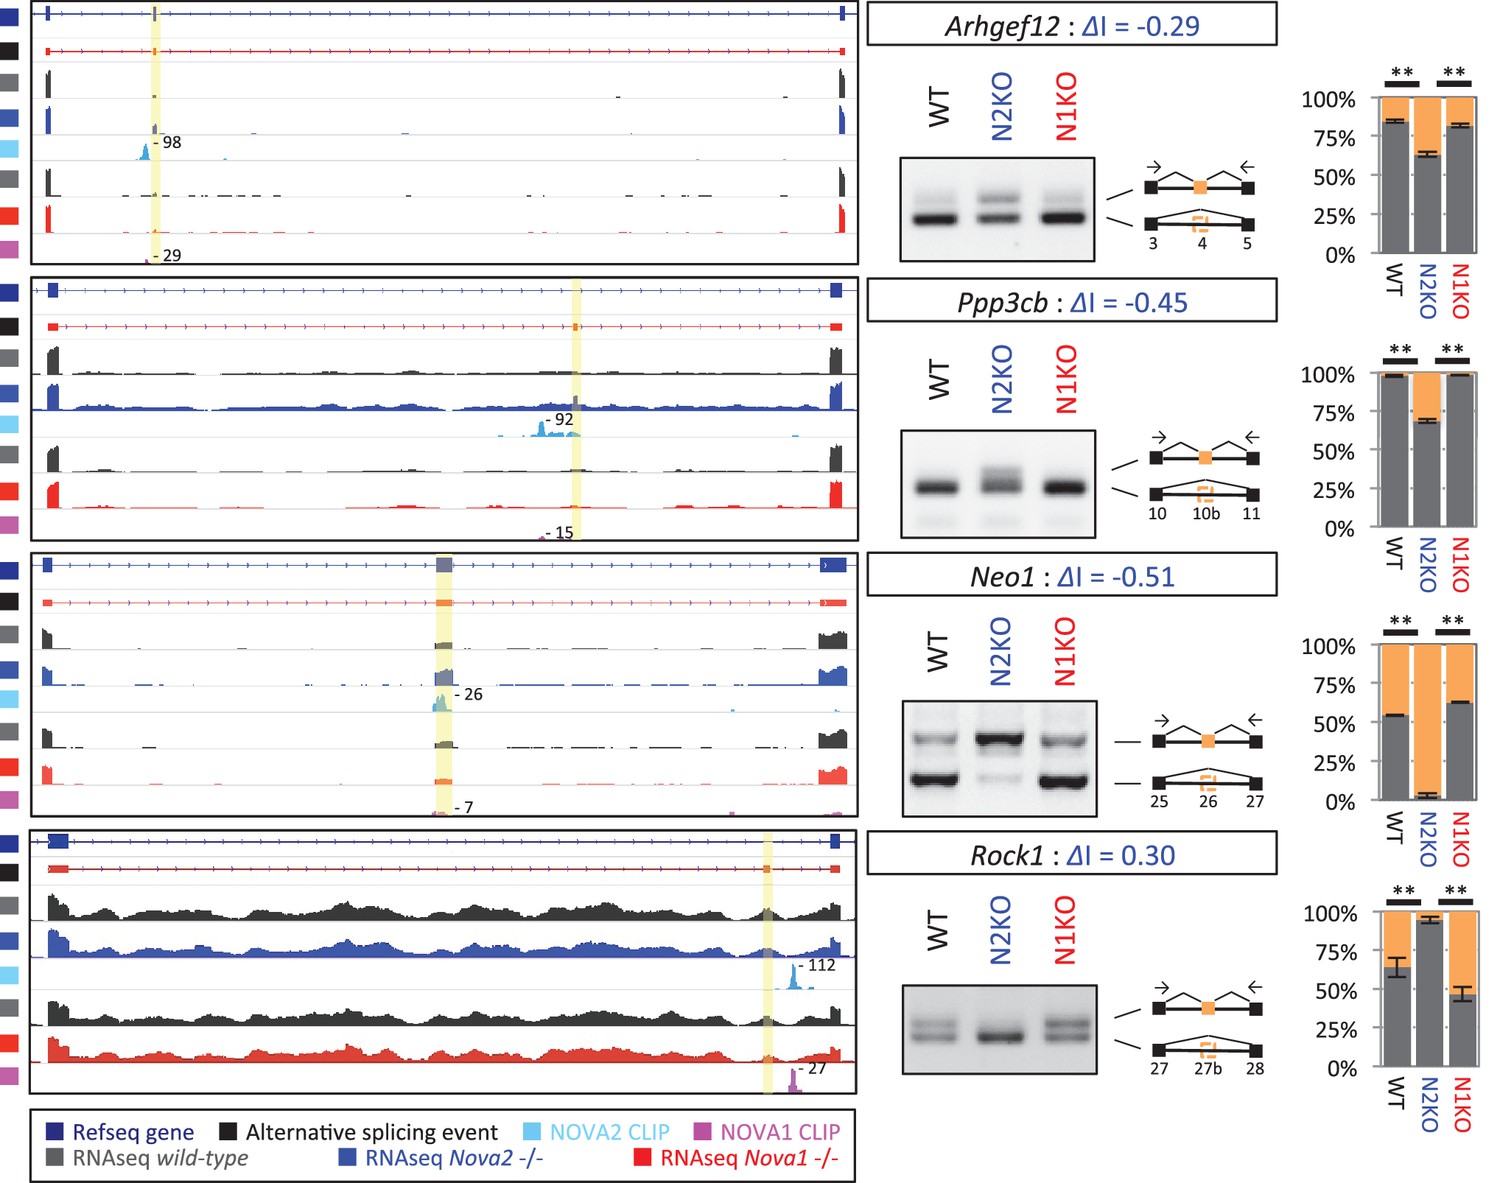
NOVA2 unique alternative splicing events of axon guidance related genes in E18.5 mice cortex.
Left Diagrams showing RefSeq annotation genes, changed alternative splicing events, RNA-seq results of wild-type (grey) and Nova2-/- (blue), NOVA2 CLIP clusters (light blue), RNA-seq results of wild-type (grey) and Nova1-/- (red), and NOVA1 CLIP clusters (pink). Right panels and graphs showing RT-PCR results and quantification data of Ahrgef12, Ppp3cb, Neo1, and Rock1 in E18.5 wild-type, Nova2-/-, and Nova1-/- mice cortex, respectively. **p<0.01 (n=3, Tukey’s multiple comparison test). Data are presented as mean ± SD.
Figure 5
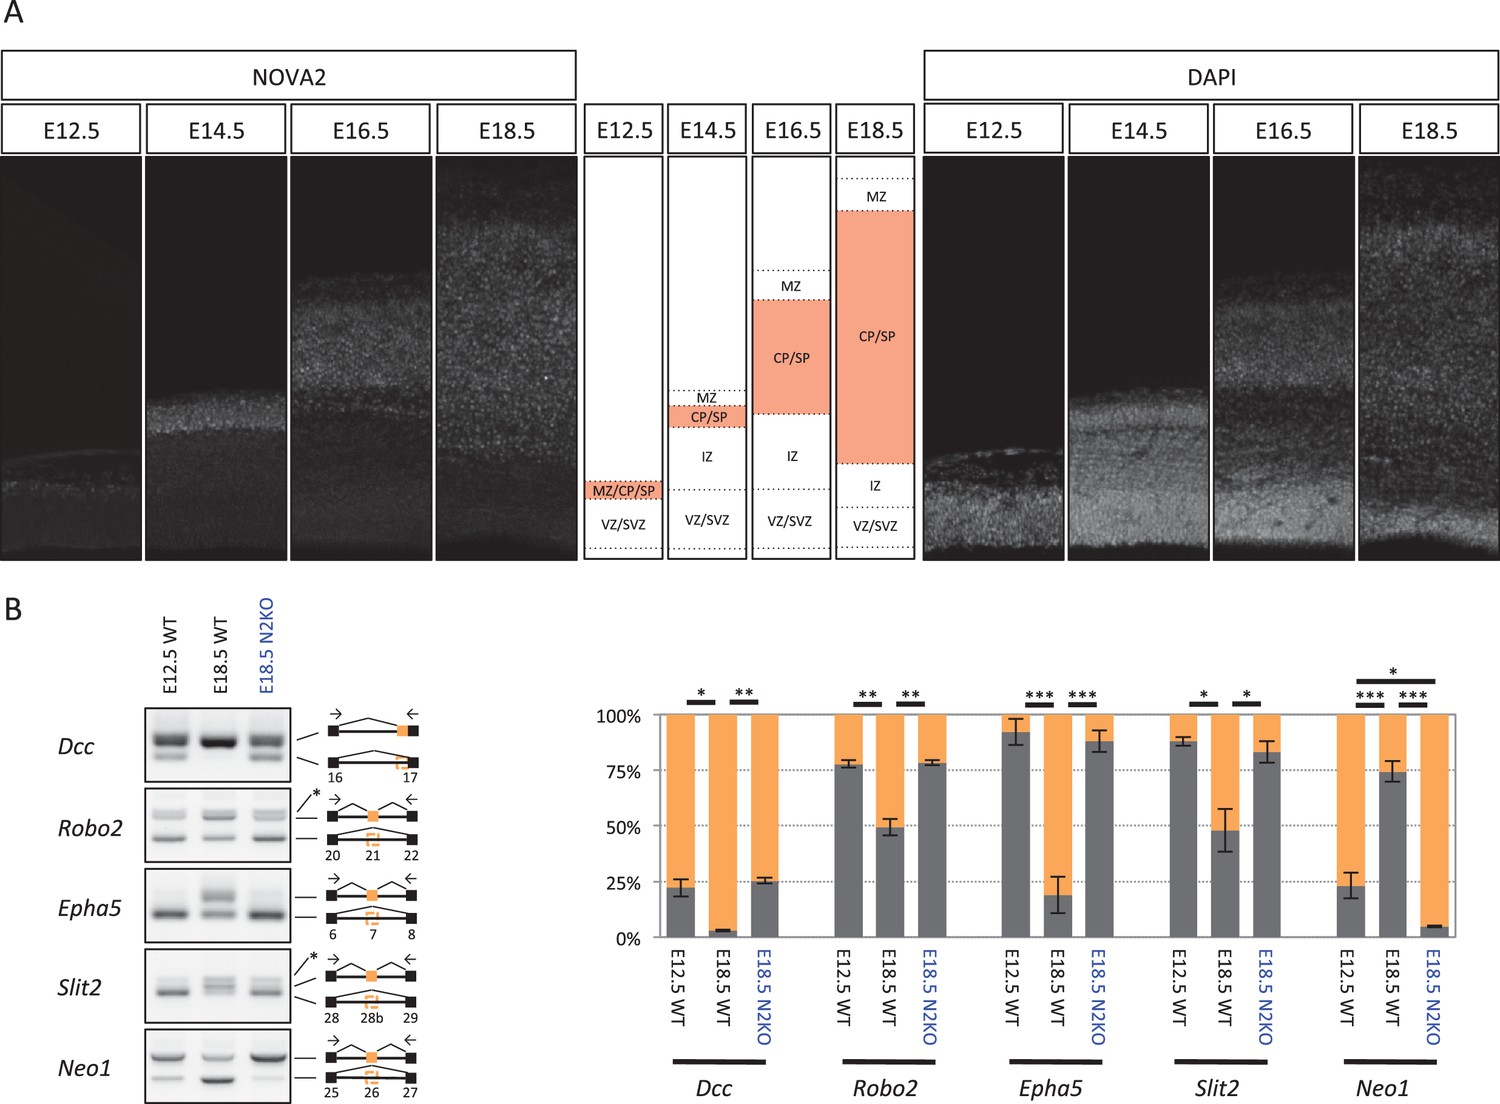
NOVA2 switches developmentally regulated exons usage of axon guidance related genes.
(A) NOVA2 expression in developing neocortex (left panels). High NOVA2 expression regions were high-lighted with red in middle panels. MZ: marginal zone, CP: cortical plate, SP: subplate, IZ: intermediate zone, SVZ: subventricular zone, VZ: ventricular zone. (B) Analysis of NOVA2-regulated exons in Dcc, Robo2, Epha5, Slit2, and Neo1 in E12.5 wild-type, E18.5 wild-type, and E18.5 Nova2-/- cortex (left panels). Quantification data of RT-PCR products were shown in right graphs. *p<0.05, **p<0.01, ***p<0.001 (n = 3, Tukey’s multiple comparison test).
Figure 6 with 3 supplements
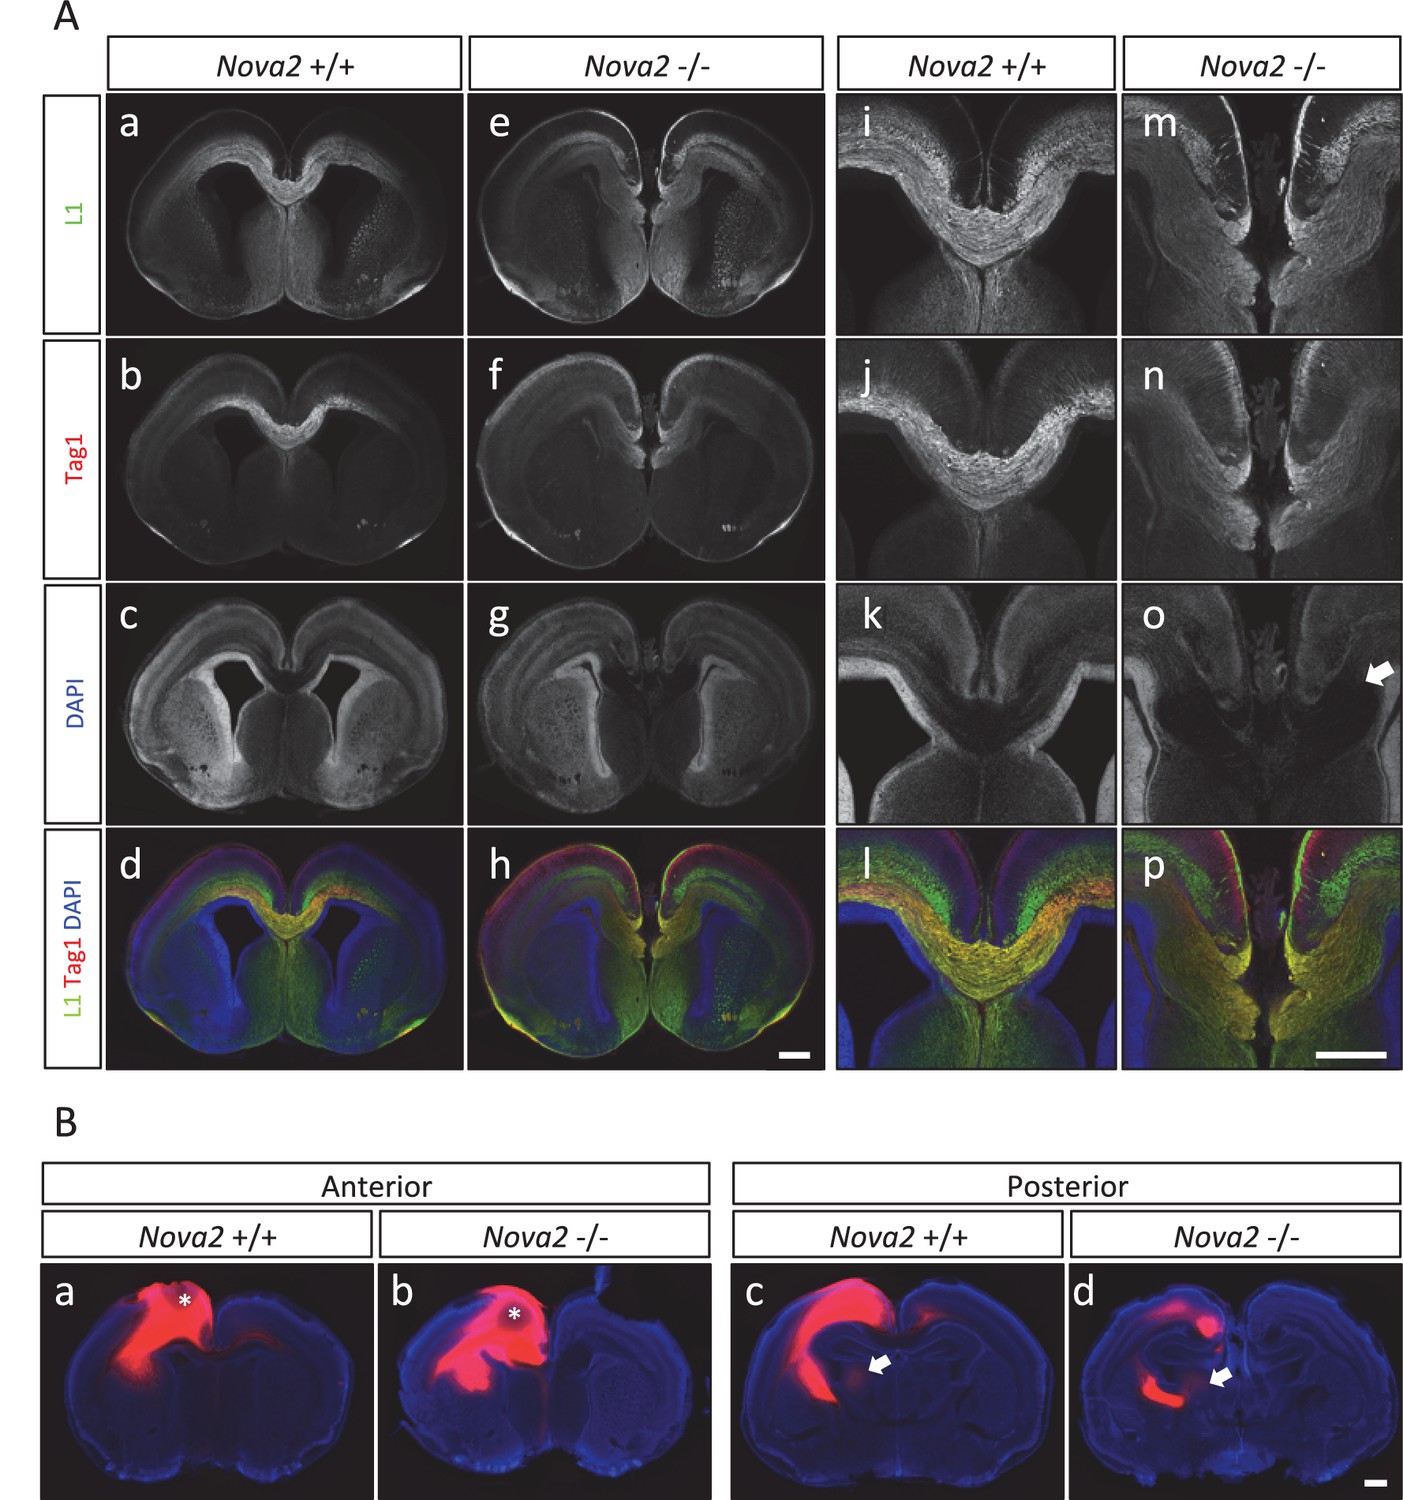
Agenesis of corpus callosum in Nova2-/- mice.
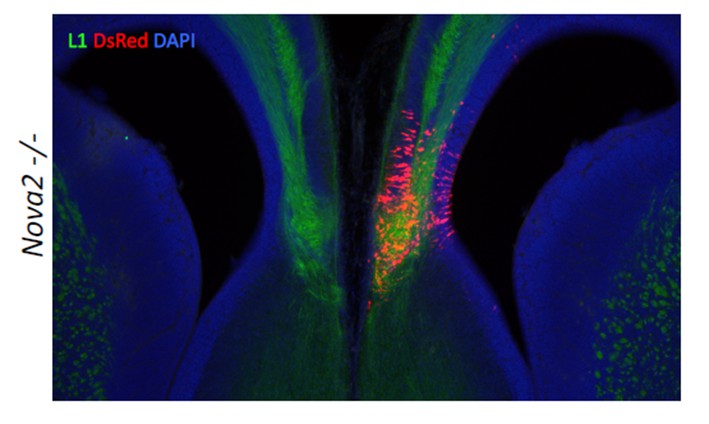
(A) Immunohistochemistry of L1 (green; a,e,i,m), TAG1 (red; b,f,j,n) proteins, DAPI (blue; c,g,k, o) and merged views (d,h,l,p) on coronal sections in E18.5 wild-type (a–d, i–l) and Nova2-/- (e-h, m–p) littermates. (i–p) Higher magnified view of anterior commissure region of a–h. Arrows indicated Probst bundles. Scale bars; 500 μm. (B) Commissure axons pathfinding defect in Nova2-/- mice. Coronal sections of the anterior (a,b) and posterior (c,d) telencephalon in P0 wild-type (a,c) and Nova2-/- (b,d) mice showing anterogradely labeled fibers after DiI crystal placements in the cingulate cortex. Arrows indicated the cortico-thalamic axon terminal into dorsal thalamus. Asterisks: DiI placed positions. Scale bars; 500 μm.
Figure 6—figure supplement 1
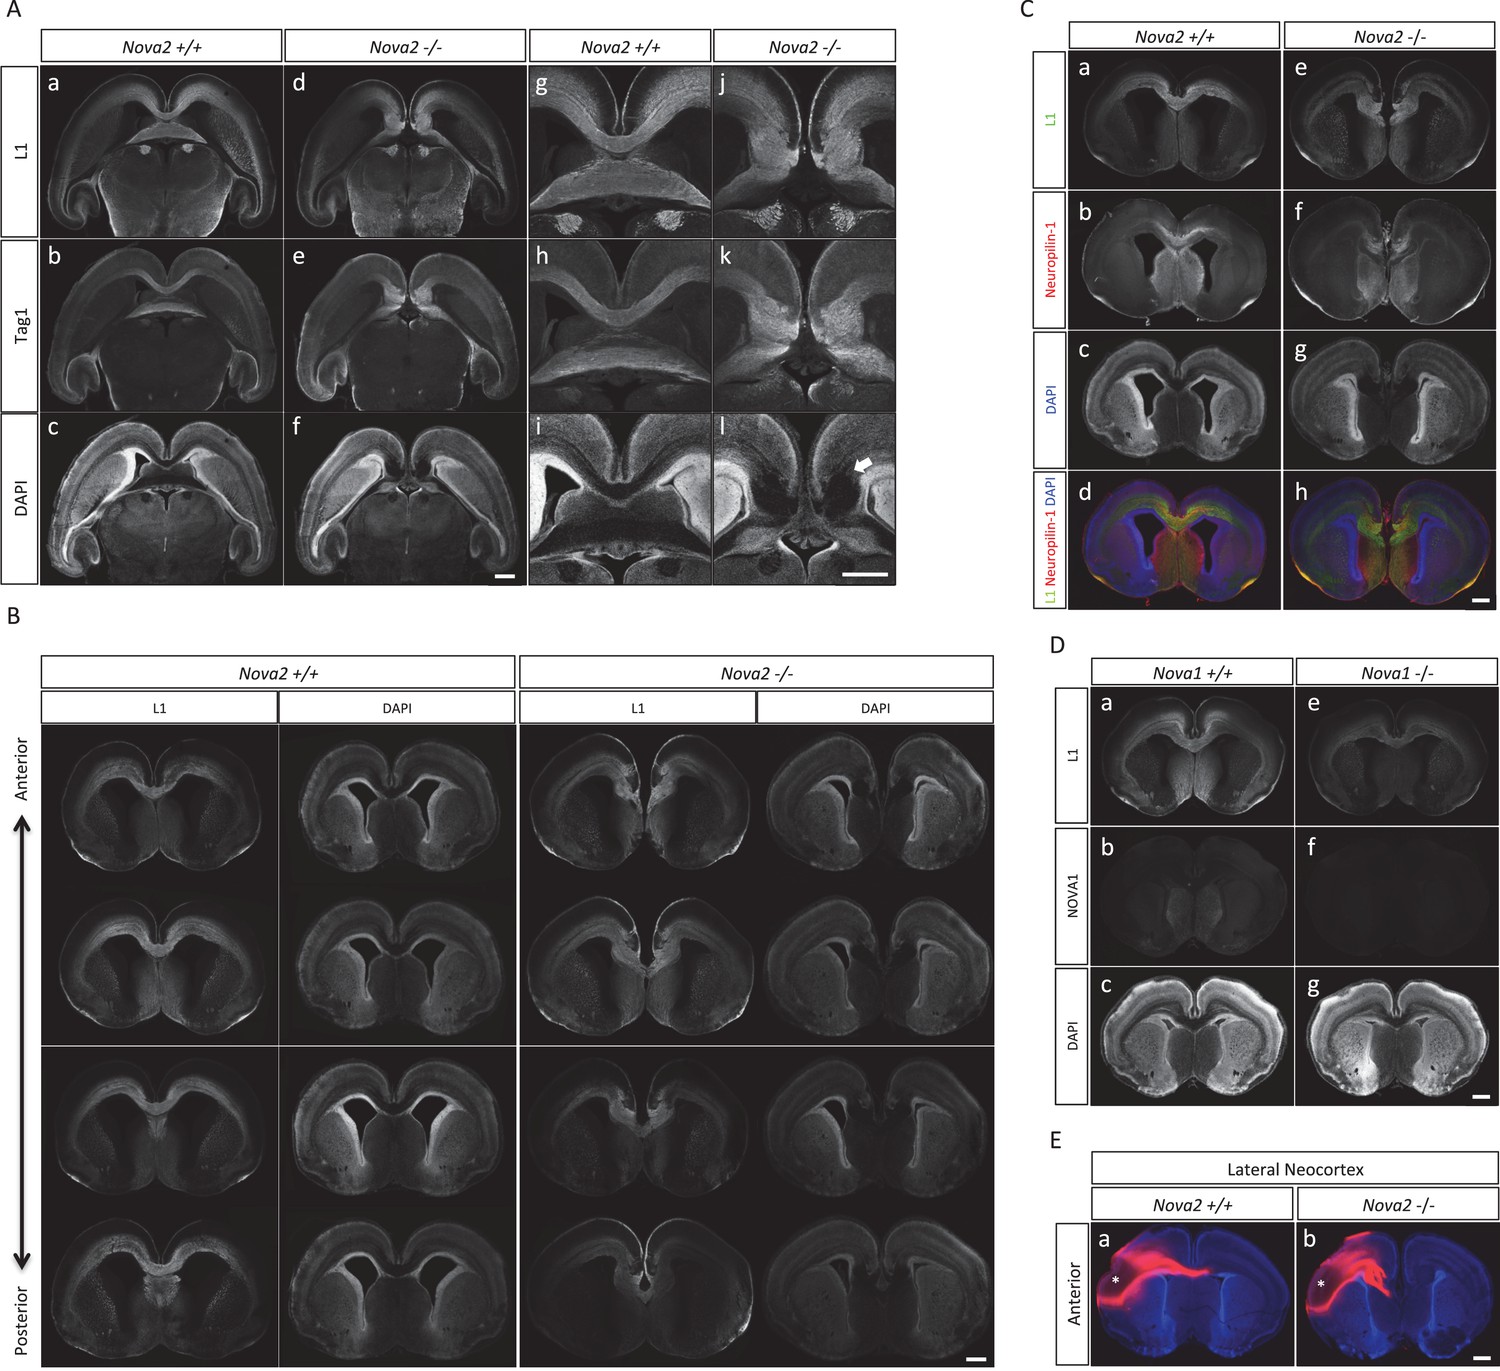
Loss of corpus callosum in Nova2-/- but not Nova1-/- mice.
(A) Immunohistochemistry of L1 (a,d,g,j), TAG1 (b,e,h,k) proteins, and DAPI (c,f,I,l) on horizontal sections in E18.5 wild-type (a–c, g–i) and Nova2-/- (d–f, j–l) littermates. (g–l) Higher magnified view of anterior commissure region of (a-–f). Arrows indicated Probst bundles. Scale bars; 500 μm. (B) Serial section images of L1 immunostaining from anterior brain position to posterior. Wild-type images shows on left panels and Nova2-/- images on right panels. Scale bar; 500 μm. (C) Coronal brain sections of E18.5 wild-type (a–d) and Nova2-/- (e–h) littermates, stained for L1 (green; aand e), Neuropilin-1 (a pioneer axon marker; red; b and f), DAPI (blue;cand g), and merged views (d and h). Scale bar; 500 um. (D) Normal formation of corpus callosum in Nova1-/- mice. Coronal brain sections of E18.5 wild-type and Nova1-/- littermates, stained for L1 (upper panels), NOVA1 (middle panels), and DAPI (lower panels). Scale bar; 500 um. (E) Commissure axons pathfinding defect in Nova2-/- mice. Coronal sections in wild-type (a) and Nova2-/- (b) mice showing anterogradely labeled fibers after DiI crystal placements in lateral neocortex. Asterisks: DiI placed positions. Scale bars; 500 μm.
Figure 6—figure supplement 2
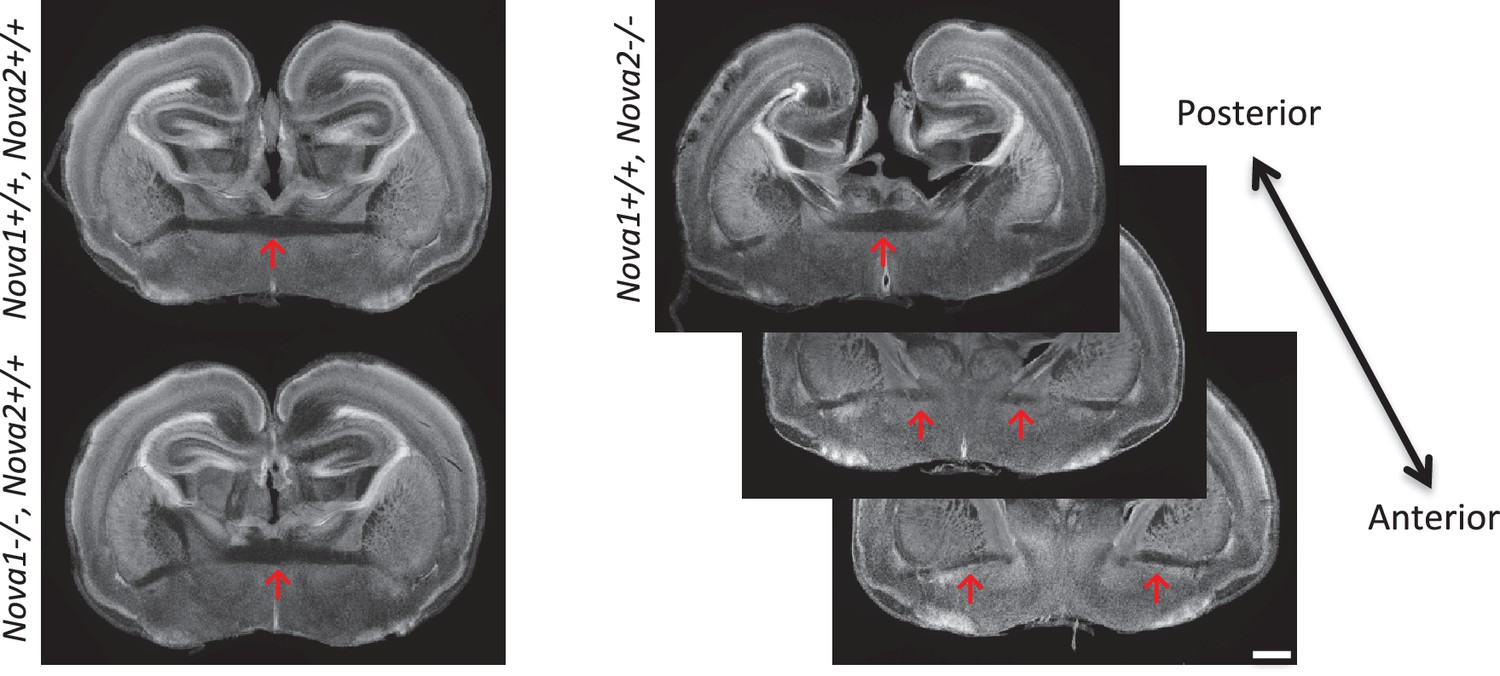
Normal formation of anterior commissure axons in Nova1-/- and Nova2-/- mice.
Coronal brain sections of E18.5 wild-type, Nova1-/- and Nova2-/-, stained for DAPI. Scale bar; 500 um. Red arrows: anterior commissure axons.
Figure 6—figure supplement 3
Alternative splicing changes of the genes associated with mouse ACC phenotypes and human ACC syndromes.
Left Diagrams showing RefSeq annotation genes, changed alternative splicing events, RNA-seq results of wild-type (grey) and Nova2-/- (blue), NOVA2 CLIP clusters (light blue), RNA-seq results of wild-type (grey) and Nova1-/- (red), and NOVA1 CLIP clusters (pink). Right panels and graphs showing RT-PCR results and quantification data in E18.5 wild-type, Nova2-/-, and Nova1-/- mice cortex, respectively. *p<0.05, **p<0.01, ***p<0.001 (n = 3, Tukey’s multiple comparison test). Data are presented as mean ± SD.
Figure 7
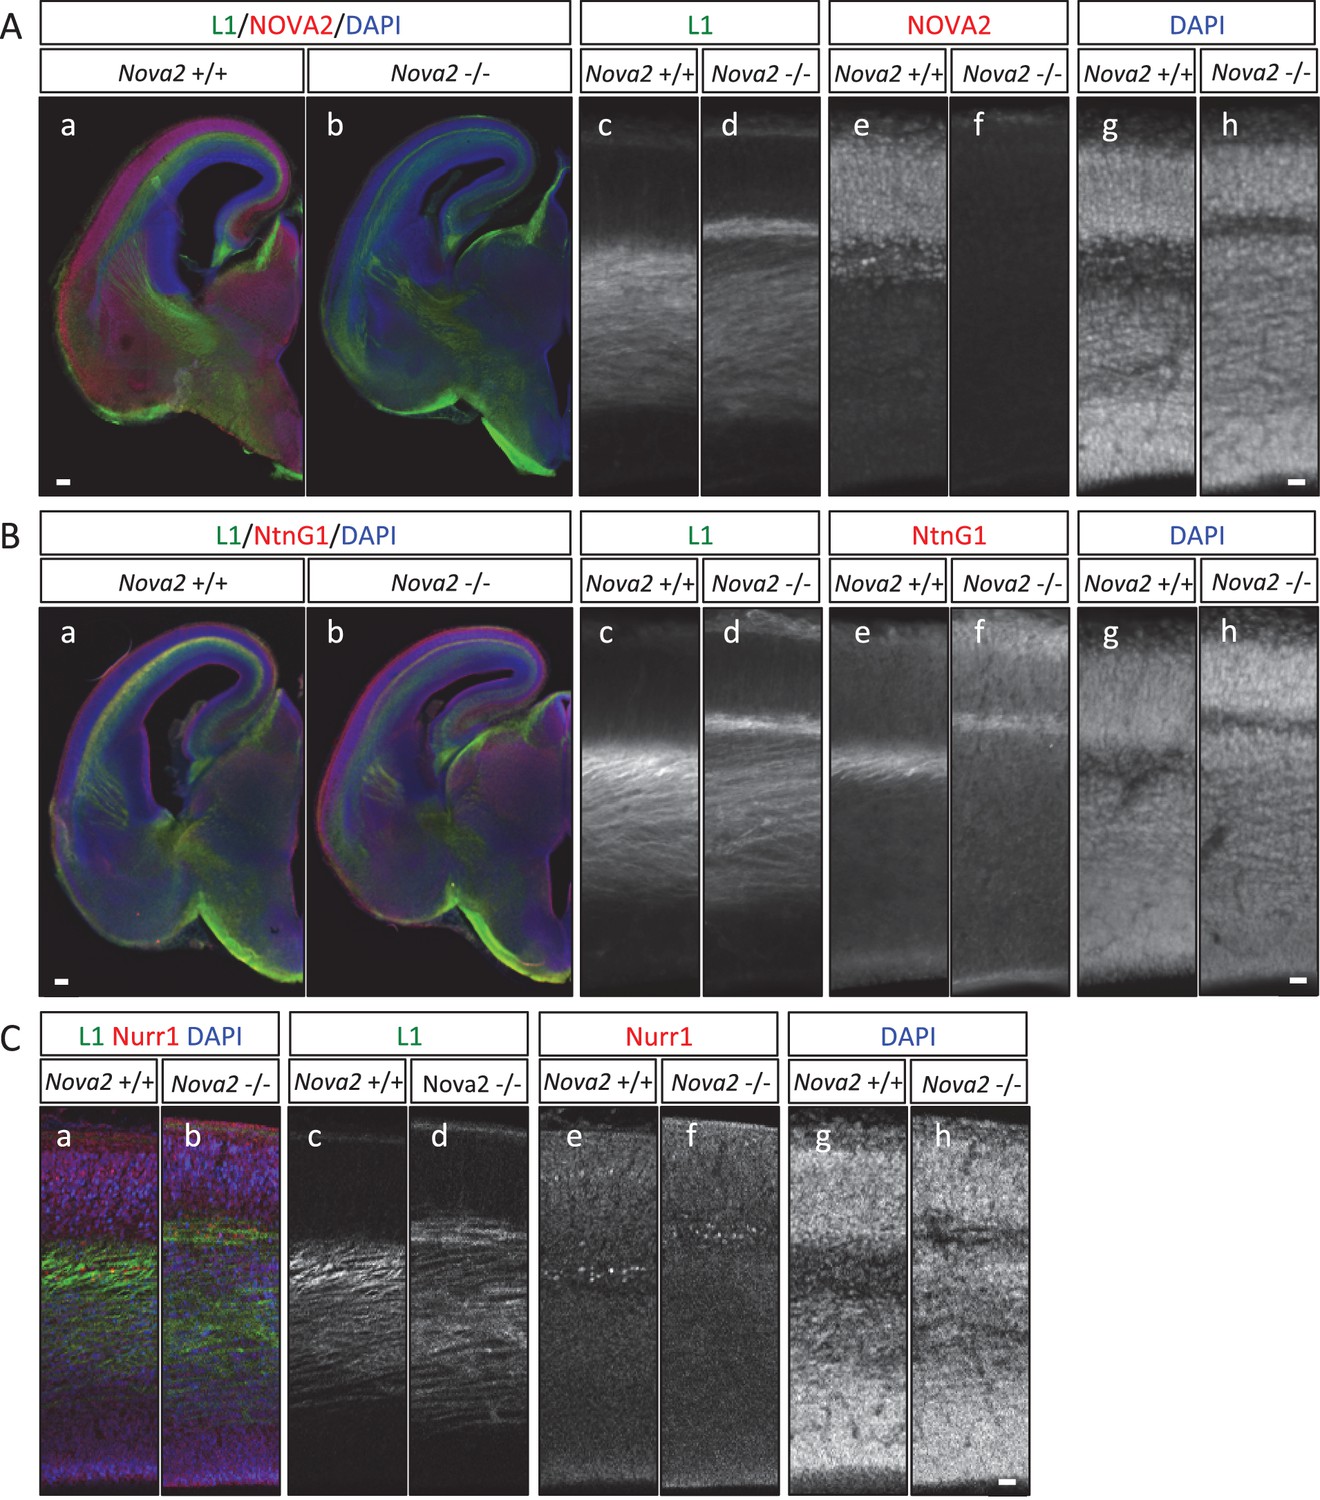
Abnormal thalamo-cortical path in the cortex of Nova2-/- mice.
(A) Immunohistochemistry of L1 (c,d) and NOVA2 (e,f) on coronal sections in wild-type (a,c,e,g) and Nova2-/- (b,d,f,h) at E16.5. (a,b) Merged coronal section views of L1 (green), NOVA2 (red), and DAPI (blue). (c-h) Higher magnified view of neocortex of (Aa) and (Ab). Scale bars; 200 μm (a,b), 50 μm (c–h). (B) Immunohistochemistry of L1 (c,d) and NTNG1 (e,f) on coronal sections in wild-type (a, c,e,g) and Nova2-/- (b,d,f,h) at E16.5. (a,b) Merged coronal section views of L1 (green), NTNG1 (red), and DAPI (blue). (c-h) Higher magnified view of neocortex of (Ba) and (Bb). Scale bars; 500 μm (a,b), 50 μm (c–h). (C) Immunohistochemistry of L1 (c,d) and NURR1 (e,f) in the cortex of wild-type (a,c,e,g) and Nova2-/- (b,d,f,h) at E16.5. (a,b) Merged views of L1 (green), NURR1 (red), and DAPI (blue). Scale bar; 50 μm.
Figure 8
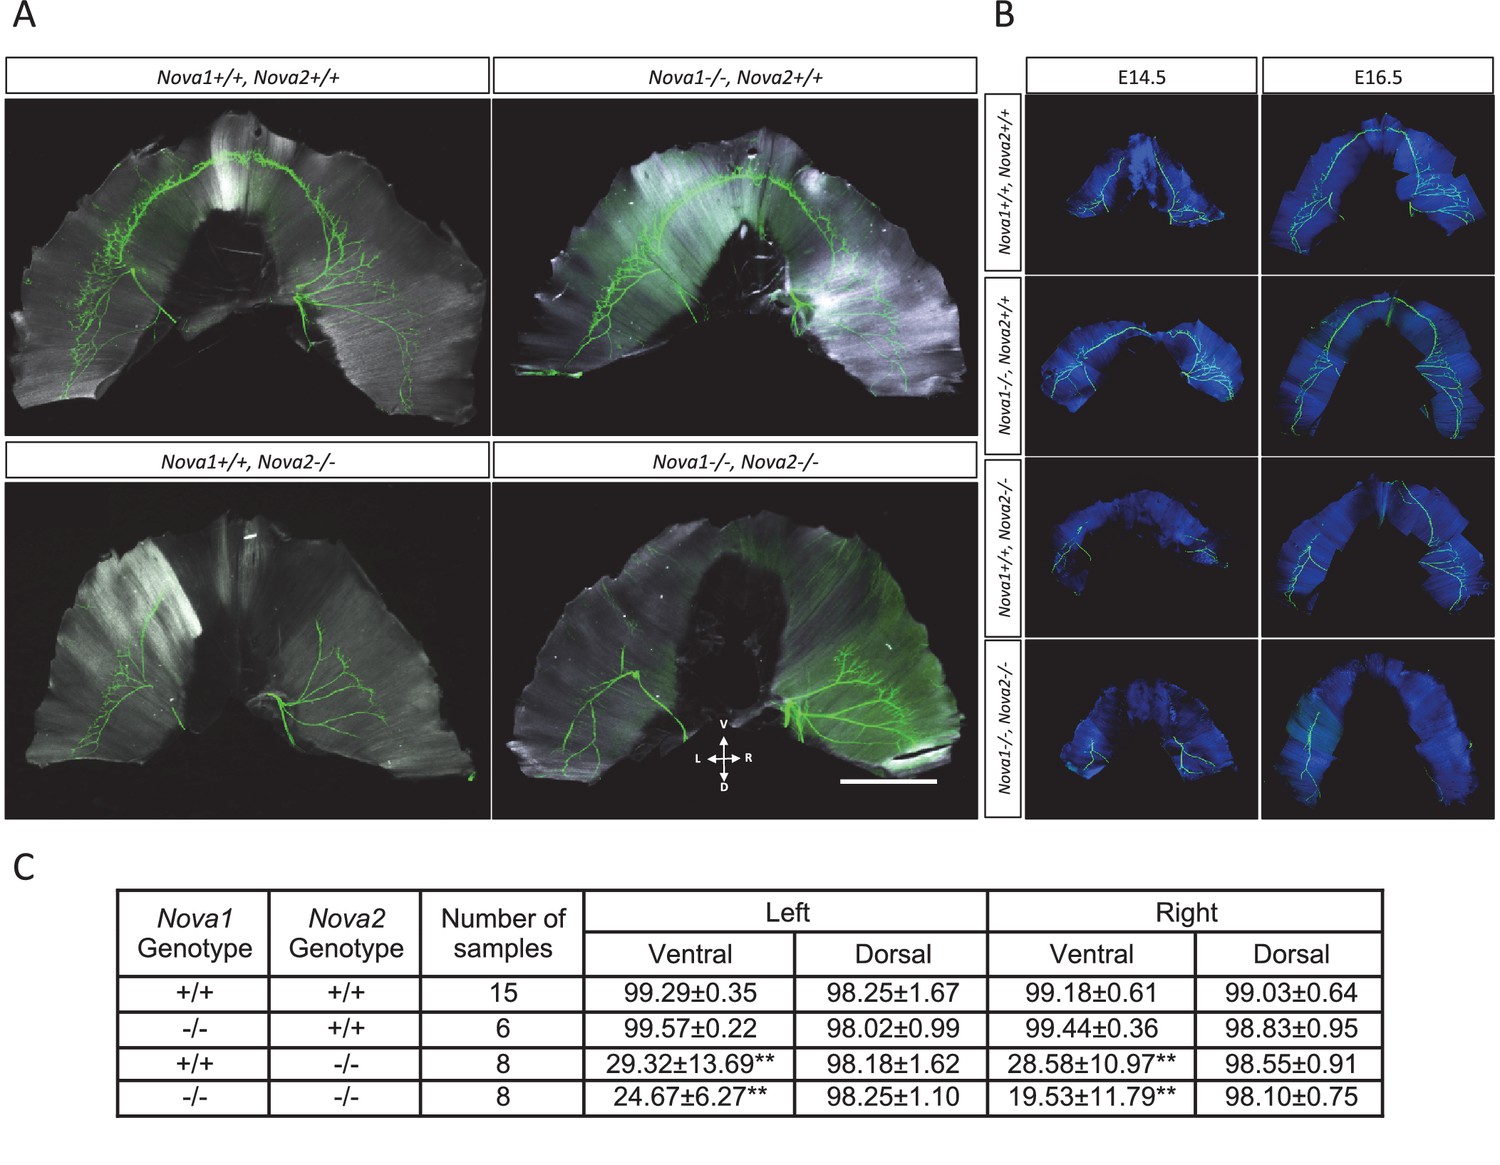
Innervation defect in ventral diaphragm of Nova2-/- mice.
Whole mount staining images of axons (green) and muscle (white in A, blue in B) in diaphragm of E18.5 (A), E14.5 and E16.5 (B) wild-type and Nova1/2 mutants. No differences were observed between left and right diaphragm in each genotypes. Scale: 2 mm. D: Dorsal, L: left, R: right, V: ventral. (C) Quantification of innervation percentage of muscle in each quadrant of diaphragm that is covered by the phrenic nerve in E18.5 wild-type and Nova1/2 mutants. Using the phrenic nerve as reference, measurements of muscle length were taken from the insertion point of the phrenic nerve to the tip of the nerve (X), and from the tip of the nerve to the end of hemidiaphragm (Y), for the ventral and dorsal quadrants of left and right hemidiaphragms. The values indicate the ration of X/(X+Y), expressed as percentage ± standard deviation. **p<0.01 by t-test. Data are presented as mean ± SD.
Figure 9 with 1 supplement
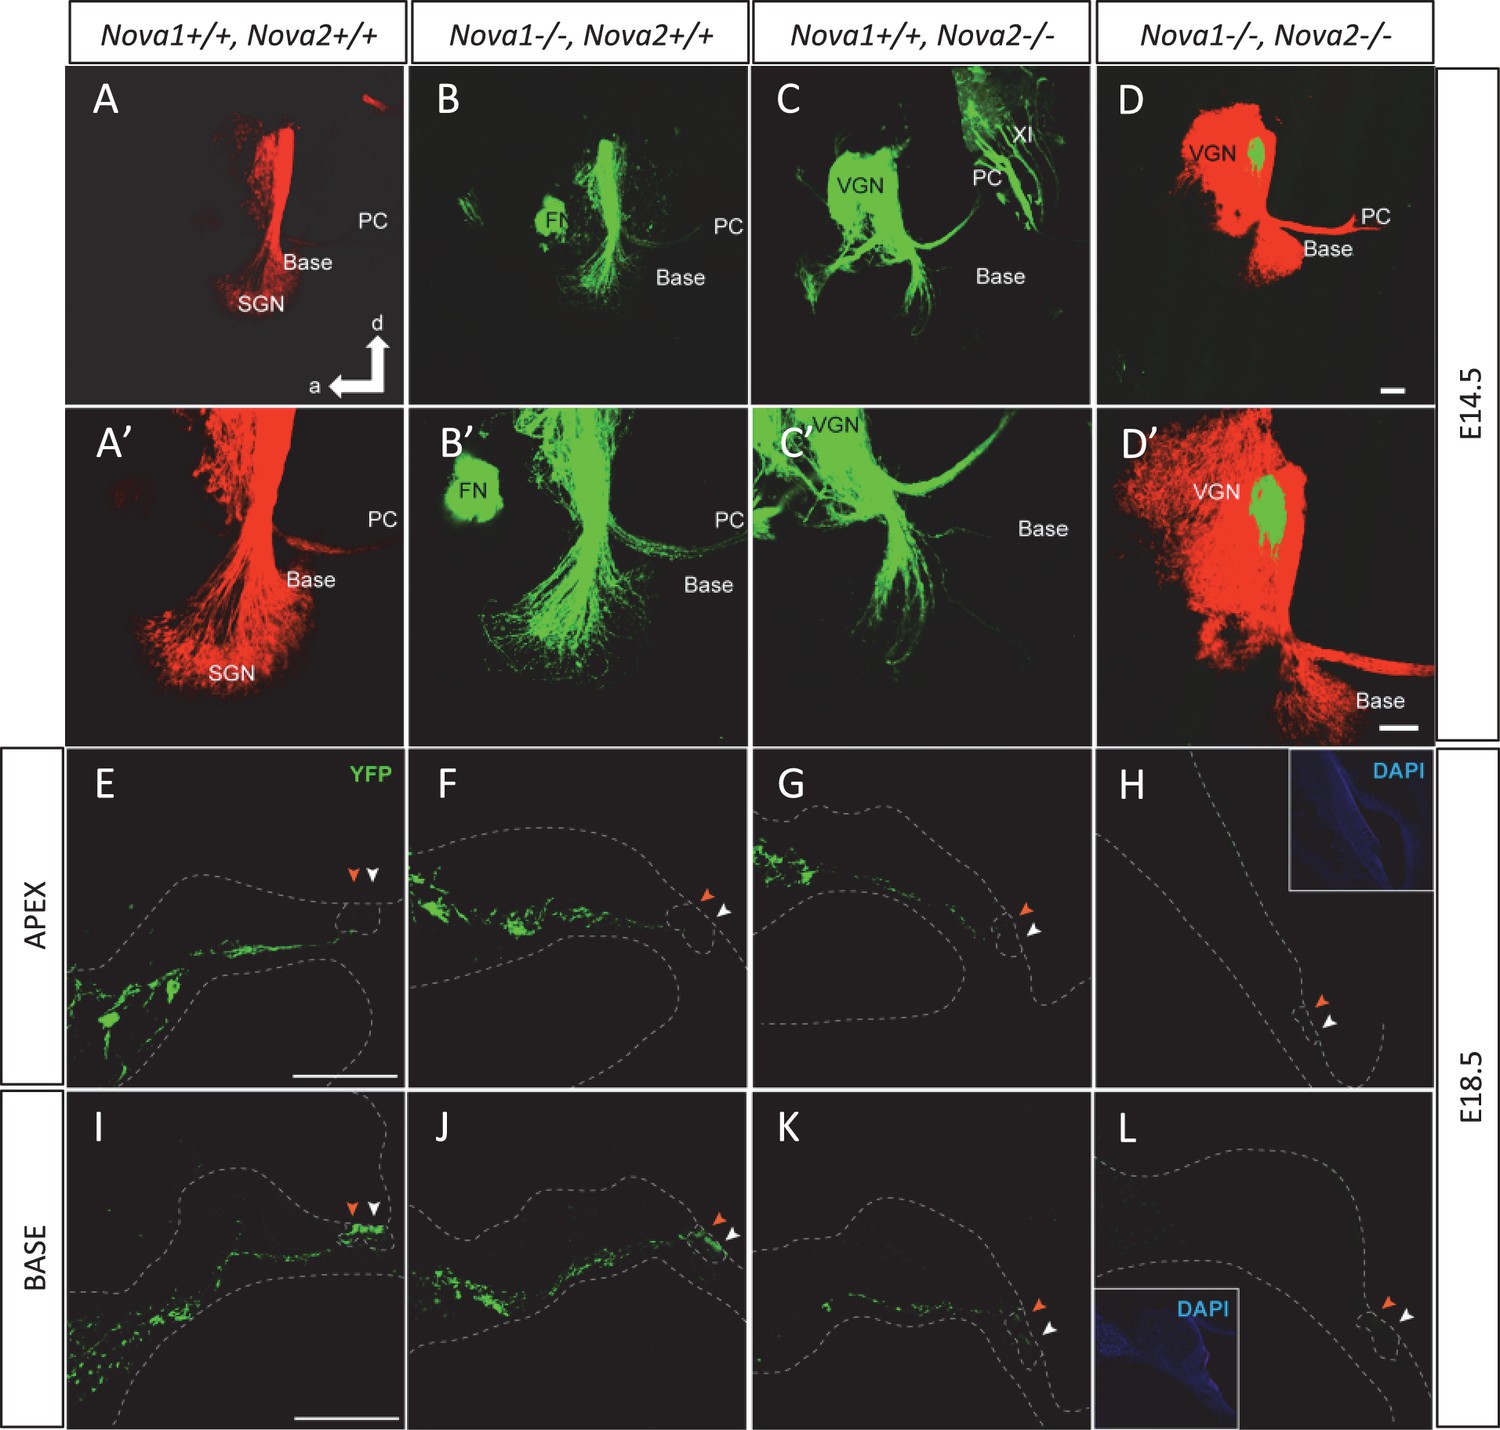
NOVA2 expression is necessary for efferent innervation, targeting to the cochlea during embryonic development.
(A–D’) Olivocochlear and vestibular efferents were labeled with lipophilic dye application to the crossing bundle in rhombomere 4 (green) and afferent (red) by dye application to the cochlear nuclei. This view shows the left ear viewed from medial. Anterior (a) is to the left and dorsal (d) is up. (A,A') wild-type mice spiral ganglion neurons (SGN) afferents reach the developing organ of Corti at E14.5 in the base and middle turn. Vestibular ganglia (VGN) project to the posterior canal crista (PC) and other vestibular sensory epithelia. (B,B’) Dye labeling of efferent fibers to the ear is comparable to wild-type in Nova1-/-mice and (C,C') shows reduced fiber growth in Nova2-/- mice (D,D'). There is virtually no efferent fiber growth to the ear in Nova1-/-, Nova2-/- double knockout mice. Note that in D' the afferent signal was reduced to reveal how far efferents are of the target (E–L). Efferent innervation (green) is shown in cochlea cryosections of Nova;YFPJ E18.5 mice. Nuclei are stained with DAPI (blue) and actin with Alexa-labeled Phalloidin (magenta). Apical (E–H) and basal (I–L) turns are shown. (E,I) wild-type (F,J) and Nova1-/- mice show equivalent axonal innervation, (G,K) Nova2-/- mice have reduced innervation, (K) especially in the base. (H,L) Nova1-/-, Nova2-/- double knockout show no efferent innervation of the cochlea. Arrowhead shows approximate location of OHC rows (white) or IHC (orange). Some auto-fluorescence is visible in L. Inset shows nuclear stained (DAPI). Scale bars: 100 μm.
Figure 9—figure supplement 1
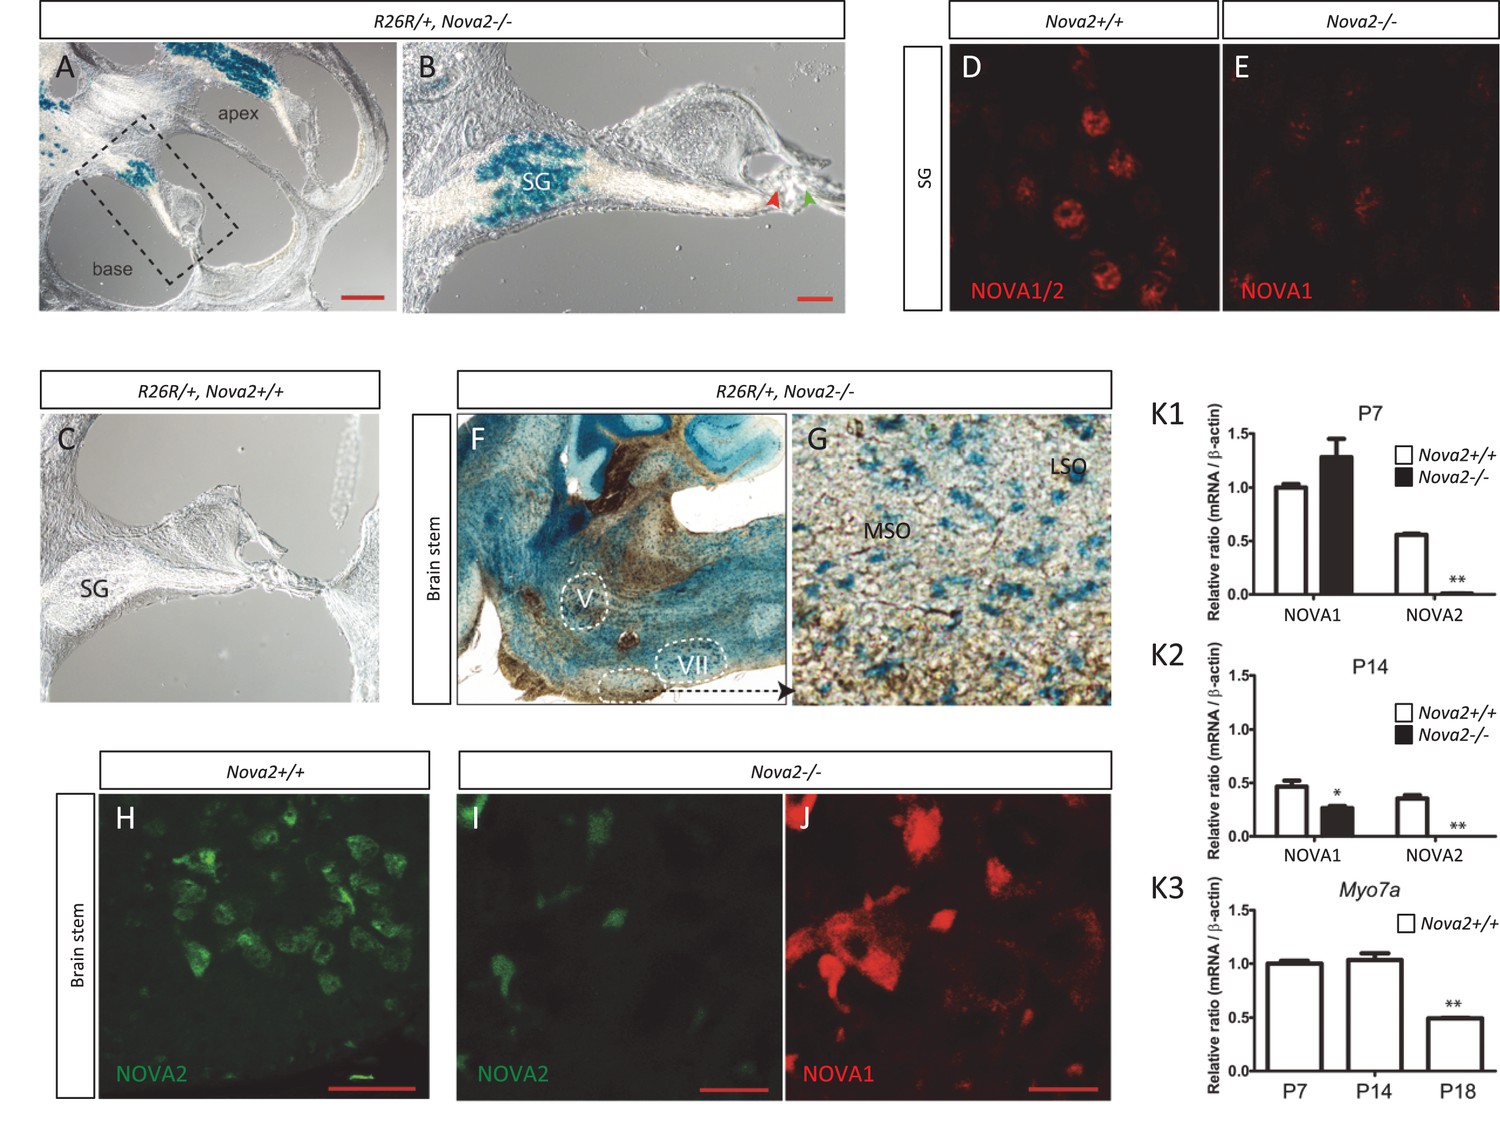
NOVA1 and NOVA2 expression in spiral ganglion (SG) and in superior olive neurons but not in hair cells.
(A) Sagittal sections of Rosa26 (R26R); Nova2-/- mice at six month of age. β-gal staining shows that the expression of Nova2 was switched on during development in the spiral ganglion (SG) were the soma of the afferent innervating neurons are located (B) The enlarged organ of Corti area (dashed line in A) shows no expression of Nova2 in the cochlea, including IHC (red arrowhead) and OHC (green arrowhead). (C) Control Rosa26 (R26R); Nova2+/+ mouse shows no staining. (D) Immunostaining of P20 SG cells with an antiserum that recognizes NOVA1 and NOVA2 (E) showing the expression of NOVA1 in Nova2-/- mouse and demonstrating that NOVA1 and NOVA2 are expressed in SG. (F) In addition there is label in the soma of the medial olivococlear (MOC) neurons projecting efferent axons to the OHC which are located in the Medial superior olive (MSO) and lateral olivocochlear (LOC) neurons projecting axons the afferents below the IHC whose somas are located in the lateral superior olive (LSO) of the brainstem. (G) Enlarged area showing stained neuronal soma in MSO and LSO. (G–I) Immunostaining of a comparable section at P14 (H) wild-type section stained with C-16 a NOVA2 specific antibody. (I–J) Nova2-/- section stained simultaneously with C-16 antibody (showing unspecific background) and (I) with an antiserum that recognizes NOVA1 and NOVA2 showing the expression of NOVA1 in the superior olive. (K1–K3) Total RNA was extracted from micro dissected organ of Corti (dashed line rectangle), analysed by qPCR and normalized by actin. The plots show Nova1 and Nova2 gene expression relative to the expression of Nova1 in control P7 mouse at (K1) P7 and (K2) P14. (K3) the expression of the hair cell marker Myosin 7a (Myo7a) is shown at the indicated time points as a control. The reduced expression at P18 reflects problems in the dissection due to increased calcification. There is no apparent problem at P14, suggesting that the reduction in NOVA1 and NOVA2 expression at P14 is a biological phenomenon that probably reflects pruning of innervation. V: motor trigeminal nucleus, VII: Facial Nucleus. Scale bars; 200 μm (A), 50 μm (B) 10 μm (H–J). *p<0.05, **p<0.01 (n = 3, t test). Data are presented as mean ± SE.
Figure 10 with 1 supplement
Efferents innervation defect and hearing impairment in postnatal Nova2-/- mice.
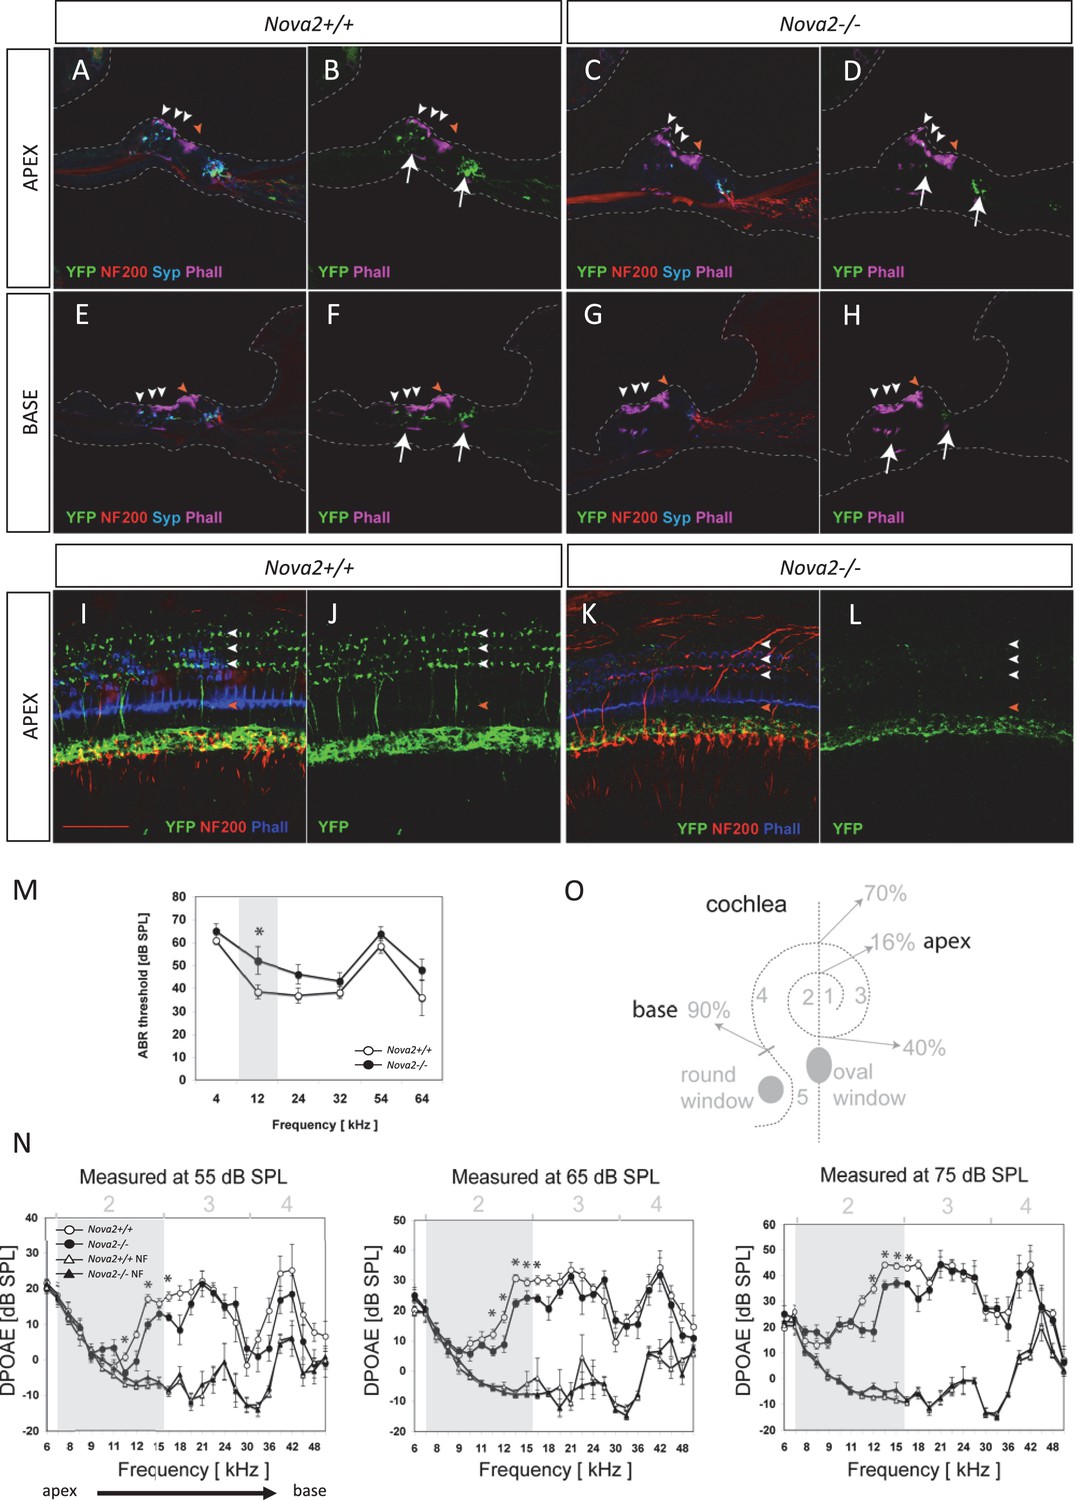
(A–H) Cochlea cryosections immunostaining of in Nova2-/-;YFPJand control Nova2+/+;YFPJ P14 mice. The images show reduced efferent axons in green (YFP, see arrows), afferent neurofilaments (NF200) in red and phalloidin (Phall) labeling of actin-rich hair bundles in magenta. The presynaptic marker synaptophysin (syn) in blue, shows a reduction of functional efferent innervation. (A–F) control mouse, (C–H) Nova2-/-;YFPJ mouse. (A–D) Apical or (E-H) Basal organ of Corti. (I–L) Cochlea apical turn segment 2 (see below) whole mount preparations immunostaining of (K, L) Nova2-/-;YFPJ and (I,J) Nova2+/+;YFPJ P10 mice. The images show reduced efferent axons in green (YFP), NF200 in red and Phall in blue. (A–L) Arrowheads show approximate location of OHC rows (white) or IHC rows (orange). (O) Representation of the dissection map of the cochlea indicating segments 1–5 and the approximate localization along the length of the cochlea. (M) The thresholds of the auditory brainstem response (ABR) to pure-tone stimuli ranging from 10 to 80 dB SPL are increased significantly in Nova2-/- mice (n = 4–5 for each frequency) compared to wild-type mice (n = 5–6) at P21-P22. (N) The distortion-product otoacoustic emissions (DPOAEs) at 2f1-f2 measured at 55, 65 and 75 dB SPL show significant differences between wild-type mice (n = 4) and Nova2-/- animals (n = 4) at P21-P22. The noise floor (NF) that was measured simultaneously is also shown for both groups. The approximate acoustic representation of segments 2–4 of the dissected cochlea are shown over each plot and segment 2 is overshadowed in gray. Scale bars: 50 μm. *p<0.05.
Figure 10—figure supplement 1
Reduced efferent innervation and increased afferent innervation to the apex of the Nova2-/- mice cochlea.
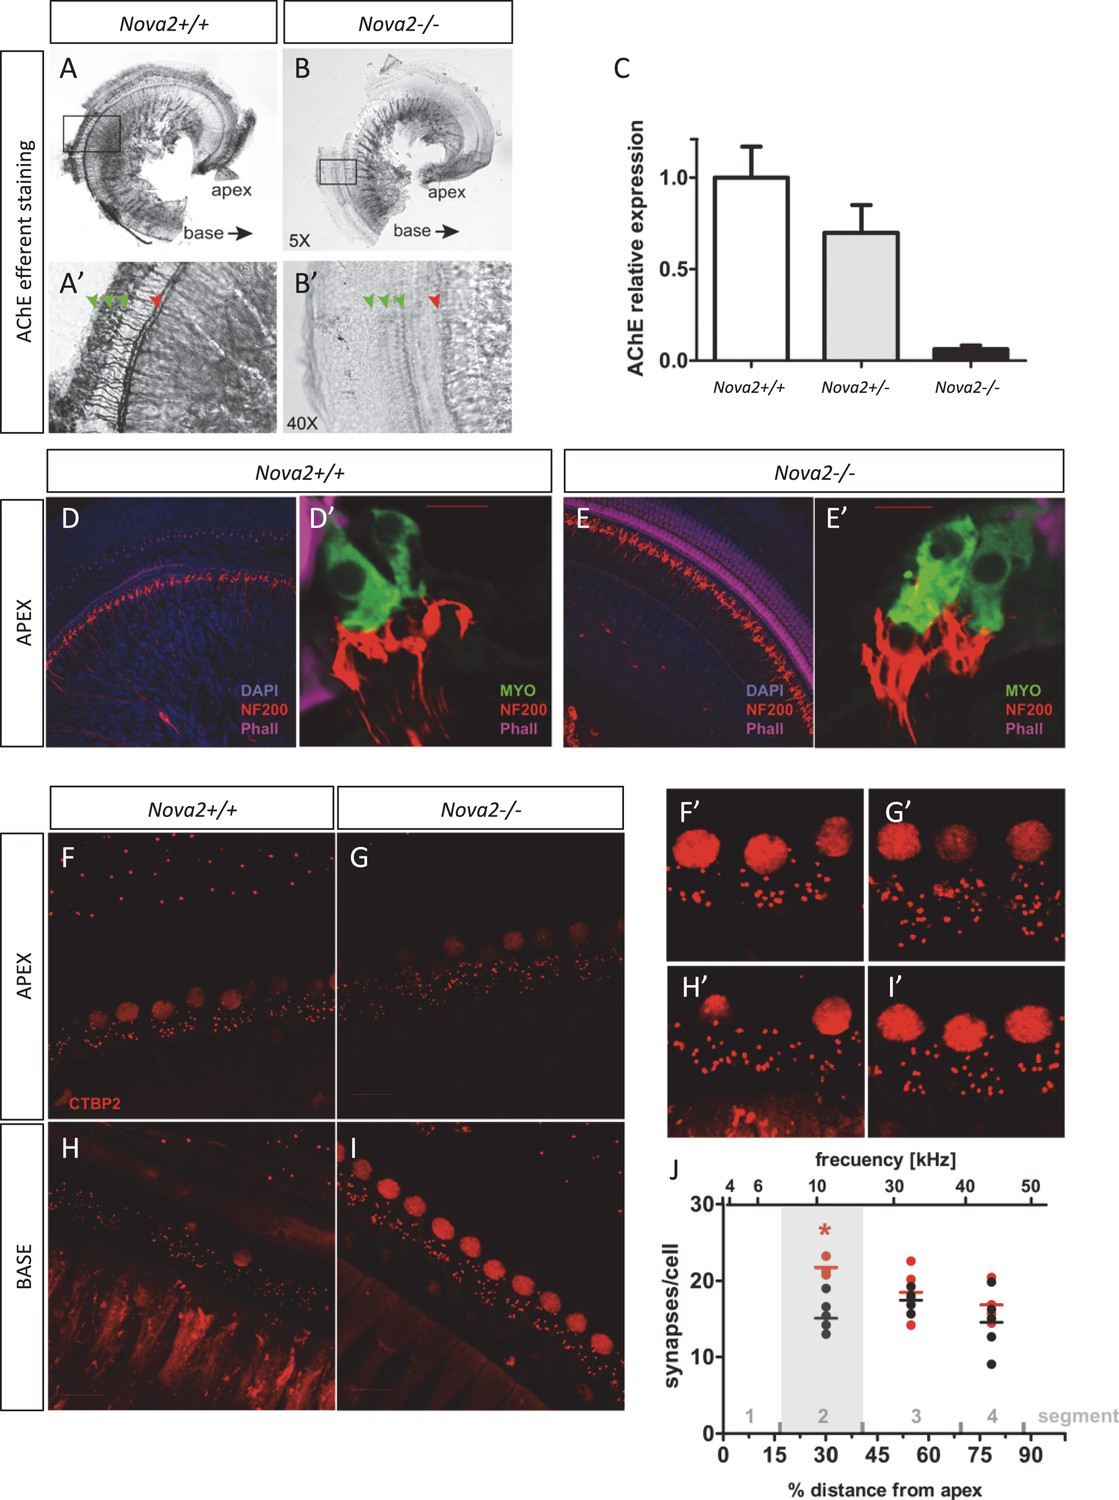
(A–C) Quantitation of efferent neuronal axons by colorimetric detection of the enzyme acetyl cholinesterase (AChE) in the cochlear apex of (B,B’) Nova2-/- and control (A,A’) wild-type mice. Representative images are shown. Green arrows indicate the 3 rows of OHC and red Arrow the row of IHC. These preparations were done in non-decalcified cochlea and only the apex could be preserved after dissection. (B) Plot showing quantification of the colorimetric signal. Heterozygote Nova2+/- mice were included in the plot to show that defect is dependent on the dose of NOVA2 expressed (n = 4). P15-P25 mice were used **p<0.01. (D,E) Cochlea whole mount and (D’,E’) Cryosections immunostaining in wild-type and Nova2-/- P20 mice. The images show apparent increased afferent innervation staining (NF200, red). Hair cells are labeled with a MYOVI antibody (green) and hair bundles with Phall. (magenta). (F–I) Afferent innervation to the IHC was quantified by counting individual ribbon synapses stained with CTBP2 antibody at P18. (F–H) wild-type (G–I) Nova2-/-, (F,G) segment 2, apex and (H,I) segment 4, apex (see Figure 10-O). (F’–I’) Respective amplified afferent IHC synapses. (J) A total of 30 wild-type and 44 Nova2-/- cells from 2 mice of each genotype were quantified. Each dot in the plot represents 2–5 averaged cells. The figure shows the approximate location of cells from segment 1–4 along the% length of the cochlea from apex to base on the lower x axes and the approximate frequency representation in the upper x axes. The number of dots (synapses) per cell was quantified by counterstaining with MYOVI which allows to outline the IHC perimeter. **p<0.01.
Figure 11

Model summarizing a unique role for NOVA2 in the consequence to neuronal axon guidance and outgrowth.
The results of HITS-CLIP and RNA-seq analysis combined with histological analysis in Nova2-/- mice suggest a model that NOVA2 starts to act on an axon guidance regulatory cascade during neural differentiation in the neurons located on cortical plate. The breakdown of NOVA2-mediated RNA regulation results in the collapse of the normal axon guidance/outgrowth properties in either/both the neuron extending axon or/and the neuron expressing axon guidance cue.
Author Response Image 1
Download links
A two-part list of links to download the article, or parts of the article, in various formats.
Downloads (link to download the article as PDF)
Open citations (links to open the citations from this article in various online reference manager services)
Cite this article (links to download the citations from this article in formats compatible with various reference manager tools)
NOVA2-mediated RNA regulation is required for axonal pathfinding during development
eLife 5:e14371.
https://doi.org/10.7554/eLife.14371


