Further support for aneuploidy tolerance in wild yeast and effects of dosage compensation on gene copy-number evolution
- University of Wisconsin-Madison, United States
Figures
Figure 1
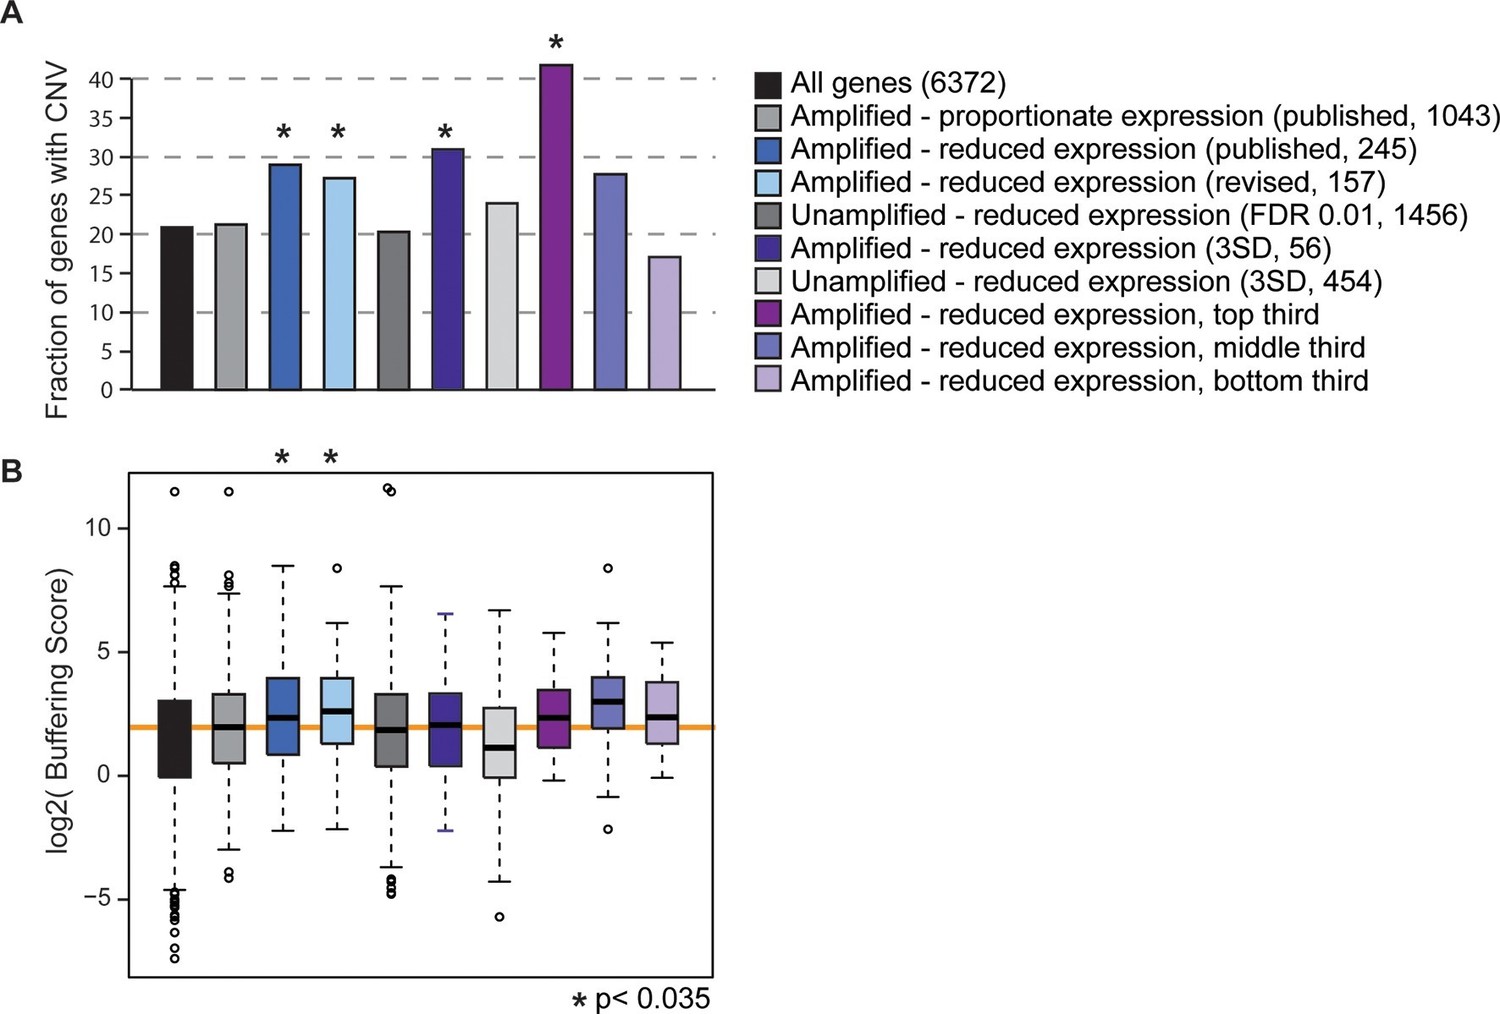
Gene sets enriched for dosage-compensated genes show unique signatures.
Gene sets and the numbers contained within them are indicated by the key. The revised list of amplifed genes with lower-than-expected expression were partitioned into thirds, based on genes with the greatest (top third) or smallest (bottom third) reduction in expresison compared to expectation. (A) The fraction of genes in each group for which at least three of 103 strains showed gene amplification. (B) The distribution of Buffering Scores for genes with CNV. Here, Buffering Score represents the number of 103 strains with a gene duplication divided by expression constraint (Vg/Vm, see Hose et al. for details). Higher values indicate a higher propensity for CNV despite expression constraint. The orange line indicates the median value for amplified genes with proportionate expression as a reference point. Asterisks indicate statistical significance (p<0.035) compared to the amplified genes with proportionate expression. In some cases, the trends were consistent but not significant (likely owing to small sample sets).
Tables
Table 1
The center (mean) of log2 distributions for mRNA or DNA ratios measured across all unamplified genes in isogenic aneuploid-euploid strain comparisons are shown. mRNA data from each strain was normalized by either ‘spike-in’ of Sz. pombe cells to the S. cerevisiae cell collections or by reads-per-kb per million mapped reads (RPKM) of S. cerevisiae genes only. Normalized data were then compared across strain pairs to provide a log2 ratio of relative mRNA or DNA abundance for each gene.
| Mean log2 mRNA ratios (spike-in) | Mean log2 mRNA ratios (RPKM) | Mean log2 DNA ratios (RPKM) | 1 SD used for threshold | |
|---|---|---|---|---|
| T73_Chr8-4n vs -2n rep1 | 0.08 | −0.019 | −0.072 | 0.197 |
| T73_Chr8-4n vs -2n rep2 | 0.102 | −0.020 | n.a. | |
| YJM428_Chr16-4n vs -2n rep1 | −0.401 | −0.037 | −0.121 | 0.168 |
| YJM428_Chr16-4n vs -2n rep2 | −0.457 | 0.004 | n.a. | |
| YPS163_Chr8-2n vs -1n rep1 | n.a.* | -0.146 | 0.045 | 0.242 |
| YPS163_Chr8-2n vs -1n rep2 | n.a.* | −0.135 | n.a. | |
| NCYC110_Chr8-3n vs -2n rep5 | 0.014 | −0.005 | n.a. | |
| NCYC110_Chr8-4n vs -2n rep5 | 0.273 | 0.186 | n.a. | |
| NCYC110_Chr8-4n vs -2n rep1 | n.a. | 0.058 | −0.076 | |
| NCYC110_Chr8-4n vs -2n rep2 | n.a. | 0.011 | −0.108 | |
| NCYC110_Chr8-4n vs -2n rep3 | n.a. | 0.078 | n.a. | |
| YPS1009_Chr12-4n vs -2n rep1 | n.a. | 0.014 | 0.003 | |
| YPS1009_Chr12-4n vs -2n rep2 | n.a. | -0.094 | −0.229 | |
| YPS1009_Chr12-4n vs -2n rep3 | n.a. | −0.184 | n.a. |
-
*We attempted spike-in normalization for haploid YPS163-disomic (‘2n’) and -monosomic (‘1n’) strains but were unable to accurately count cells due to differences in flocculation across aneuploid-euploid strains. As described in Hose et al. (2015), RPKM normalization produced data that agreed as well or better across replicates compared to spike-in normalization and in the case of YJM428_Chr16-4n agreed better with qPCR measurements of Chr16 abundance in the culture (not shown). Note data from NCYC110 replicate (rep) 5 were not used in the analysis but were generated during the Hose et al. manuscript revision stage for normalization controls. The SD of DNA ratios on the affected chromosome that were subtracted from gene-level measurements of relative DNA abundance (i.e. to generate the gene-specific thresholds, see text) are shown for reference where relevant.
Download links
A two-part list of links to download the article, or parts of the article, in various formats.
Downloads (link to download the article as PDF)
Open citations (links to open the citations from this article in various online reference manager services)
Cite this article (links to download the citations from this article in formats compatible with various reference manager tools)
Further support for aneuploidy tolerance in wild yeast and effects of dosage compensation on gene copy-number evolution
eLife 5:e14409.
https://doi.org/10.7554/eLife.14409


