Lip movements entrain the observers’ low-frequency brain oscillations to facilitate speech intelligibility
- University of Glasgow, United Kingdom
Figures
Figure 1
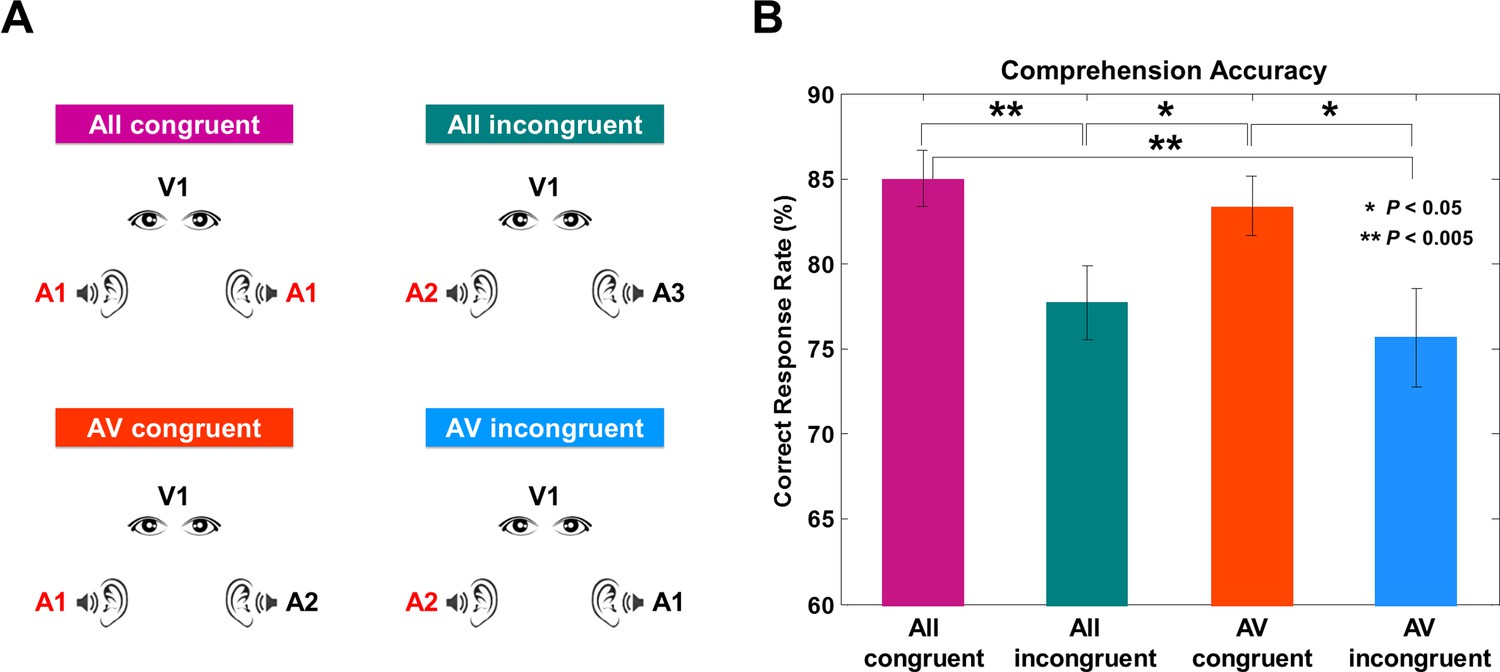
Experimental conditions and behavioral results.
(A) Four experimental conditions. ‘A’ denotes auditory stimulus and ‘V’ denotes visual stimulus.The number refers to the identity of each talk. All congruent condition: Natural audiovisual speech condition where auditory stimuli to both ears and visual stimuli are congruent (from the same movie; A1, A1, V1). All incongruent condition: All three stimuli are from different movies (A2, A3, V4) and participants are instructed to attend to auditory information presented to one ear. AV congruent condition: Auditory stimulus presented to one ear matches the visual information (A5, A6, V5). Participants attend to the talk that matches visual information. AV incongruent condition: Auditory stimulus presented to one ear matches the visual information (A7, A8, V8). Participants attend to the talk that does not match the visual information. Attended stimulus is marked as red color for the group attended to the left side (see Materials and methods for details). (B) Behavioral accuracy by comprehension questionnaires. Congruent conditions show high accuracy rate compared to incongruent conditions (%; mean ± s.e.m.): All congruent: 85 ± 1.66, All incongruent: 77.73 ± 2.15, AV congruent: 83.40 ± 1.73, AV incongruent: 75.68 ± 2.88). Statistics between conditions show significant difference only between congruent and incongruent conditions (paired t-test, df: 43, p<0.05).
Figure 2 with 3 supplements
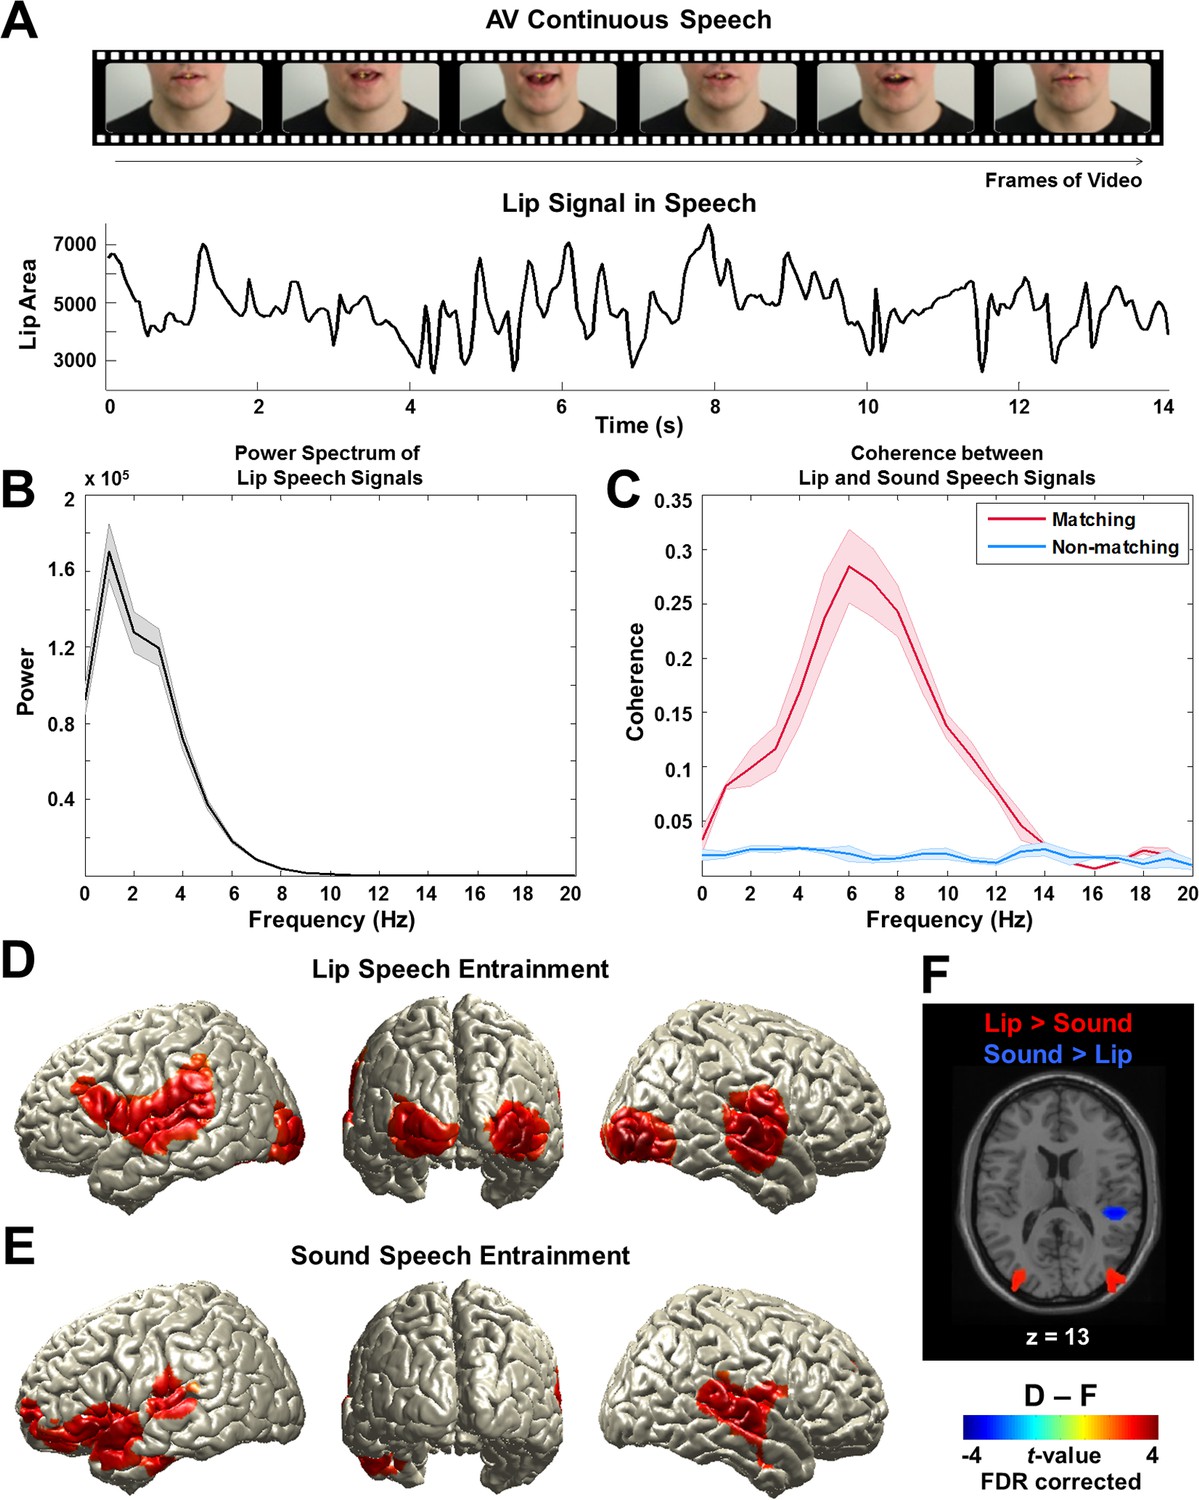
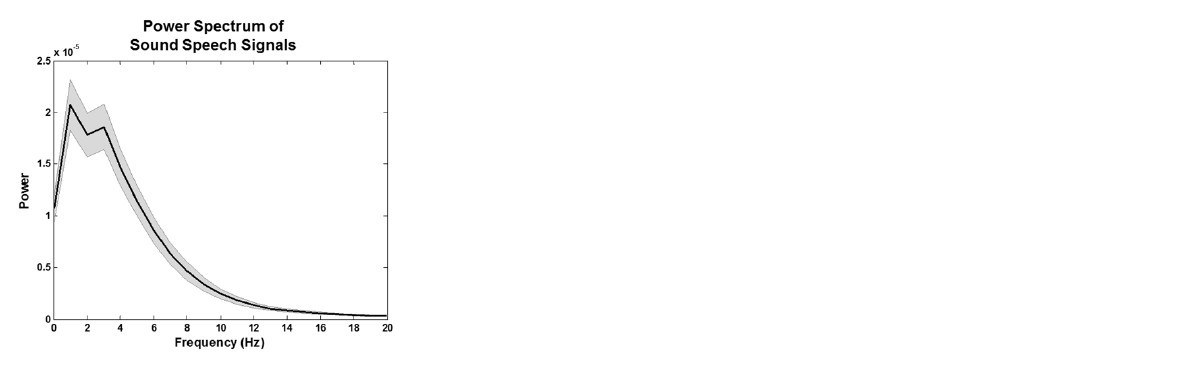
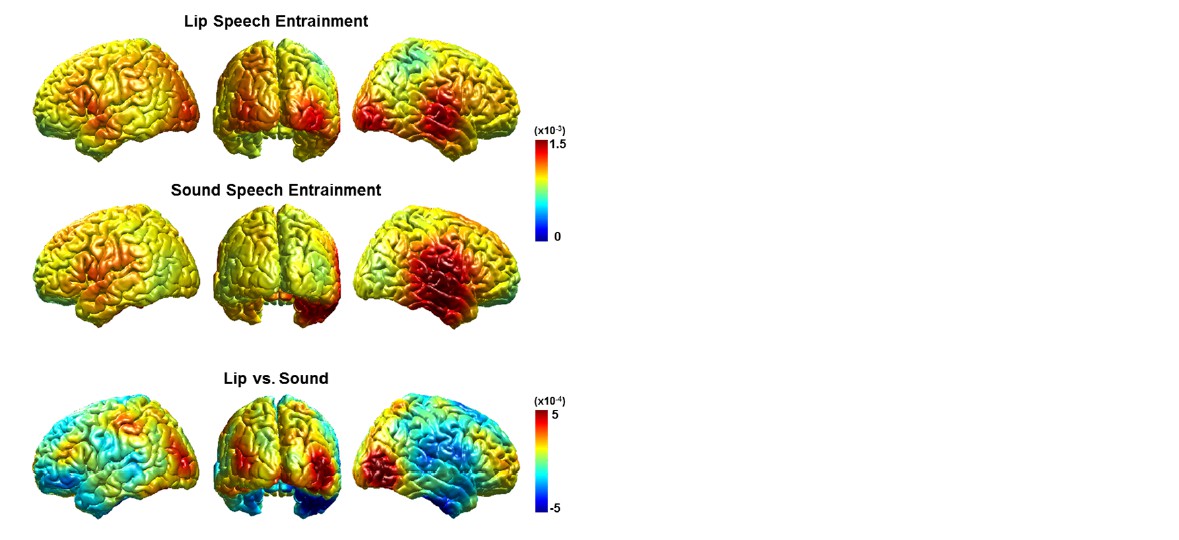
Lip signals in continuous speech and its entrainment in the brain.
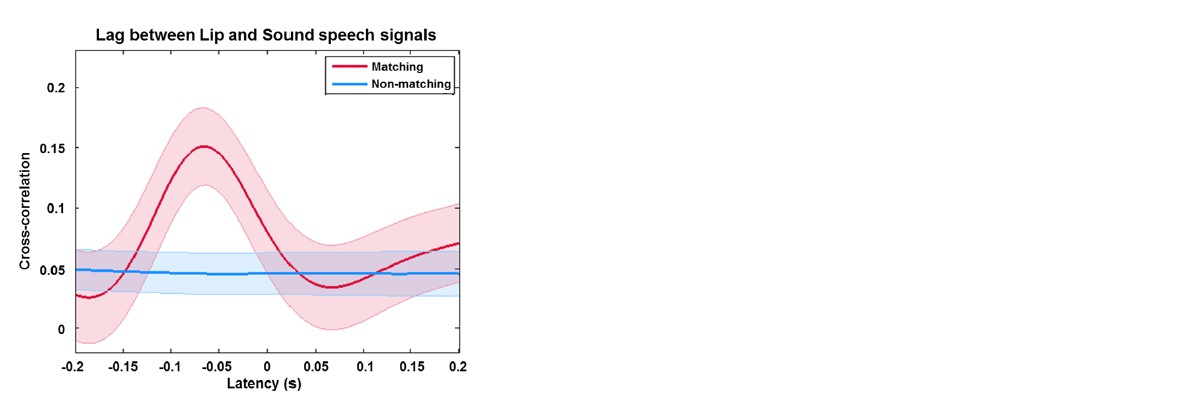
(A) Lip signals in the continuous audiovisual speech.Lip contour was extracted for each video frame and corresponding area was computed (see Figure 2—figure supplement 1A,B,C for details). One representative lip speech signal (for around 14 s speech) is shown here. Speaker’s face is cropped for this publication only but not in the original stimuli. (B) Spectral profile of lip speech signals. The power spectra of lip speech signals used in this study were averaged (mean ± s.e.m.). Signal is dominated by low-frequency components from 0 to 7 Hz that robustly peak around 0 to 4 Hz corresponding to delta and theta band neuronal oscillations in the brain. (C) Coupling between lip and sound speech signals by coherence. Coherence between matching (red line) and non-matching (blue line) lip and sound speech signals were computed and averaged across talks used in the study (mean ± s.e.m.). (D) Lip speech entrainment in natural audiovisual speech (All congruent condition). Coherence was computed between lip speech signal and brain activity at each voxel and then statistically compared to surrogate data at 1 Hz (the dominant frequency in the power spectrum in (b); p<0.05, FDR corrected). (E) Sound speech entrainment in natural audiovisual speech (All congruent condition). Using sound speech envelope, the same computation described in (D) was performed to investigate sound speech entrainment effect (p<0.05, FDR corrected). (F) Lip speech- and sound speech-specific entrainment effects. Lip speech (D) and sound speech coherence (E) were statistically compared (p<0.05, FDR corrected).
Figure 2—figure supplement 1
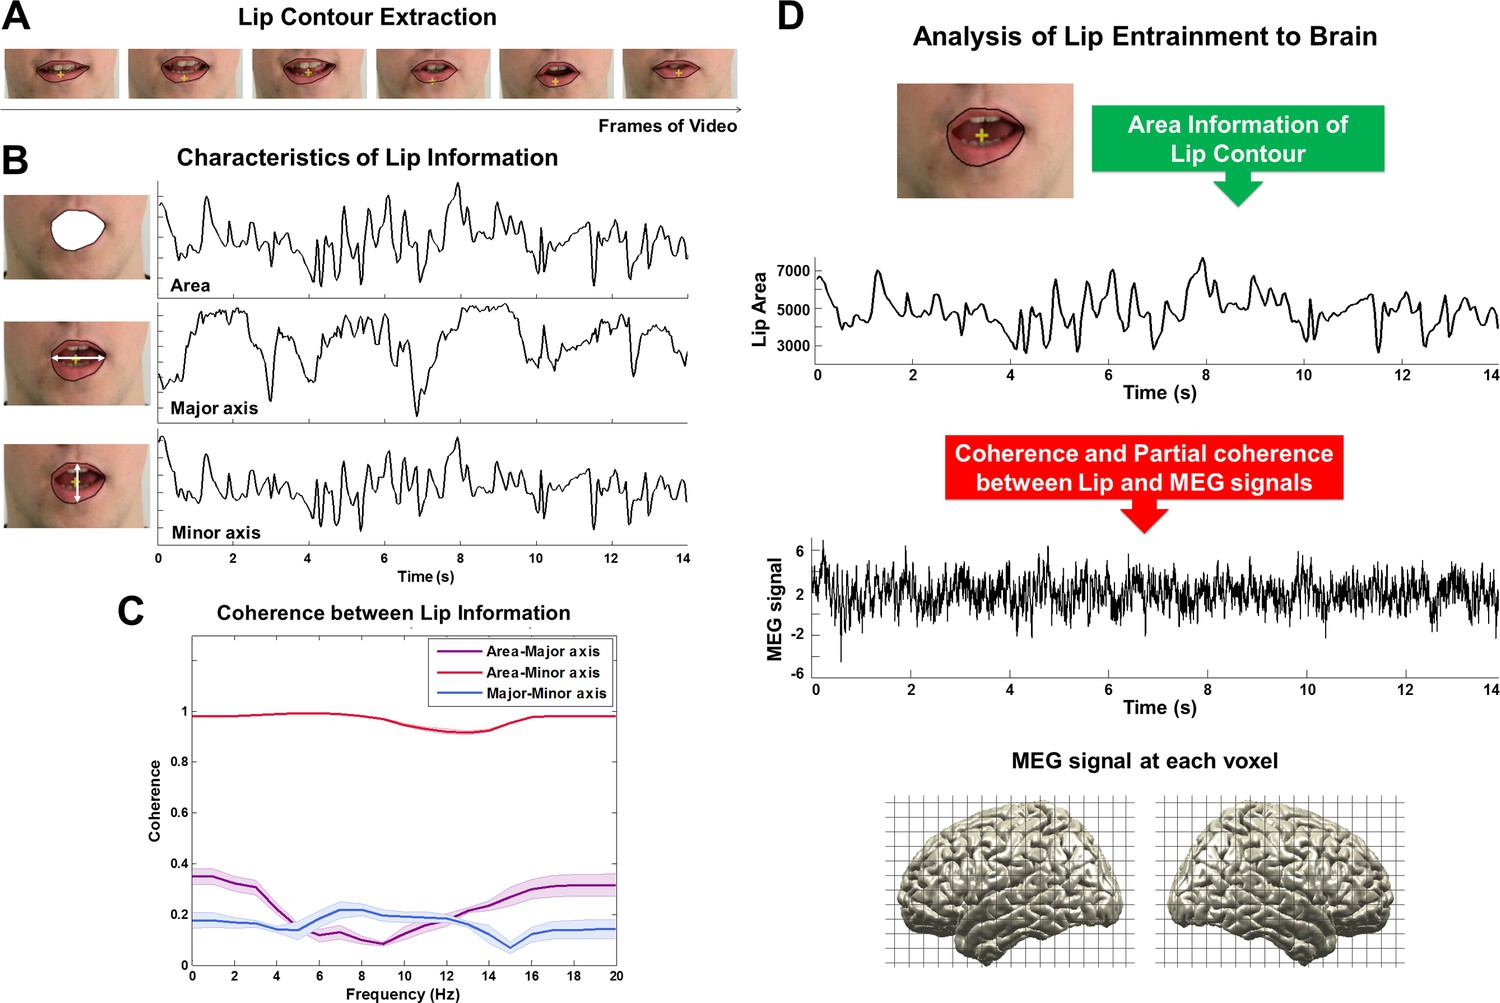
A schematic figure for the analysis of coupling between lip movements and brain activity.
We extracted lip movement signals by automatically computing for each video frame the lip contour using our in-house MATLAB script (A). The contour was converted into the three quantities area, major axis and minor axis (B). We then computed the coherence between these measures (C). Area and minor axis (representing vertical lip movement) information have almost identical information approaching 1.0 in coherence value (red line; mean ± s.e.m.). However, major axis information representing horizontal lip movement only does not show similar pattern with either area or minor axis (purple and blue lines; mean ± s.e.m.). Since area information represents both horizontal and vertical lip movement, we used this information for further analysis. We then computed coherence between lip area signals and MEG signals at each voxel for each frequency band and for all four experimental conditions (D; see Materials and methods).
Figure 2—figure supplement 2
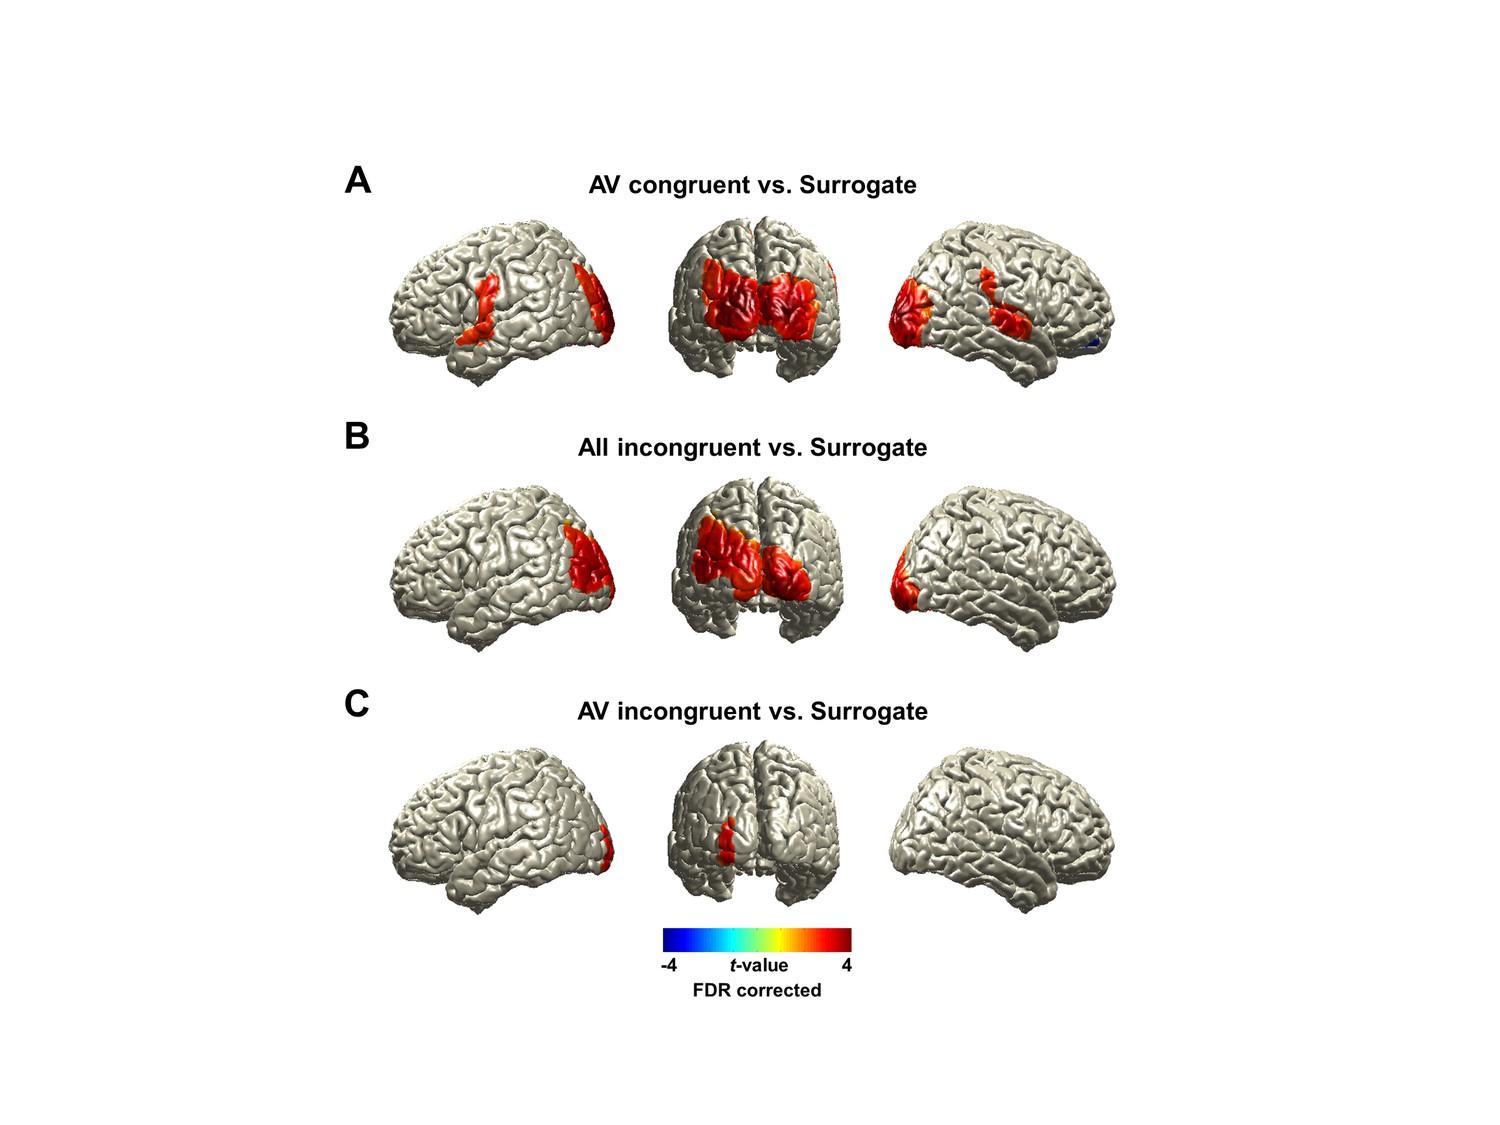
Brain activity entrained by lip movements.
We show lip-entrained brain activity by coherence in natural audiovisual speech condition (All congruent) at 1 Hz (dominant frequency component in lip signals) in Figure 2D. Here we show the same effect for other experimental conditions compared to surrogate data. (A) AV congruent: Lip entrainment in the AV congruent condition showed similar pattern to All congruent condition (Figure 2D). Distributed bilateral visual areas, auditory areas, left pre/postcentral gyri and right postcentral, supramarginal gyri were observed (p<0.05, FDR corrected). (B) All incongruent: Lip entrainment in this condition revealed increased involvement of bilateral visual cortex. This result confirms that there is clear lip entrainment effect irrespective of sound speech entrainment since this shows robust visual entrainment in the absence of a congruent sound speech input in All incongruent condition (p<0.05, FDR corrected). (C) AV incongruent: Compared to the other conditions lip entrainment is evident but reduced. Even though there is a congruent sound speech input as in the AV congruent condition, this does not reveal lip entrainment effect as strong as in the AV congruent condition providing more evidence that lip entrainment is modulated by attention (p <0.05, FDR corrected).
Figure 2—figure supplement 3
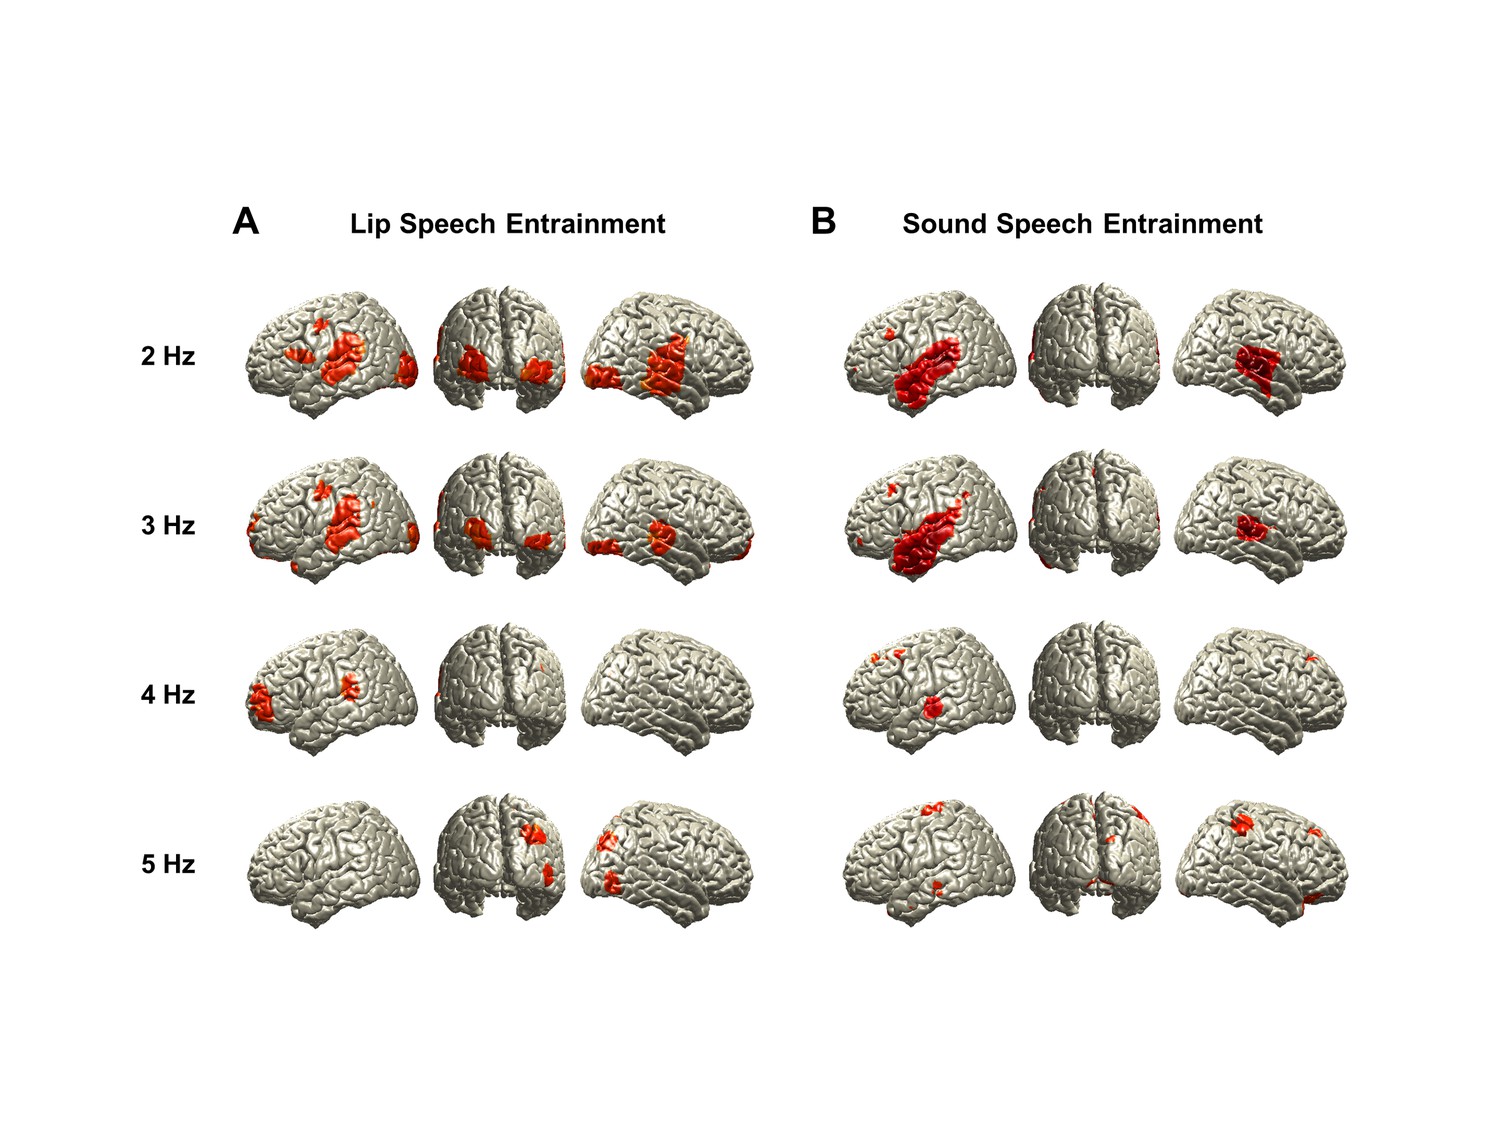
Brain activity entrained by lip movements and sound envelope.
We show entrained brain activity by coherence separately for lip movements (A) and sound speech envelope (B) at each frequency from 2 to 5 Hz for All congruent condition in addition to 1 Hz shown in Figure 2D and E.
Figure 3 with 2 supplements
Lip-brain partial coherence.
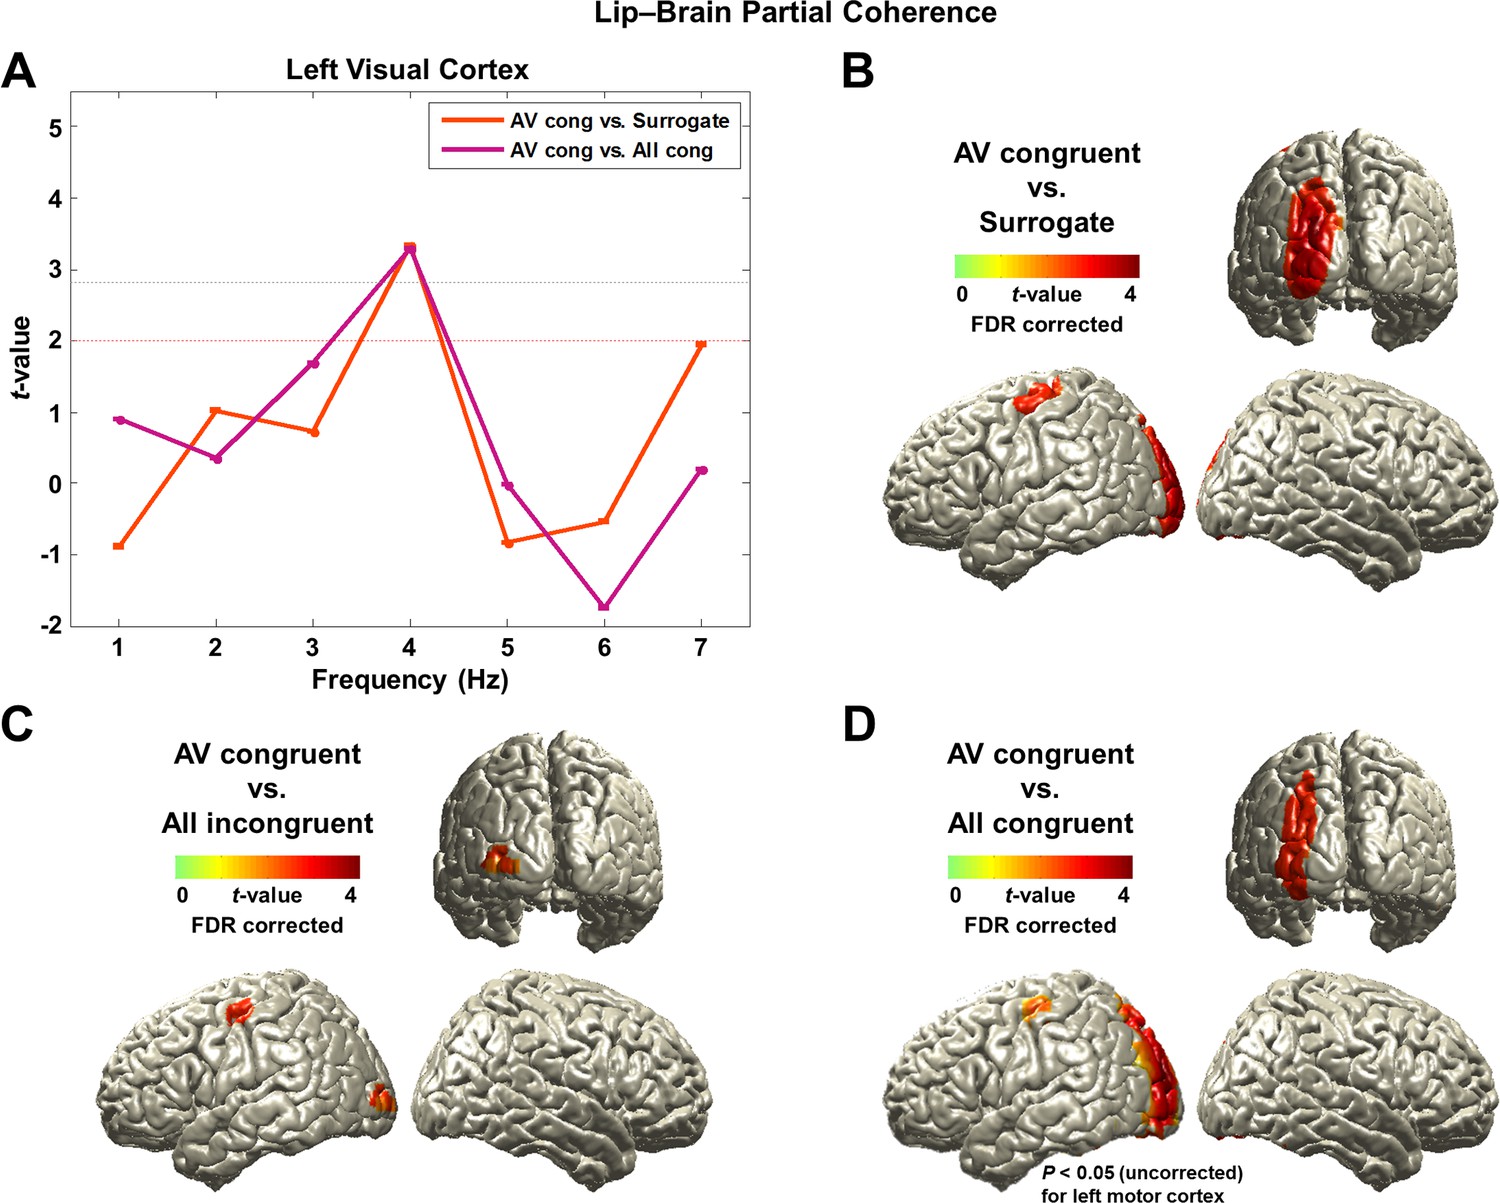
(A) Modulation of partial lip-brain coherence by attention and congruence in visual ROI.AV congruent condition was compared to the other conditions (paired t-test, df: 43, red dashed line: p<0.05, gray dashed line: p<0.05, corrected). (B, C, D) Attention-modulated partial coherence at each brain voxel (AV congruent versus surrogate (B), All incongruent (C), All congruent (D)). It shows significant involvement of left motor cortex (precentral gyrus; BA 4/6) and left visual areas (p<0.05, FDR corrected; but in (D), left motor cortex is observed at uncorrected p<0.05). Entrainment in the left motor cortex shows a systematic modulation such that statistical contrast with a strong difference in visual attention show stronger entrainment (AV congruent versus surrogate (B; t43-value: 3.42) > All incongruent (C; t43-value: 3.20) > All congruent (D; t43-value: 2.24)).
Figure 3—figure supplement 1
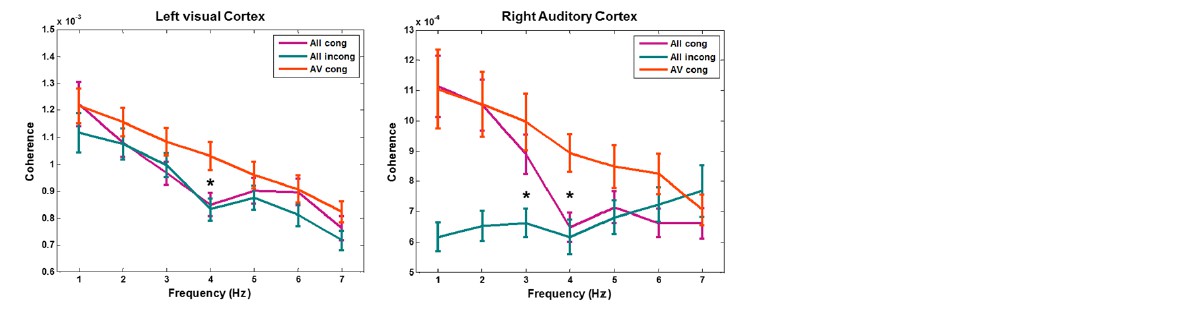
Lip-brain coherence.
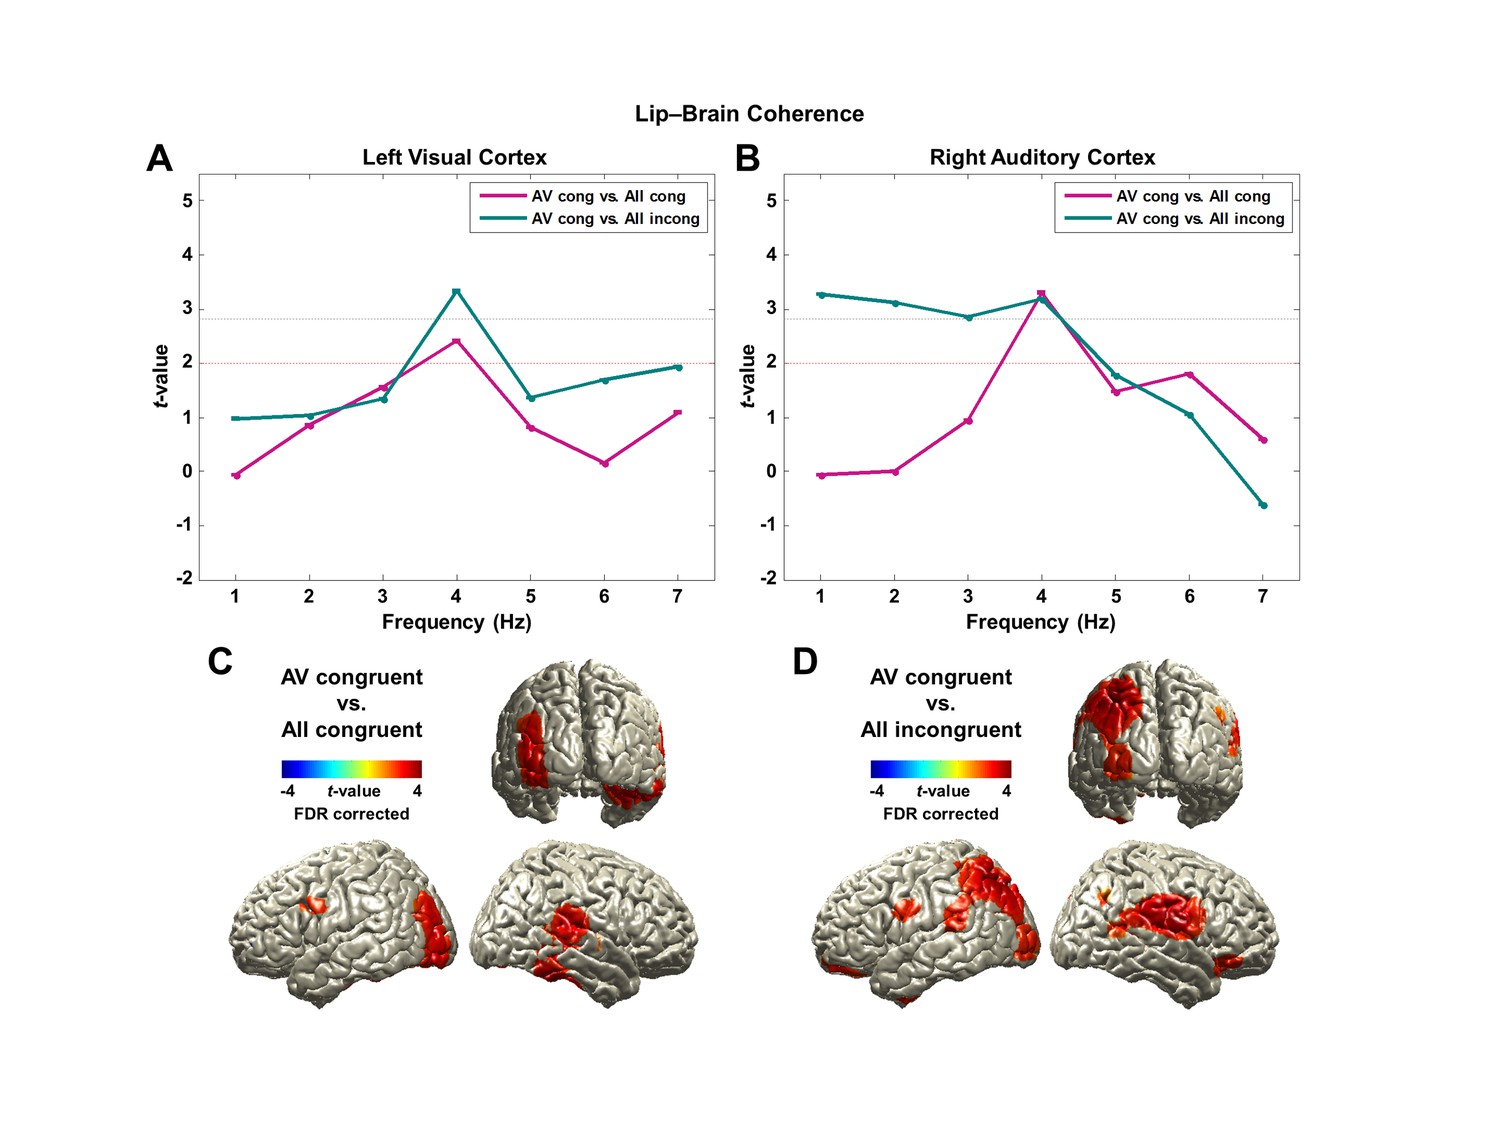
(A, B) Modulation of lip entrainment by attention and congruence in ROIs.Contrasting AV congruent with All congruent for the effect of attention and with All incongruent for the effect of congruence are shown in left visual (superior/middle/inferior occipital gyri) and right auditory (Heschl’s gyrus) areas defined by AAL ROI maps (paired t-test, df: 43, red dashed line: p<0.05, gray dashed line: p<0.05, corrected) at each frequency from 1 to 7 Hz. The strongest difference was observed at 4 Hz for both contrasts in both areas.(C, D) Spatial distribution of lip entrainment modulation by attention and congruence at 4 Hz (p<0.05, FDR corrected). Significant effects are observed in left visual areas, right superior and middle temporal gyri including Heschl’s gyrus, posterior superior temporal sulcus (pSTS), left precentral gyrus and right inferior frontal gyrus (IFG; BA 44/6).
Figure 3—figure supplement 2
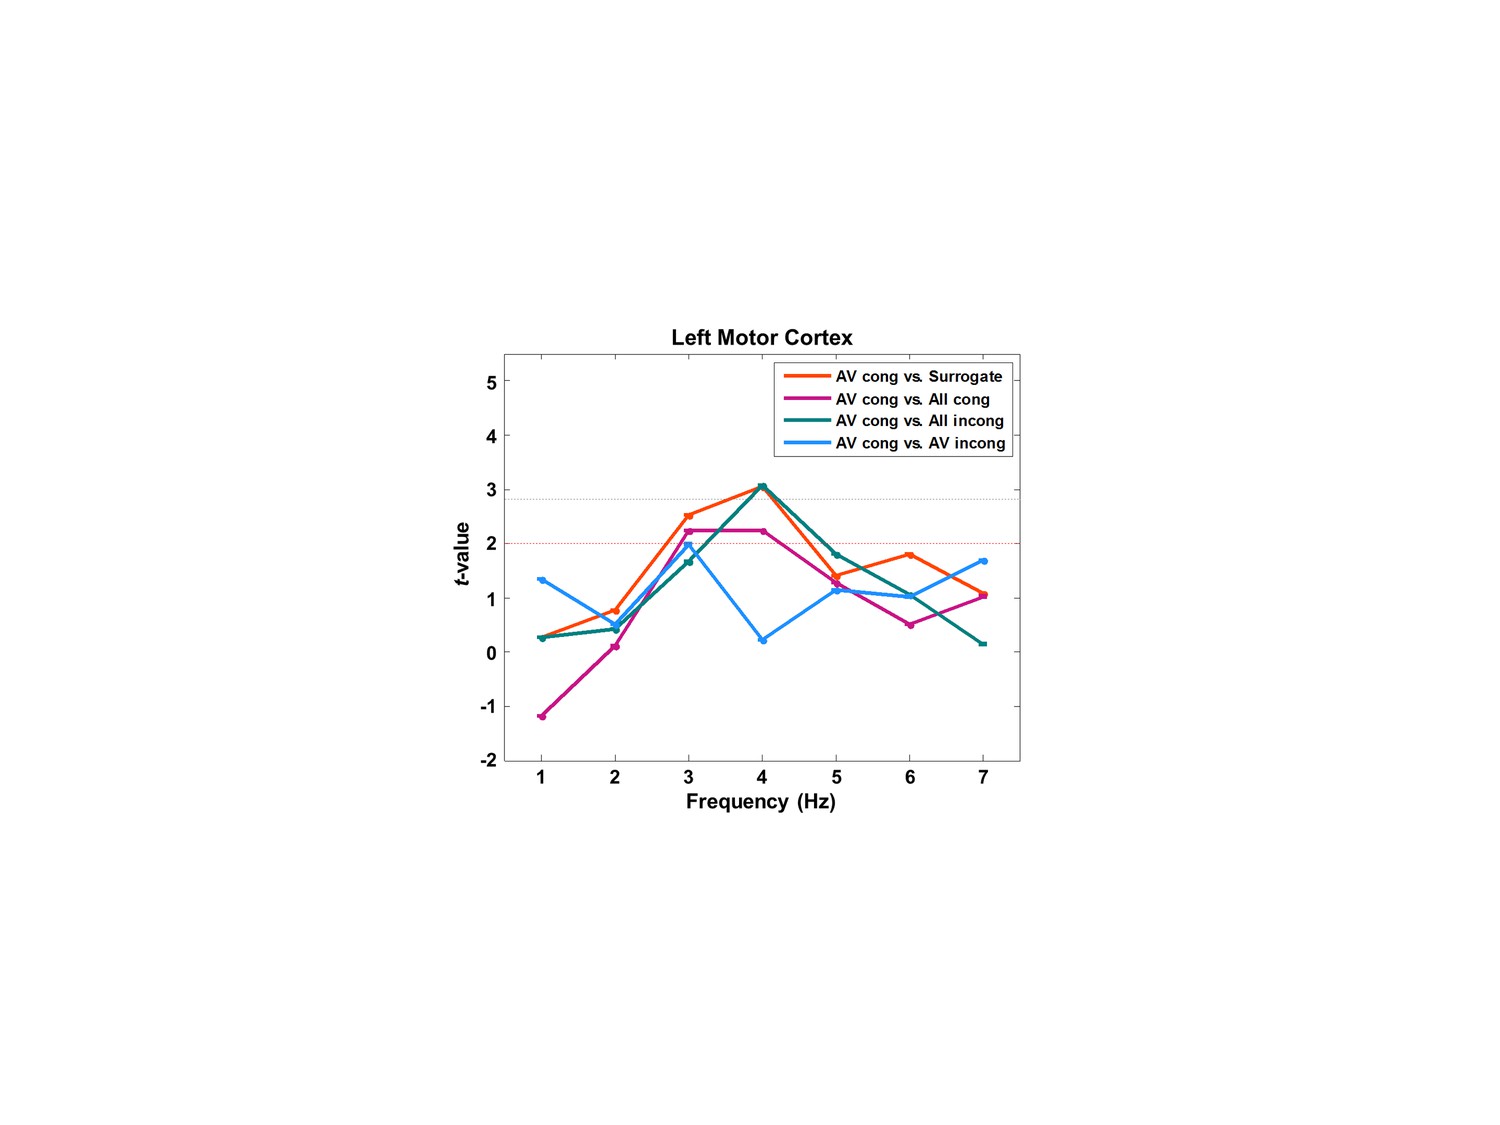
Partial coherence between lip movements and left motor cortex.
We here show a frequency-specific plot for partial coherence between lip movements and left motor cortex.We extracted the maximum voxel in the left motor cortex (precentral gyrus) from the contrast for attention effect (AV congruent vs. All congruent shown in Figure 3D; MNI coordinates = [-44 -16 56]). This confirmed lip movements entrain left motor cortex at 4 Hz irrespective of auditory speech signals.
Figure 4
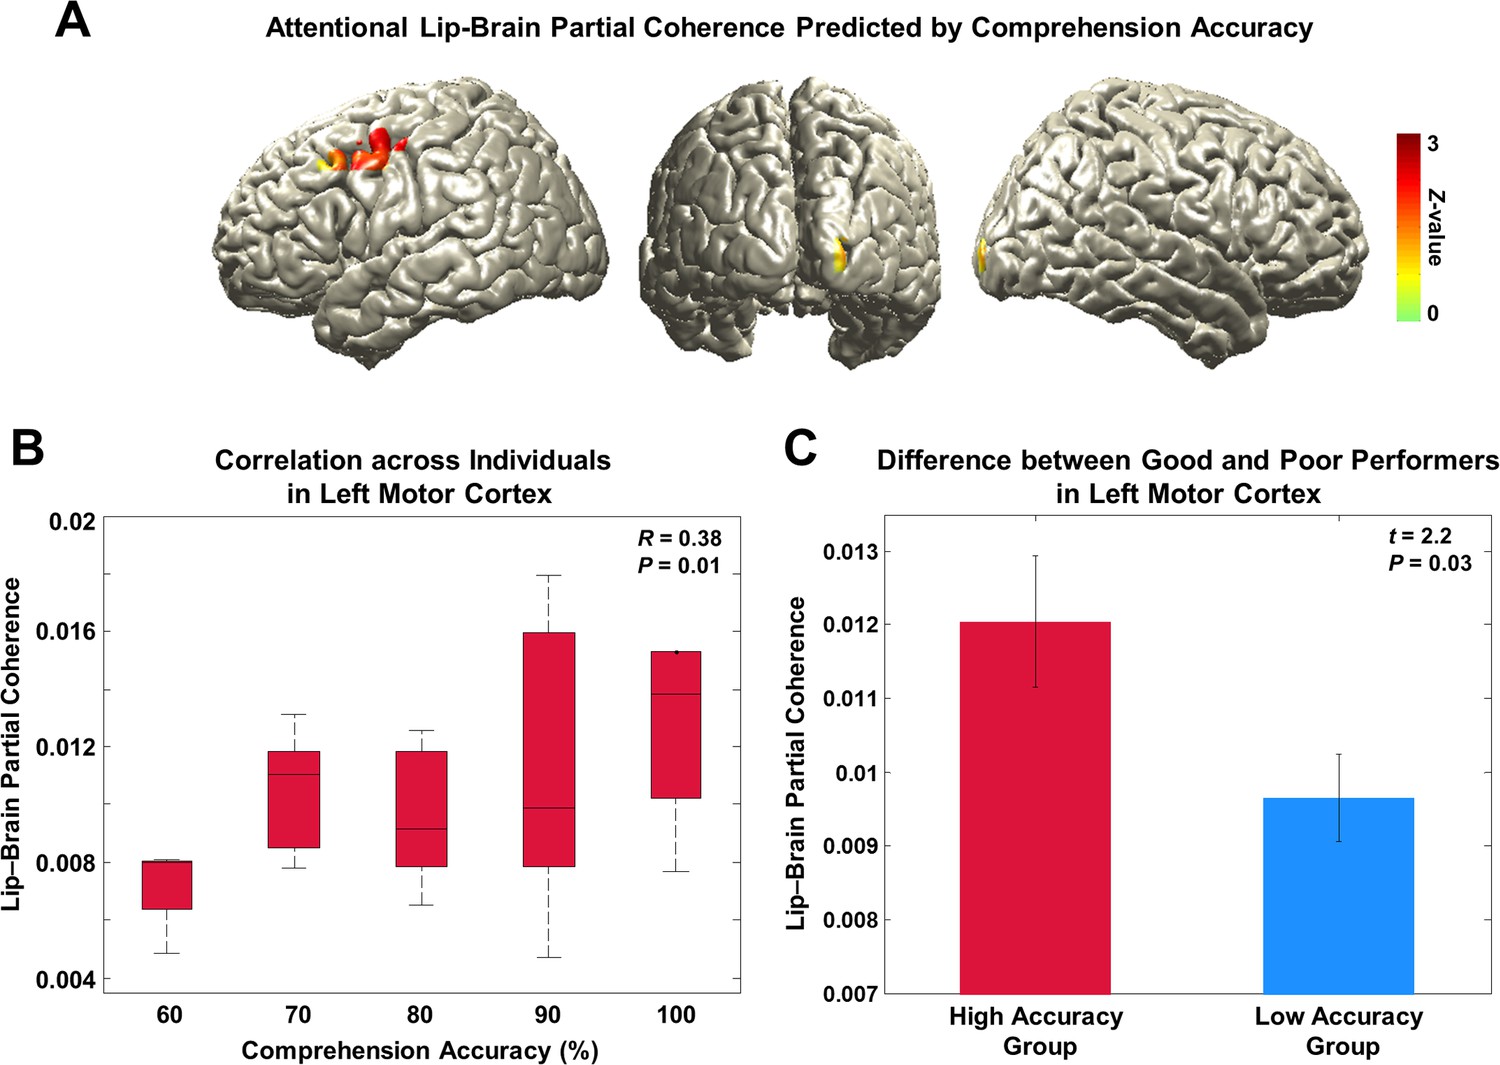
Behavioral correlates of attentional lip entrainment.
(A) Lip-entrained brain regions predicted by attention-modulated comprehension accuracy.Regression analysis using comprehension accuracy across participants on the partial coherence map was performed at 4 Hz in each condition. Then Z-difference map was obtained from the regression analysis of conditions showing strongest difference in comprehension accuracy (AV congruent versus AV incongruent; see behavioral results in Figure 1B). This revealed that the left motor cortex entrainment predicts attention-modulated comprehension accuracy (Z-difference map at p<0.005). (B) Correlation between partial coherence in left motor cortex and comprehension accuracy. Partial coherence values from the maximum coordinate in the left motor cortex and comprehension accuracy across subjects for the AV congruent condition was positively correlated (Pearson’s coefficient of Fisher’s Z-transformed data R = 0.38, P = 0.01; Spearman rank correlation R = 0.32, P = 0.03). (C) Difference of attentional lip-entrainment in left motor cortex between good and poor performing group. Group t-statistics between good and poor performing group on the extracted partial coherence values in the left motor cortex for the AV congruent condition was performed. The two groups were divided using median value (90%; 23 good versus 21 poor performers) of comprehension accuracy for the AV congruent condition. Good performers showed higher partial coherence value in left motor cortex than poor performers (two-sample t-test on Fisher’s Z-transformed data; t42 = 2.2, P = 0.03).
Author response image 1
Author response image 2
Author response image 3
Author response image 4
Author response image 5
Download links
A two-part list of links to download the article, or parts of the article, in various formats.
Downloads (link to download the article as PDF)
Open citations (links to open the citations from this article in various online reference manager services)
Cite this article (links to download the citations from this article in formats compatible with various reference manager tools)
Lip movements entrain the observers’ low-frequency brain oscillations to facilitate speech intelligibility
eLife 5:e14521.
https://doi.org/10.7554/eLife.14521


