Astrocytes contribute to synapse elimination via type 2 inositol 1,4,5-trisphosphate receptor-dependent release of ATP
- Zhejiang University School of Medicine, China
Figures
Figure 1 with 4 supplements
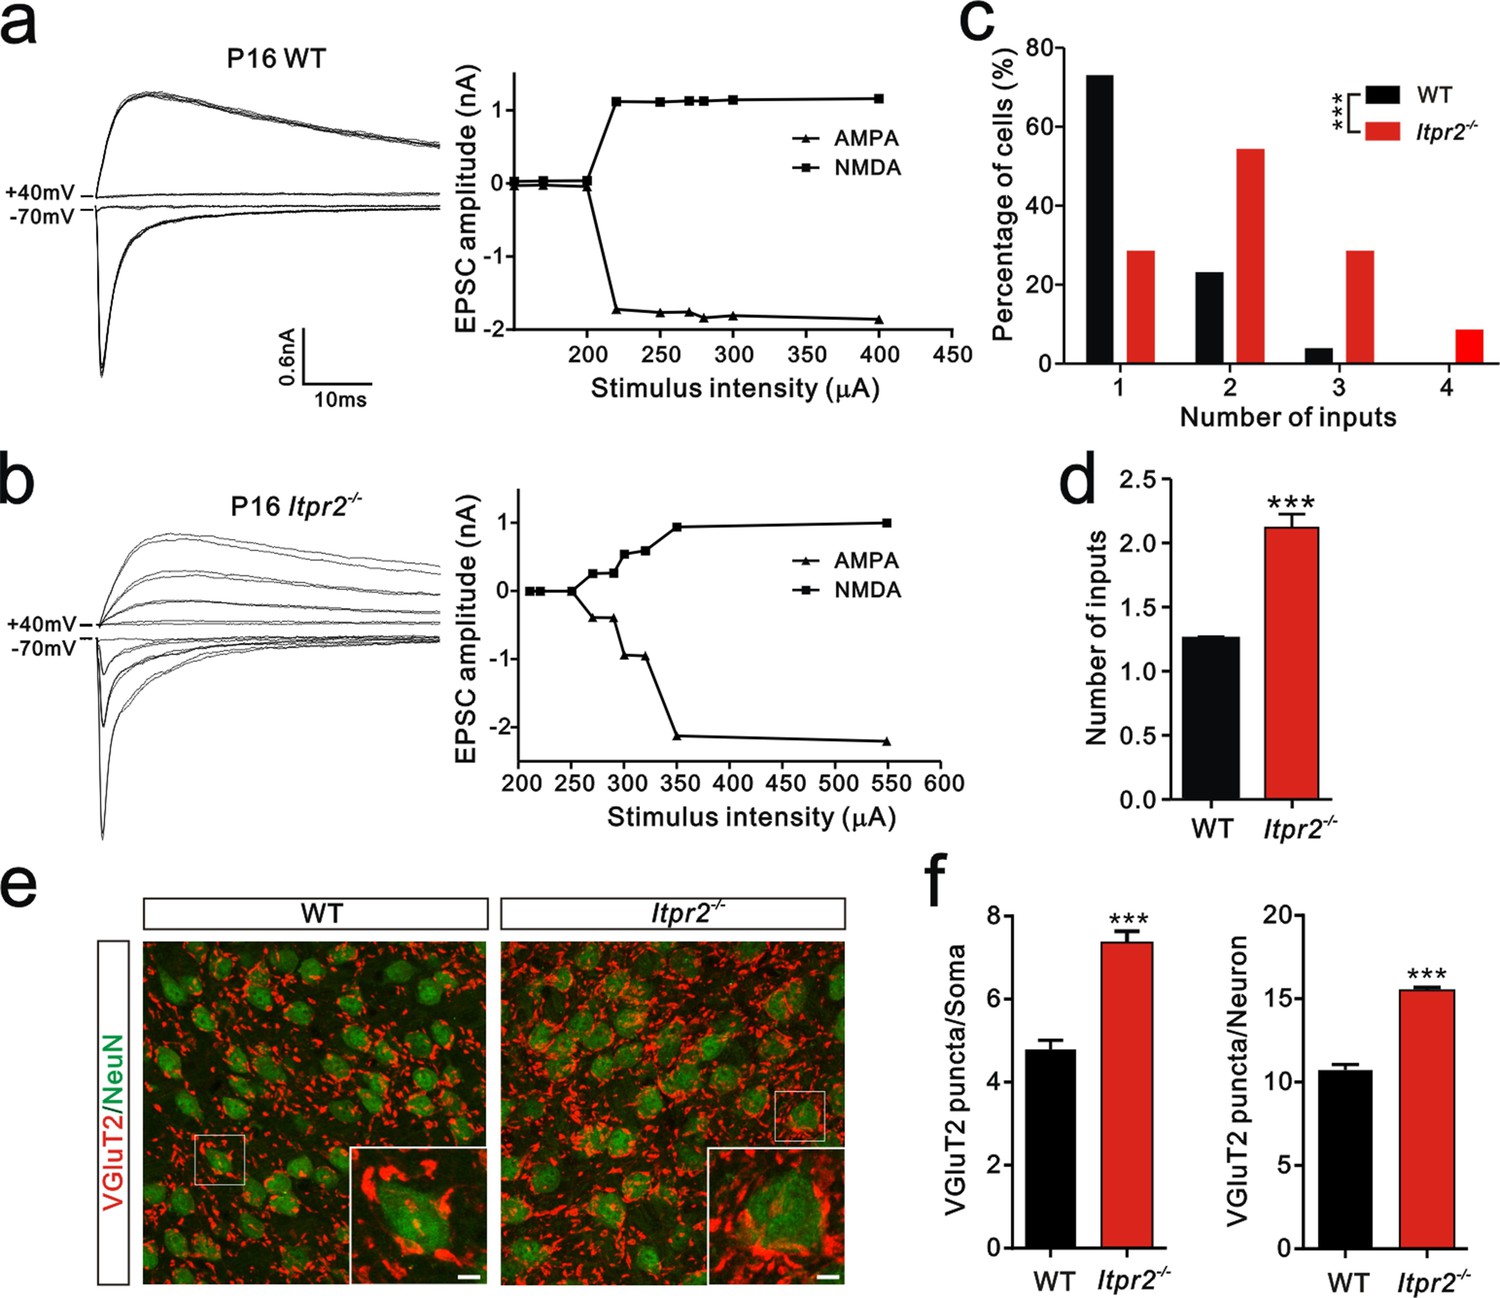
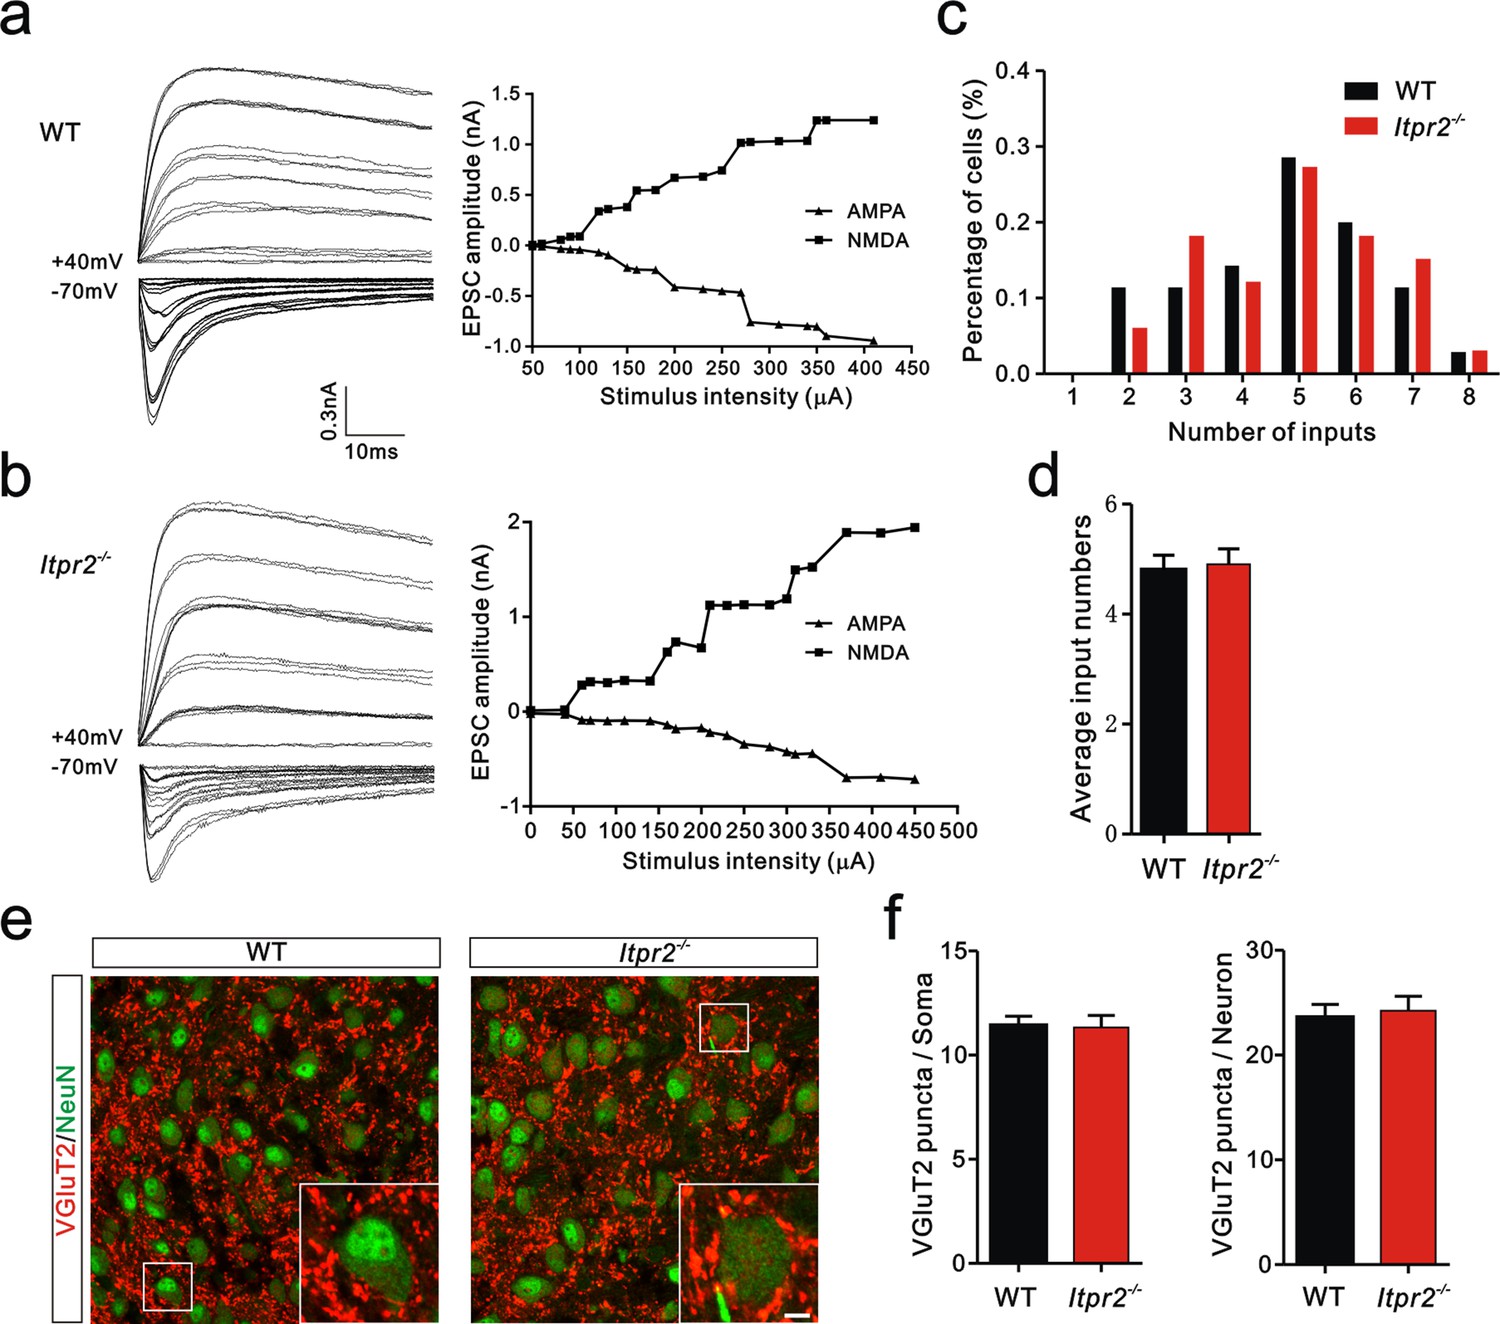
Developmental synapse elimination was impaired in Itpr2−/− mice at P16-17.
(a and b) Left panels, sample traces of membrane current in response to stimuli over a range of intensities in VPm neurons at P16-17 in WT (a) and Itpr2−/− mice (b). Currents recorded at +40 mV are mediated by NMDA receptors, and those at -70 mV are mediated by AMPA receptors. Right panels, peak current versus stimulus intensity for WT (a) and Itpr2−/− mice (b). (c) Distributions of the number of Pr5 axons innervating each VPm neuron during P16-17 in WT (n = 26 cells) and Itpr2−/− (n = 42 cells) mice. ***p<0.001, χ2 test. (d) Histogram of average number of inputs received by each VPm neuron at P16-17 in WT and Itpr2−/− mice. ***p<0.001, unpaired Student’s t test. Error bars indicate SEM. (e) Sample confocal images of immunostained neurons and Pr5 axonal terminals in the VPm at P16. Neurons were labeled by the NeuN antibody (green), and Pr5 axon terminals were labeled by the VGluT2 antibody (red). Inset is higher-magnification of the boxed area. Scale bar, 5 µm. (f) Quantification of VGluT2 puncta/soma (left, n = 40 cells/group) and VGluT2 puncta/neuron (right, n = 12 sections from 4 mice/group) for WT and Itpr2−/− mice. ***p<0.001, unpaired Student’s t test. Error bars indicate SEM.
Figure 1—figure supplement 1
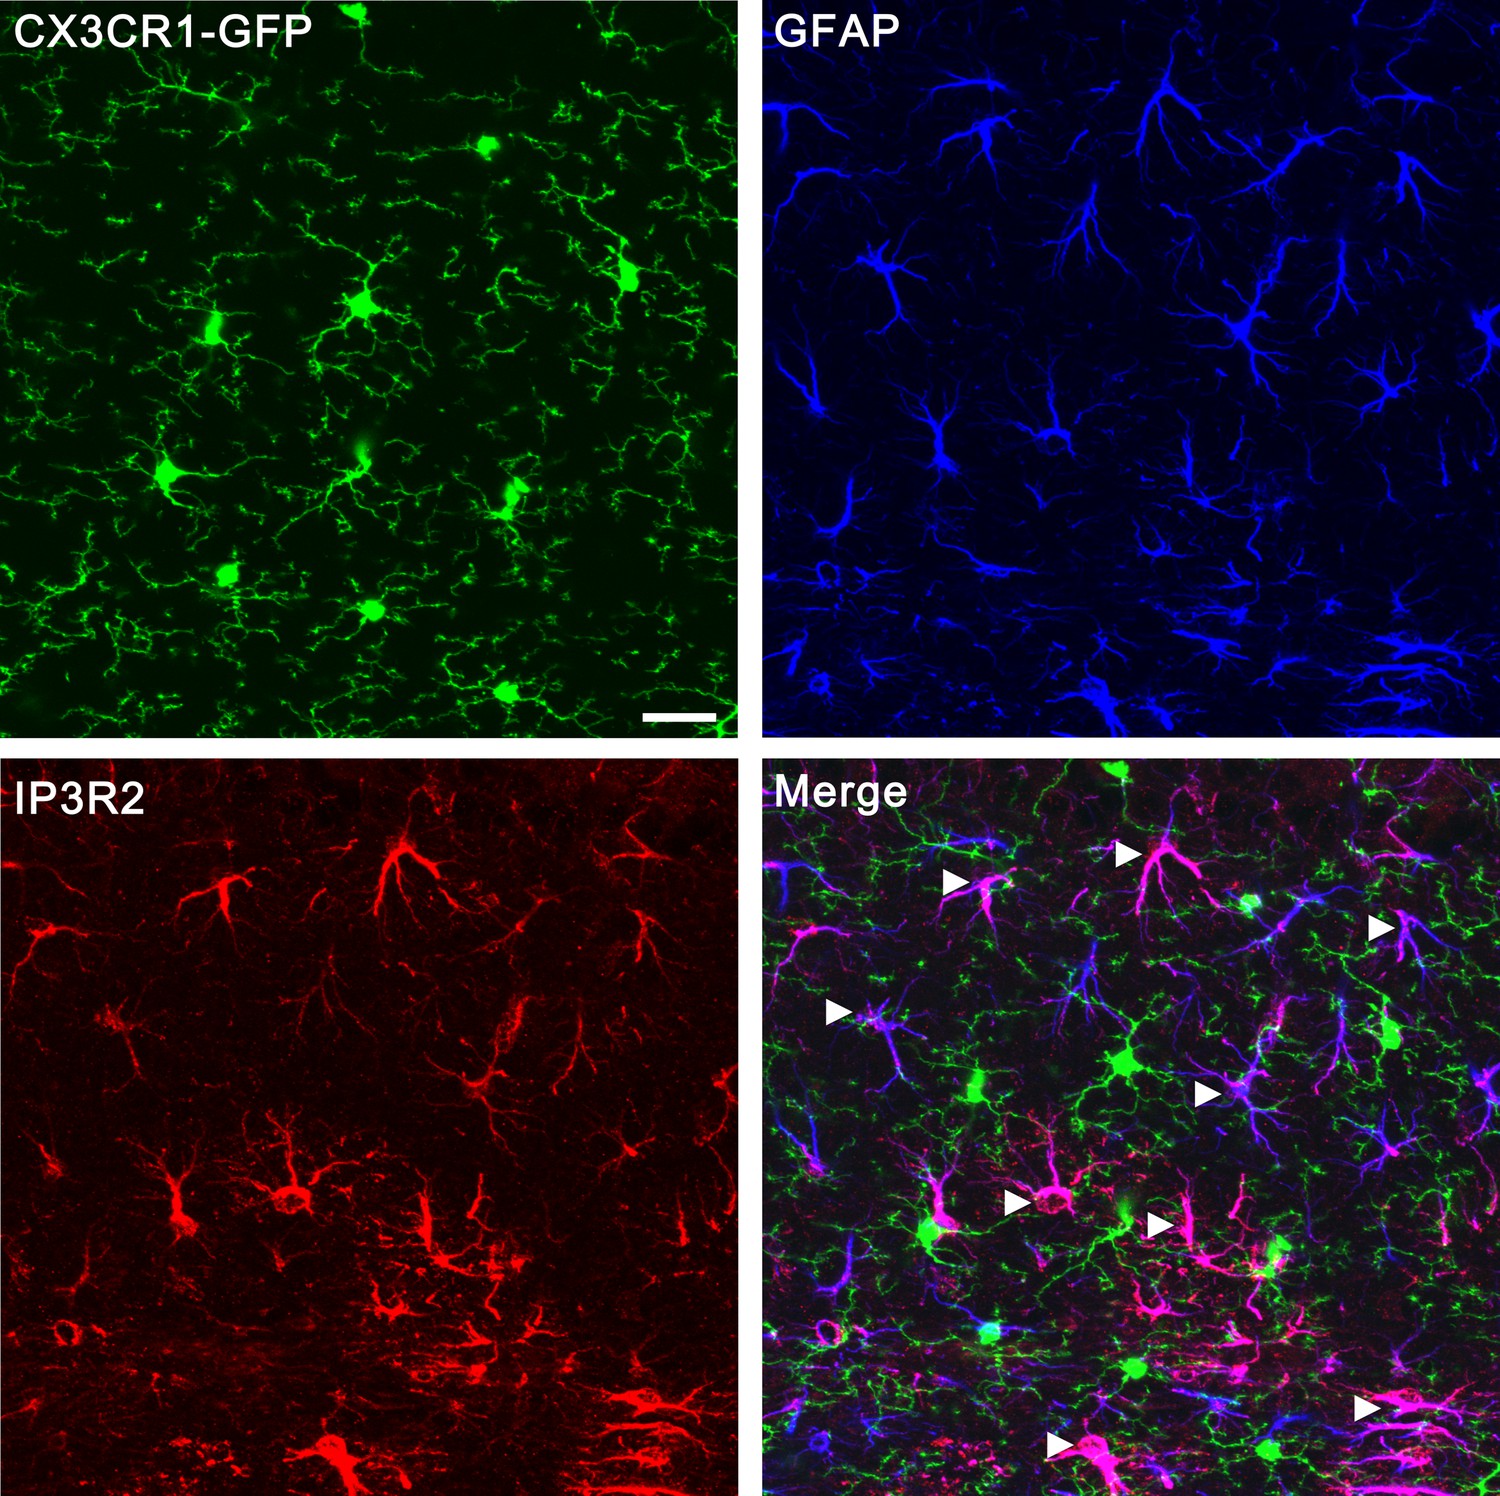
Confocal images showing that IP3R2 was specifically expressed in GFAP-positive astrocytes but not GFP-positive microglia.
Microglias were visualized using transgenic mice in which all microglia express GFP (green) under the control of the CX3CR1 promoter. Astrocytes were labeled by the specific marker GFAP (blue). IP3R2 was co-localized with GFAP-positive astrocytes (arrowheads) but not GFP- positive microglia (arrows). Scale bar, 20 µm. Images were obtained from hippocampus but not the VPm because the same antibodies (Santa cruz, sc-7278; Millipore, AB3000) that worked for hippocampus did not work for VPm.
Figure 1—figure supplement 2
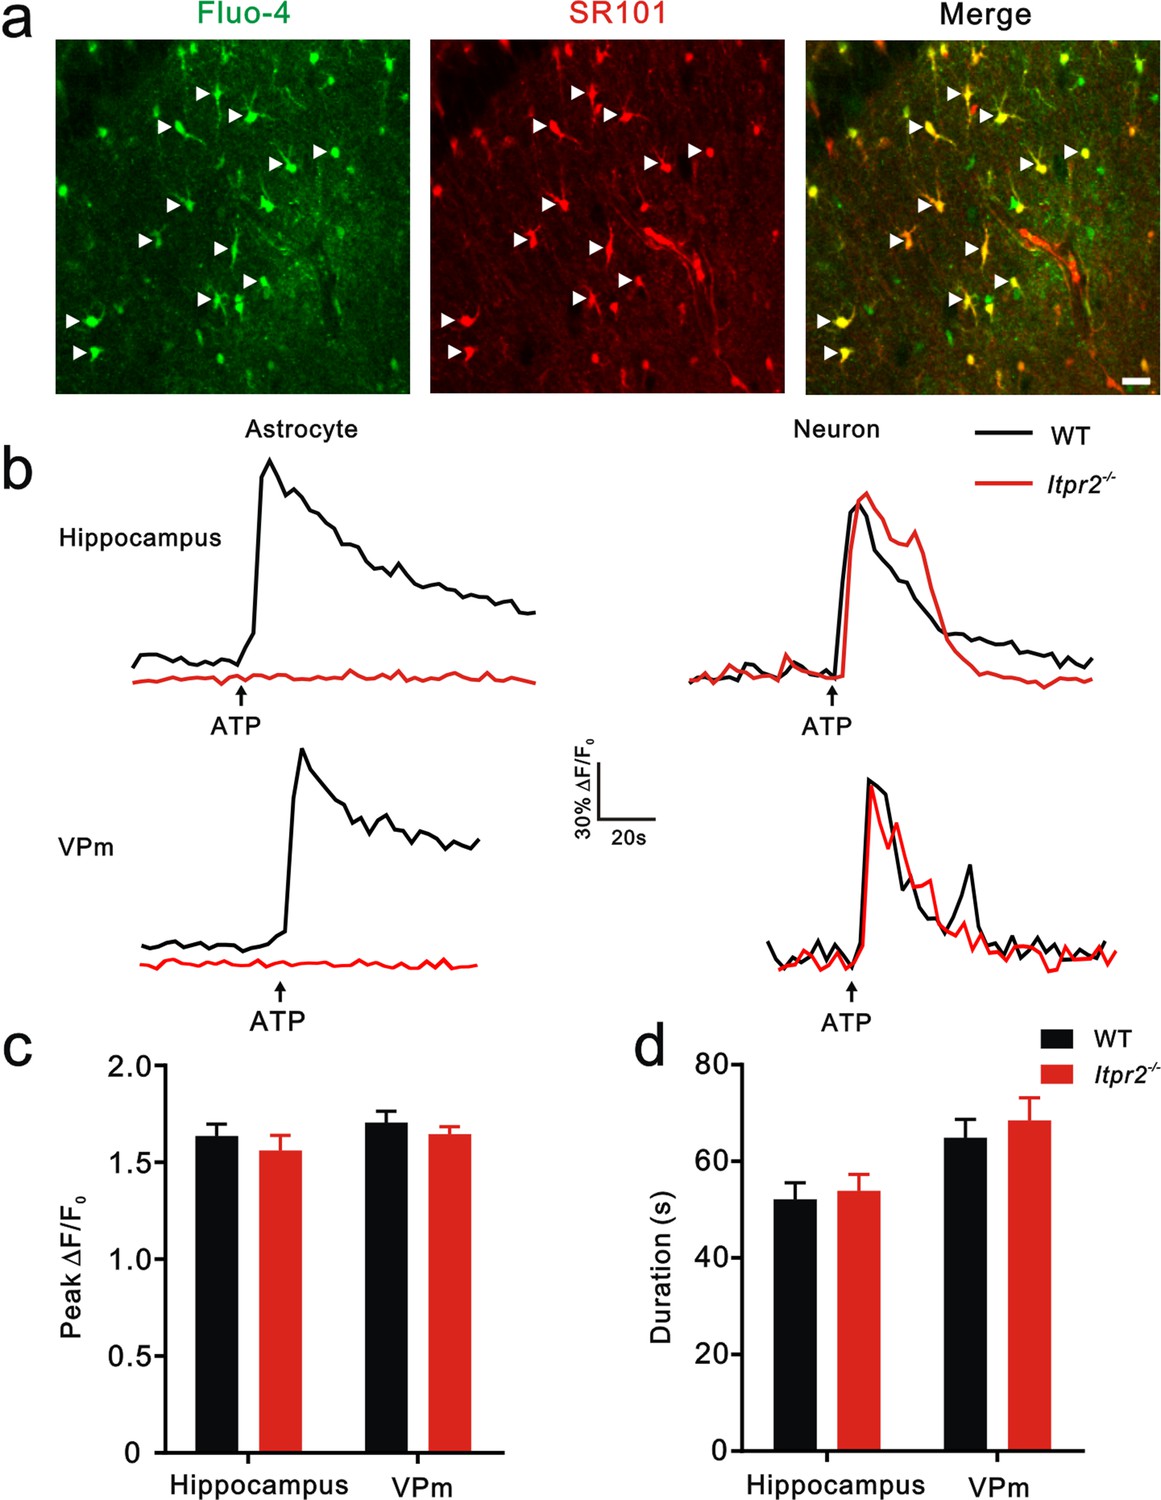
Knocking out IP3R2 specifically disturbed [Ca2+]i elevation in astrocytes in both of hippocampus and the VPm.
(a) Confocal images showing astrocytes loaded with the Ca2+ indicator Fluo-4 AM and labeled with sulforhodamine 101 (SR101) in hippocampal CA1. Merged images showed that Fluo-4-loaded cells were mainly astrocytes (arrowheads). Scale bar, 20 µm. (b) Representative [Ca2+]i elevation in response to ATP (100 µM) in astrocytes (left) and neurons (right) of hippocampus (top) and the VPm (bottom) from WT (black line) and Itpr2−/− (red line) mice. Arrow indicates ATP perfusion. (c and d) The peak amplitude and duration of [Ca2+]i elevation in response to ATP stimulation in neurons did not differ between Itpr2−/− and WT mice. p>0.05, two-way ANOVA followed by Bonferroni post hoc test, n = 55 to 62 cellsper group. Error bars indicate SEM.
Figure 1—figure supplement 3
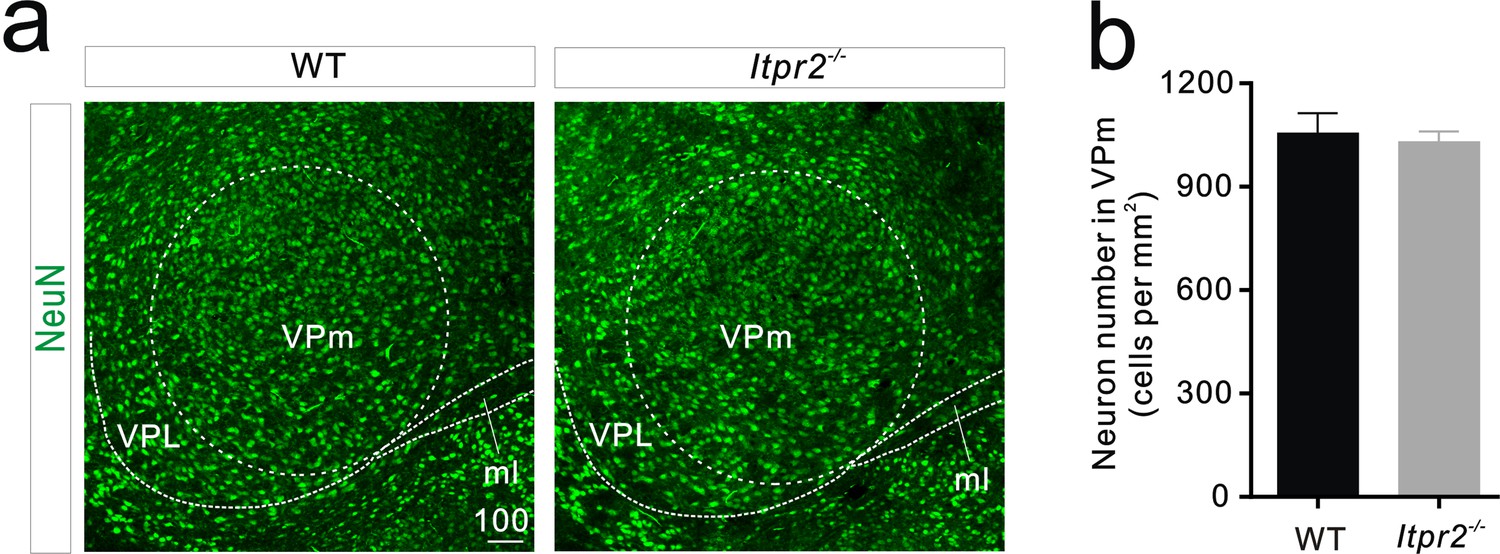
Neuron number does not change in the VPm between WT and Itpr2−/− mice.
(a) Representative confocal images of NeuN immunostaining in the VPm of WT and Itpr2−/− mice. Scale bar, 100 µM. ml, Medial lemniscus; VPL, ventral posterolateral thalamic nucleus. (b) Histogram summary data showing that the neuron number is not significantly different between WT and Itpr2−/− mice (WT = 1056 ± 56, n = 9 sections from 3 mice; Itpr2−/− = 1031 ± 29, n = 9 sections from 3 mice). p=0.7, unpaired Student’s t test. Error bars indicate SEM.
Figure 1—figure supplement 4
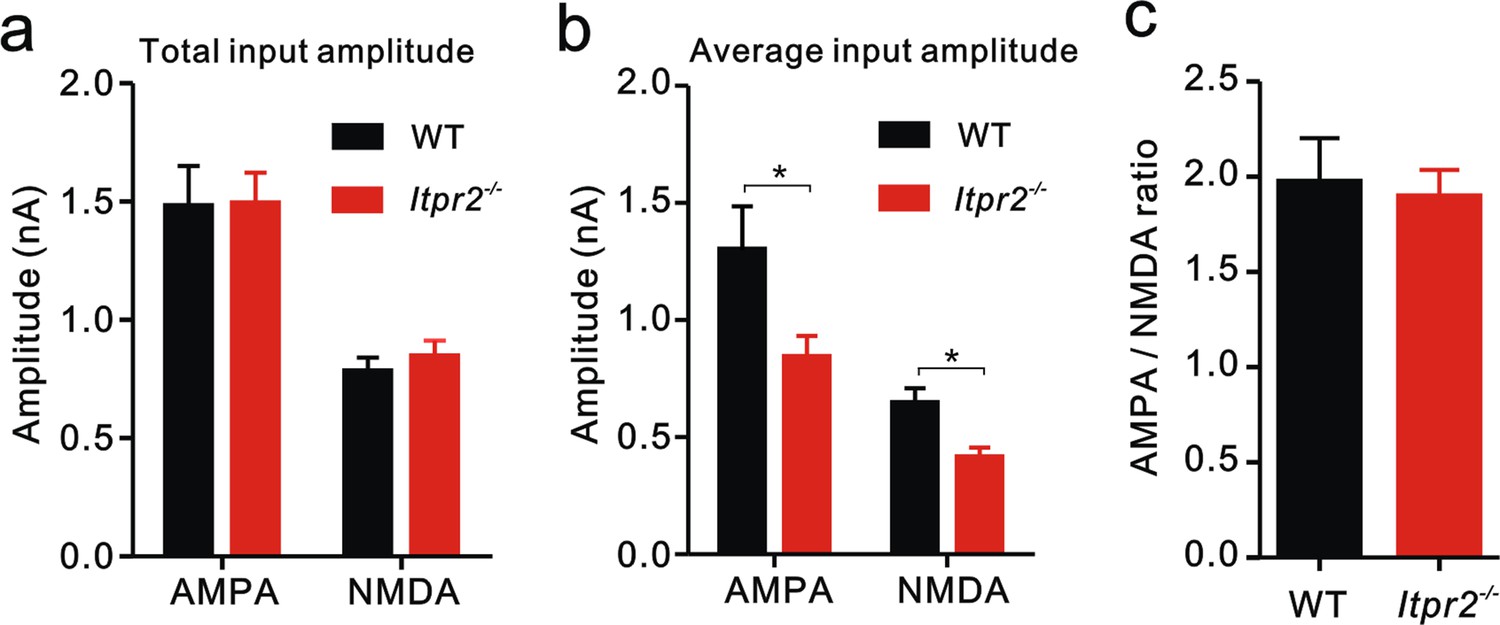
Synaptic properties are not altered in Itpr2−/− mice at P16-17.
(a) Total input amplitudes recorded from VPm relay neurons did not differ between WT and Itpr2−/− mice (AMPA: WT = 1.48 ± 0.17 nA, n = 20; Itpr2−/− = 1.49 ± 0.13 nA, n = 31; NMDA: WT = 0.78 ± 0.06 nA, n = 17; Itpr2−/− = 0.85 ± 0.07 nA, n = 31). p>0.05, two-way ANOVA. Error bars indicate SEM. (b) Average input amplitudes recorded from VPm relay neurons were dramatically decreased in Itpr2−/− mice (AMPA: WT = 1.30 ± 0.18 nA, n = 21; Itpr2−/− = 0.84 ± 0.09 nA, n = 37; NMDA: WT = 0.64 ± 0.07 nA, n = 17; Itpr2−/− = 0.41 ± 0.04 nA, n = 26). *p<0.05, two-way ANOVA. Error bars indicate SEM. (c) AMPAR-EPSC/NMDAR-EPSC ratio did not change in Itpr2−/− mice compared to WT mice (WT = 1.97 ± 0.23, n = 15; Itpr2−/− = 1.90 ± 0.14, n = 21). p=0.77, unpaired Student’s t test. Error bars indicate SEM.
Figure 2 with 1 supplement
Connectivity of Pr5-VPm pathway was comparable in WT and Itpr2−/− mice at P7.
(a and b) Left panels, sample traces showing membrane current in response to stimuli at a range of intensities in VPm neurons at P7 in WT (a) and Itpr2−/− (b) mice. Right panels, peak current versus stimulus intensity for WT (a) and Itpr2−/− mice (b). (c) Distributions of the number of Pr5 axons innervating each VPm neuron at P7 did not differ between WT (n = 33 cells) and Itpr2−/− (n = 35 cells) mice. p=0.78, χ2 test. (d) Histogram of average number of inputs received by each VPm neuron at P7 in WT and Itpr2−/− mice (WT = 4.8 ± 0.3, n = 33; Itpr2−/− = 4.9 ± 0.3, n = 33). p=0.74, unpaired Student’s t test. (e) Sample confocal images of immunostained neurons and Pr5 axonal terminals in the VPm at P7 in WT and Itpr2−/− mice. Neurons were visualized with the NeuN antibody (green), and Pr5 axonal terminals were labeled by the VGluT2 antibody (red). Inset is higher-magnification of the boxed area. Scale bar, 5 µm. (f) Quantification of VGluT2 puncta/soma (left, n = 24 cells/group,) and VGluT2 puncta/neuron (right, n = 9 sections from 3 mice/group) for WT and Itpr2−/− mice. p>0.05, unpaired Student’s t test. Error bars indicate SEM.
Figure 2—figure supplement 1
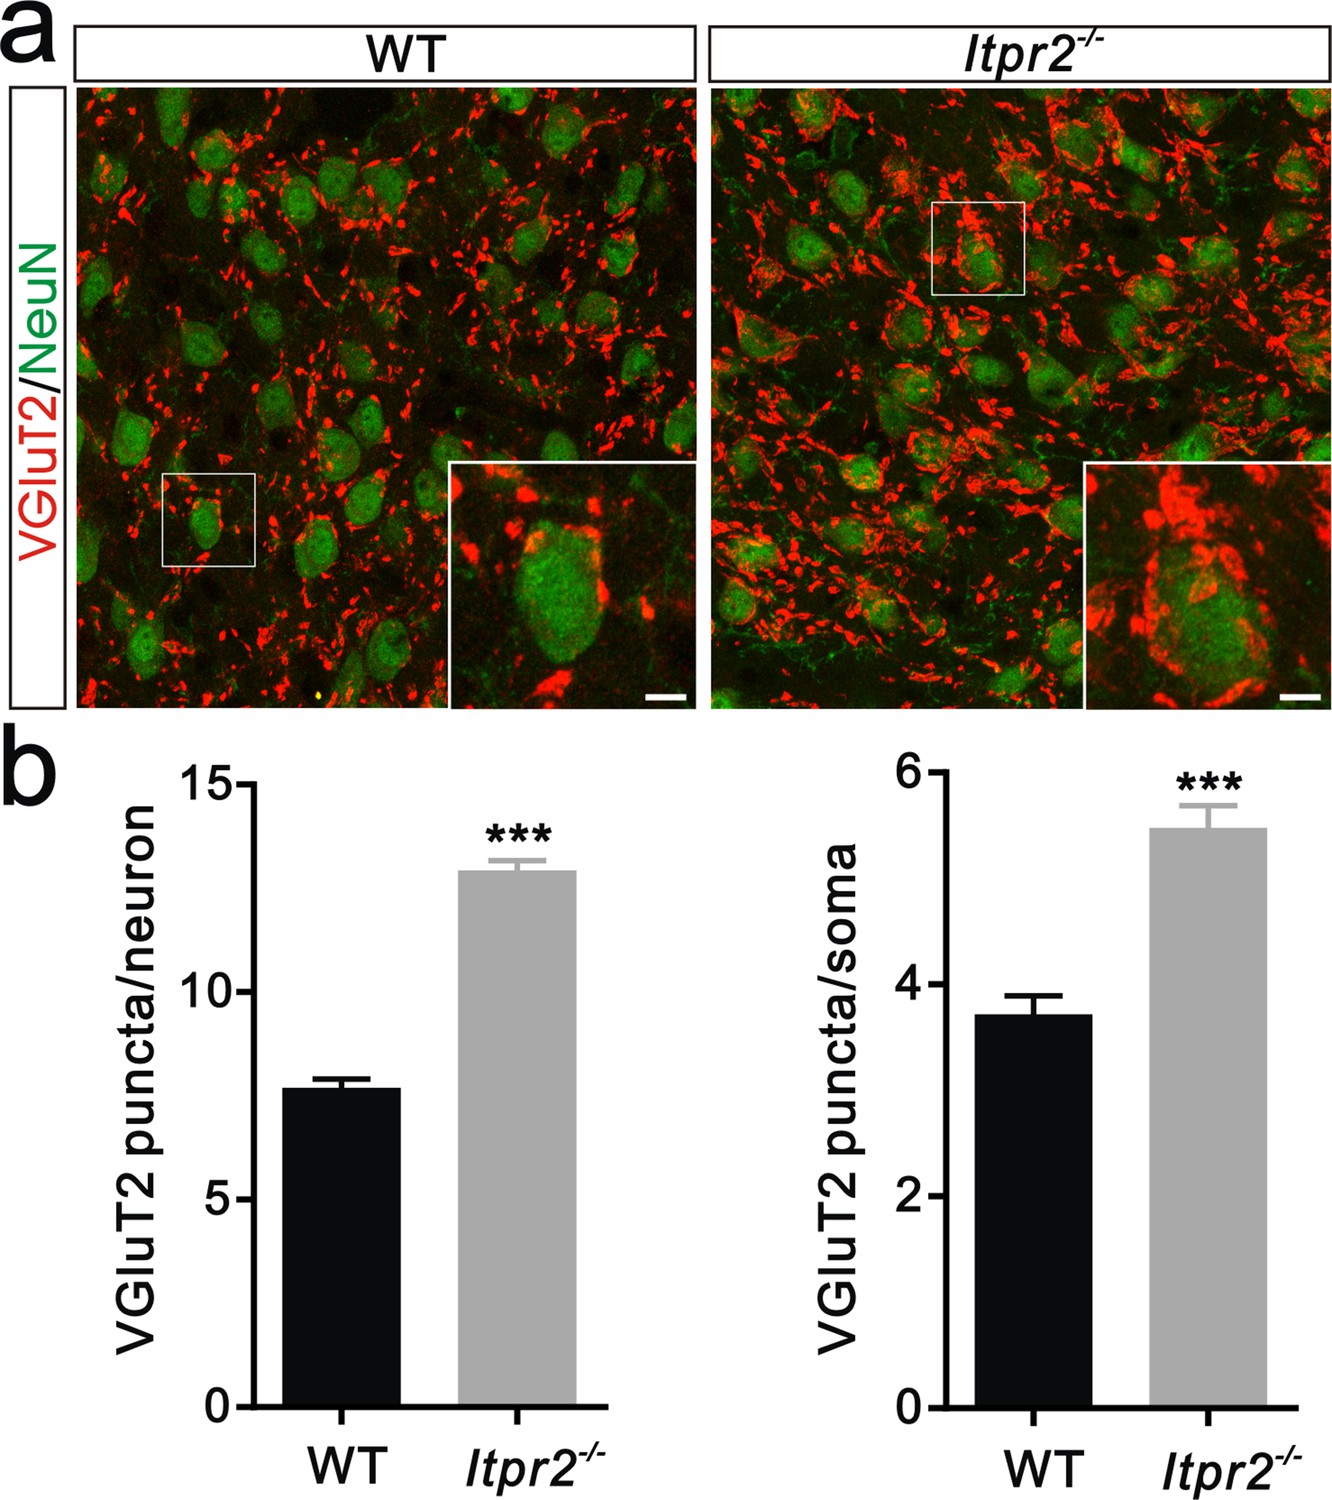
Deficient of synapse elimination at P30 in Itpr2−/− mice.
(a) Sample images of neurons and VGluT2 immunostaining in P30 WT (left panel) and Itpr2−/− (right panel) mice. Neurons were visualized with the NeuN antibody (green), and Pr5 axonal terminals were labeled by the VGluT2 antibody (red). Inset is higher-magnification of the boxed area. Scale bar, 10 µm. (b) Histogram summary of VGluT2 puncta/soma (left panel, n = 44 cells per group) and VGluT2 puncta/neuron (right panel, n = 9 sections from 3 mice per group) for WT and Itpr2−/− mice at P30. ***p<0.001, unpaired Student’s t test. Error bars indicate SEM.
Figure 3 with 1 supplement
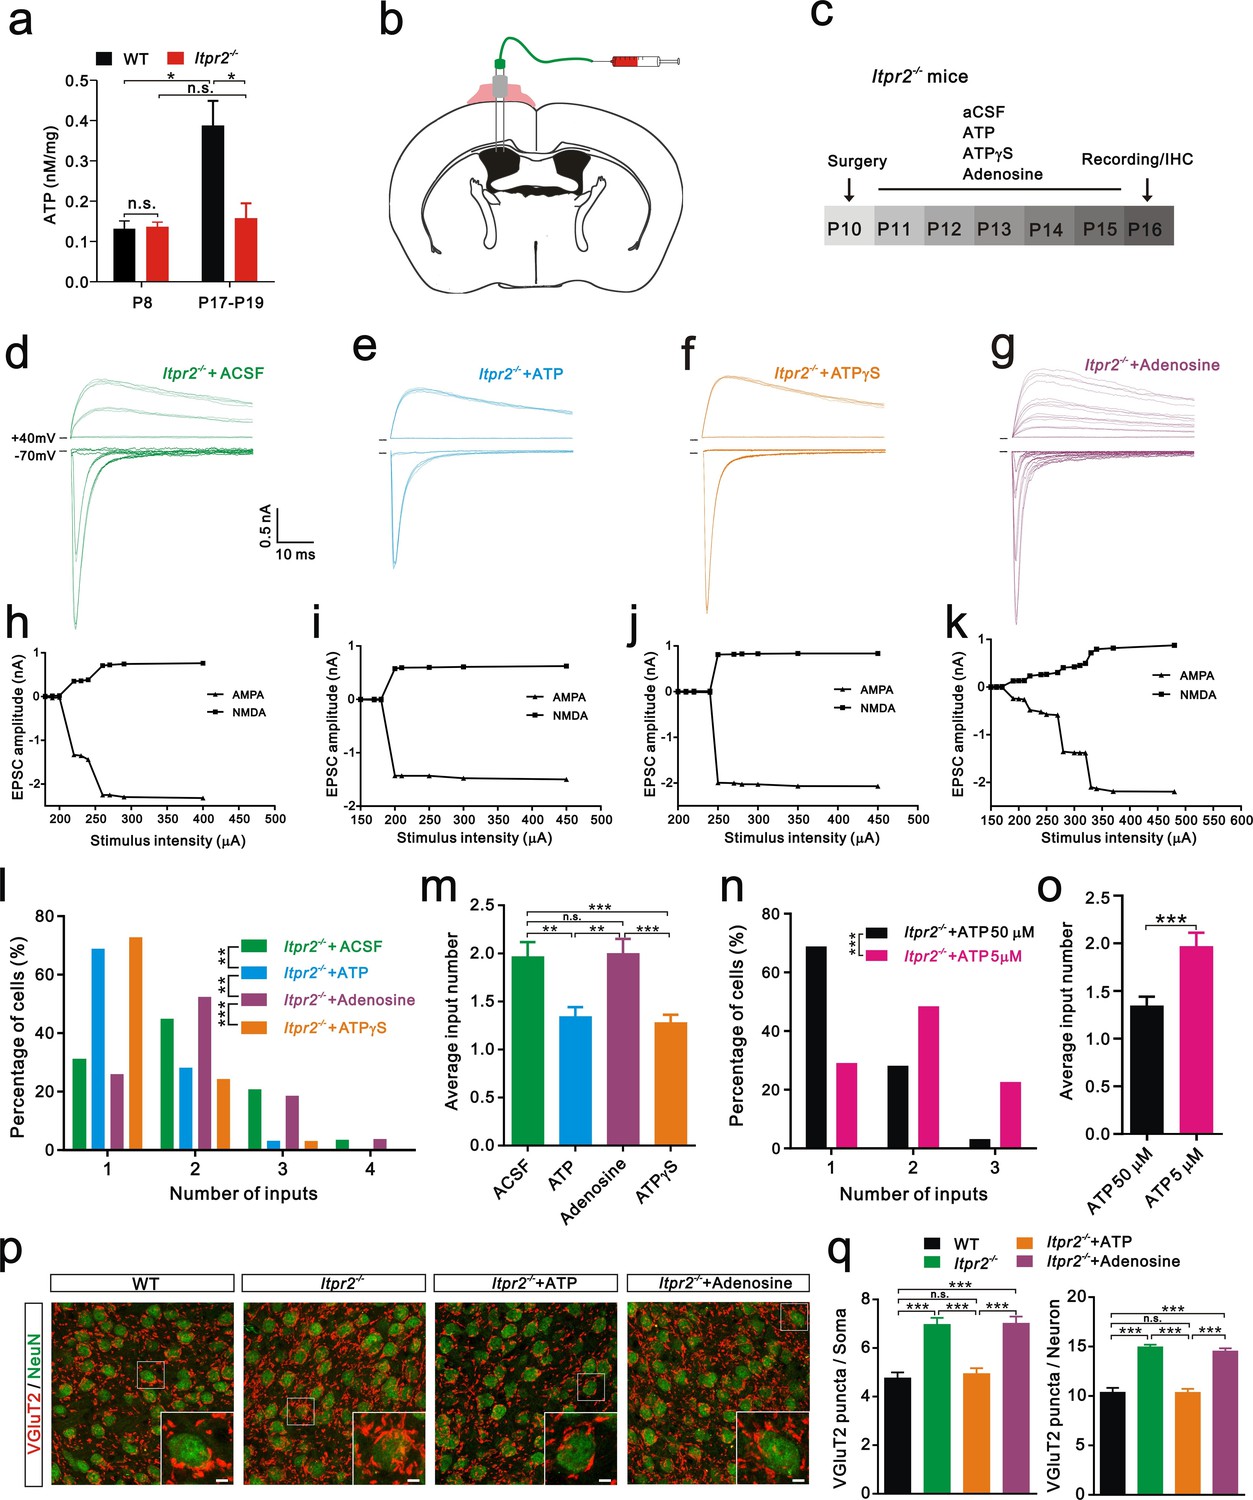
Intracerebroventricular injection of ATP from P11 to P15 rescued the synapse elimination deficit in Itpr2−/− mice.
(a) Basal ATP levels at P8 and P17-19 in WT and Itpr2−/− mice. *p<0.05, two-way ANOVA followed by Bonferroni post hoc test, n = 5 mice per age. n.s, not significant. Error bars indicate SEM. (b) Schematic illustrating the cannula was implanted to the left lateral ventricle. (c) Experimental design of aCSF, ATP (50 µM), ATPγS (50 µM), and adenosine (50 µM) administration and analysis. Injections were given twice per day from P11 to P15. (d-g) Sample traces showing membrane current in response to stimuli with a range of intensities in VPm neurons from Itpr2−/− mice at P16-17 with a short period of aCSF (d), ATP (e), ATPγS (f) and adenosine (g) treatment. (h-k) Peak current versus stimulus intensity for aCSF (h), ATP (i), ATPγS (j) and adenosine (k) treatment in Itpr2−/− mice. (l) Distributions of the number of Pr5 axons innervating each VPm neuron at P16-17 with aCSF (n = 29 cells), ATP (n = 32 cells), adenosine (n = 27 cells), and ATPγS (n = 32 cells) treatment in Itpr2−/− mice. **p<0.01, ***p<0.001, χ2 test. (m) Histogram of average number of inputs received by each VPm neuron at P16-17 in WT and Itpr2−/− mice followed by different injections. ***p<0.001, one-way ANOVA followed by Bonferroni post hoc test. Error bars indicate SEM. (n) Distributions of the number of Pr5 axons innervating each VPm neuron at P16-17 with different concentrations of ATP treatment in Itpr2−/− mice. ***p<0.001, χ2 test. (o) Histogram of average number of inputs received by each VPm neuron at P16-17 in Itpr2−/− mice followed by different concentrations of ATP injection. ***p<0.001, unpaired Student’s t test. (p) Sample confocal images of immunostained neurons and Pr5 axon terminals in the VPm at P16. Inset is higher-magnification of the white boxed area. Scale bar, 5 µm. (q) Quantification of VGluT2 puncta/soma (left, n = 40 cells/group) and VGluT2 puncta/neuron (right, n = 9 sections from 3 mice/group) for WT, Itpr2−/−, ATP and adenosine-treated Itpr2−/− mice. ***p<0.001, one-way ANOVA. Error bars indicate SEM.
Figure 3—figure supplement 1
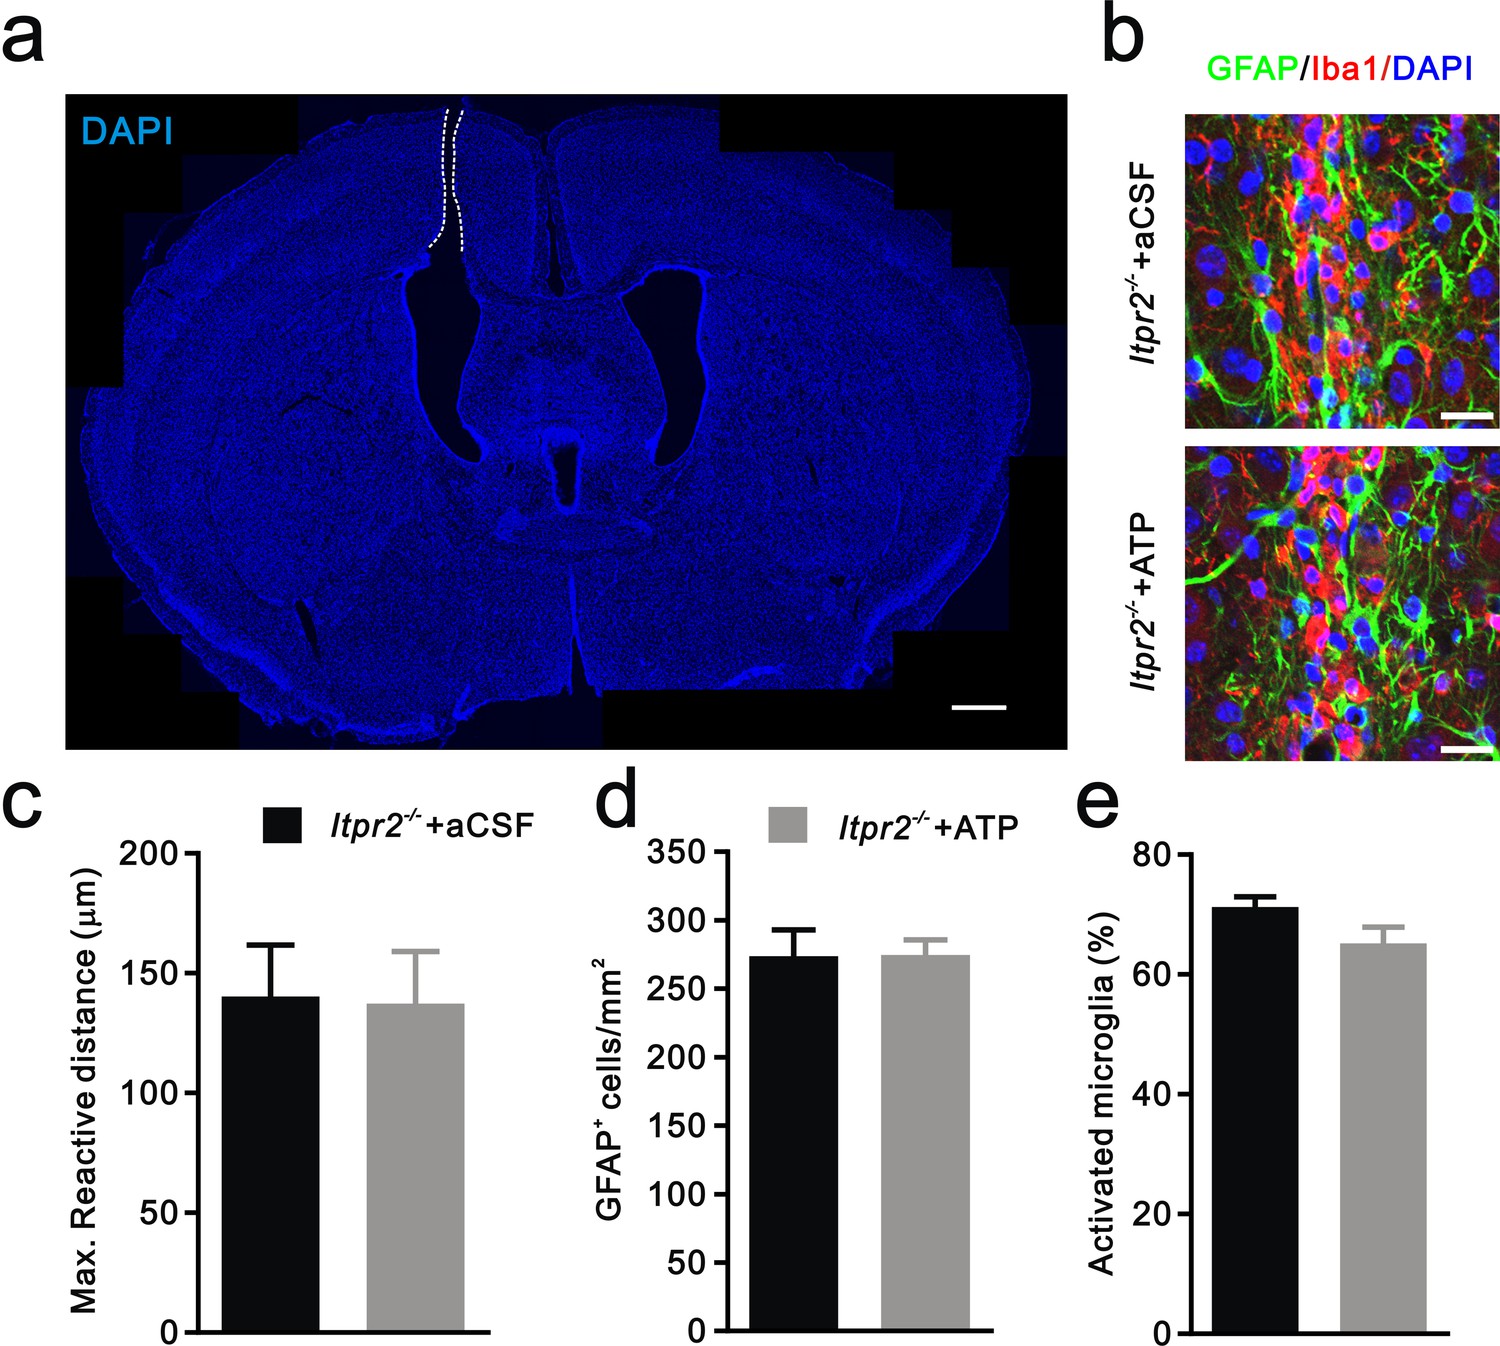
Injury-induced inflammatory responses of astrocytes and microglia are equivalent in aCSF and ATP treated-Itpr2−/− mice.
(a) Confocal image of a coronal brain section stained with DAPI showing the location of cannula. White dotted line indicates the cannula. Scale bar, 100 µM. (b) Representative confocal images illustrating reactive astrocyte and activated microglia around the site of cannula placement in aCSF and ATP treated-Itpr2−/− mice. Astrocytes were labeled by the specific marker GFAP (green). Microglias were visualized by Iba1 staining (red). Scale bar, 20 µM. (c-e) Histogram summary of the max reactive distance from the cannula (c, n = 6 mice per group, p=0.93), the number of reactive astrocytes (d, n = 8 sections from 4 mice per group, p=0.96), and the percentage of activated microglia (e, n = 7 sections from 4 mice per group, p=0.09) near the site of cannula in aCSF and ATP treated-Itpr2−/− mice. Error bars indicate SEM.
Figure 4 with 3 supplements
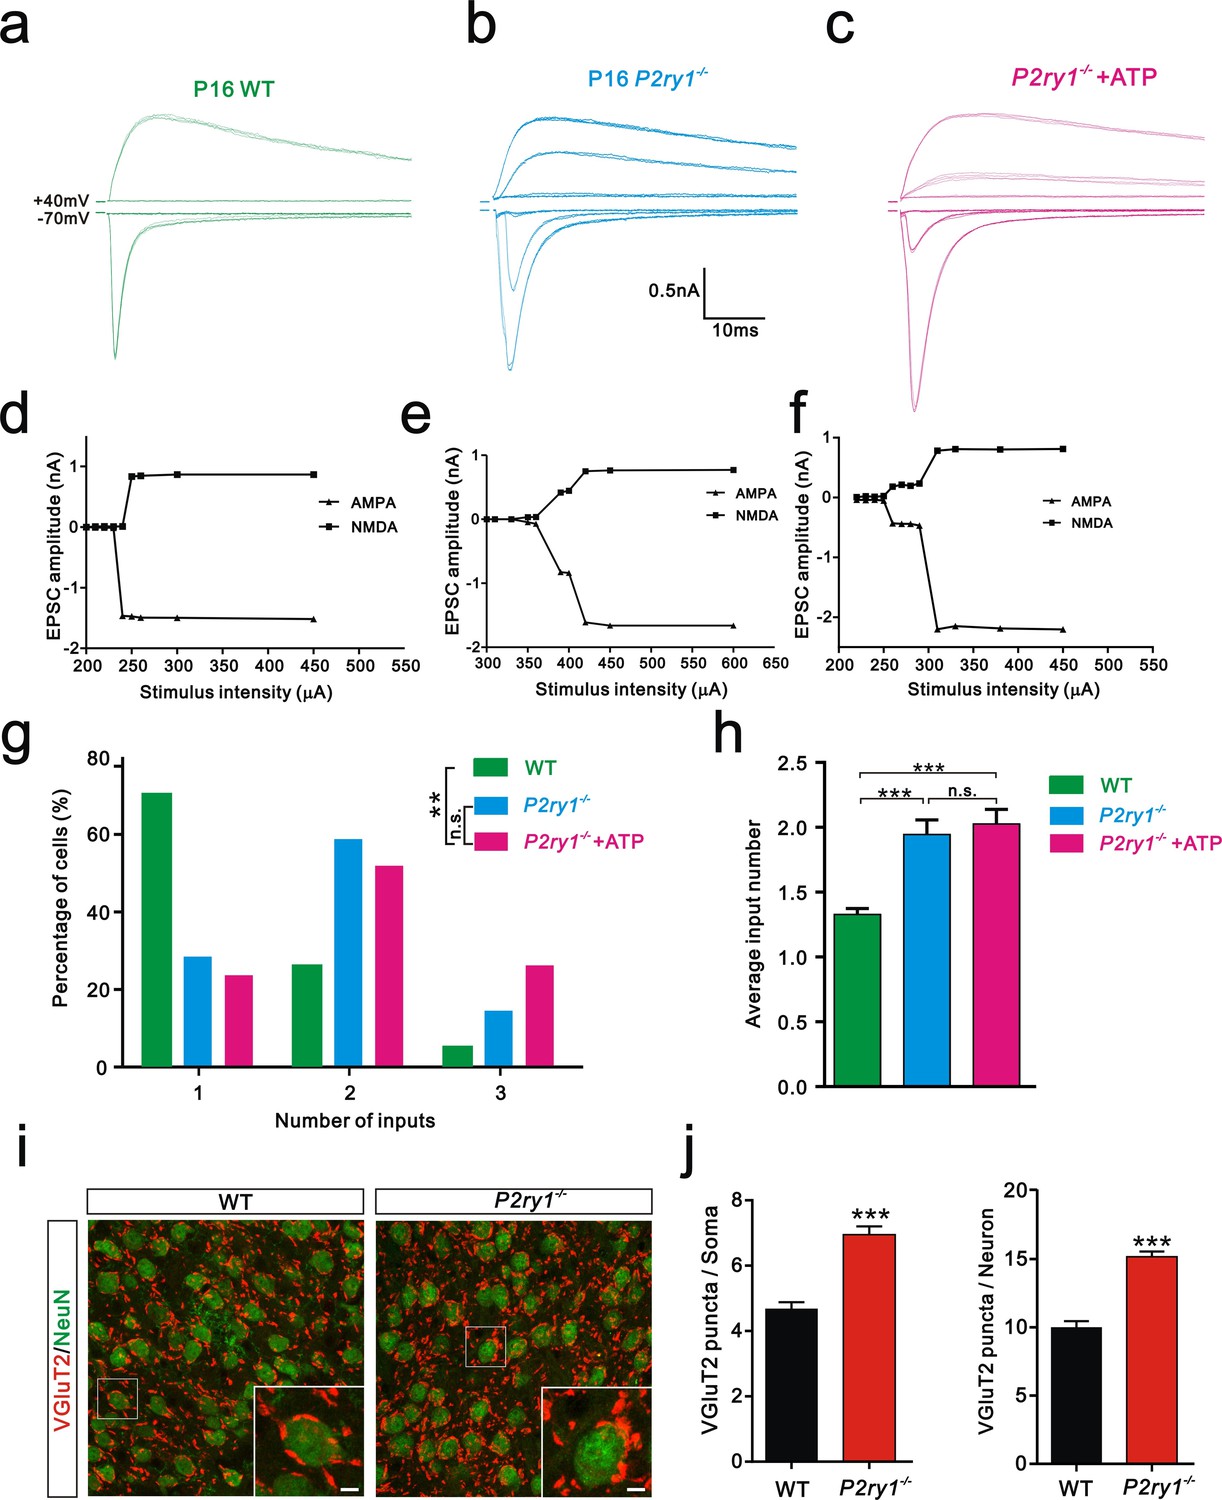
Synapse elimination was also impaired in P2ry1−/− mice at P16-17 and cannot be rescued by ATP.
(a-c) Sample traces of membrane current in response to stimuli at a range of intensities in VPm neurons at P16-17 in WT (a), P2ry1−/− (b), and P2ry1−/− with ATP injection (c) mice. (d-f) Peak current versus stimulus intensity for WT (d), P2ry1−/− (e), and P2ry1−/− with ATP injection (f) mice. (g) Distributions of the number of Pr5 axons innervating each VPm neuron at P16-17 in WT (n = 33 cells), P2ry1−/− (n = 47 cells) and P2ry1−/− with ATP injection (n = 39 cells) mice. **p<0.01, χ2 test. (h) Average number of Pr5 axonal inputs received by individual VPm relay neurons significantly increased in P2ry1−/− mice compared to WT controls. ***p<0.001 by one-way ANOVA. (i) Sample confocal images of immunostained neurons and Pr5 axon terminals in the VPm at P16. Neurons were visualized with the NeuN antibody (green), and Pr5 axon terminals were labeled by the VGluT2 antibody (red). Inset is higher-magnification of the boxed area. Scale bar, 5 µm. (j) Quantification of VGluT2 puncta/soma (left, n = 42 cells/group) and VGluT2 puncta/neuron (right, n = 9 sections from 3 mice/group) in WT and P2ry1−/− mice. ***p<0.001, unpaired Student’s t test. Error bars indicate SEM.
Figure 4—figure supplement 1

Expression pattern of P2Y1 receptors in the VPm.
(a) Representative confocal images of P2Y1 immunostaining in the VPm of GFAP-GFP mice. Astrocytes were labeled using the hGFAP-GFP mice in which all astrocytes express GFP (green) under the control of human GFAP promoter. Arrows indicate GFP-positive astrocyte; arrowheads indicate P2Y1-positive cells. P2Y1 receptors (red) were not co-localized with GFP-positive astrocytes in the VPm. Scale bar, 10 µm. (b) Representative confocal images of P2Y1 immunostaning in the VPm of Cx3cr1 GFP/+ mice. Microglia were marked using the Cx3cr1 GFP/+ mouse line. None of the VPm microglia co-localized with P2Y1 receptors. Arrows indicate GFP-positive microglia; arrowheads indicate P2Y1-positive cells. Scale bar, 10 µm. (c) Representative confocal images of double-staining for NeuN and P2Y1 in the VPm of WT mice. Neurons were shown with the antibody to the neuronal marker NeuN (green). P2Y1 receptors (red) were co-localized with VPm neurons. Arrows indicate co-localization. Scale bar, 10 µm.
Figure 4—figure supplement 2
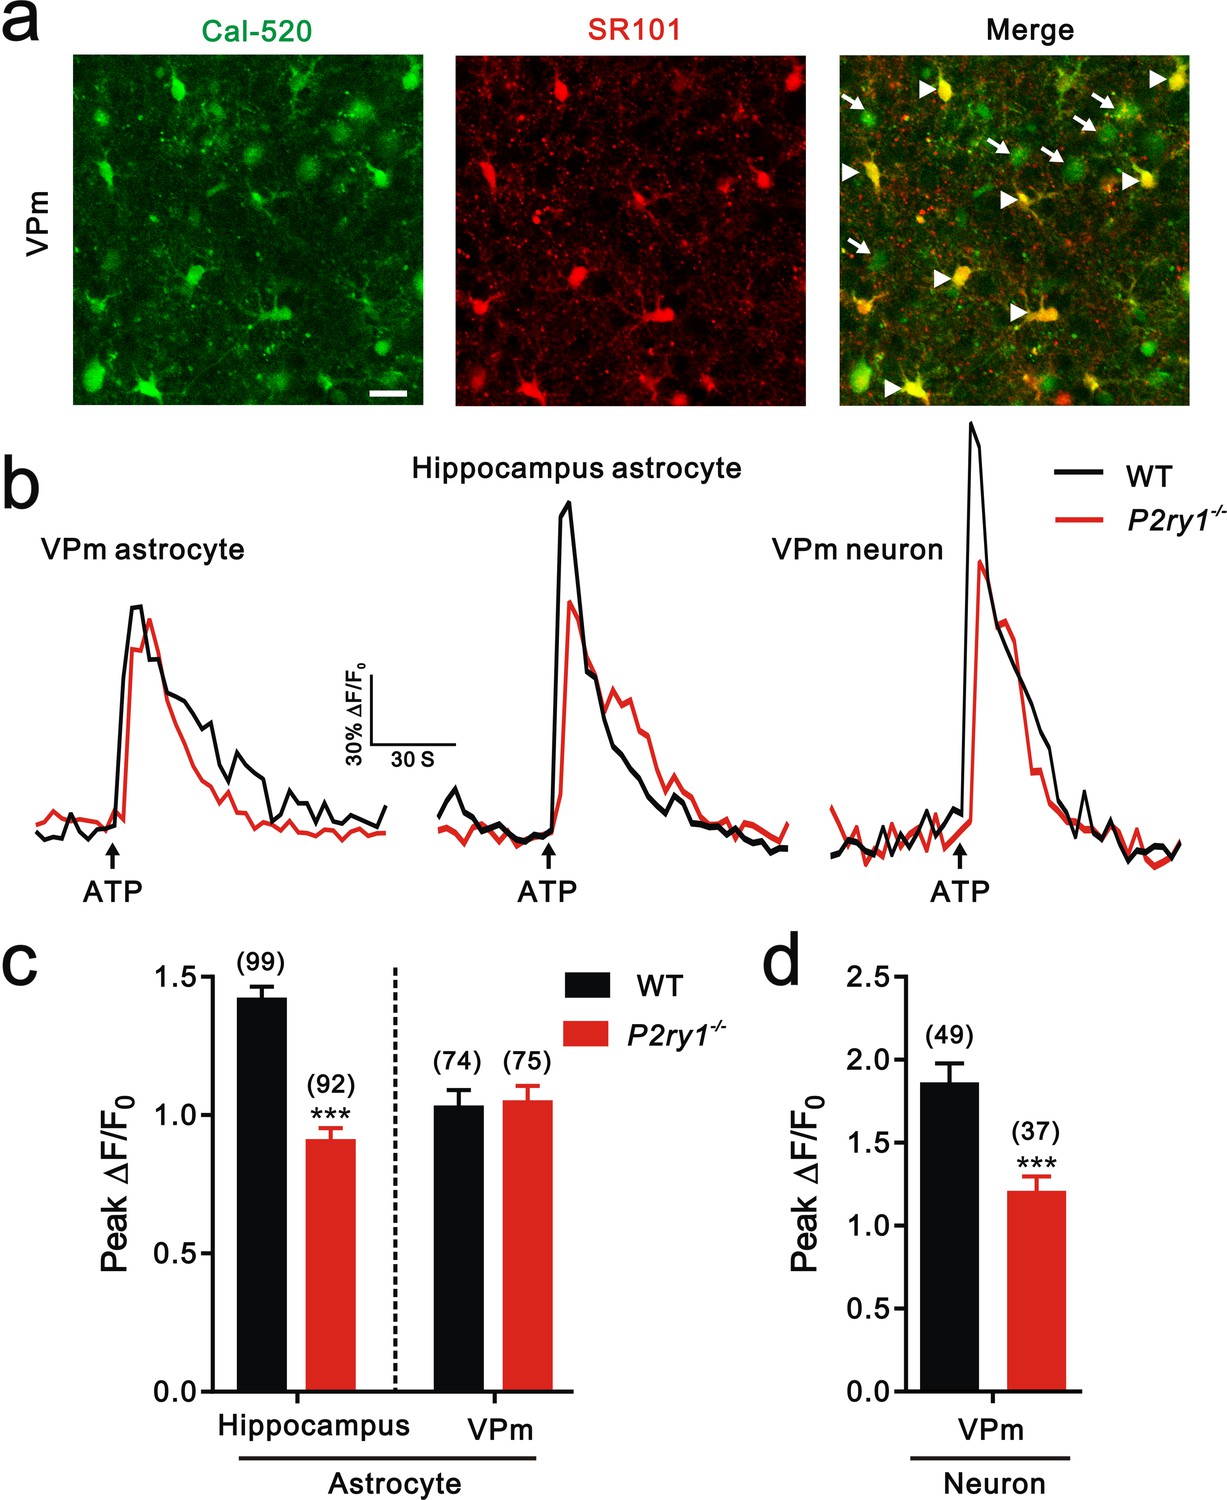
Calcium imaging in hippocampus and the VPm of WT and P2ry1−/− mice.
(a) Confocal images of SR101 labeled-astrocytes (arrowhead) and neuron (arrow) loaded with the Ca2+ indicator Cal-520 AM in the VPm. Scale bar, 20 µm. (b) Representative traces of [Ca2+]i elevation evoked by ATP (100 µM) application in the VPm astrocytes (left), hippocampus astrocytes (middle), and VPm neurons (right) from WT (black line) and P2ry1−/− (red line) mice. Arrow indicates ATP perfusion. (c and d) Histogram summary of the peak amplitude of [Ca2+]i elevation in response to ATP stimulation in neurons and astrocytes from WT (black) and P2ry1−/− (red) mice. Cell number in each group showed above the column. ***p<0.001, unpaired Student’s t test. Error bars indicate SEM.
Figure 4—figure supplement 3
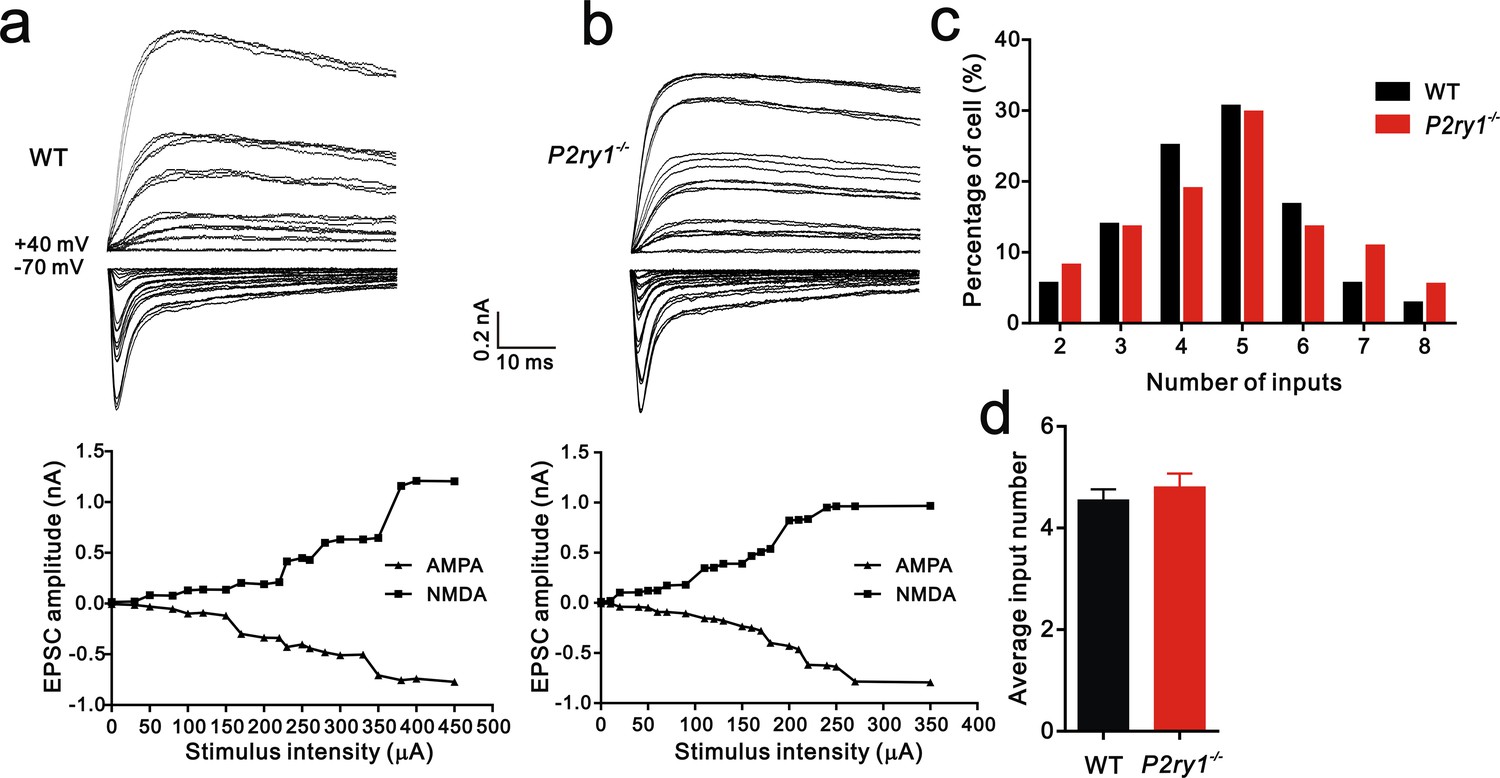
The number of inputs received by each VPm neuron at P7 is equivalent between WT and P2ry1−/− mice.
(a and b) Top: sample traces showing membrane current in response to stimuli at a range of intensities in VPm neurons at P7 in WT (a) and P2ry1−/− (b) mice. Bottom: peak current versus stimulus intensity for WT (a) and P2ry1−/− mice (b). (c) Distributions of the number of Pr5 axons innervating each VPm neuron at P7 between WT (n = 36 cells) and P2ry1−/− (n = 37 cells) mice. p=0.48, χ2 test. (d) Histogram of average number of inputs received by each VPm neuron at P7 in WT and P2ry1−/−mice (WT = 4.6 ± 0.2, n = 36; P2ry1−/− = 4.8 ± 0.3, n = 37). p=0.45, unpaired Student’s t test. Error bars indicate SEM.
Figure 5
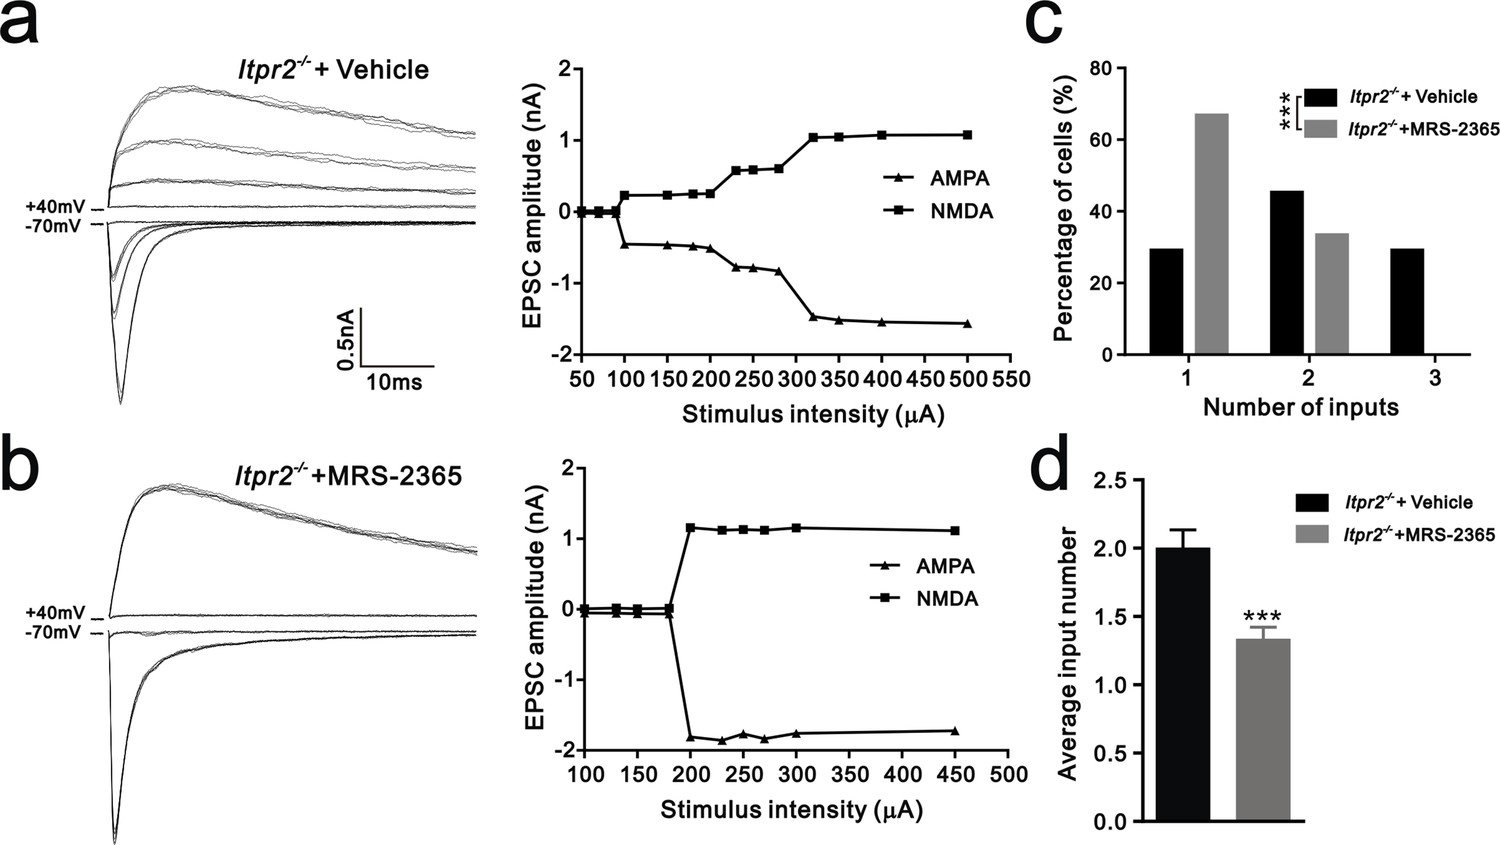
Synapse elimination was rescued by P2Y1 receptor agonist MRS-2365 in Itpr2−/− mice.
(a and b) Left panels, sample traces of membrane current in response to stimuli over a range of intensities in VPm neurons at P16-17 in aCSF (a) and MRS-2365 (b) treated-Itpr2−/− mice. Right panels, peak current versus stimulus intensity for aCSF (a) and MRS-2365 (b) treated-Itpr2−/− mice. (c) Distributions of the number of Pr5 axons innervating each VPm neuron during P16-17 in aCSF (n = 32 cells) and MRS-2365 treated-Itpr2−/− mice(n = 30 cells). ***p<0.001, χ2 test. (d) Histogram of average number of inputs received by each VPm neuron at P16-17 in aCSF (n = 32 cells) and MRS-2365 (n = 30 cells) treated-Itpr2−/− mice. ***p<0.001, unpaired Student’s t test. Error bars indicate SEM.
Author response image 1

Author response image 2

Author response image 3

Author response image 4

Author response image 5

Download links
A two-part list of links to download the article, or parts of the article, in various formats.
Downloads (link to download the article as PDF)
Open citations (links to open the citations from this article in various online reference manager services)
Cite this article (links to download the citations from this article in formats compatible with various reference manager tools)
Astrocytes contribute to synapse elimination via type 2 inositol 1,4,5-trisphosphate receptor-dependent release of ATP
eLife 5:e15043.
https://doi.org/10.7554/eLife.15043


