Somatic and vicarious pain are represented by dissociable multivariate brain patterns
- University of Colorado Boulder, United States
- Brooklyn College of the City University of New York, United States
- Dartmouth College, United States
- Duke University, United States
- University College London, United Kingdom
- The University of Texas at Dallas, United States
- Université Laval, Canada
- Hospital del Mar, CIBERSAM G21, Spain
- Queens College of the City University of New York, United States
- Icahn School of Medicine at Mount Sinai, United States
Figures
Figure 1

Experimental paradigm and behavioral results.
(A) Trial timeline for somatic and vicarious pain sessions (differing only by stimulation type and fixation jitter, see 'Materials and methods' for more details); (B) Averaged behavioral ratings for somatic and vicarious pain across levels of stimulation and body site (i.e., upper limb and lower limb; including within-participant standard error of the mean).
Figure 2
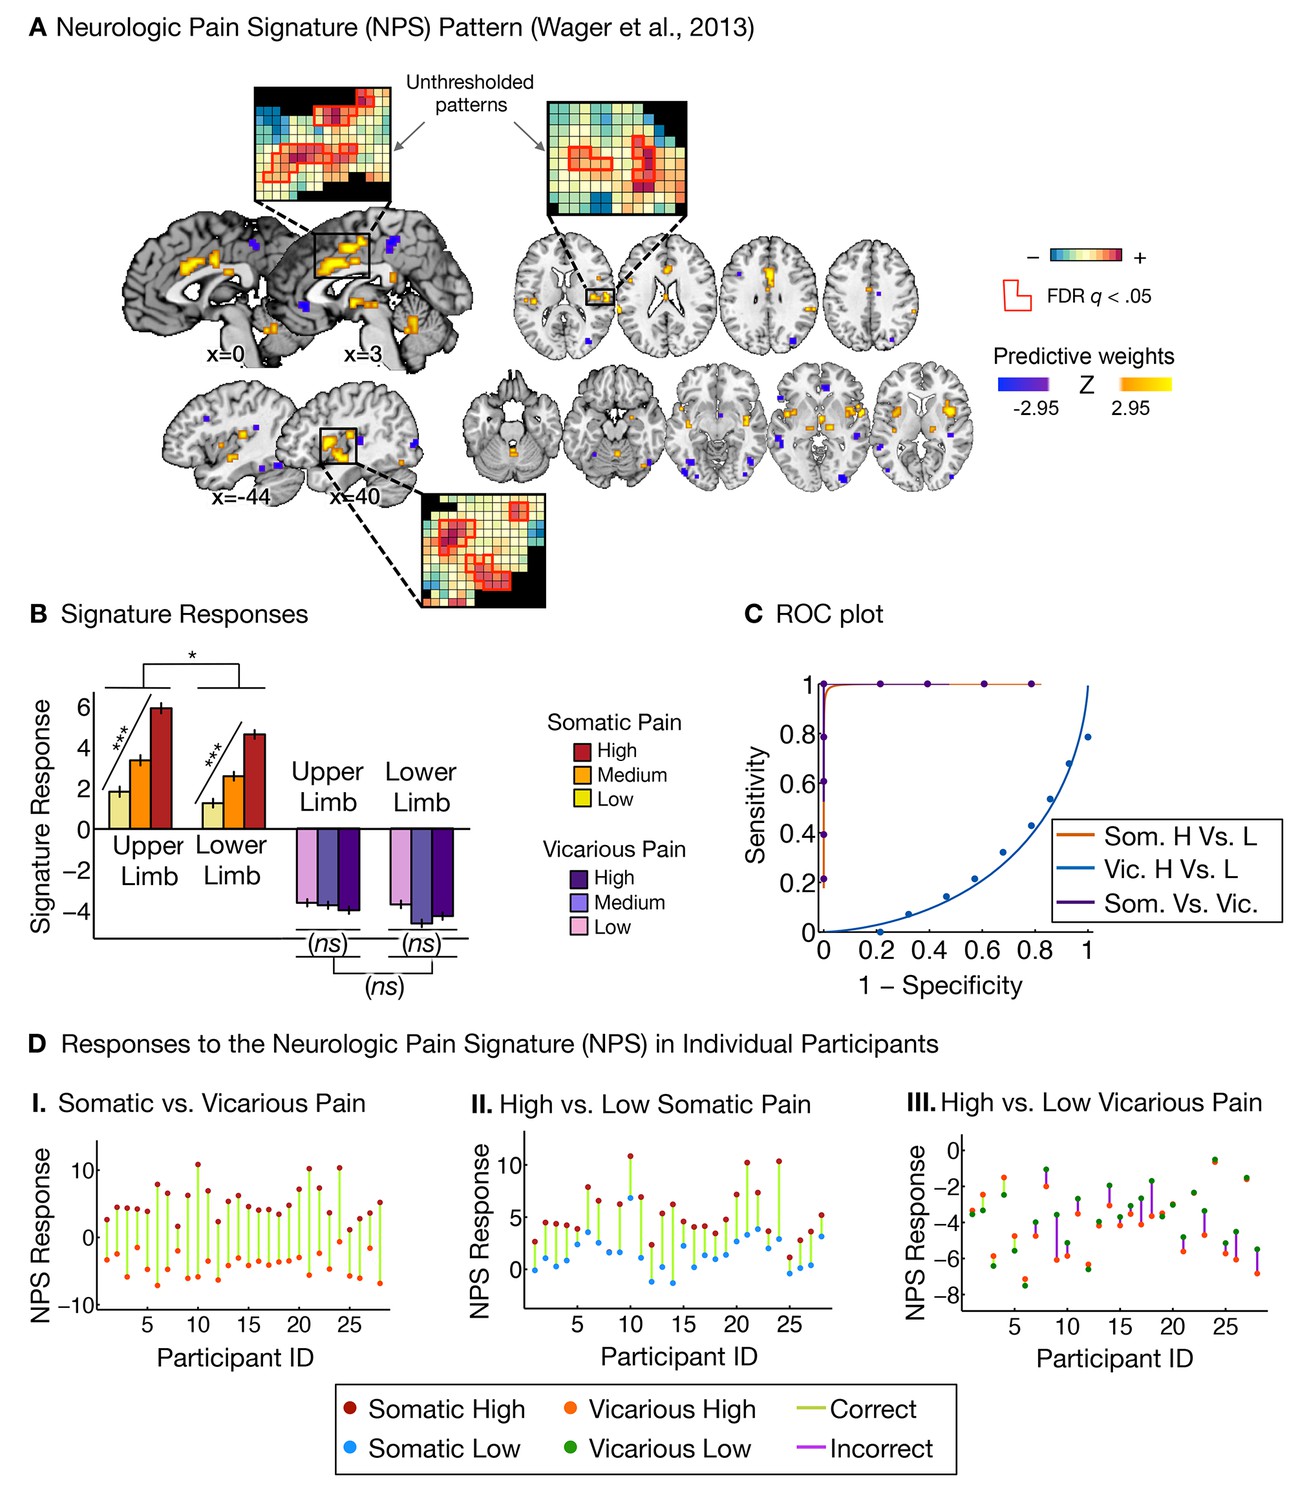
Neurologic pain signature (NPS) pattern and analyses.
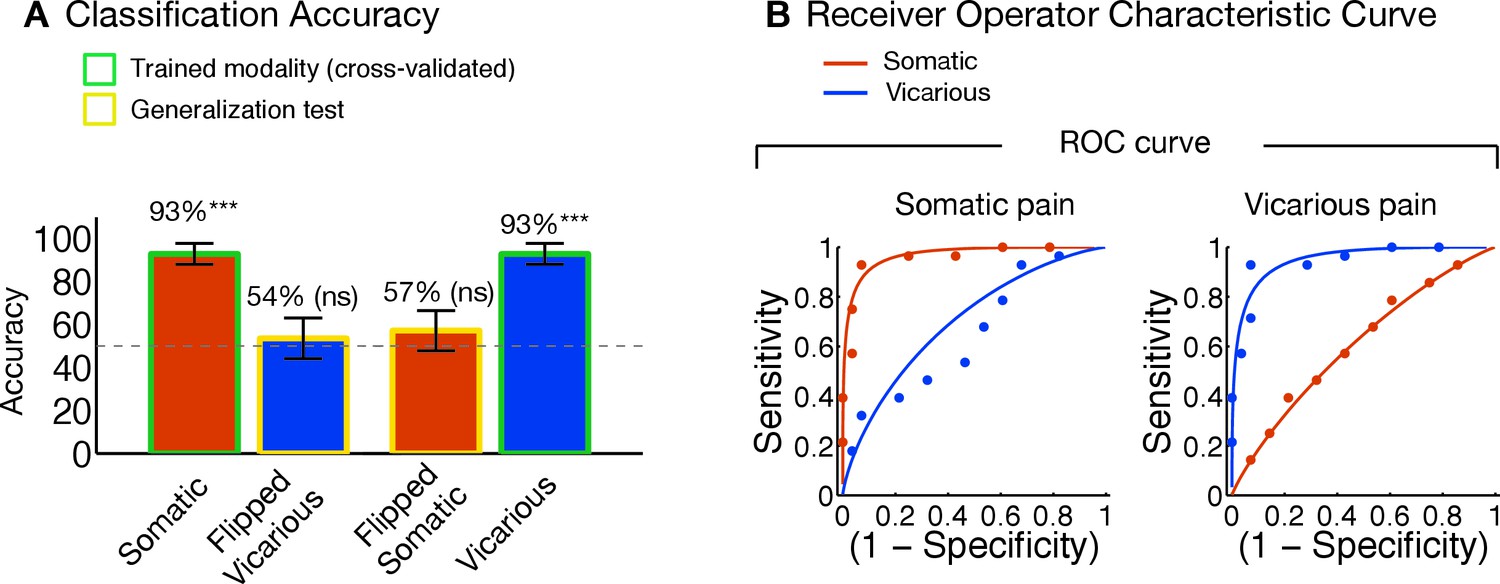
(A) Between-participant thresholded (False Discovery Rate [FDR] q<0.05) Neurologic Pain Signature (NPS) pattern (Wager et al., 2013), (all voxels within the NPS were used in the analyses), examples of unthresholded patterns are presented in the insets; small squares indicate voxel weights, black squares indicate empty voxels located outside of the NPS pattern, and red-outlined squares indicate significance at FDR q<0.05; (B) Signature responses computed as the dot product of the NPS pattern weights and estimated activation maps for each participant (including within-participant error bars); (C) Receiver Operating Characteristic (ROC) curves for two-choice forced-alternative accuracies for somatic and vicarious pain, high and low somatic pain, and high and low vicarious pain; (D) Participant-Wise NPS Responses for (I) somatic and vicarious pain (accuracySom-Vic = 100%, p<0.0001), (II) high and low somatic pain (accuracyHsom-Lsom = 100%, p<0.0001), and (III) high and low vicarious pain (accuracyHvic-Lvic = 32%, n.s.), showing the direction of response for each participant.
Figure 3
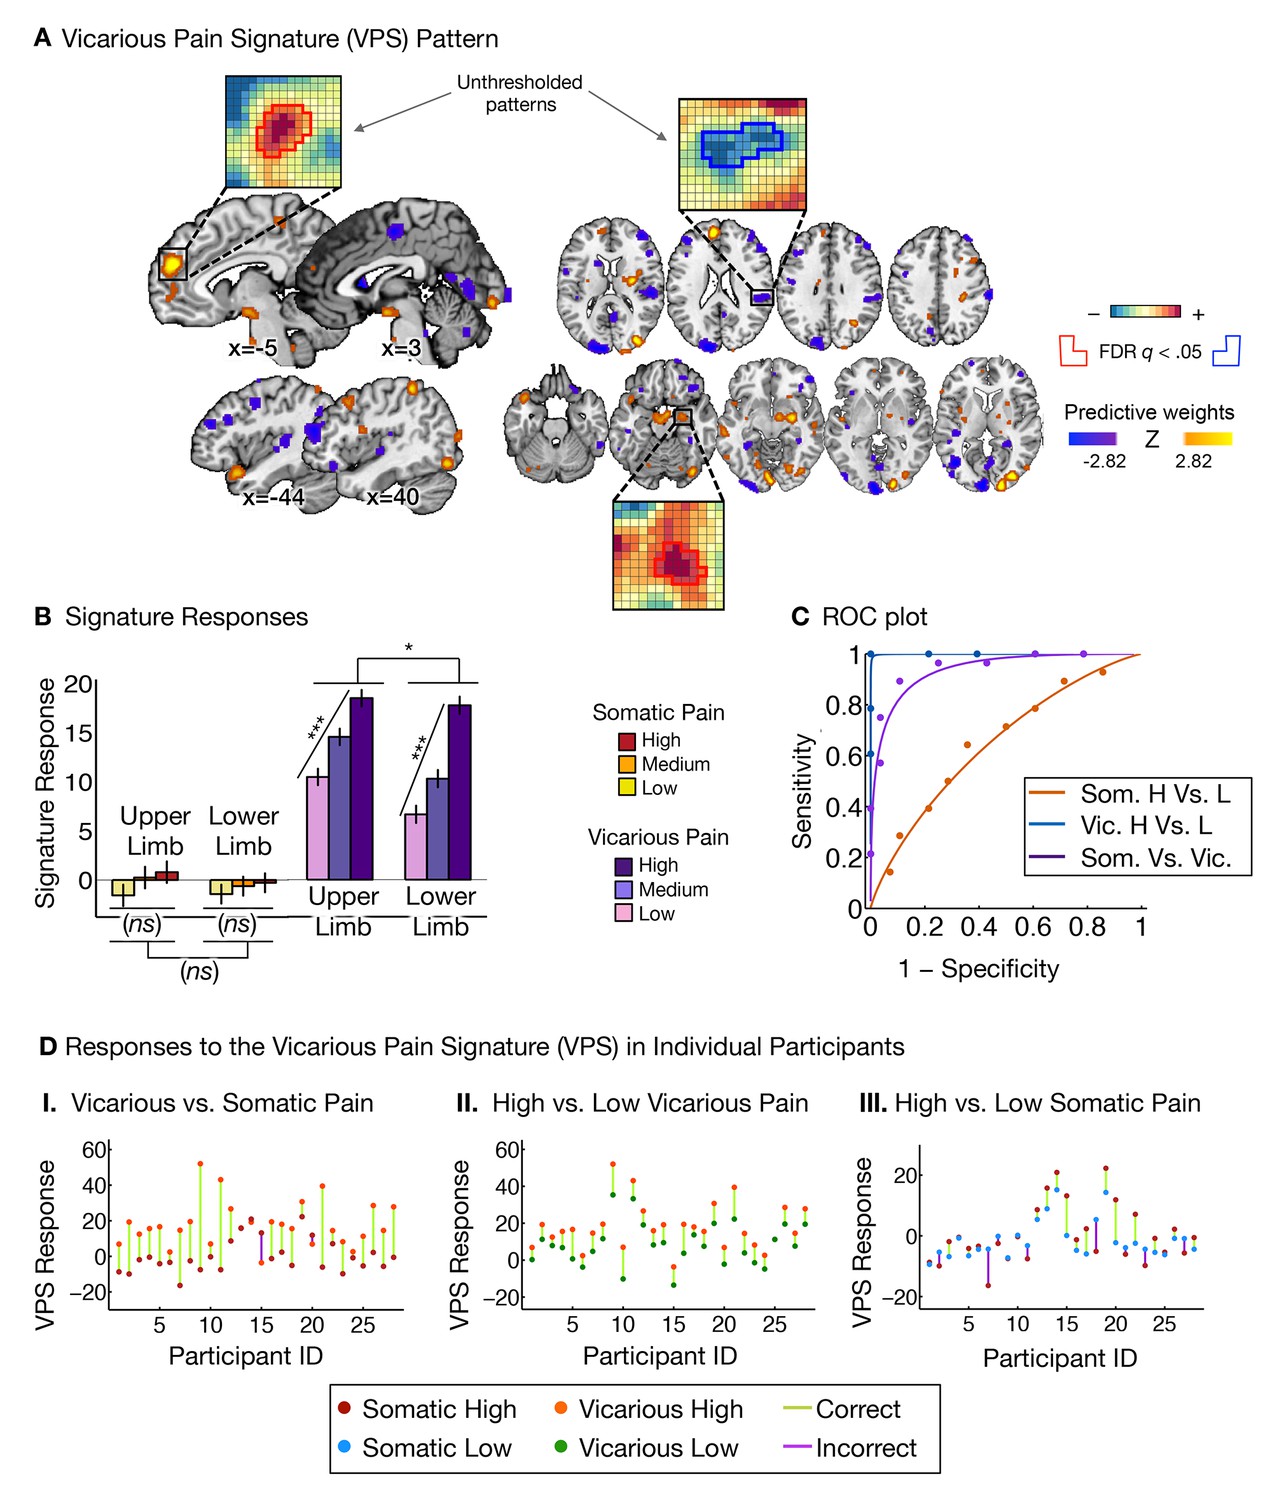
Vicarious pain signature (VPS) pattern and analyses.
(A) Between-participant LASSO-PCR (Least Absolute Shrinkage and Selection Operator-regularized Principal Components Regression) derived pattern for the Vicarious Pain Signature (VPS), and bootstrap thresholded at FDR q<0.05 for display purposes (all voxels within the VPS were used in the analyses), examples of unthresholded patterns are presented in the insets; small squares indicate voxel weights, and red or blue-outlined squares indicate significance at FDR q<0.05; (B) Cross-validated signature responses computed from the VPS as the dot product of the VPS pattern weights with the estimated activation maps for each participant (including within-participant standard error of the mean); (C) Receiver Operating Characteristic (ROC) curves for two-choice forced-alternative accuracies for vicarious and somatic pain, high and low somatic pain, and high and low vicarious pain; (D) Participant-Wise VPS Responses for (I) vicarious and somatic pain (accuracyVic-Som = 89%, p<0.0001), (II) high and low vicarious pain (accuracyHvic-Lvic = 100%, p<0.0001), and (III) high and low somatic pain (accuracyHsom-Lsom = 64%, n.s.), showing the direction of response for each participant.
Figure 4
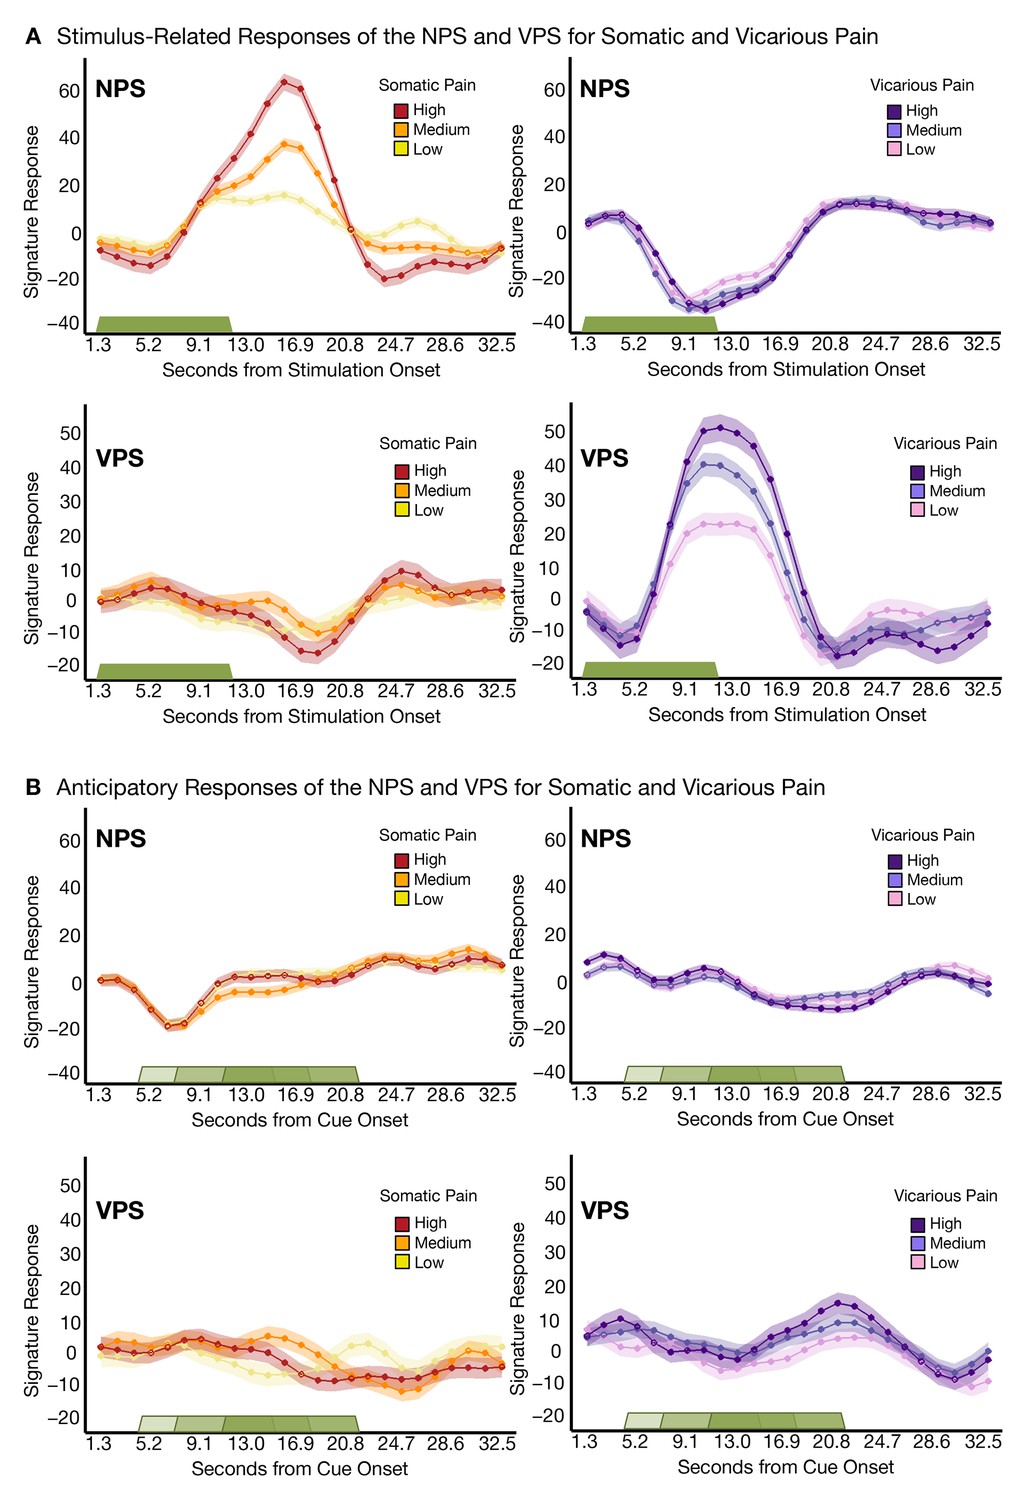
Trial-Level finite-impulse response (FIR) analyses.
(A) Stimulus-related activity for the NPS and VPS for somatic and vicarious pain (including within-participant standard error of the mean (shading), where the green bar shows stimulus duration; (B) Anticipatory (cue-locked) activity for the NPS and VPS for somatic and vicarious pain (including within-participant error (shading), where the green bars show stimulus duration after a jittered pre-stimulus anticipatory fixation.
Figure 5
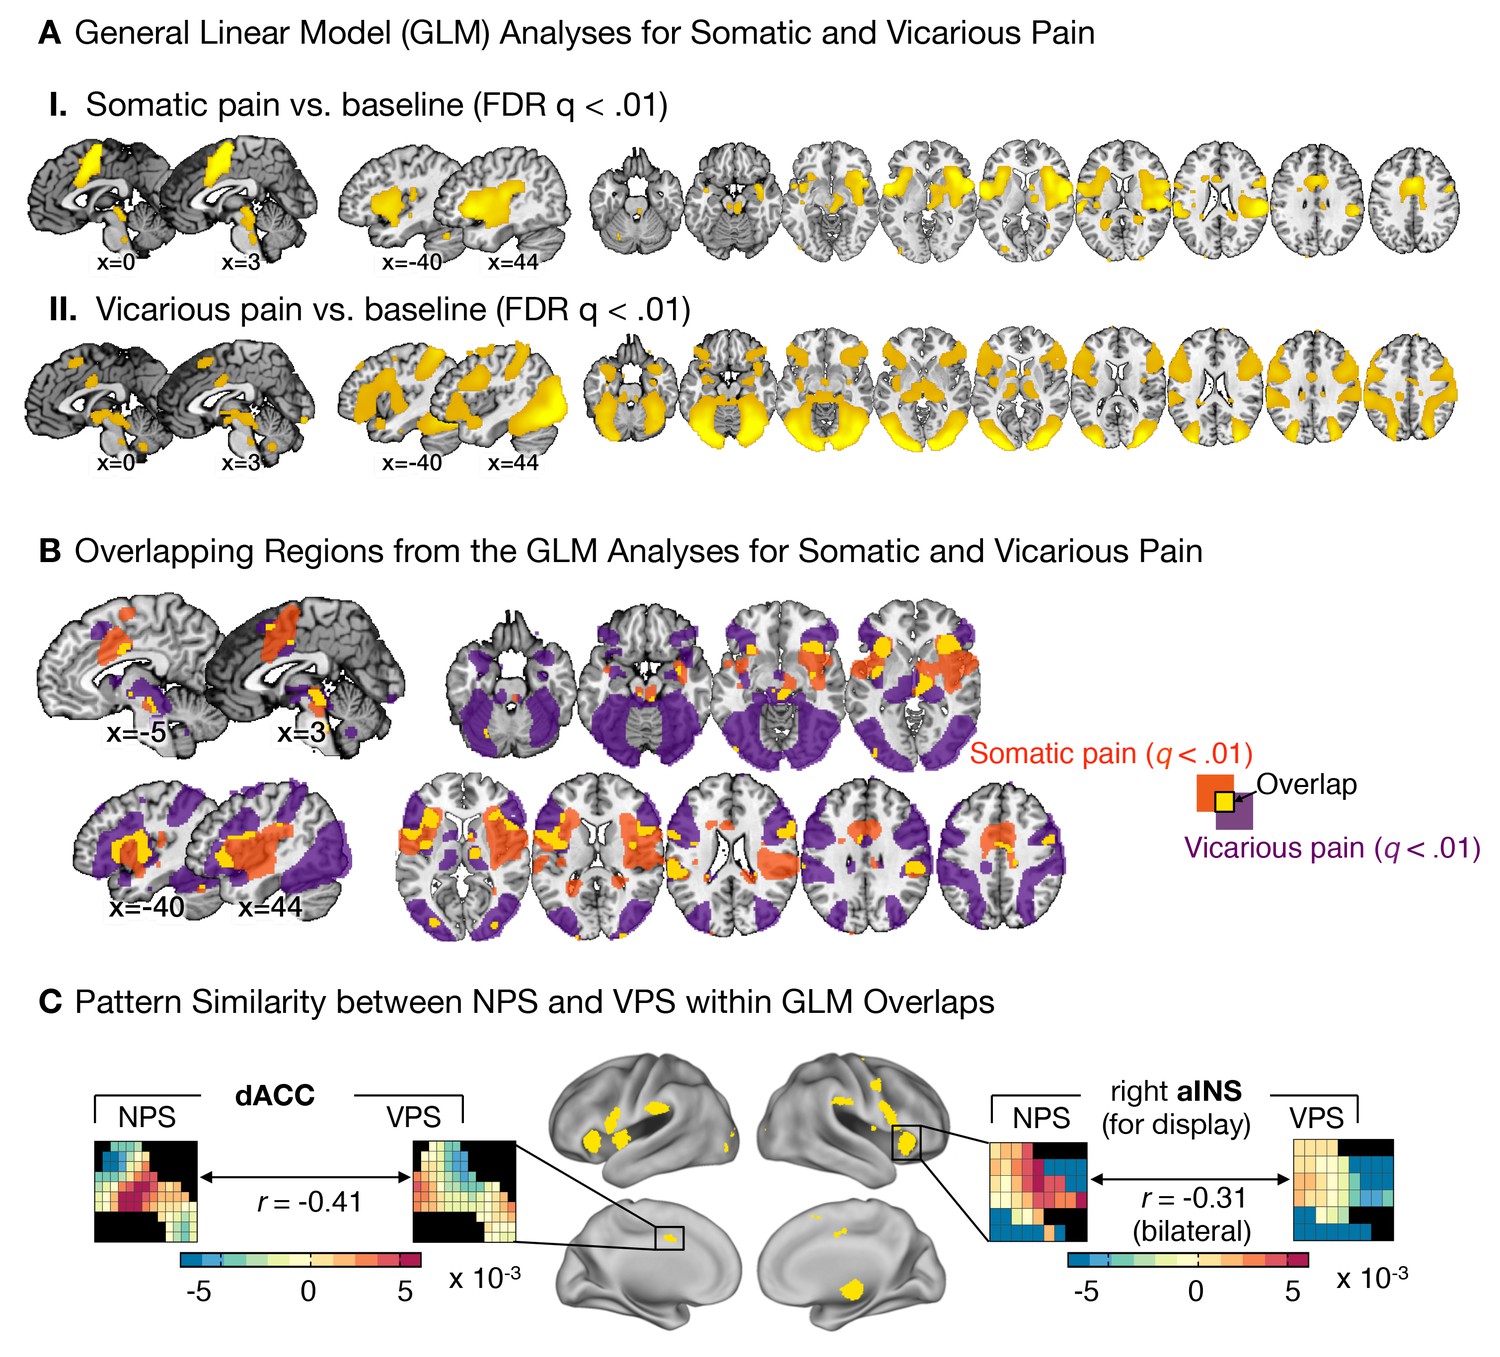
Univariate general linear model analyses and multivariate pattern comparisons.
(A) group level general linear model (GLM) analyses for somatic and vicarious pain. (I.): GLM results for somatic pain against baseline thresholded at FDR q<0.01; (II.): GLM results for vicarious pain against baseline thresholded at FDR q<0.01; (B) General Linear Model (GLM) results for somatic pain (in orange) and vicarious pain (in purple) against baseline, thresholded at FDR q<0.01 with overlap in the statistically significant regions (FDR q<0.01) between somatic and vicarious pain shown in yellow (these overlapping regions were used for further within-participant cross-prediction analyses); (C) Pattern comparison within the anterior insula (aINS) and dorsal anterior cingulate cortex (dACC) for the NPS and VPS (black squares in the pattern mask indicate empty voxels not included for the analysis); correlation values are computed using all overlapping voxels in the dACC and bilateral aINS voxels (only right aINS shown for display).
Figure 6
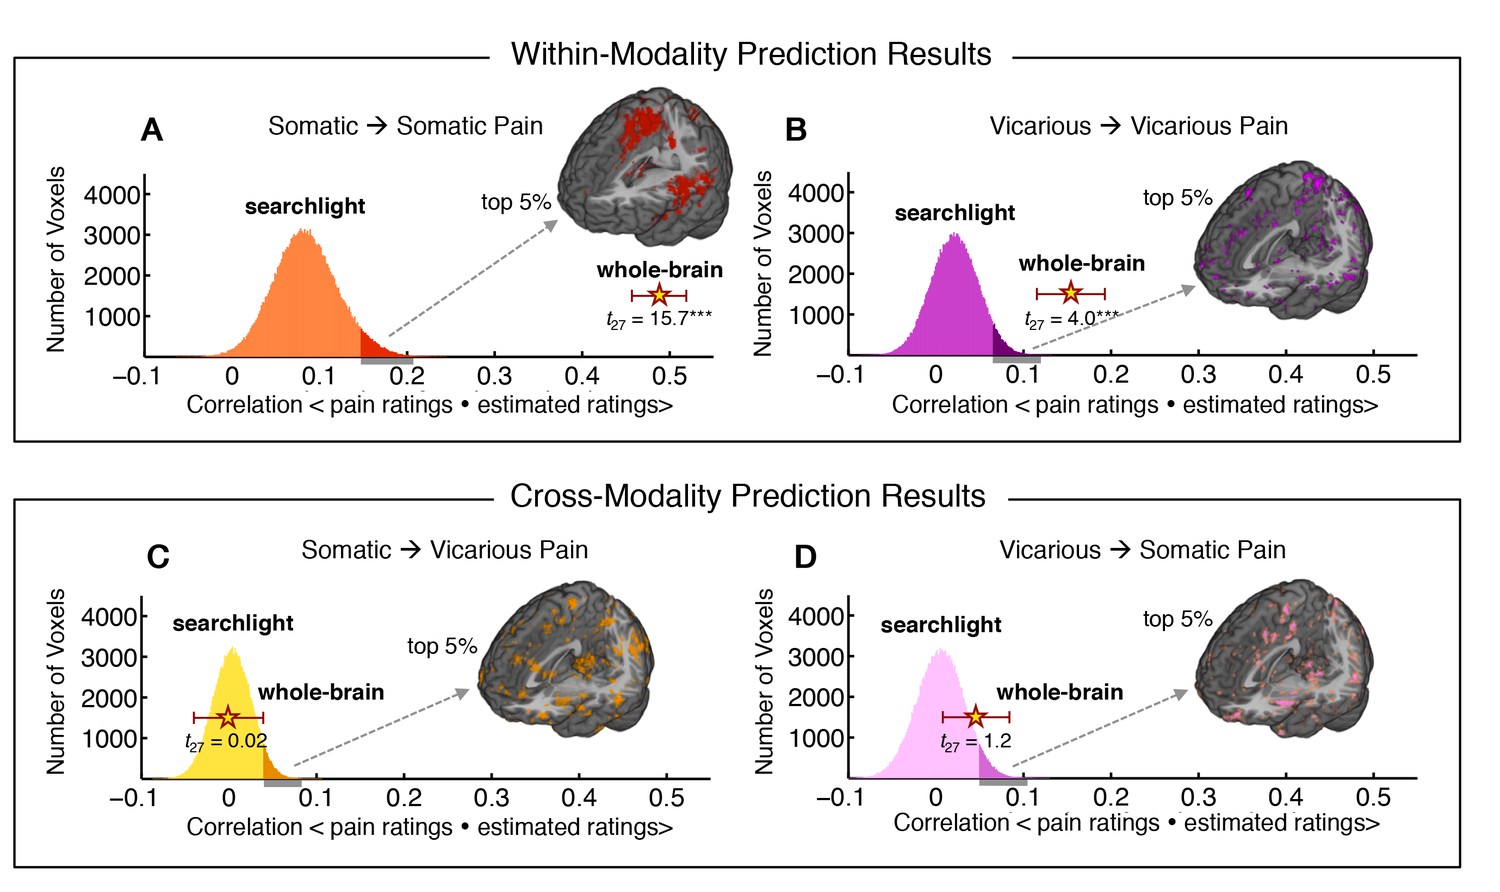
Within-participant whole-brain and local searchlight analyses.
(A—D) Distribution of correlations between actual behavioral ratings and estimated behavioral ratings for within and cross-modality predictions from whole-brain and local searchlight analyses. Histograms: Mean outcome correlation from local searchlight analysis computed across participants (dark shades represent voxels with top 5% of correlation values); Stars with Error bar: Mean outcome correlation computed across participants from whole-brain analysis (error bars represent standard error of the mean [SEM]); A and B Whole brain and local searchlight results from cross-validated within-modality (somatic to somatic; vicarious to vicarious) predictions. Brain maps show voxels with the top 5% correlations; C and D Whole brain and local searchlight results from cross-modality (somatic to vicarious; vicarious to somatic) prediction with brain map showing voxels with the top 5% correlations.
Figure 7
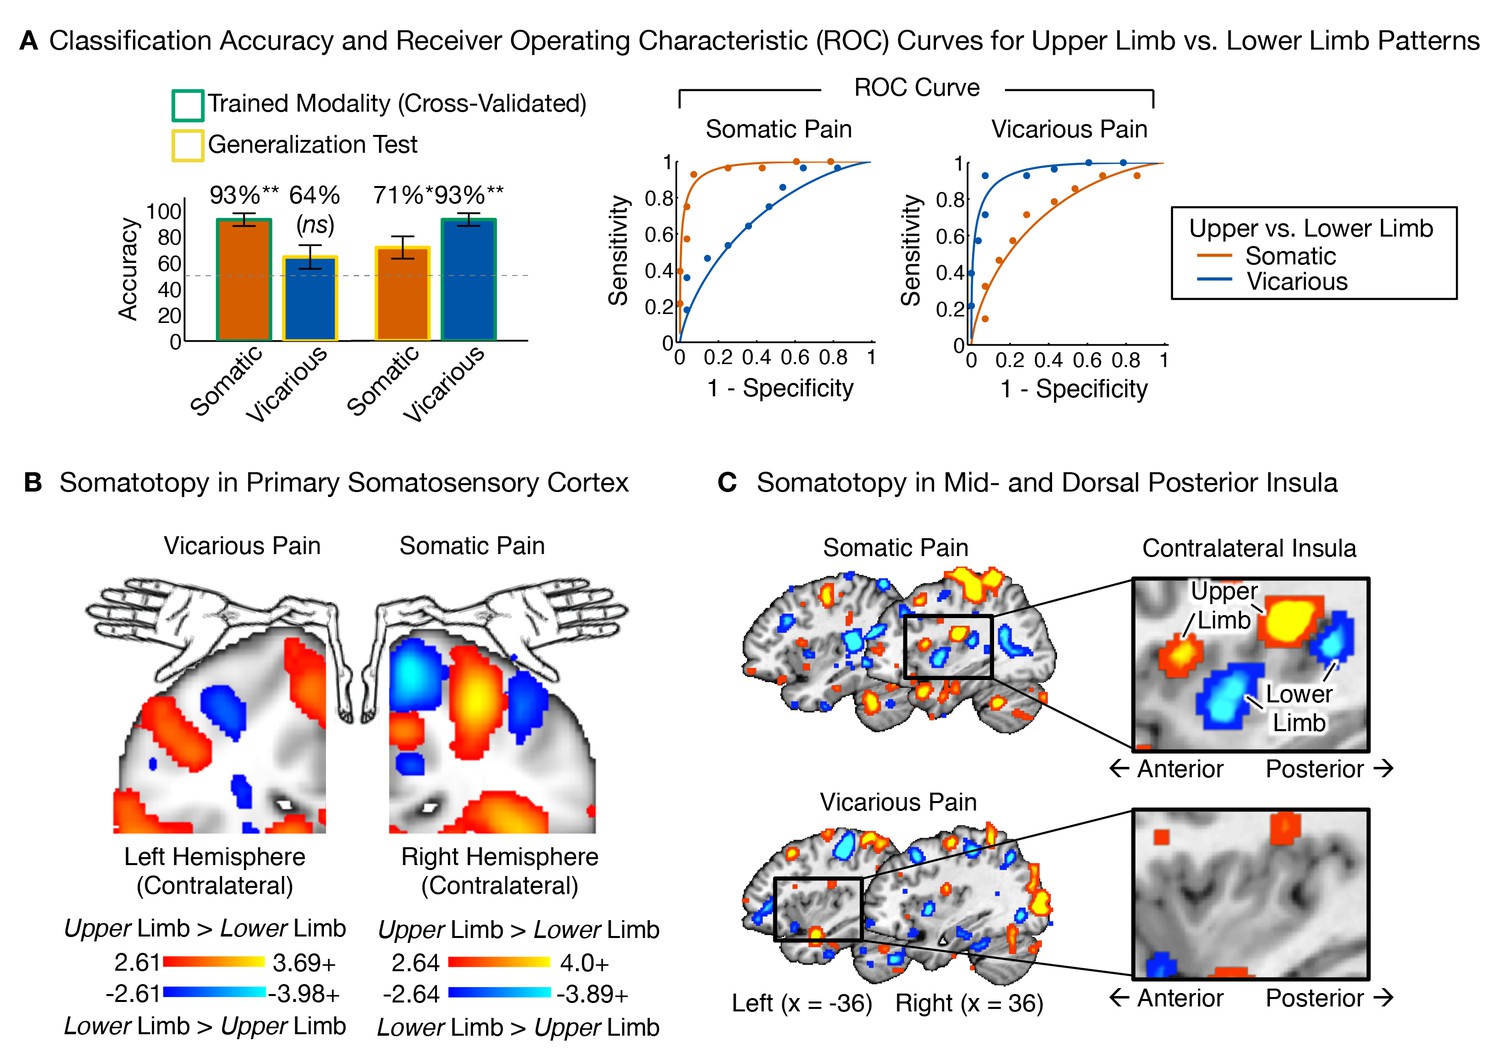
Upper limb versus lower limb multivariate patterns for somatic and vicarious pain.
(A) Accuracy statistics for upper limb versus lower limb weight maps for somatic and vicarious pain; Receiver Operating Characteristic (ROC) curves for two-choice forced alternative tests for upper versus lower limb sites; (B) Support Vector Machine (SVM) derived pattern for upper limb versus lower limb sites for somatic and vicarious pain, bootstrap thresholded at FDR q<0.05 for display purposes, showing somatotopy for these sites in the primary somatosensory cortex (schematic of homunculus shown for reference); (C) SVM derived pattern for upper limb versus lower limb sites for somatic and vicarious pain, bootstrap thresholded at FDR q<0.05 for display purposes, showing somatotopy for these sites in the mid- and dorsal-posterior insular cortex (warm colors indicate upper limb regions and cool colors indicate lower limb sites).
Figure 8
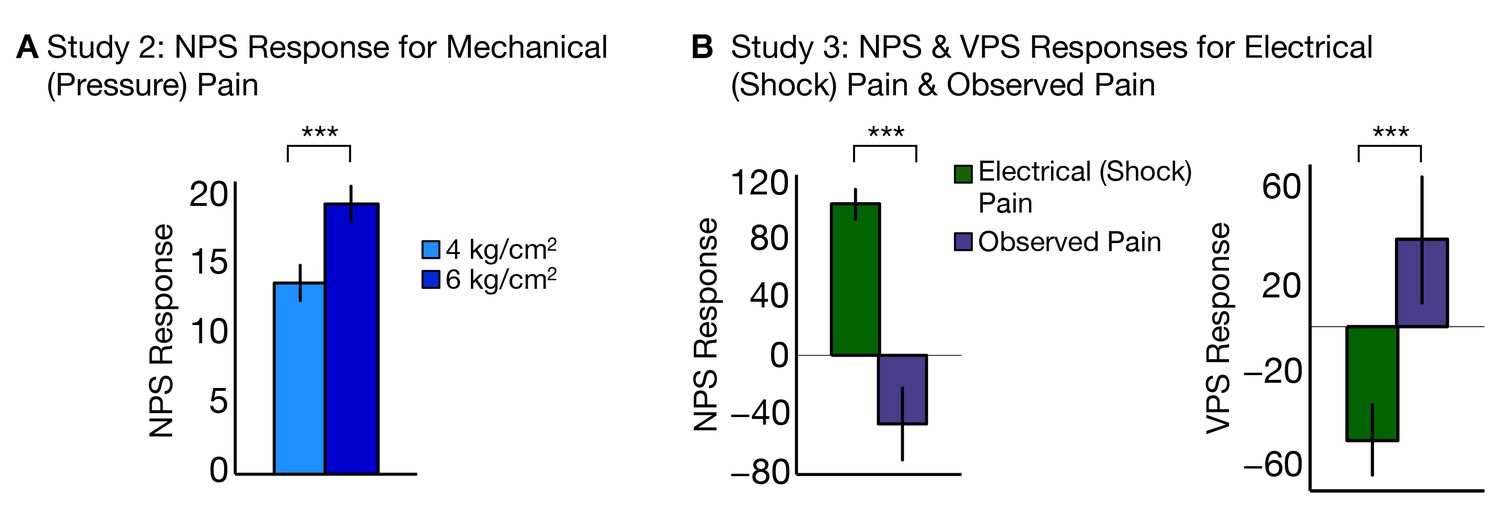
NPS and VPS responses for Study 2 and Study 3.
(A) Study 2 – NPS responses for mechanical (pressure pain) delivered at low and high intensities, (i.e., 4 kg/cm2 and 6 kg/cm2) computed as the dot product of the NPS pattern weights and estimated activation maps for each participant (including within-participant standard error of the mean; total of five trials per level of stimulation per participant; (B) Study 3 – NPS (right) and VPS (left) responses for electrodermal (electrical or shock) pain and observed pain, computed as the dot product of the respective pattern weights for NPS (right) and VPS (left) and estimated activation maps for each participant (including within-participant standard error of the mean.
Appendix 1—figure 1

NPS responses in
(A) (Left): NPS weights from positive regions of the Neurosynth mask for 'pain'; A (Right): Signature response computed as the dot product of the NPS pattern weights and estimated activation maps for each participant (including within-participant standard error of the mean; tUL(27) = 9.26, p<0.0001, tLL(27) = 7.18, p<0.0001 for somatic pain; tUL(27) = −0.56, n.s., tLL(27) = 0.046, n.s., for vicarious pain); B (Left): NPS weights from negative regions of the Neurosynth mask for 'pain'; B (Right): Signature response computed as the dot product of the NPS pattern weights and estimated activation maps for each participant (including within-participant standard error of the mean; tUL(27) = −5.22, p<0.005, tLL(27) = −2.81, p<0.01 for somatic pain; tUL(27) = −1.14, n.s., tLL(27) = −3.05, p<0.01 for vicarious pain).
Appendix 1—figure 2

Somatic pain pattern and analyses.
(A) Thresholded LASSO-PCR (Least Absolute Shrinkage and Selection Operator-regularized Principal Components Regression) derived pattern for somatic pain; B Signature response computed as the dot product of the somatic pain pattern weights and estimated activation maps for each participant (including within-participant standard error of the mean; tUL(27) = 8.06, p<0.0001, tLL(27) = 9.20, p<0.0001, tUL-LL(27) = −0.17, n.s., for somatic pain; tUL(27) = −1.35, n.s., tLL(27) = 0.66, n.s.; tUL-LL(27) = −1.04, n.s., for vicarious pain); C Receiver Operator Characteristic (ROC) plot for two-choice forced-alternative accuracies for somatic and vicarious pain, high and low somatic pain, and high and low vicarious pain (accuracySom-Vic = 89%, p<0.0001, accuracyHsom-Lsom = 96%, p<0.0001; accuracyHvic-Lvic = 50% n.s.).
Appendix 1—figure 3
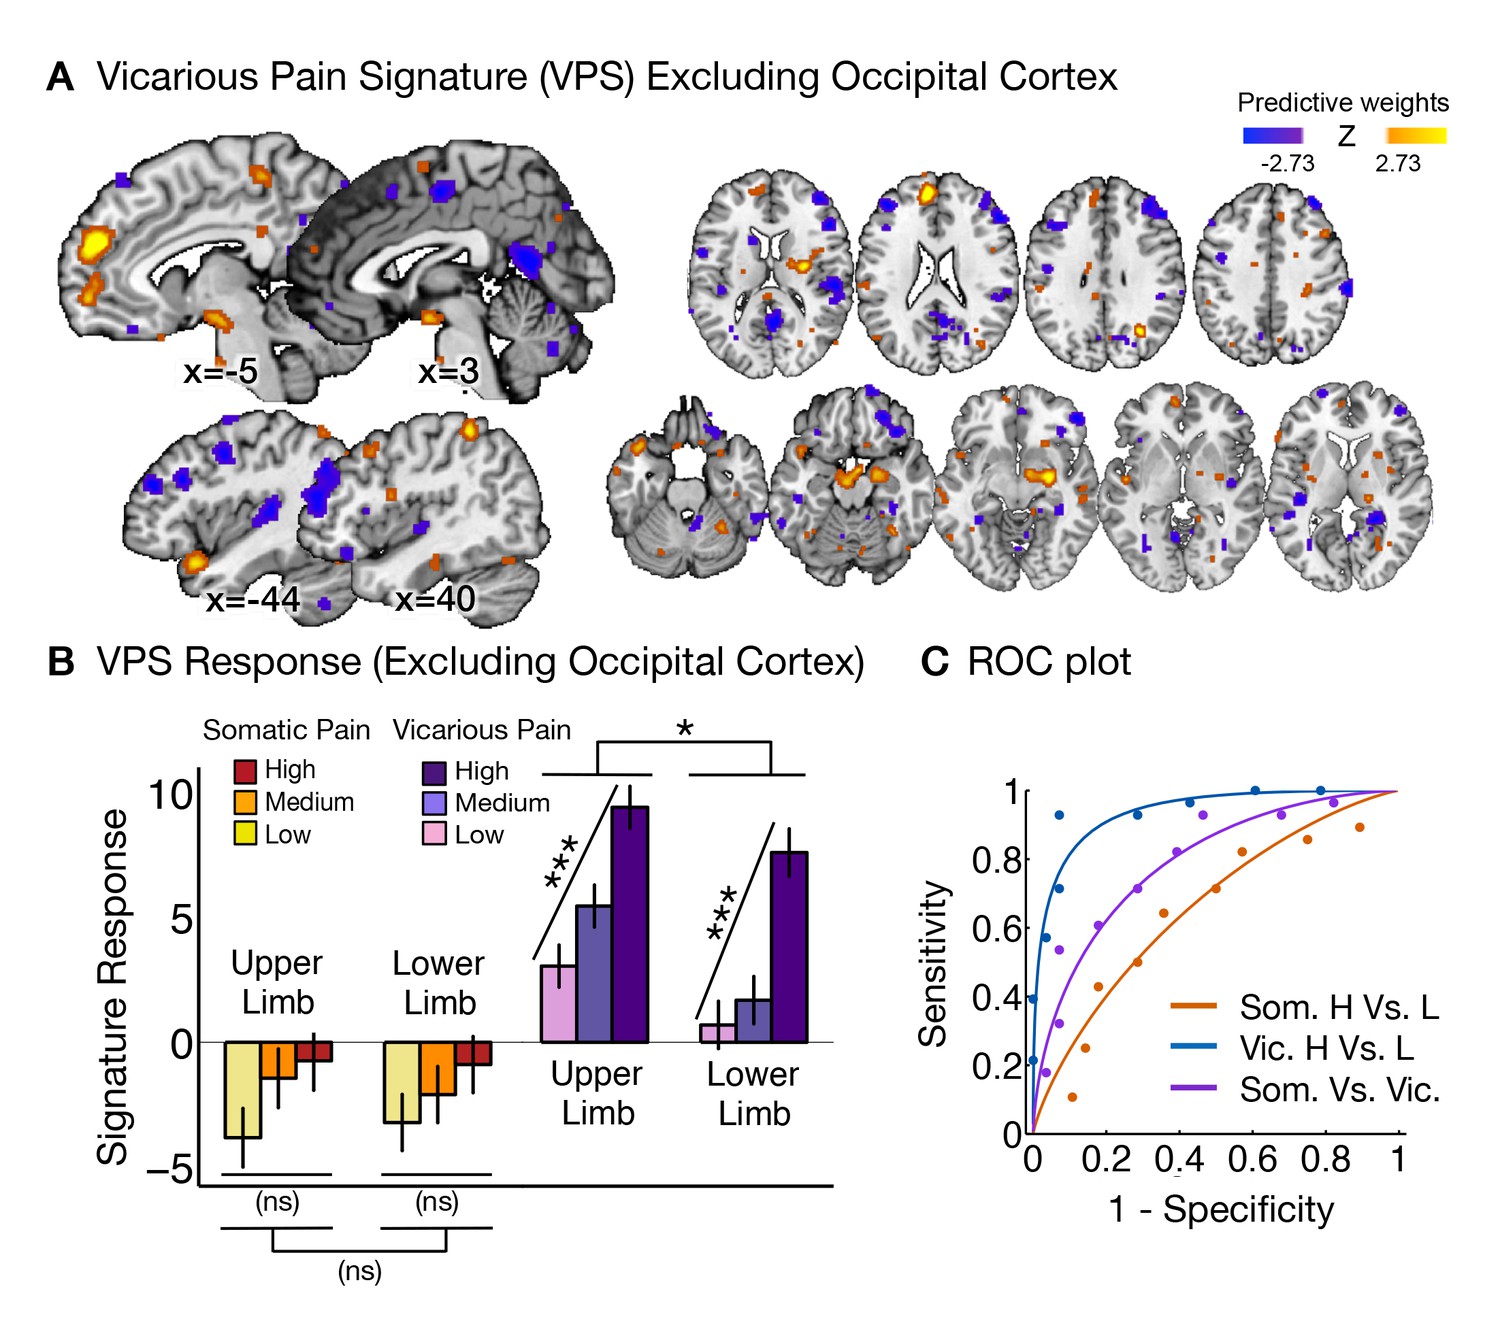
Vicarious pain pattern (excluding occipital cortex) and analyses.
(A) Thresholded LASSO-PCR (Least Absolute Shrinkage and Selection Operator-regularized Principal Components Regression) derived pattern for vicarious pain excluding the occipital cortex; (B) Signature response computed as the dot product of the VPS pattern weights and estimated activation maps for each participant (including within-participant standard error of the mean; tUL(27) = 5.75, p<0.0001, tLL(27) = 5.45, p<0.0001; tUL-LL(27) = 2.21, p<0.05, for vicarious pain; tUL(27) = 1.56, n.s., tLL(27) = 1.23, n.s.; tUL-LL(27) = 0.03, n.s., for somatic pain); (C) Receiver Operator Characteristic (ROC) plot for two-choice forced-alternative accuracies for vicarious and somatic pain, high and low vicarious pain, and high and low somatic pain (accuracyVic-Som = 71%, p<0.05; accuracyHvic-Lvic = 93%, p<0.0001; accuracyHsom-Lsom = 64%, n.s.).
Appendix 1—figure 4
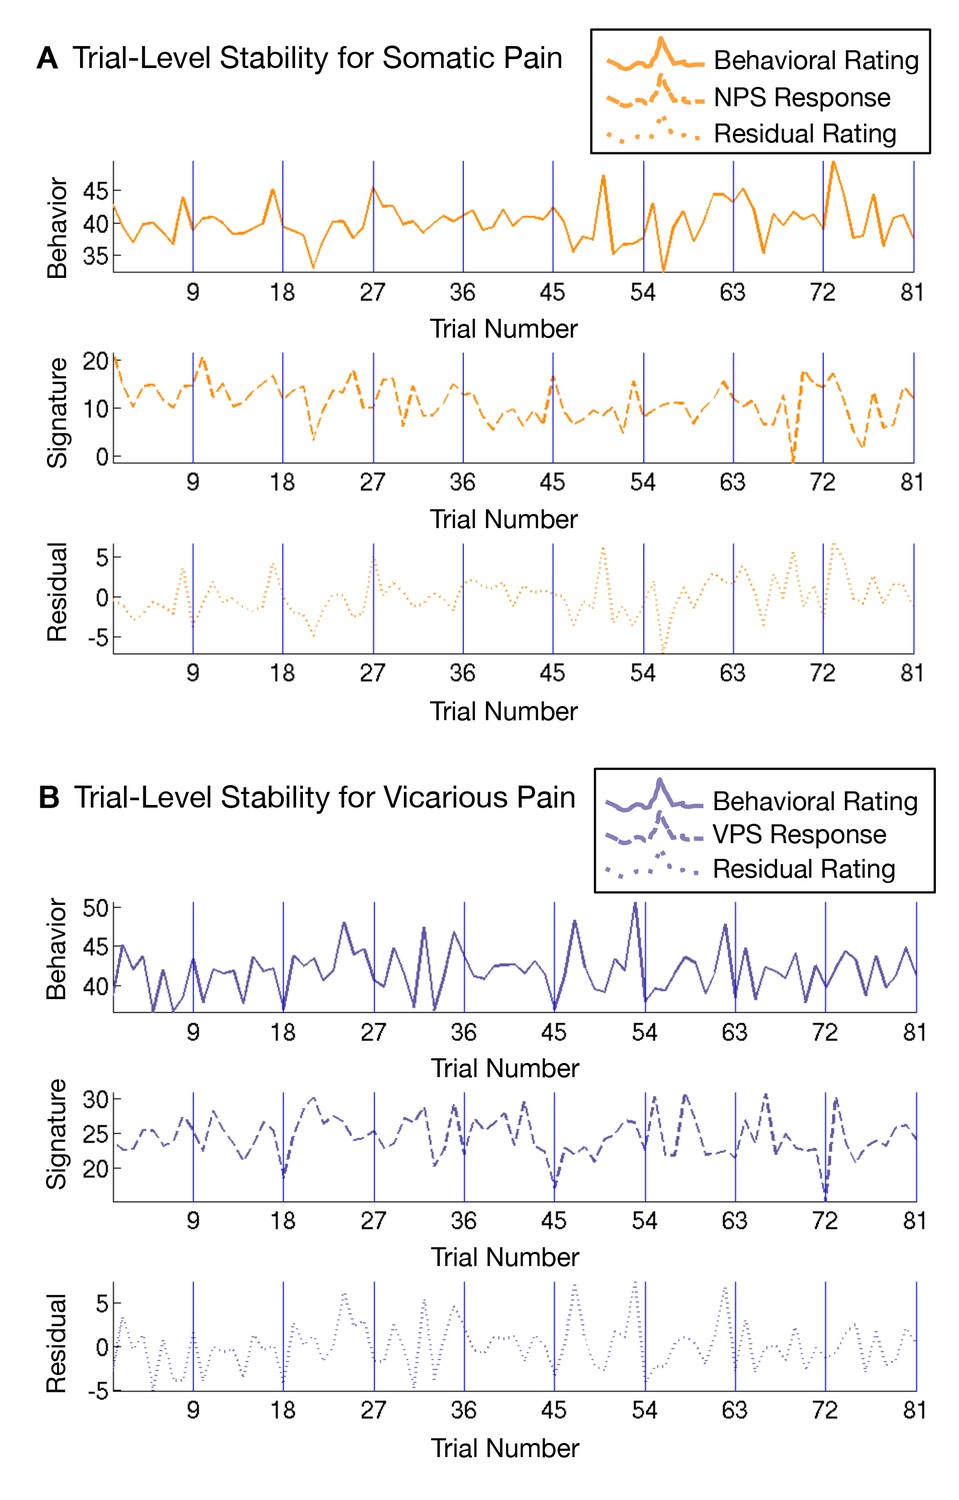
Trial-level stability of the NPS and VPS responses across all trials.
The first row depicts subjective ratings for somatic pain (top panel) and vicarious pain (bottom panel) respectively, the second row depicts the ratings predicted by NPS (top panel) and VPS (bottom panel) respectively, and the third row shows the residual rating variance not predicted by the NPS (top panel) and VPS (bottom panel) respectively.
Appendix 1—figure 5

Within-participant cross-validated average signature responses.
(A) Somatic pain pattern response collapsed across body site (including within-participant standard error of the mean; tHsom-Lsom(27) = 10.65, p<0.0001, average accuracyHigh-Low = 89%, p<0.0001; tHvic-Lvic(27) = −0.13, n.s); (B) Vicarious pain pattern response collapsed across body site (including within-participant standard error of the mean; tHvic-Lvic(27) = 3.37, p<0.005, average accuracyHigh-Low = 71%, p<0.05; tHsom-Lsom(27) = 0.93, n.s).
Appendix 1—figure 6
Upper limb versus lower limb analyses with left-right flipped testing data.
(A) Accuracy statistics for upper limb versus lower limb weight maps for somatic and vicarious pain; (B) Receiver Operating Characteristic (ROC) curves for two-choice forced alternative tests for somatic and vicarious pain and high and low stimulations for each pain type.
Download links
A two-part list of links to download the article, or parts of the article, in various formats.
Downloads (link to download the article as PDF)
Open citations (links to open the citations from this article in various online reference manager services)
Cite this article (links to download the citations from this article in formats compatible with various reference manager tools)
Somatic and vicarious pain are represented by dissociable multivariate brain patterns
eLife 5:e15166.
https://doi.org/10.7554/eLife.15166


