Frontal beta-theta network during REM sleep
- Boston University, United States
- Harvard Medical School and Massachusetts General Hospital, United States
Figures
Figure 1
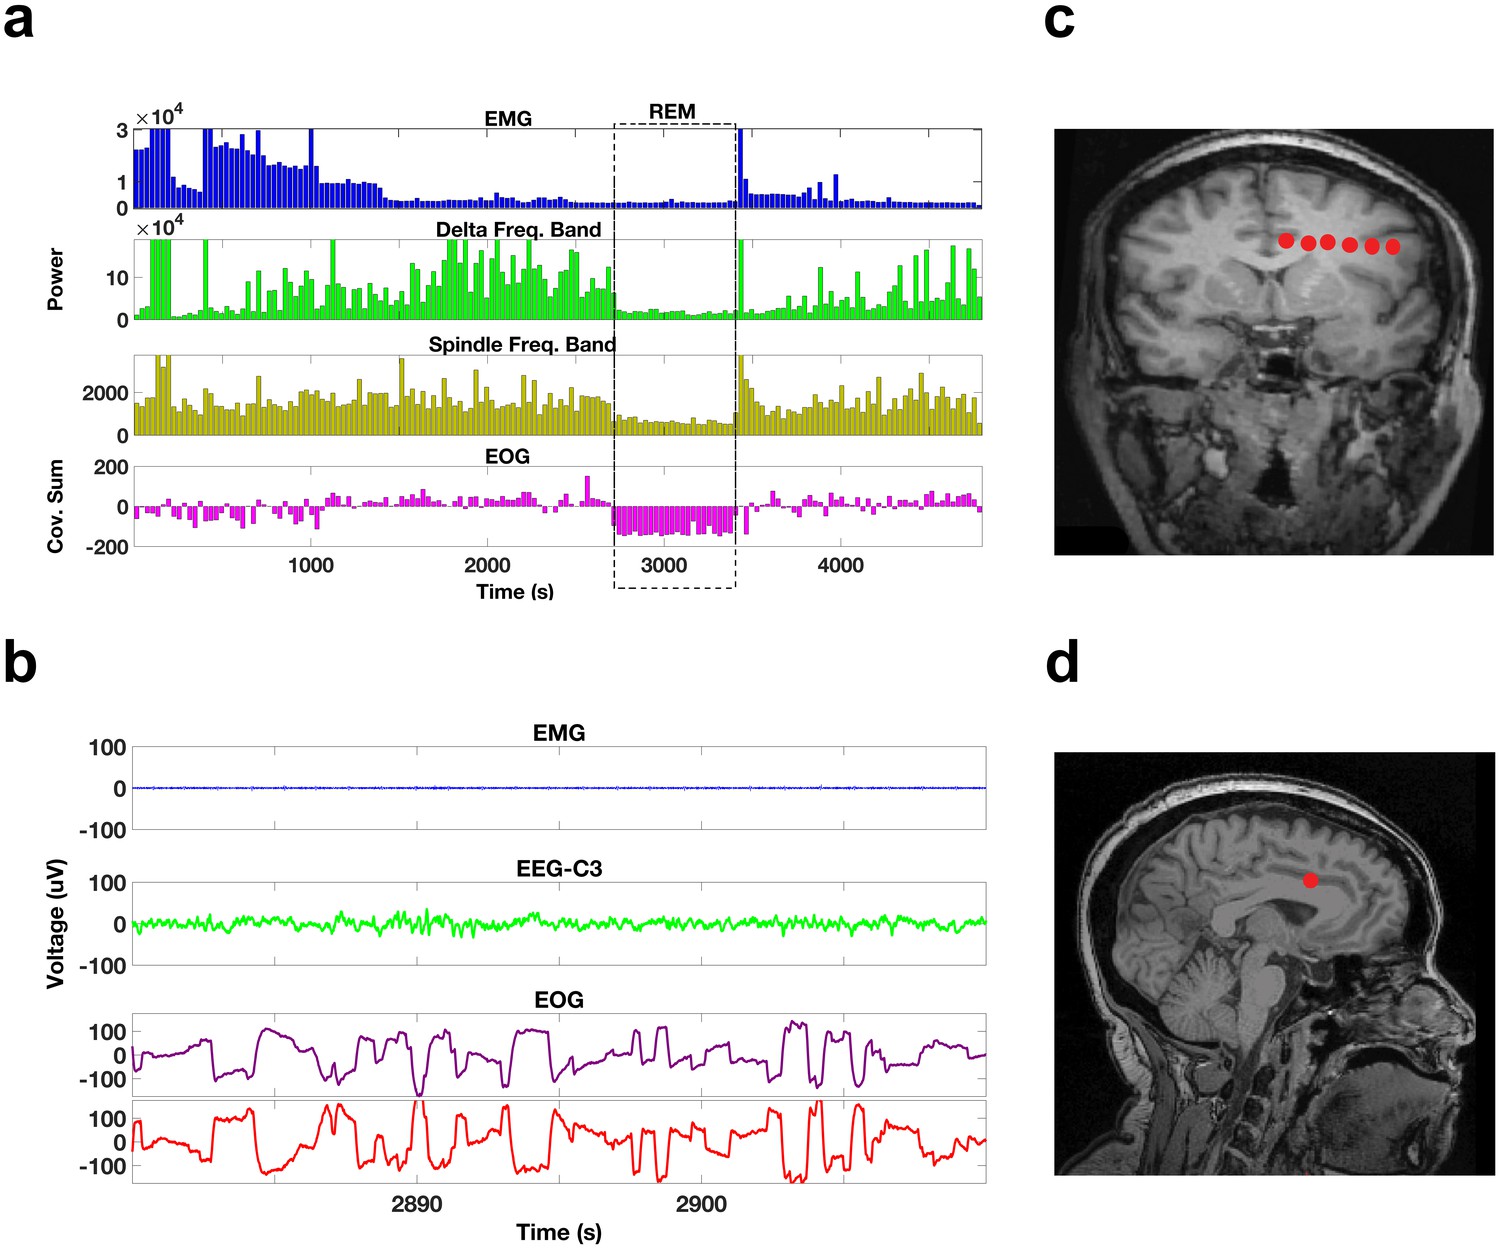
Sleep recordings and electrode localization.
(a) EMG, delta band, and spindle band power, and the cross-covariance of the EOG leads during a portion of a night’s sleep from one subject (bin size 30 s). The dotted box indicates a period of REM sleep. During this REM period, EMG, delta, and spindle band powers are all relatively low and the sums of the cross-covariance functions over the 30 s bins are negative. The EOG montages are arranged such that rapid eye movements result in voltage deflections of the opposite polarity resulting in negative cross-covariance values during rapid eye movements. (b) Voltage traces of the EMG, scalp EEG, and EOG (purple trace for left eye, red trace for right eye) during a 30 s period from the REM episode demarcated by the dotted box in (a). Note that the EMG is of relatively low voltage, the EEG is of low voltage and irregular, and there are rapid eye movements in the EOG with the deflections in the right and left EOG of opposite polarity. (c) A coronal MRI image showing the locations of the electrode contacts (red dots) of a frontal electrode in one of the subjects. (d) A sagittal MRI image showing the location of the most medial contact in (c), which is located in the anterior cingulate.
Figure 2
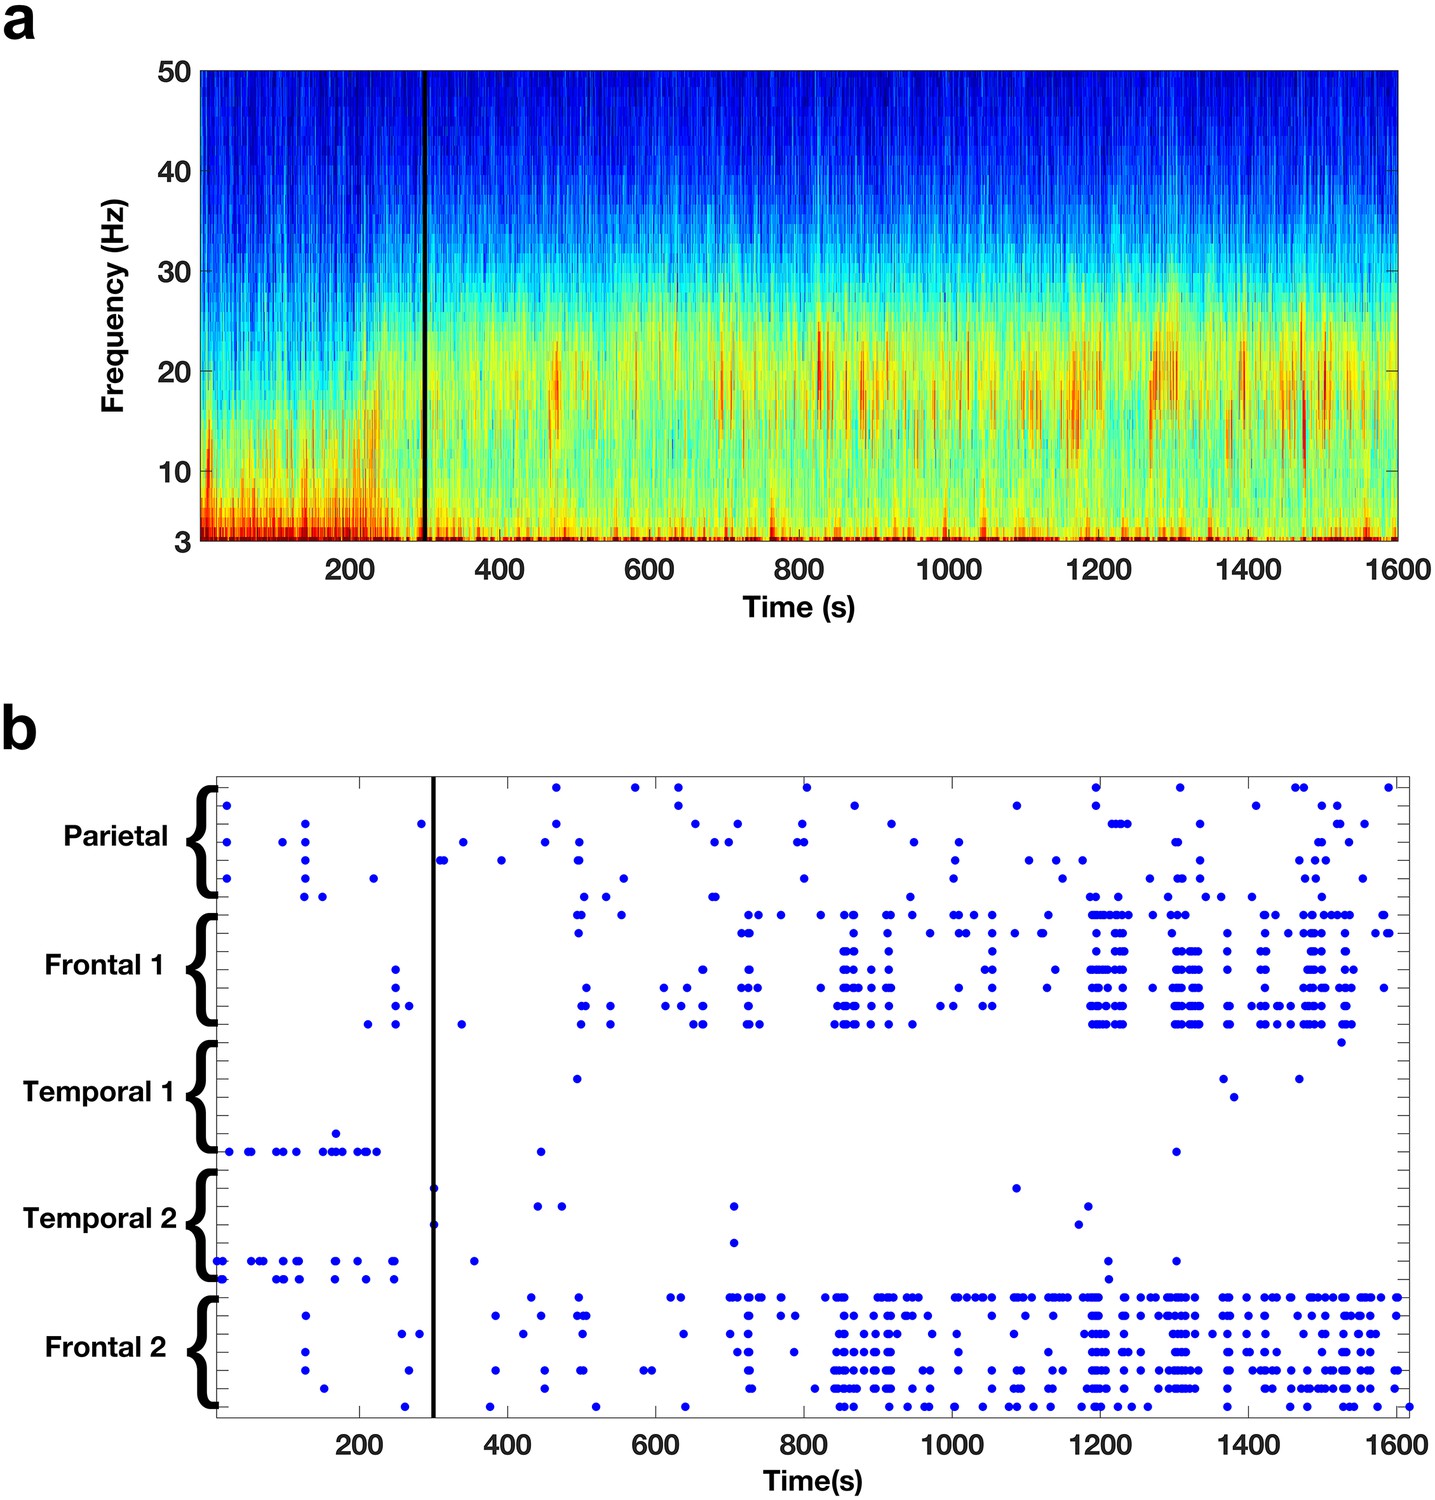
Oscillatory activity across scales.
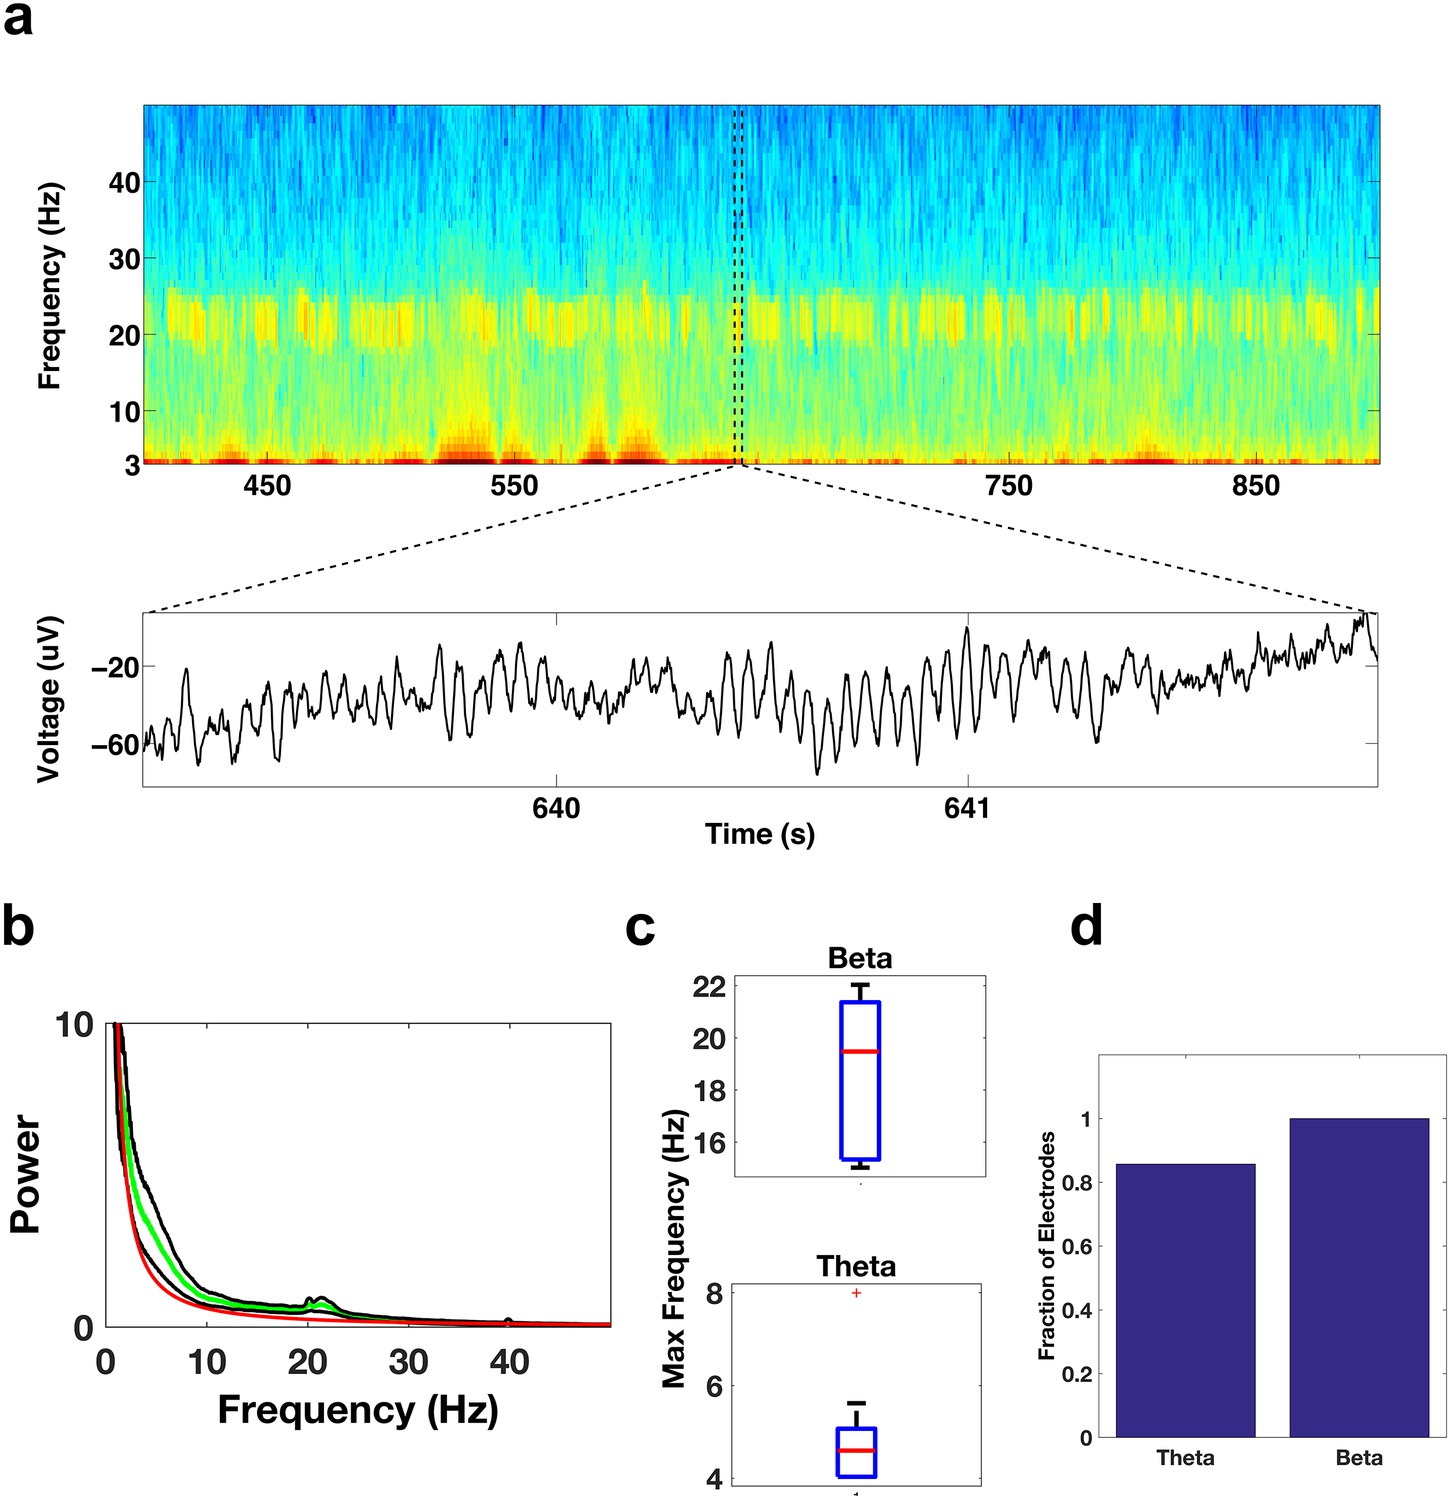
(a) Spectrogram shows the activity pattern detected from a bipolar derivation of an electrode located in the frontal cortices during REM sleep. The black line indicates the beginning of the REM sleep episode. (b) Pattern of beta activity across all the electrode contacts of one subject. There are two frontal depth electrodes (Frontal 1 and Frontal 2), two temporal depth electrodes (Temporal 1 and Temporal 2), and one parietal depth electrode (Parietal). Each depth electrode has eight contacts. Each row represents activity from one bipolar derivation. Blue dots indicate periods in which beta power in a given contact was 3.0 standard deviations above the median. The black line indicates the beginning of the REM sleep episode.
Figure 3 with 2 supplements
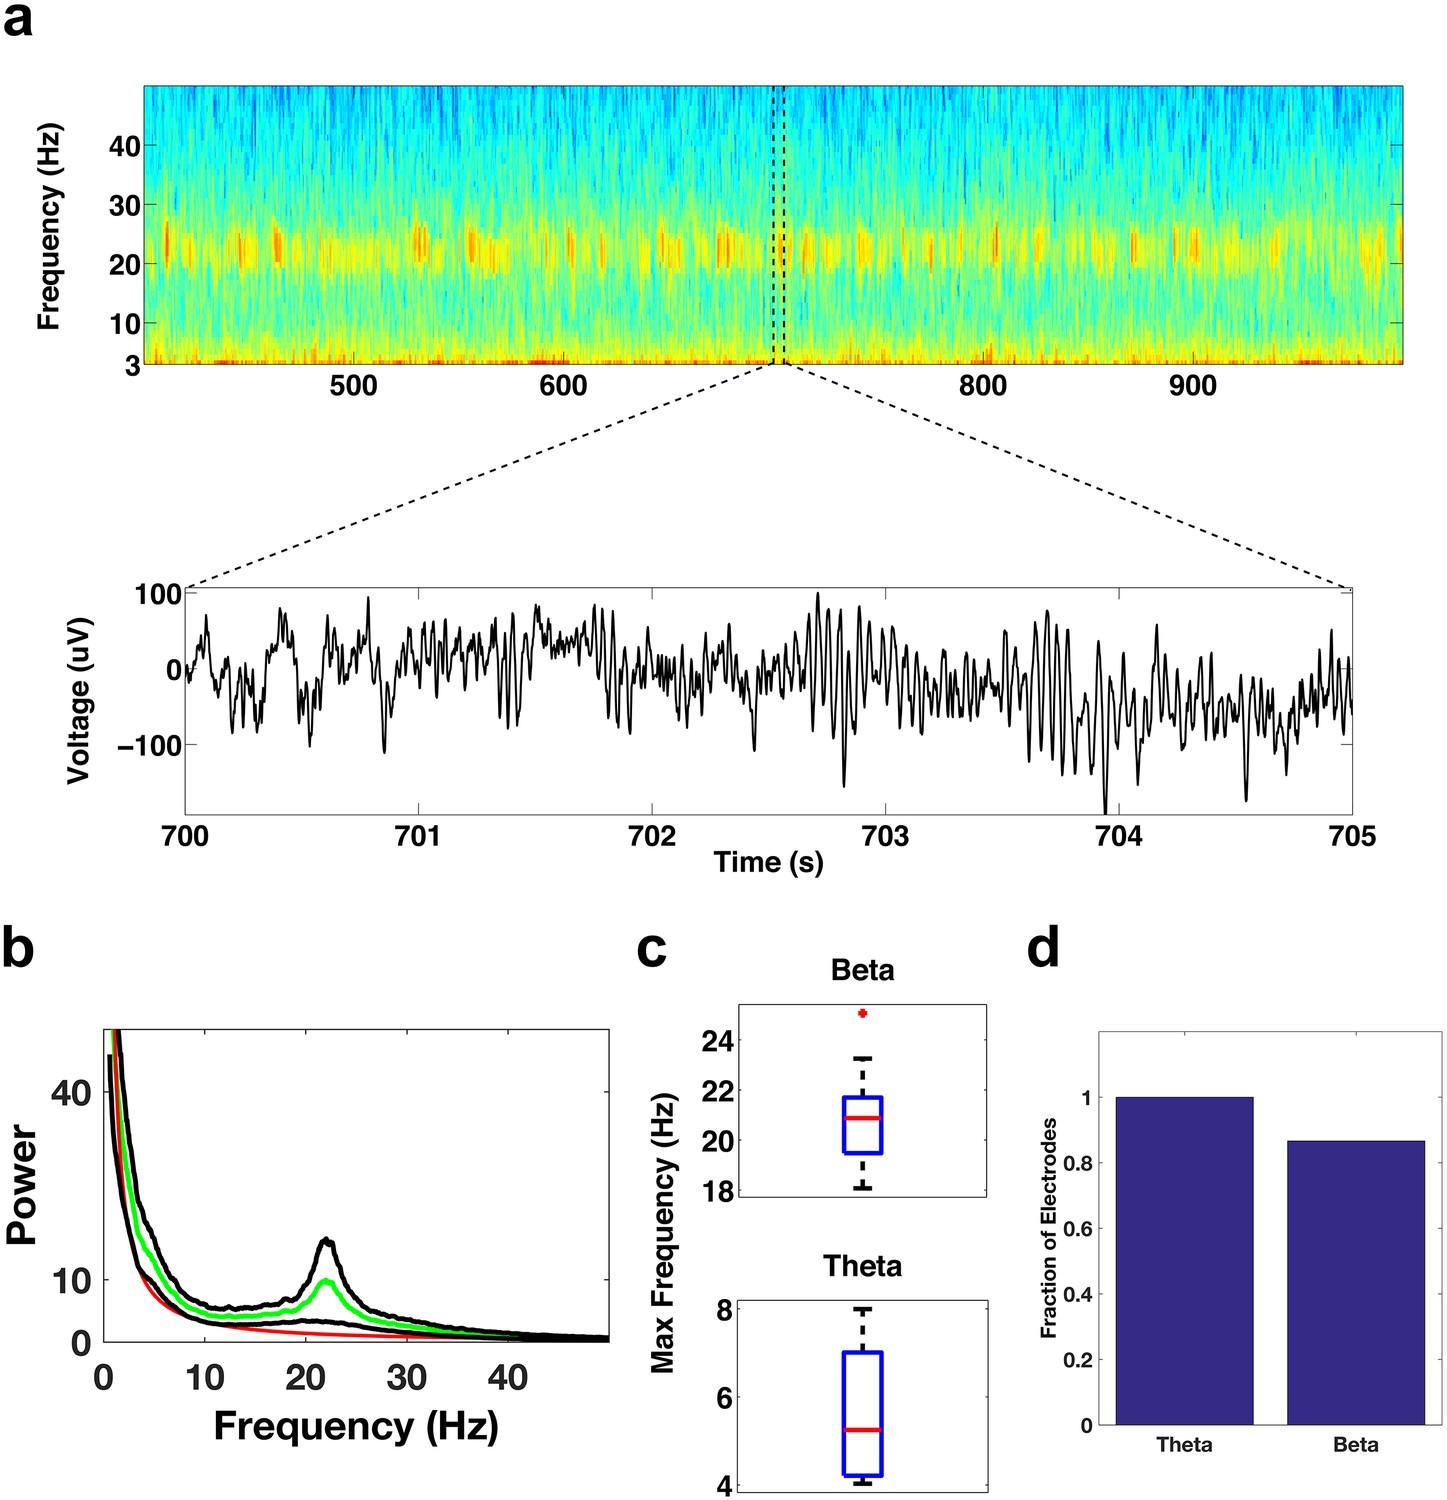
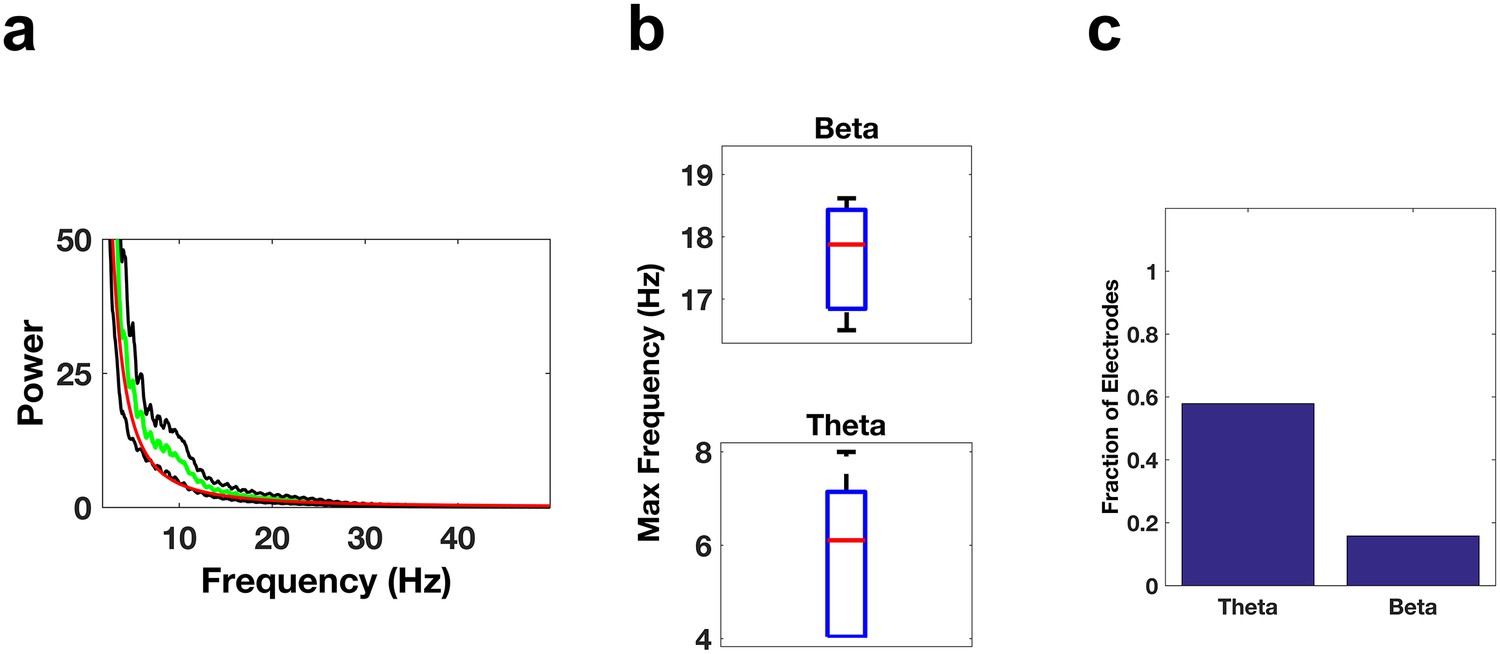
Oscillatory activity in the DLPFC.
(a) Spectrogram shows the activity pattern of an electrode in the DLPFC during a period of REM sleep. The lower panel shows the voltage trace during the period demarcated by the dotted lines in the spectrogram. (b) Average power spectrum across all subjects (green trace) of electrodes located in the DLPFC. The red trace is the average of the fits of the power spectra to the model a*fb and the black traces are ± the standard error of the mean. (c) Whisker plot of the peak frequency in the beta band (top) and peak frequency in the theta band (bottom) for electrodes showing significant power in those bands. (d) Bar graph showing the fraction of total electrodes in the DLPFC with significant beta or theta power.
Figure 3—figure supplement 1
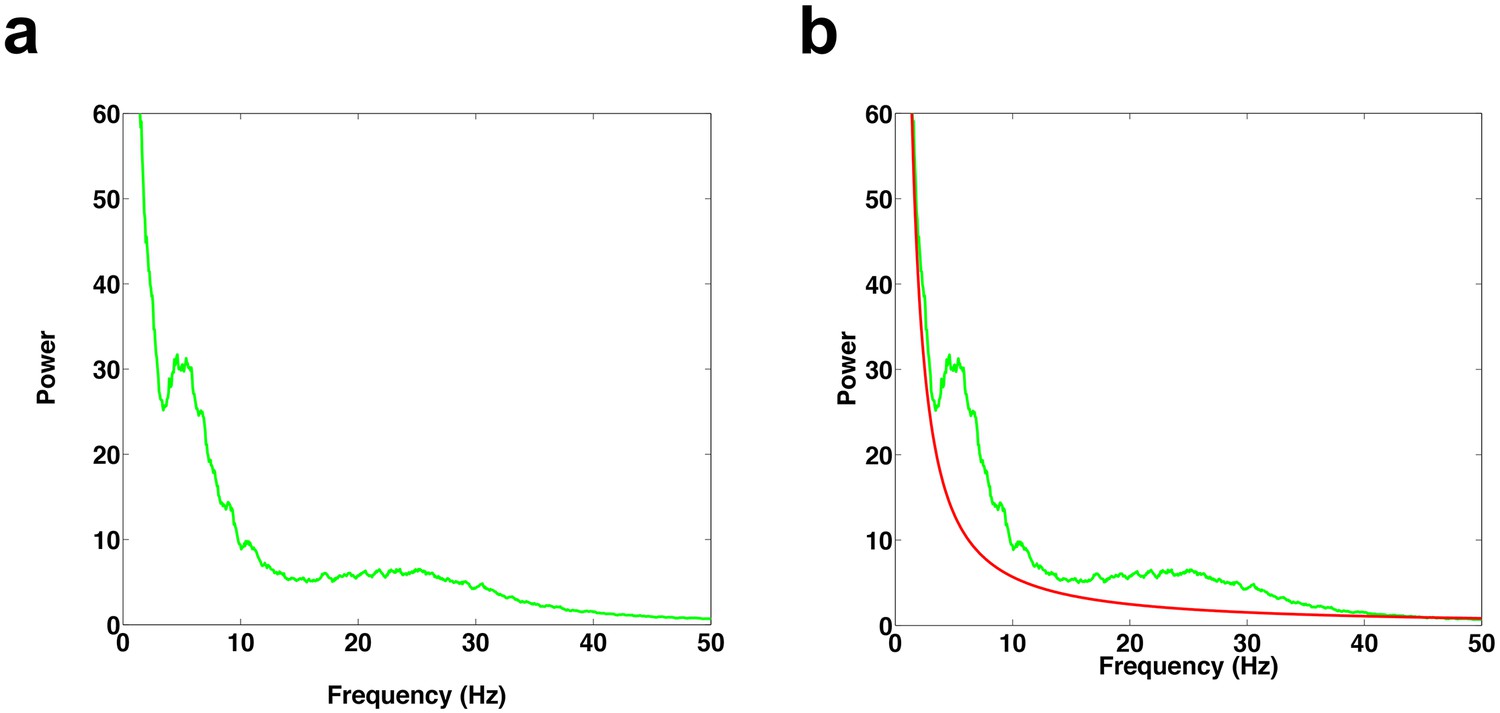
1/f fit of power spectrum.
(a) Example power spectrum during REM period. (b) Power spectrum (green trace) and 1/f fit (red trace), which was determined using a robust least-squares regression.
Figure 3—figure supplement 2
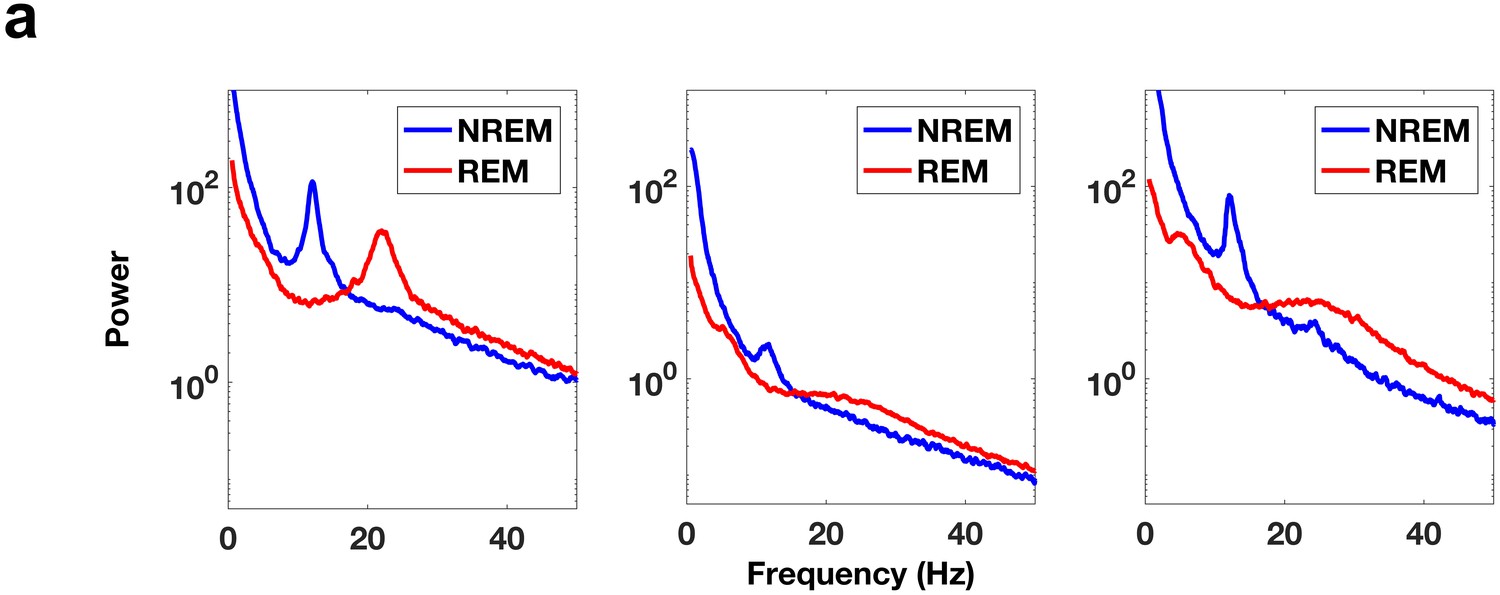
Comparison of REM and NREM power spectra.
(a) Power spectra during NREM sleep and REM sleep from electrode contacts in the DLPFC. Each panel is from a different subject. Note the clear peak in the spindling band (11–16 Hz) in the NREM power spectrum traces.
Figure 4 with 1 supplement
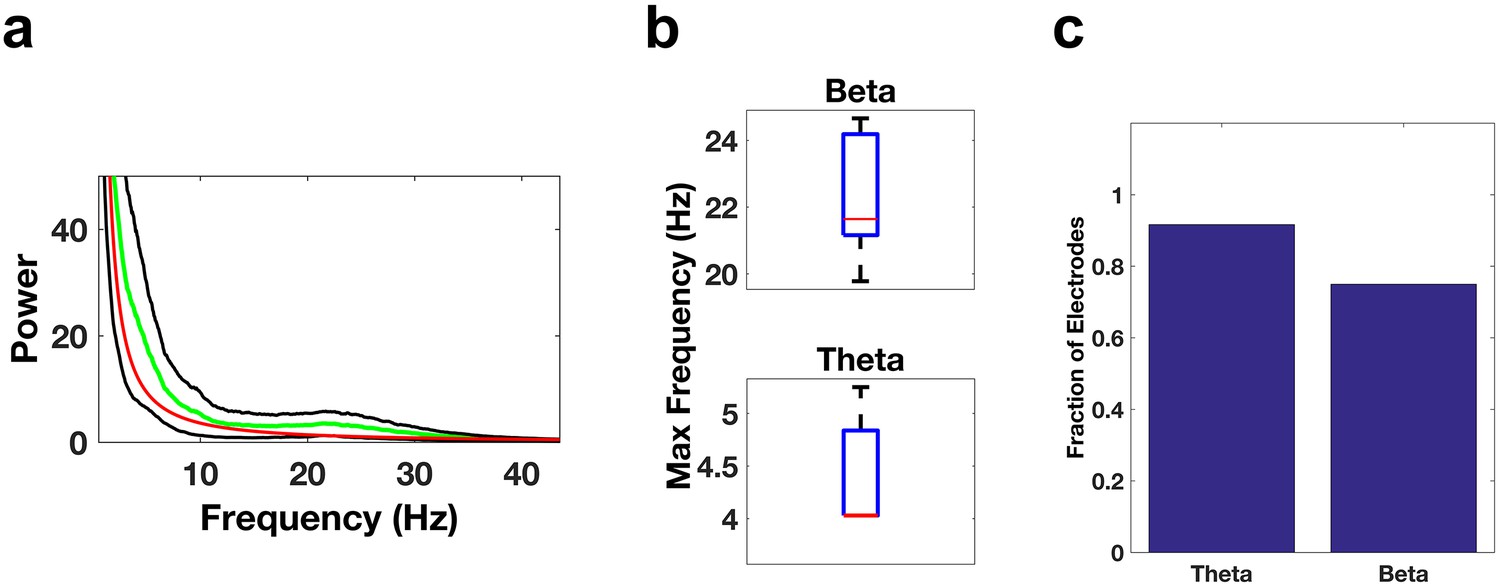
Oscillatory activity in the ACC.
Same as Figure 3a–d, but for electrode contacts in the ACC.
Figure 4—figure supplement 1
Oscillatory activity in the IFG.
(a) Average power spectrum averaged across all subjects (green trace) for electrodes located in the IFG. The red trace is the average of the fits of the power spectra to the model a*f^b and the black traces are ± the standard error of the mean. (b) Whisker plots of the peak frequencies in the beta band (top) or theta band (bottom) for electrodes showing significant power in those bands. (c) Bar graph of the fraction of total electrodes in the IFG showing significant beta or theta power.
Figure 5
Oscillatory Activity Outside the Frontal Cortices.
(a–c) Same as Figure 3b–d, but for electrode contacts in the middle temporal gyrus.
Figure 6
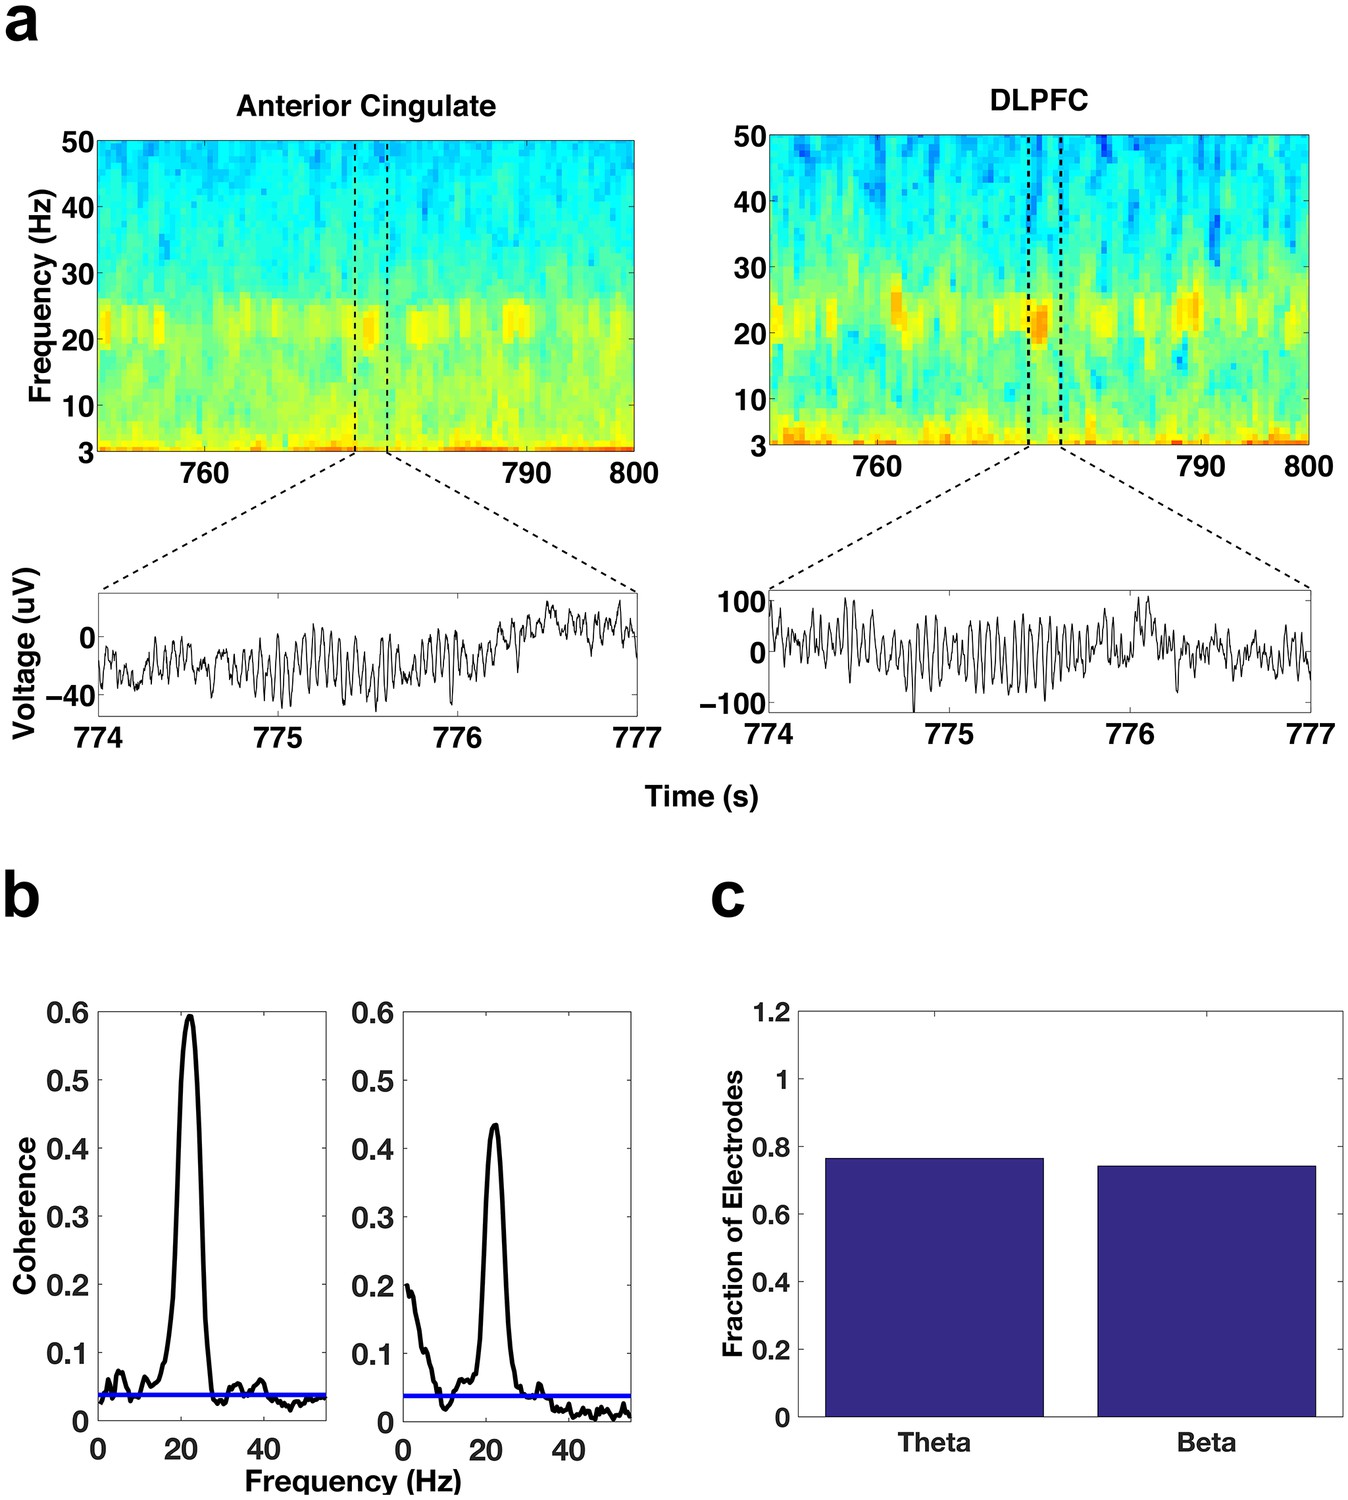
Simultaneous oscillatory activity in the DLPFC and ACC.
(a) Spectrograms showing the simultaneous activity patterns of an electrode in the ACC (left) and an electrode in the DLPFC (right) during a period of REM sleep. Lower panels show the voltage traces during the periods demarcated by the dotted lines in the spectrograms. (b) Coherence during REM sleep between the DLPFC electrode depicted above and the two ACC contacts on the ipsilateral side of the DLPFC contact. The coherence plot on the left is for the ACC contact depicted above. (c) Bar graph of the fraction of total ACC-DLPFC electrode pairs showing significant theta or beta coherence.
Figure 7
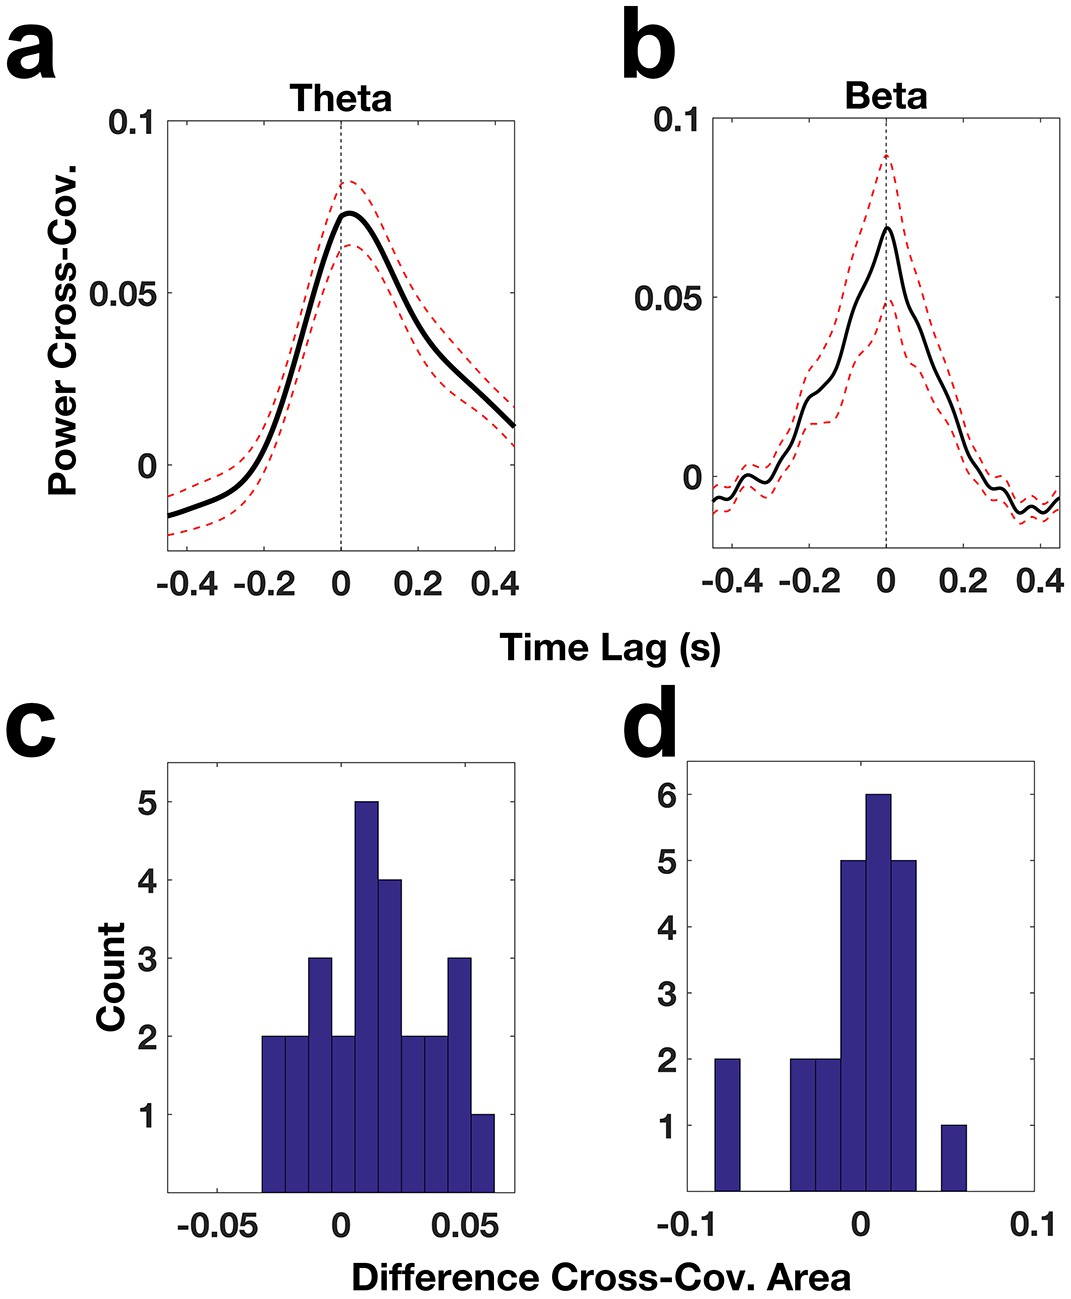
ACC and DLPC oscillatory power relationships.
(a) Cross-covariance of theta power across ACC-DLPFC electrode pairs (solid black trace). The dotted red lines correspond to the standard error of the mean and the dotted black line indicates the zero lag time point. (b) Same as (a) but for beta power. (c) Histogram of the difference between the area under the theta power cross-covariance function from −100 ms to 0 ms and the area under the function from 0 ms to 100 ms. (d) Same as (c) but for the beta power cross-covariance function.
Figure 8
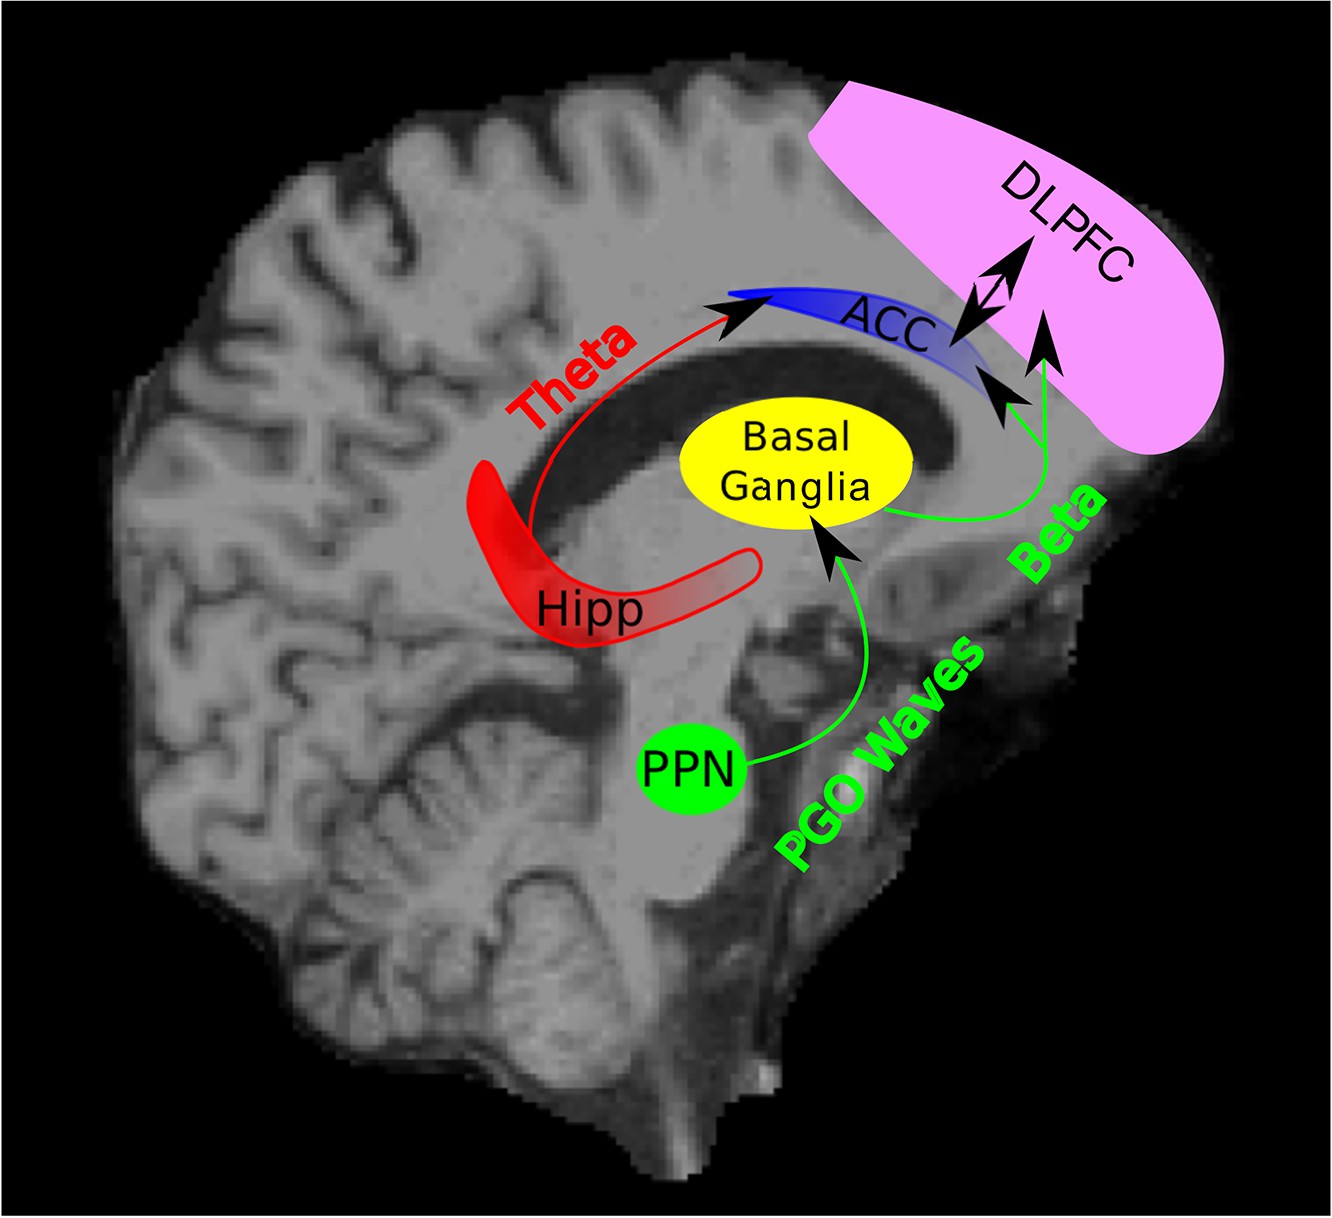
Schematic of Hypothesized Circuit Involved in REM Sleep Memory Consolidation.
PGO waves originating from the PPN may trigger beta activity in the basal ganglia. This beta activity in the basal ganglia may then be transmitted to cortical areas including the ACC and DLPFC. The triggering of the beta activity by the PGO waves may begin a dialogue between the basal ganglia, ACC, and DLPC (as well as other areas) through the beta band in which a motor plan is evaluated, ultimately leading to motor memory consolidation. Theta activity may be a channel through which the hippocampus provides contextual and spatial information about a given memory to the ACC and other parts of the frontal cortex. (PPN = Pedunculopontine tegmental nucleus and Hipp = Hippocampus).
Tables
Table 1
Patient Information. Each row provides a patient’s demographic information and diagnostic information about their epilepsy.
Subject | Gender | Age | Handedness | Diagnosis | Imaging |
|---|---|---|---|---|---|
1 | F | 45 | R | Bilateral temporal lobe epilepsy | MRI-normal PET-hypometabolism right side |
2 | F | 55 | R | Bilateral temporal lobe epilepsy | MRI-mild T2 hyperintensity and volume loss (right greater than left) in the mesial temporal lobes |
3 | F | 45 | R | Multifocal temporal parietal-occipital epilepsy | MRI- multifocal FlAIR abnormalities - second lymphoma? |
4 | F | 42 | Ambidextrous | Multifocal epilepsy with involvement of bilateral temporal lobes | MRI- nonspecific T2 hyperintensities PET-without clear lesion |
5 | M | 53 | Left | Focal epilepsy etiology and localization unknown | MRI- normal PET- normal |
Download links
A two-part list of links to download the article, or parts of the article, in various formats.
Downloads (link to download the article as PDF)
Open citations (links to open the citations from this article in various online reference manager services)
Cite this article (links to download the citations from this article in formats compatible with various reference manager tools)
Frontal beta-theta network during REM sleep
eLife 6:e18894.
https://doi.org/10.7554/eLife.18894


