Subthalamic nucleus gamma activity increases not only during movement but also during movement inhibition
- Medical Research Council Brain Network Dynamics Unit at the University of Oxford, United Kingdom
- John Radcliffe Hospital, University of Oxford, United Kingdom
- University College London Institute of Neurology, United Kingdom
Figures
Figure 1

Behavioural task and representative data.
(A) Schematic of the task in the STOP condition (top row) and in the control condition (2nd row). In the STOP condition participants had to tap (=ellipses) to a metronome (=rectangles) and stop after 5–9 taps. The red ellipse denotes a tap that was unsuccessfully stopped. (B) Pressure sensor, FDI muscle activity and goniometer data from one representative patient. Black lines are trials where the tapping movement after the stop signal was successfully stopped, red lines are trials where stopping failed. The markers around 0 ms represent the temporal offset between the last regular sound and the tap (o = successful stop trials, x = failed stop trials). The markers at 680 ms show the time of the stop signal, which was always triggered relative to the last regular tap that was registered by the pressure sensor at 0 ms. Note that the black and red trajectories overlap, which shows that stopping performance did not depend on the preceding movement trajectory.
Figure 2
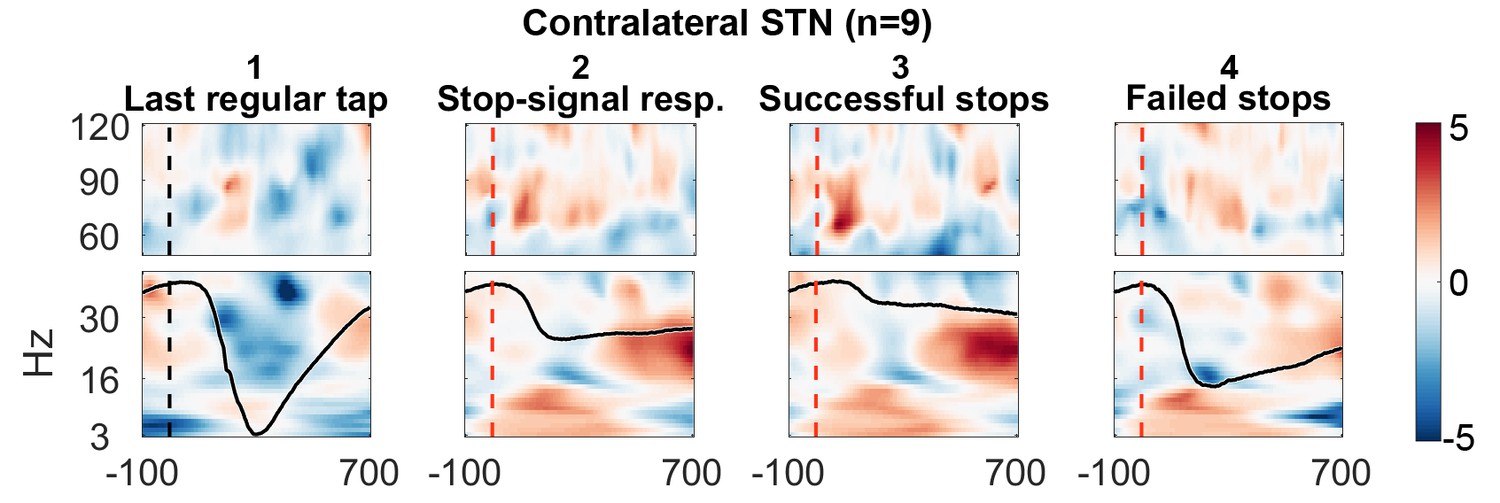
Contralateral STN power changes around the stop signal.
T-scores calculated over all patients (n = 9, normalized by the average power during regular tapping) for (1) the last regular tap aligned to the timepoint when the stop signal would have occurred if it would have been delivered one tap earlier (vertical dashed line). The black line shows the tapping movement measured by the goniometer. The downward movement was accompanied by a beta decrease and gamma increase as expected. The following three columns show changes in response to the stop signal (vertical dashed line) (2) irrespective of whether stopping was successful or not, (3) during successful stops only, and (4) during failed stops only. Note that when a stop signal was present and especially when stopping was successful (column 3), gamma increased strongly. Differences between 2–1 and 3–4 are contrasted in Figure 3. The tapping trajectory of failed stops does not reach the bottom line even though the finger touched the table because trajectories were normalized to the minimum of all four trajectories, which occured with the last regular tap, where the spring was extended more vigorously than during attempted inhibition.
Figure 3 with 3 supplements
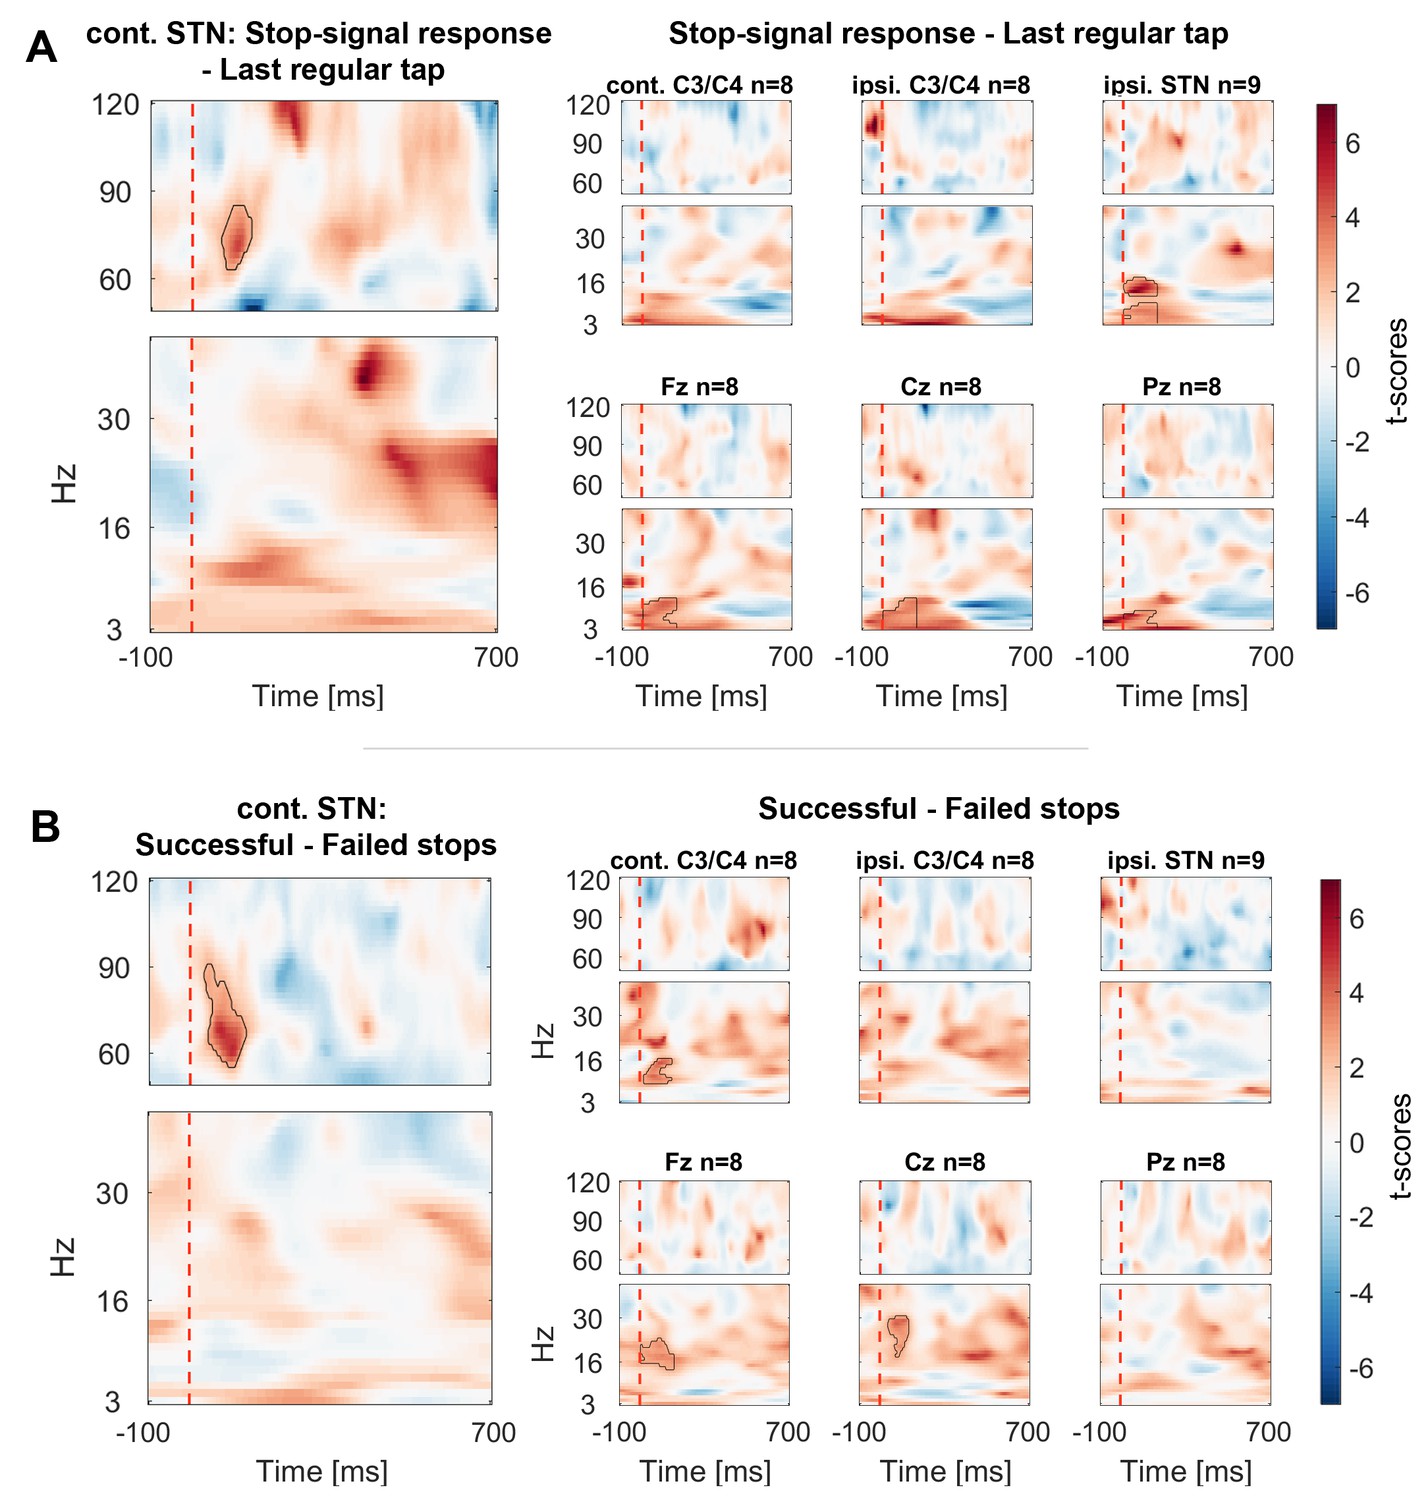
Contrasts between power changes following the stop signal.
(A) T-scores calculated over all patients of the contrast between power aligned to the stop signal (vertical dashed line) averaged across all trials irrespective of stopping performance (Figure 2.2) and the regular tap made before (Figure 2.1, aligned to where the stop signal would have occurred if it would have been presented one tap earlier). Red clusters denote that power significantly increased in response to the stop signal. (B) T-scores of power differences between successful and failed stops. Red clusters denote that power was significantly higher if participants successfully inhibited the upcoming tap (Figure 2.3–2.4).
-
Figure 3—source data 1
MATLAB data file containing source data related to Figure 3.
Data matrices (subject * frequency * time) for individual channels are stored at the respective fields in the structure data.Figure 3A.below40Hz for frequencies below 40 Hz and in data.Figure 3A.above60Hz for frequencies in the gamma range. The frequencies for each column are denoted in the field ‘freqs’ and the time in seconds in the field ‘time_in_sec’. The field ‘stoppingWin’ provides the critical time window of interest between the stop signal and timing of the unsuccessfully stopped tap.
- https://doi.org/10.7554/eLife.23947.007
Figure 3—figure supplement 1
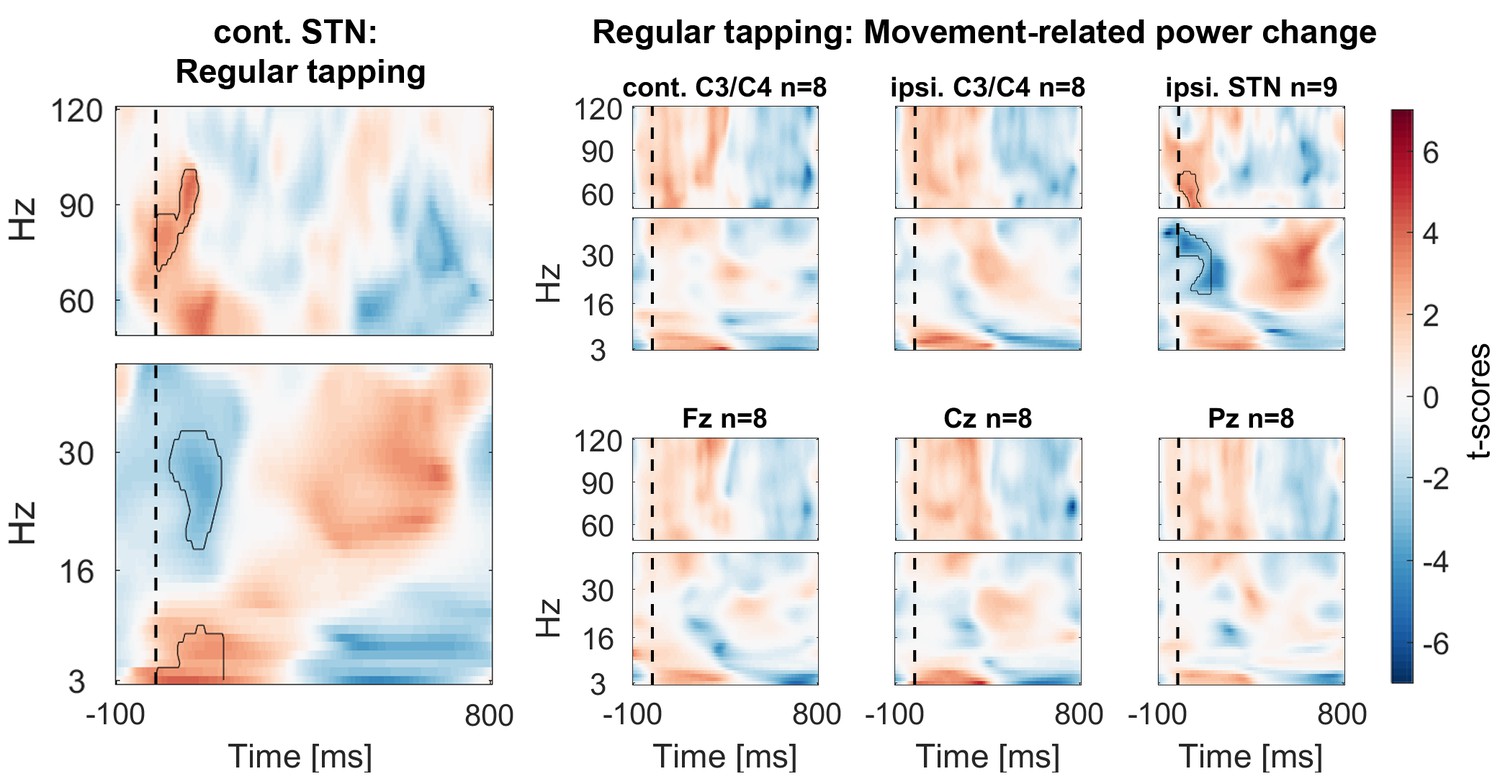
Power time-course during regular tapping averaged across all patients.
Spectra were tested for significant power modulation locked to the tap in a 0:156 ms window (matched in size to the test-window for the main Figure 3) after tap onset (= dashed line). As power was normalized by the average power of one full tap cycle including movement, the effects were relatively small and would not survive multiple-comparison correction over the full time-window. However, movement-related beta decrease and gamma increase relative to a pre-movement baseline has been repeatedly reported before (Tan et al., 2013; Androulidakis et al., 2007).
Figure 3—figure supplement 2

Peak frequencies of movement- and stop-related power changes.
Power for individual frequencies between 3–120 Hz was averaged over time between the stop signal and the mean time of failed taps (156 ms later) for stop-related changes (right and middle plot). Bold thick lines show the average across subjects and coloured lines show individual subjects. For movement-related power changes (left plot), the window was aligned to the time of each tap onset as shown in Figure 3—figure supplement 1. The movement-related gamma increase was broader and weaker than the stop-related increase. Dotted lines show the peak frequency in the gamma range (>40 Hz). The middle plot shows the difference between power in response to the stop signal irrespective of stopping outcome relative to the last regular tap (corresponding to Figure 3A). The right plot shows the difference between successful vs. failed stops (corresponding to Figure 3B). Power differences in frequencies lower than 50 Hz were highly variable, whereas power was consistently increased around 70 Hz in response to the stop signal, especially during successful stopping.
Figure 3—figure supplement 3
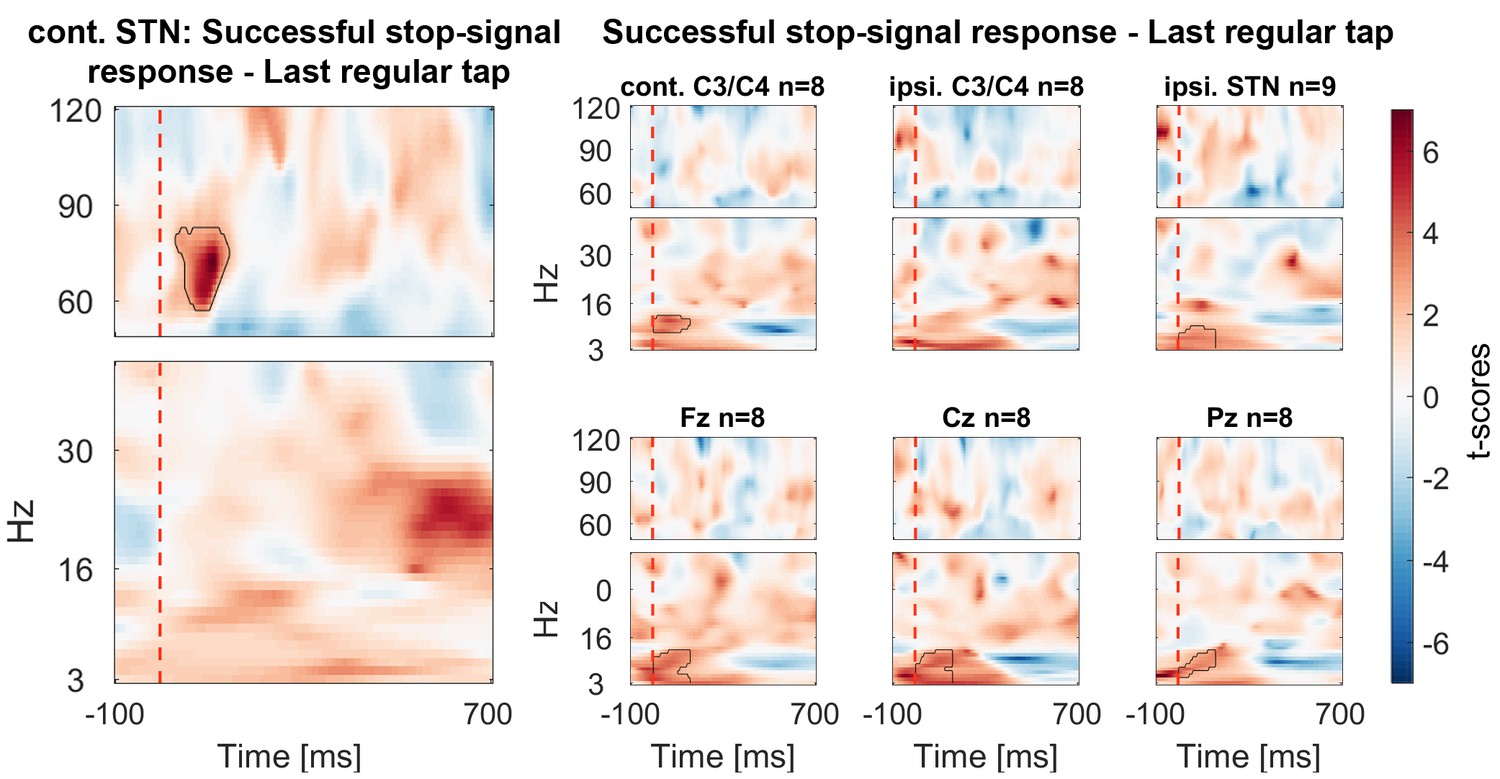
Power changes following the stop signal when only successful stop trials are considered (averaged across all patients).
T-scores of the contrast between power of all successful stop trials aligned to the stop signal (vertical dashed line) and the regular tap done before (aligned to where the stop signal would have occurred if it would have been presented one tap earlier). Significant clusters are similar as in the main Figure 3A.
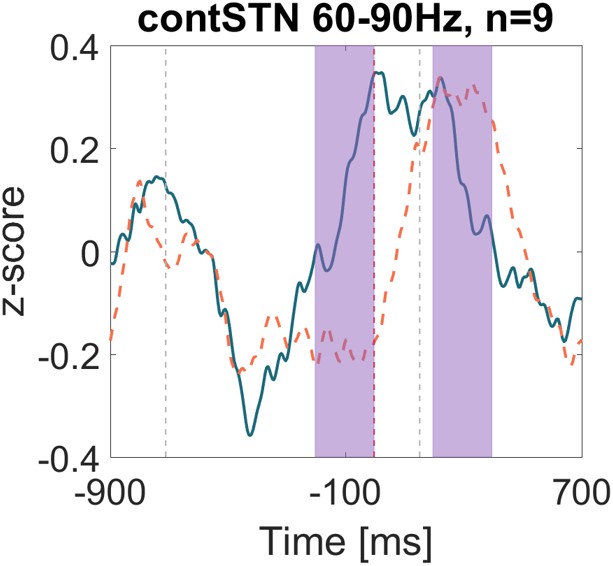
Figure 4 with 3 supplements
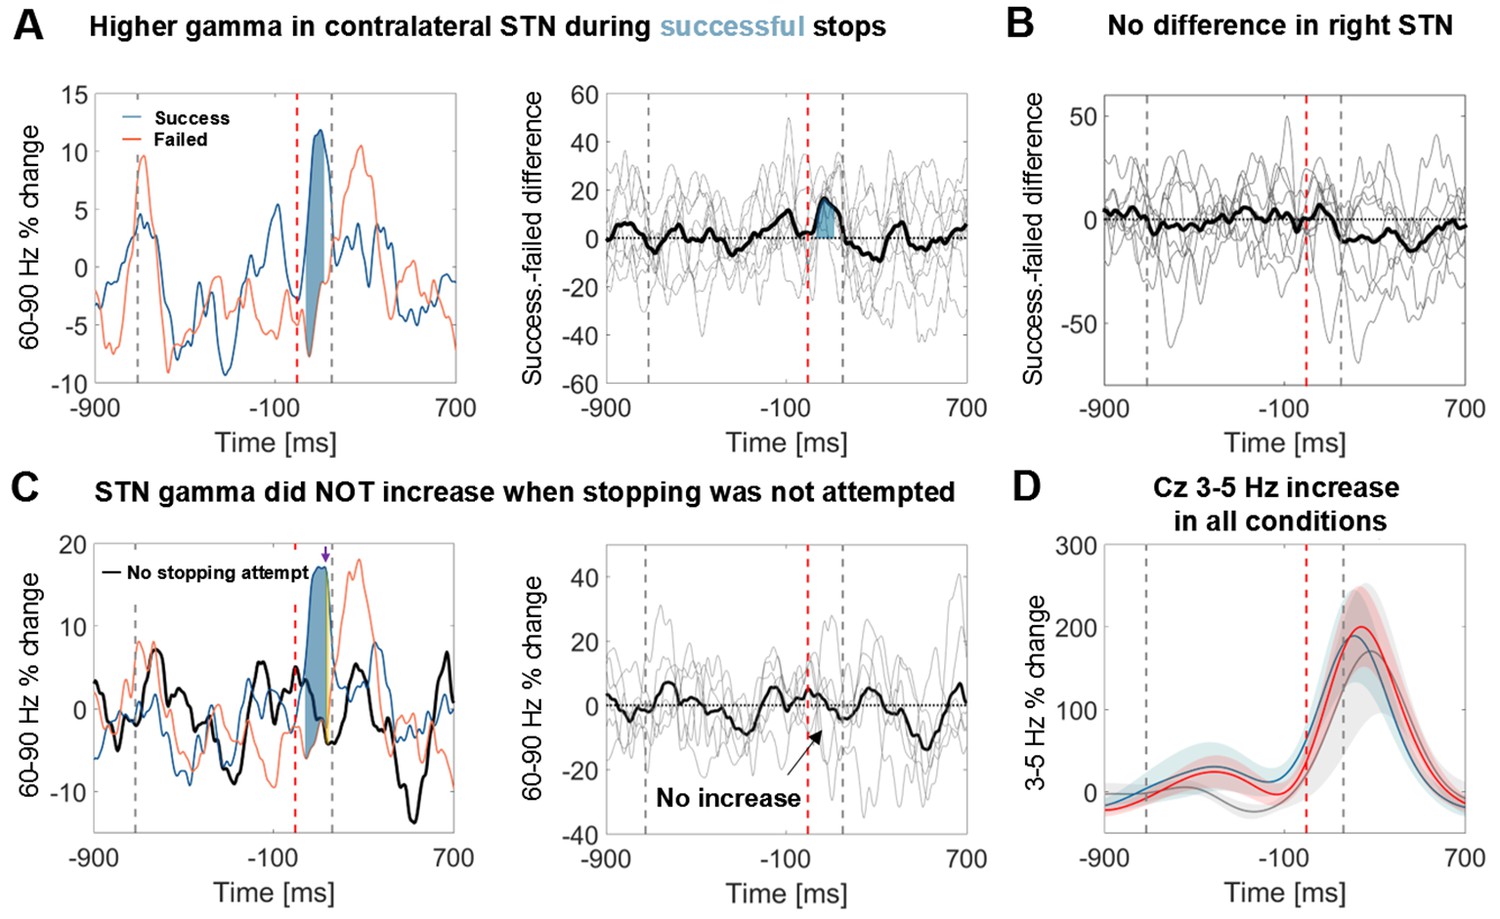
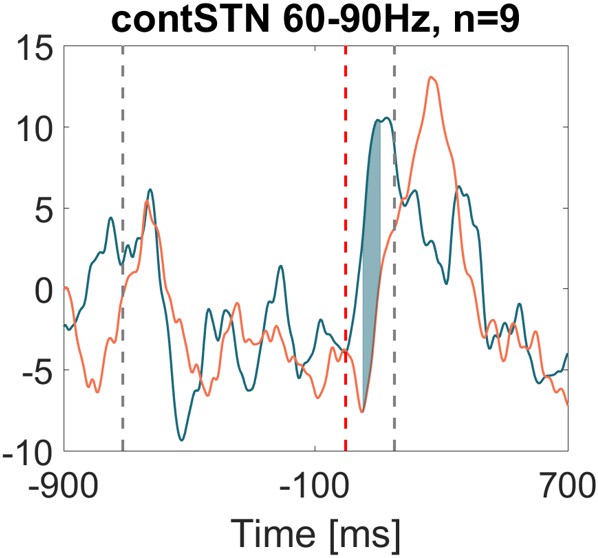
Power time course in the STN averaged across patients relative to the stop signal.
(A) 60–90 Hz gamma power was significantly higher when stopping was successful (left, blue line). The first grey dashed line denotes the average time of the last regular tap. The grey dashed line after the stop signal (red dashed line) denotes the average time of all failed taps. This difference was consistent across patients (middle panel; bold black line denotes the average difference between successful and failed trials with the individual differencess in grey; n = 9). Filled blue areas show cluster-based corrected significant differences. (B) This difference was not present in the right STN (n = 9; ipsilateral in 6). (C) Gamma in contralateral STN did not increase when stopping was not attempted (black line = control condition, the plot in the middle column shows individual power time courses in the control condition; n = 6). Filled blue areas show cluster-based corrected significant differences between successful and unsuccessful stopping. The yellow filled area indicated by the purple arrow in the leftmost plot shows where power from successful stopping significantly differed from the control condition if uncorrected for multiple comparisons. (D) The 3–5 Hz increase in Cz (n = 6) was similar irrespective of whether stopping was successful (blue), unsuccessful (red) or whether it was not even attempted (grey). Shaded areas denote standard errors of the mean.
-
Figure 4—source data 1
MATLAB data file containing source data related to Figure 4.
The average power of successful and failed stopping attempts (subject * time) are stored in the fields ‘successStop’ and ‘failedStop’, respectively. The field ‘time_in_sec’ provides the time in seconds for each data point. The field ‘stoppingWin’ provides the critical time window of interest between the stop signal and timing of the unsuccessfully stopped tap. For Figure 4C+D the field ‘controlCond’ contains the average power of the control condition, where stopping was not attempted.
- https://doi.org/10.7554/eLife.23947.012
Figure 4—figure supplement 1
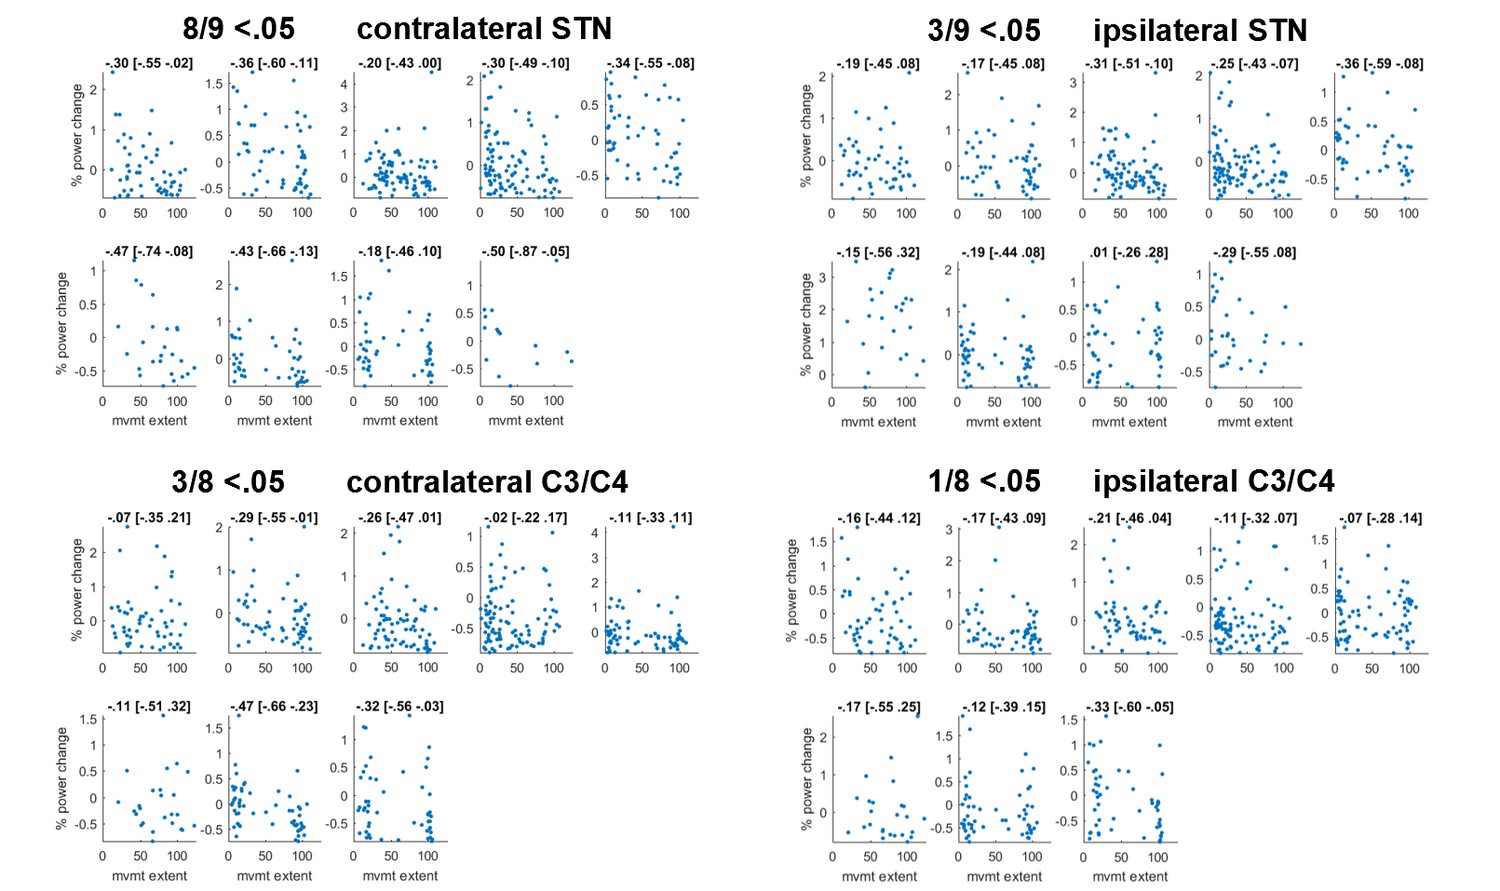
Scatter plot of correlations between movement extent (x-axis) and 60–90 Hz gamma relative to baseline (y-axis).
Subplots show individual participants. For each subject, gamma power yielding the maximum correlation (detected anywhere between 60–90 Hz and 0:156 ms after the stop signal, considering that optimal frequencies and time points may differ across subjects) is shown. The number of points can differ within each patient if an electrode was more prone to artefacts and thus more trials were excluded. Plot titles denote Spearman’s rho followed by its 95% bootstrapped confidence interval. In all but one subject correlations were significant in the contralateral STN.
Figure 4—figure supplement 2
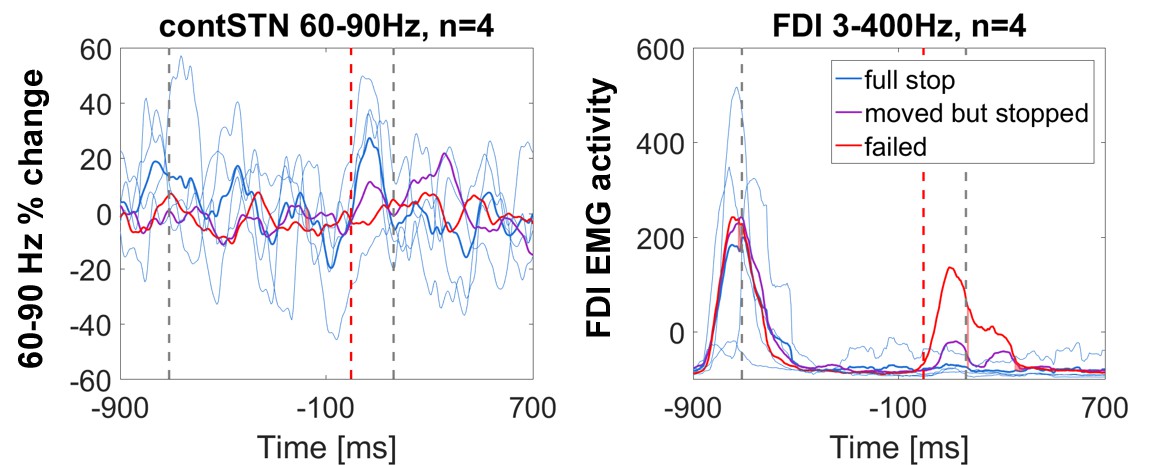
Power time course relative to the stop signal in patients who stopped fully in at least five trials.
60–90 Hz gamma power was highest during full stops (defined as < 10% movement extent), it increased halfway when the tap was interrupted halfway and it did not increase when stopping failed. Thin blue lines denote the time course of full stops from the four individual subject. The FDI EMG activity to the left shows that the muscle activity pattern was reversed, i.e. EMG activity was absent when gamma increased quickly, which demonstrates that gamma did not only increase when the tap was interrupted halfway.
Figure 4—figure supplement 3
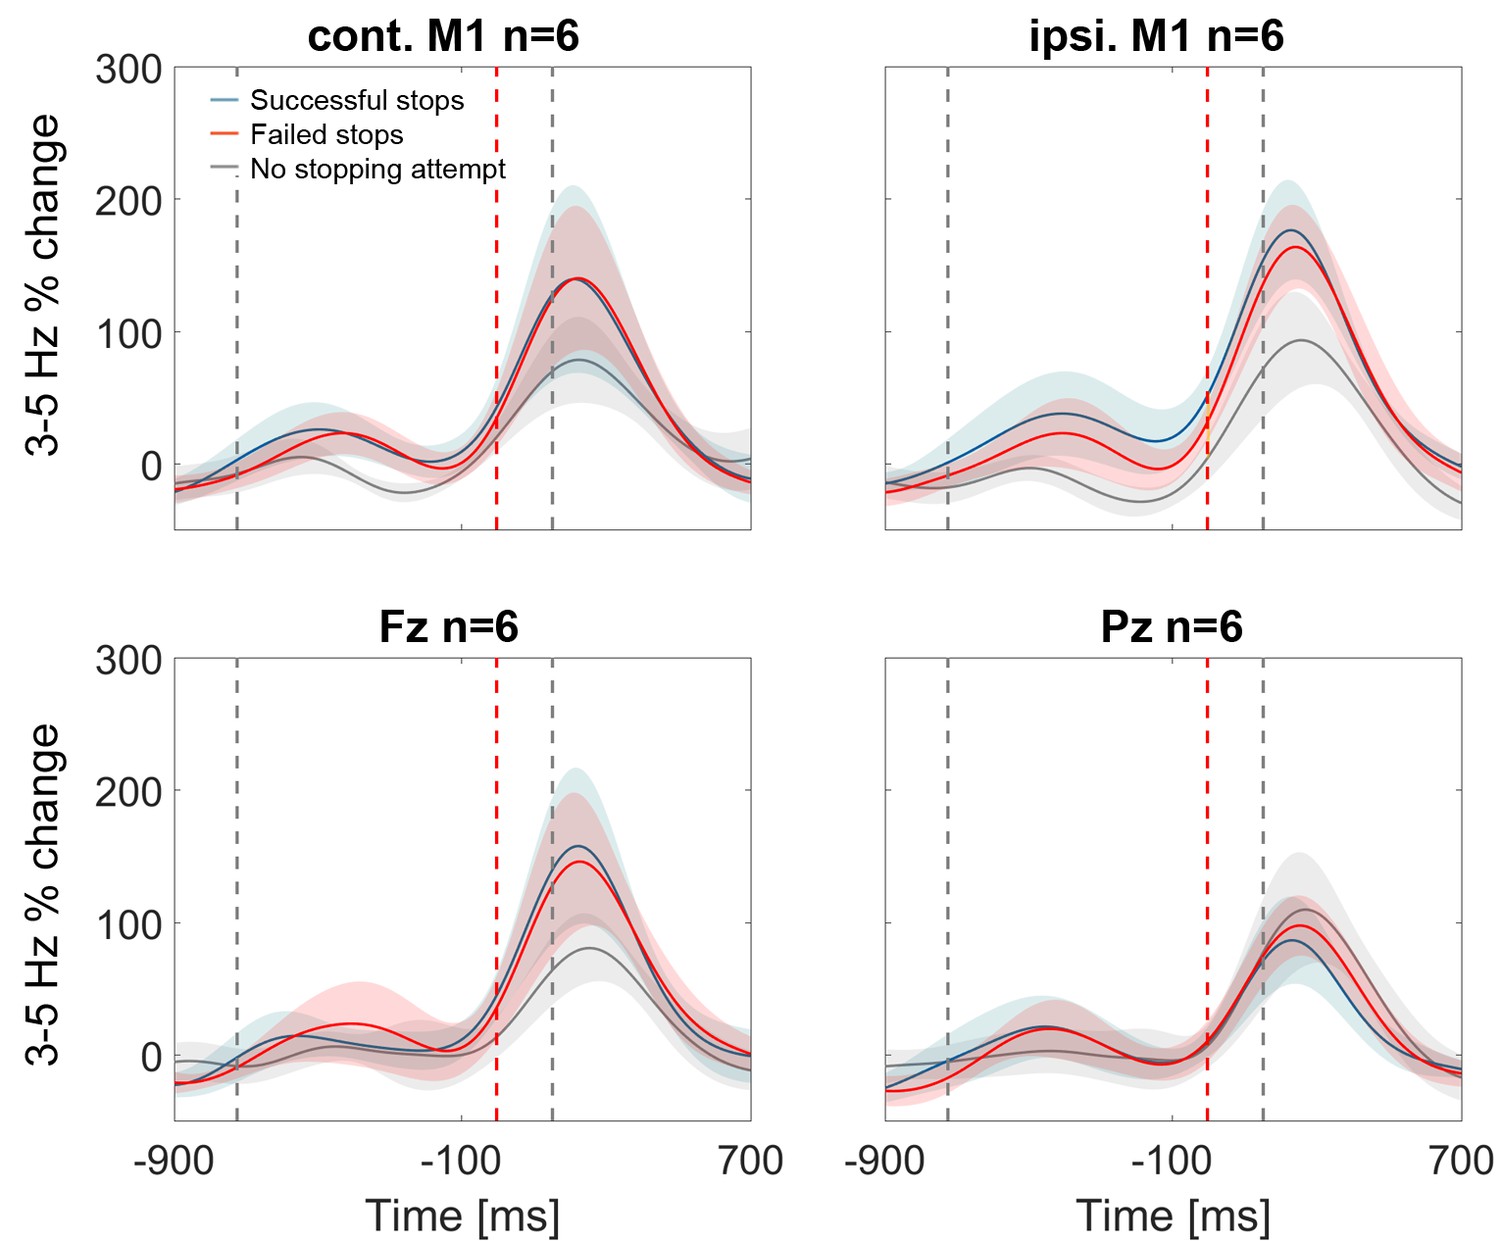
3–5 Hz power increase in contralateral and ipsilateral M1, Fz and Pz.
In contralateral and ispilateral M1, as well as Fz, the stop signal-related theta increase seemed to be smaller in the control condition when stopping was not attempted (grey line, n = 6) but this difference was not significant. Note also that the blue and red shaded areas (succesful and failed stops), denoting standard errors of the mean, were highly overlapping.
Figure 5
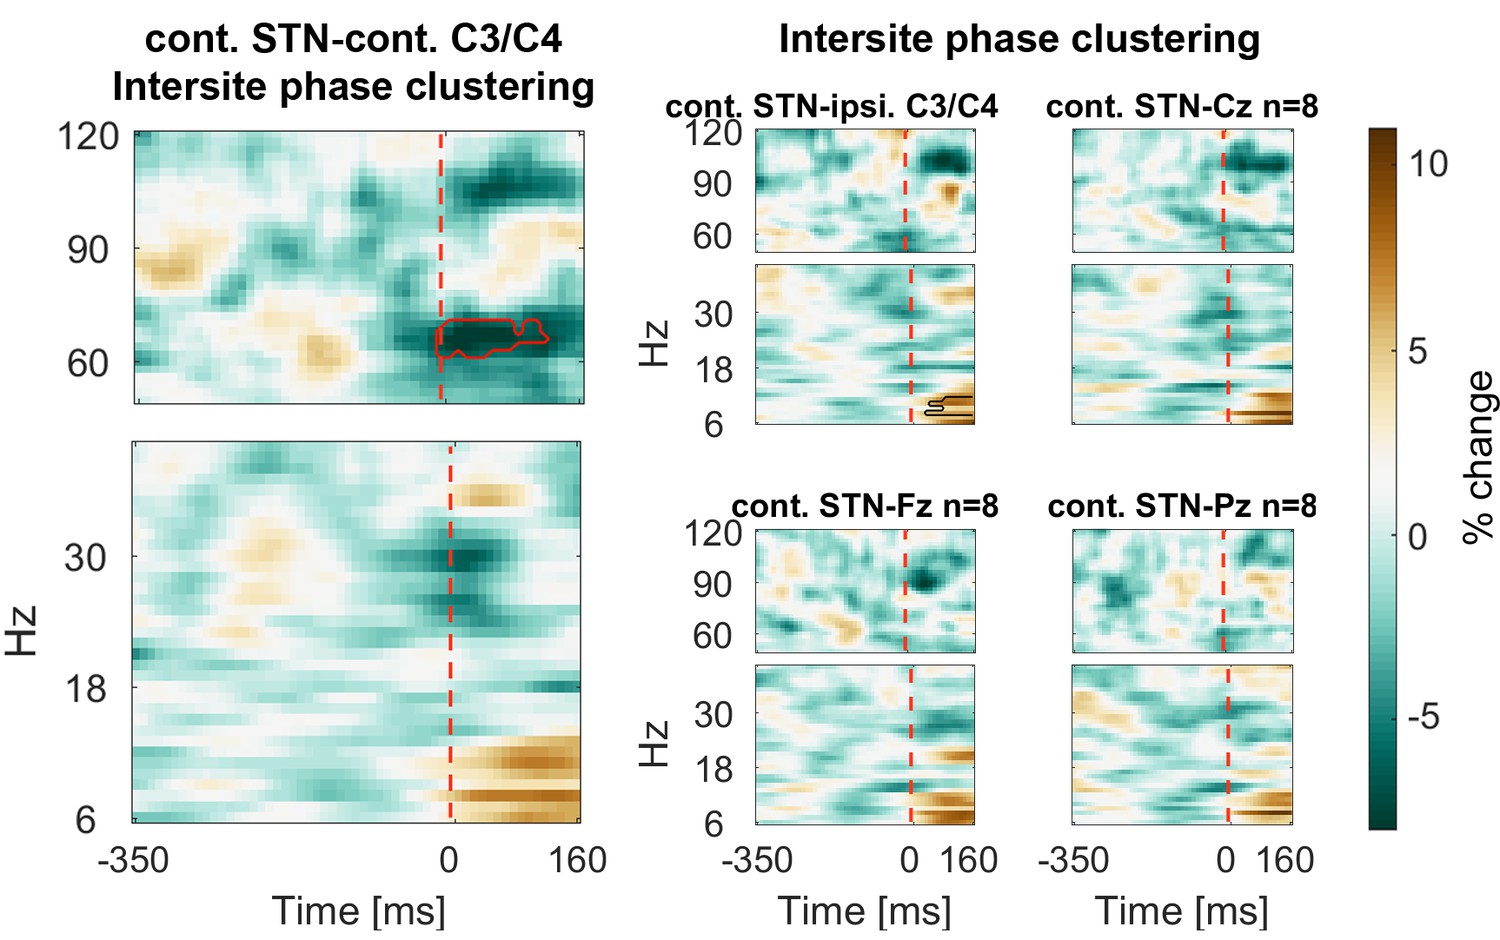
Connectivity changes following the stop signal.
Intersite phase clustering (ISPC) values are normalized by a −350:0 ms baseline preceding the stop signal. The dashed line denotes the time of the stop signal. Gamma ISPC between contralateral STN and contralateral C3/C4 decreased significantly between 60–80 Hz (encircled in red), whereas ISPC in low frequencies between STN and cortical electrodes increased.
-
Figure 5—source data 1
MATLAB data file containing source data related to Figure 5.
Data matrices (subject * frequency * time) for individual channels are stored at the respective fields in the structure data.Figure 5.below40Hz for frequencies below 40 Hz and in data.Figure 5.above60Hz for frequencies in the gamma range. The frequencies for each column are denoted in the field ‘freqs’ and the time in seconds in the field ‘time_in_sec’. The field ‘stoppingWin’ provides the critical time window of interest between the stop signal and timing of the unsuccessfully stopped tap.
- https://doi.org/10.7554/eLife.23947.017
Figure 6 with 1 supplement
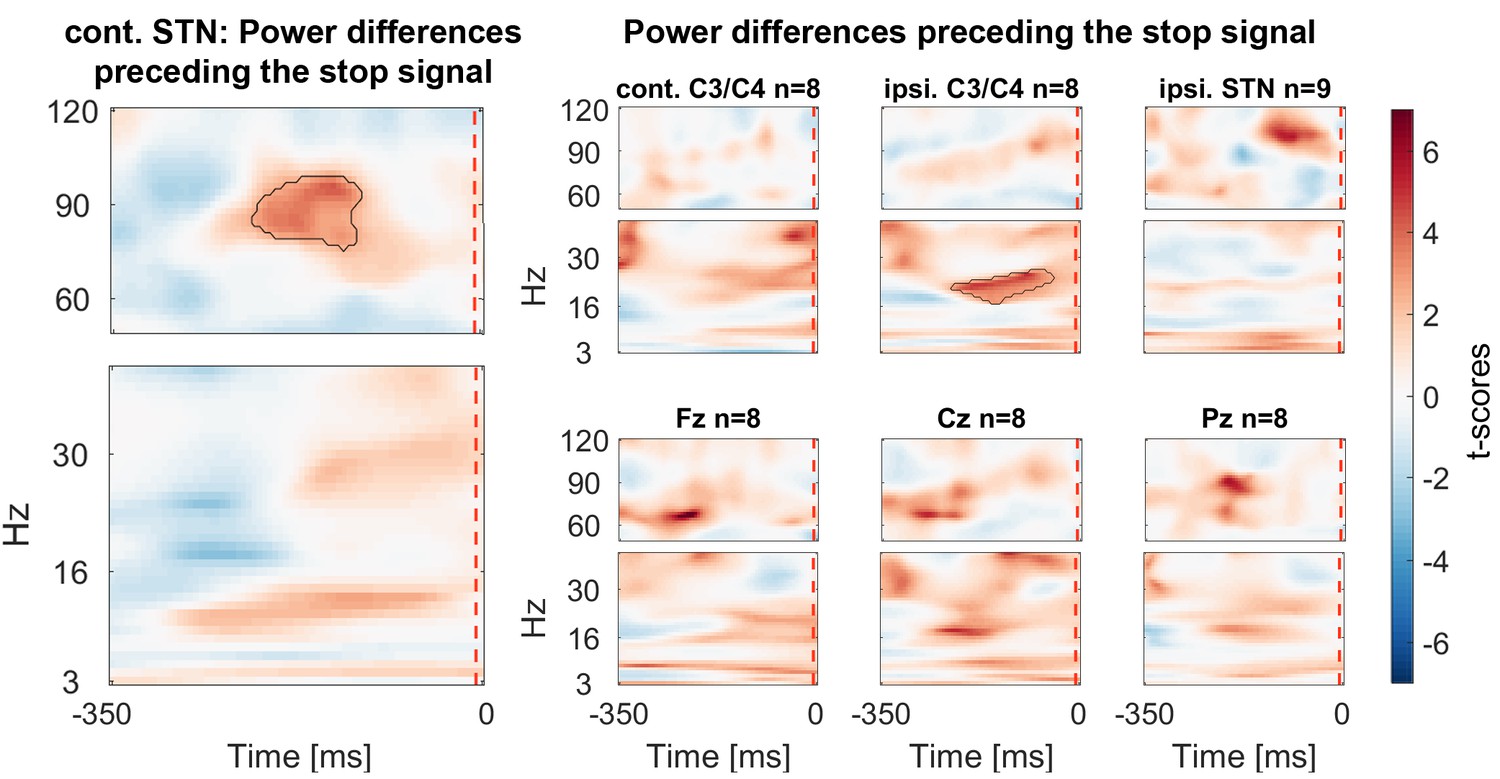
Power differences preceding the stop signal averaged across all patients.
Around 150 ms before the stop signal (at 0 ms) gamma activity was significantly higher in the STN if stopping was successful. Beta power in ipsilateral C3/C4 was also increased prior to successful stops.
-
Figure 6—source data 1
MATLAB data file containing source data related to Figure 6.
Data matrices (subject * frequency * time) for individual channels are stored at the respective fields in the structure data.Figure 6.below40Hz for frequencies below 40 Hz and in data.Figure 6.above60Hz for frequencies in the gamma range. The frequencies for each column are denoted in the field ‘freqs’ and the time in seconds in the field ‘time_in_sec’.
- https://doi.org/10.7554/eLife.23947.019
Figure 6—figure supplement 1
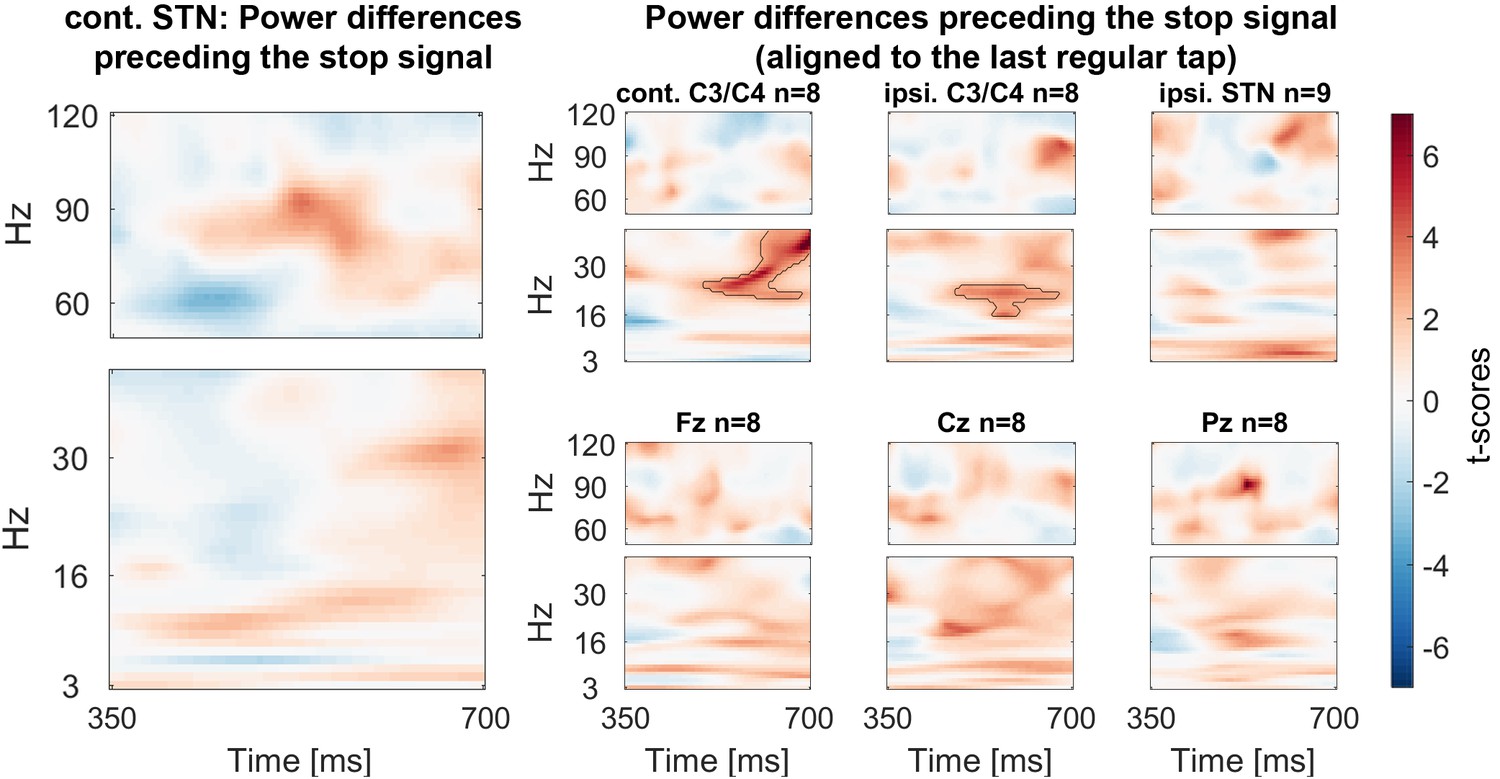
Power differences preceding the stop signal with the data aligned to the last regular tap before stop signal delivery (averaged across all patients).
This figure differs slighlty from the main Figure 6 as the delay between the tap and stop signal differed across patients in spite of being the same across trials in each subject. With the alignment to the last regular tap the beta difference is also significant in contralateral C3/C4. No such difference was present in the STN.
Author response image 1
Author response image 2
Tables
Table 1
Correlations between movement parameters of the last regular tap and the movement extent after the stop signal (mean ± SD). In 7 of 9 subjects, movement extent correlated with the soundOffset (=tap-to-sound offset; negative values represent taps that occurred before the sound). But none of the p-values resulting from one-sample t-tests of the Fisher’s z-transformed intra-individual correlation coefficients of the nine subjects survived FDR-correction. downTime = duration of finger contact with the pressure sensor, maxPrs = peak pressure during the tap, tapNr = number of taps preceding delivery of the stop signal, peakVelDown=peak velocity of the downward movement of the previous tap, upMvmt = amount of up-movement, peakVelUp=peak velocity of the upward movement.
| Variable | Rho±SD | p-value | FDR-corrected p-value | |
|---|---|---|---|---|
| soundOffset | 0.29 ± 0.18 | 0.020 | 0.137 | |
| downTime | −0.10 ± 0.19 | 0.174 | 0.407 | |
| maxPres | −0.04 ± 0.23 | 0.460 | 0.644 | |
| tapNr | −0.13 ± 0.20 | 0.061 | 0.215 | |
| peakVelDown | −0.05 ± 0.23 | 0.377 | 0.644 | |
| upMvmt | 0.00 ± 0.23 | 0.952 | 0.952 | |
| peakVelUp | 0.04 ± 0.29 | 0.810 | 0.945 |
Table 2
Clinical details. Age and disease duration are given in years. UPDRS-III: Unified Parkinson’s disease rating scale part III. Levodopa equivalent dose was calculated according to Tomlinson et al. (2010).
| ID | Age/Sex/dom. Hand | UPDRS-III OFF/ON levodopa | Disease duration | Main symptom | Levodopa equivalent dose (mg / day) | DBS lead | Surgical centre |
|---|---|---|---|---|---|---|---|
| 1 | 65/f/r | 33/11 | 5 | Tremor/Dyskinesia | 807 mg | Medtronic 3389TM | Oxford |
| 2 | 55/m/r | 49/25 | 10 | Leg dragging + tremor (left side) | 2022 mg | Medtronic 3389TM | Oxford |
| 3 | 66/f/r | 25/14 | 17 | Freezing of gait, balance | 1089 mg | Medtronic 3389TM | London |
| 4 | 50/m/r | 37/17 | 5 | Tremor, Dyskinesia, especially in right foot | 958 mg | Medtronic 3389TM | London |
| 5 | 48/m/left-ambi | 46/18 | 6 | Frequent OFFs | 800 mg | Boston Scientific DB-2202TM | Oxford |
| 6 | 54/m/r | 61/32 | 8 | Motor fluctuations | 455 mg | Boston Scientific DB-2201TM | Oxford |
| 7 | 60/m/r | 37/6 | 6 | Rigidity left side, bradykinesia, dyskinesia | 2084 mg | Boston Scientific DB-2202TM | Oxford |
| 8 | 67/m/r | 31/13 | 3.5 | Bradykinesia, Rigidity | 2173 mg | Medtronic 3389TM | London |
| 9 | 68/m/r | 33/15 | 10 | Motor fluctuations | 1765 mg | Boston Scientific DB-2202TM | Oxford |
Additional files
-
Source code 1
MATLAB analyses scripts to reproduce the figures.
- https://doi.org/10.7554/eLife.23947.022
Download links
A two-part list of links to download the article, or parts of the article, in various formats.
Downloads (link to download the article as PDF)
Open citations (links to open the citations from this article in various online reference manager services)
Cite this article (links to download the citations from this article in formats compatible with various reference manager tools)
Subthalamic nucleus gamma activity increases not only during movement but also during movement inhibition
eLife 6:e23947.
https://doi.org/10.7554/eLife.23947


