Loss of adult skeletal muscle stem cells drives age-related neuromuscular junction degeneration
- Center for Musculoskeletal Research, University of Rochester Medical Center, United States
- University of Rochester Medical Center, United States
- University of Rochester, United States
- University of Nevada, United States
- Tsinghua University, China
Figures
Figure 1 with 2 supplements
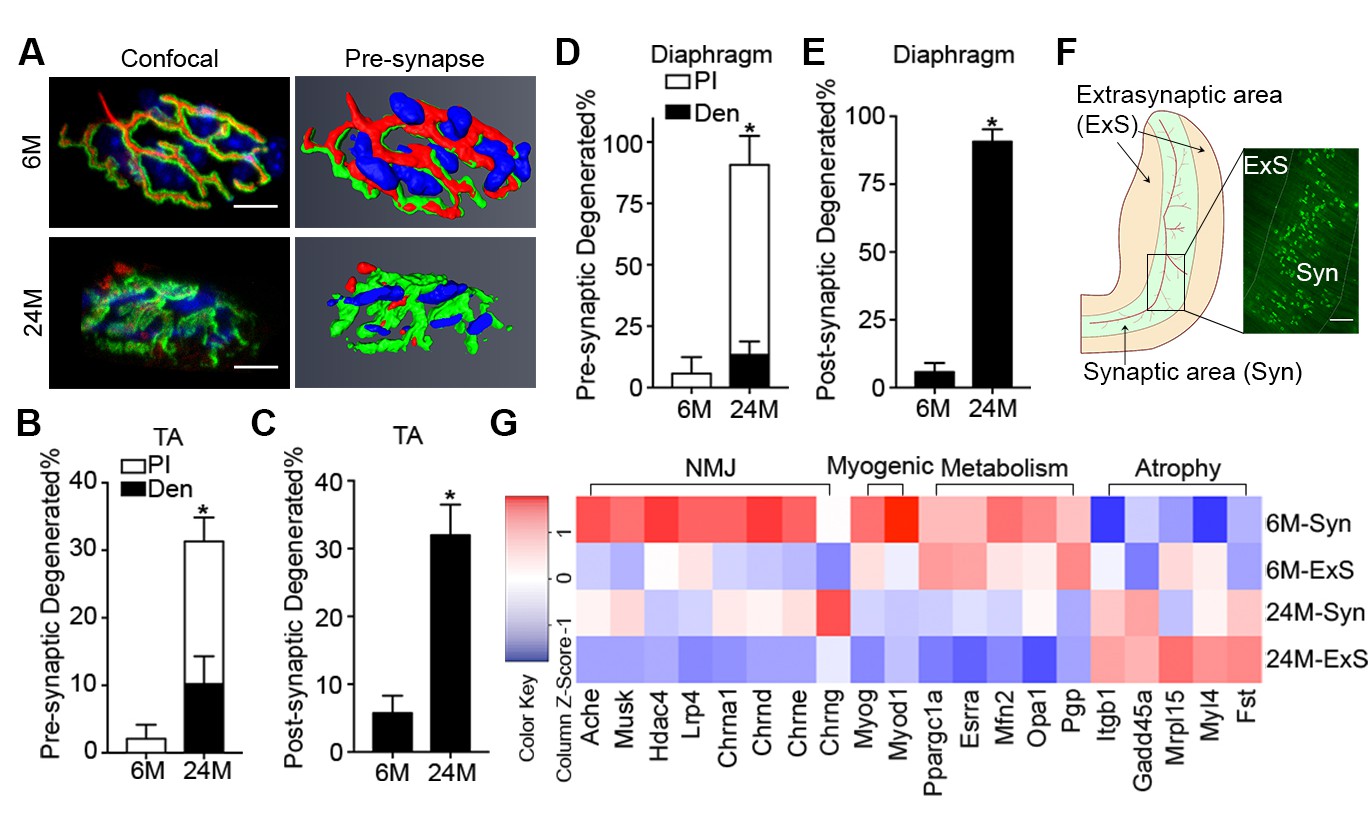
Aging of skeletal muscles is associated with NMJ degeneration without gross denervation.
(A) Confocal IF images and 3-D Amira-based reconstructions (viewed from the pre-synaptic side) of adult (6M) and aged (24M) C57BL6/J NMJs stained for post-synaptic AChRs (α-bungarotoxin, BTX; green), nerve terminal markers (SV2, Syt-2, neurofilament; red) and nuclei (DAPI, blue). Scale bar = 10 μm. (B) Quantification of pre-synaptic degenerated NMJs, where pre-synaptic nerve terminals are still present but partially missing (partially innervated, PI), or fully devoid (completely denervated, Den), in adult and aged Tibialis Anterior (TA) muscles. (C) Quantification of post-synaptic degenerated NMJs, where the AChR-enriched area loses the elaborate branch morphology, in adult and aged TA muscles. (D–E) Quantification of (D) pre-synaptic degenerated or (E) post-synaptic degenerated NMJ percentage in adult and aged diaphragms. (F) Schematic of a diaphragm demonstrating the central NMJ clusters in diaphragm. Red lines indicate nerve terminals; inset is a representative image of a diaphragm stained with BTX (shown in green). Scale bar = 200 μm. (G) Heat map of FPKM values from adult and aged synaptic (Syn) and extra-synaptic (ExS) diaphragms. Red indicates increased expression, and blue indicates decreased expression. n = 4 mice per group, >20 NMJs/mouse (B–C); n = 3 mice per group, 20 NMJs/mouse (D–E); n = 2 (adult) or 3 (aged) mice (G). *p<0.05 compared to adult, unpaired Student’s t-tests.
Figure 1—figure supplement 1
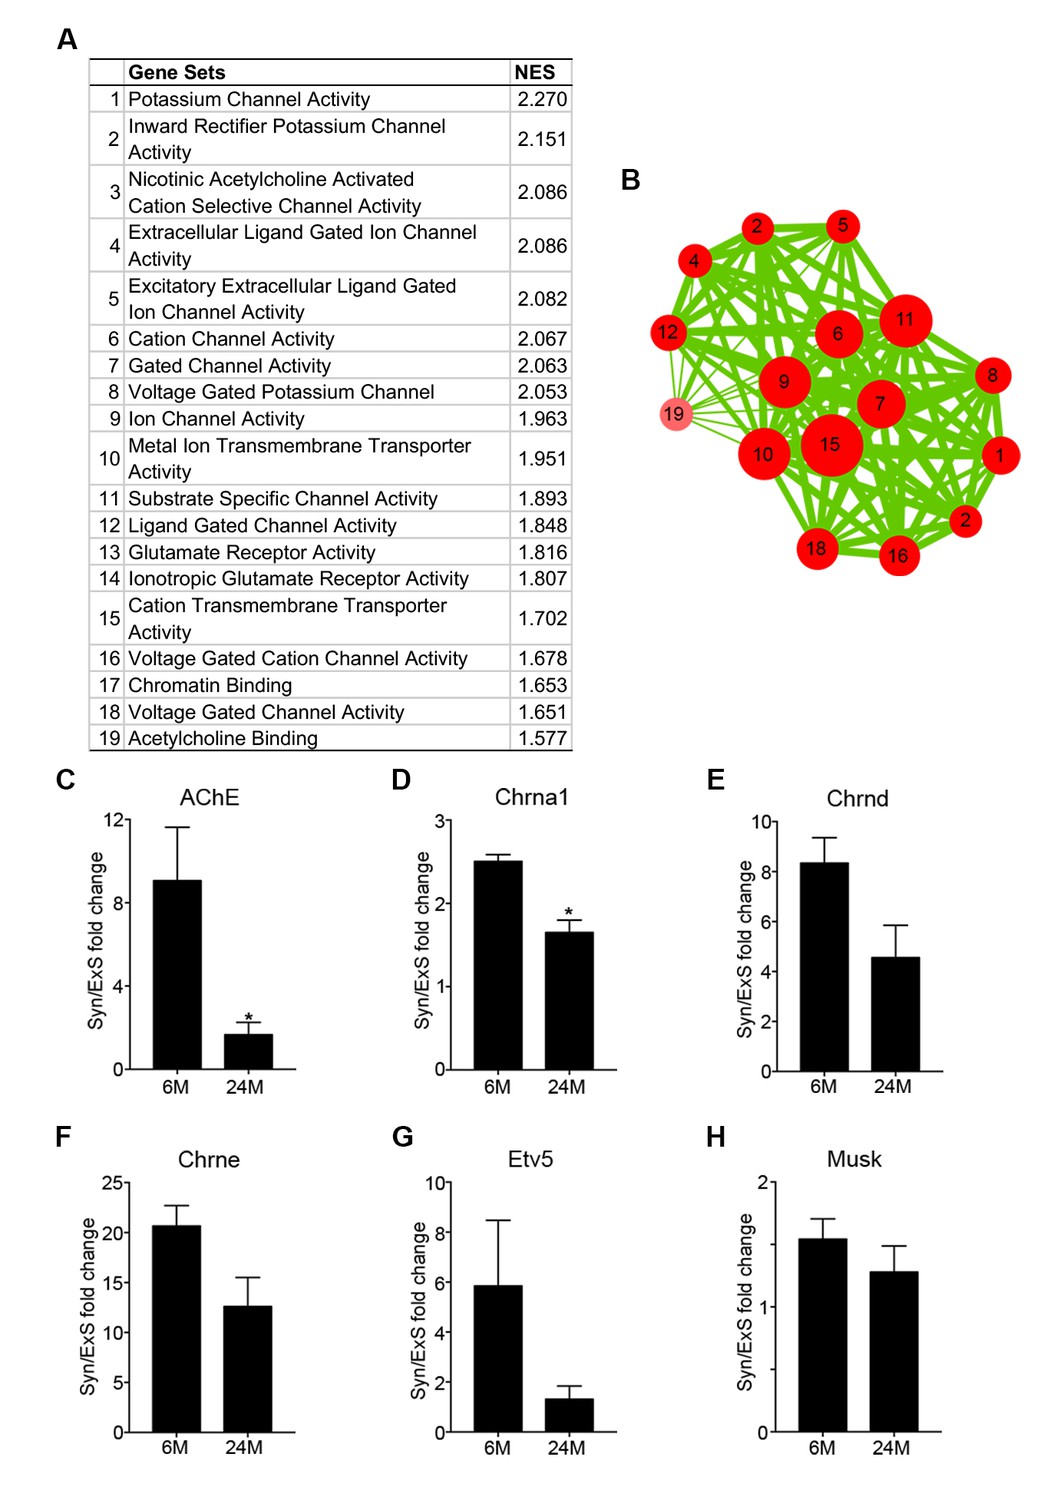
Synaptic specific gene enrichment declines with age.
(A) Top 19 gene sets enriched in adult synaptic diaphragms from gene set enrichment analysis (GSEA) between adult synaptic (6M-Syn) and extra-synaptic (6M-ExS) samples using gene sets derived from the Gene Ontology Molecular Function (GOMF), arranged based on normalized enrichment score (NES). (B) Enrichment results from (A) were visualized using the Cytoscape plug-in enrichment map. Each node represents a gene set, and the thickness of lines connecting two nodes represents the number of shared genes between the two gene sets. (C–H) RT-qPCR results of select NMJ-specific genes verified the trend of decreased enrichment of these genes with age. *p<0.05 compared to adult, unpaired Student’s t-tests. n = 3 mice per group (C–H).
Figure 1—figure supplement 2
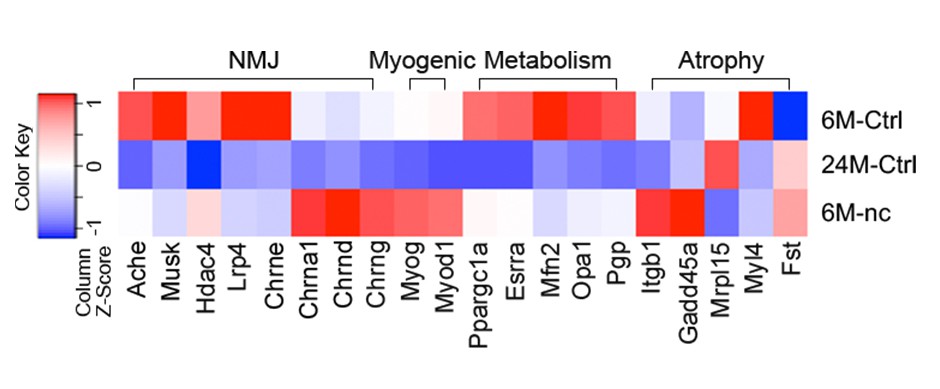
Aged skeletal muscle does not display transcriptional changes characteristic of denervation.
Heat map of FPKM values from uninjured adult (6M-Ctrl) and aged (24M-Ctrl) gastrocnemius and adult gastrocnemius after 6 weeks of denervation-reinnervation upon a 2 mm sciatic nerve transection surgery (6M-nc). Red indicates increased expression, and blue indicates decreased expression. The data represent pooled replicates of 6M-Ctrl (n = 3), 24M-Ctrl (n = 2) and 6M-nc (n = 3) mice.
Figure 2 with 2 supplements

Aged-associated NMJ degeneration is accompanied by reduction in the size of post-synaptic myonuclear clusters.
(A–B) Linear regression analysis demonstrates positive correlation between (A) NMJ volume or (B) AChR cumulative intensity (both quantified by Amira using confocal-fluorescent images of individual NMJs) and the post-synaptic myonuclear number. (C) Percentage of pre/post-synaptic degenerated or intact NMJs in groups with different size of post-synaptic myonuclear cluster. (D) 3-D Amira-based reconstructions (viewed from the post-synaptic side) of adult and aged C57BL6/J NMJs stained for post-synaptic AChRs (green), nerve terminal markers (red) and nuclei (blue). Post-synaptic myonuclei are indicated with white asterisks and pre-synaptic nuclei with yellow asterisks. (E) Percentage distribution of NMJs based on number of post-synaptic myonuclei in TA and diaphragm.
Figure 2—figure supplement 1
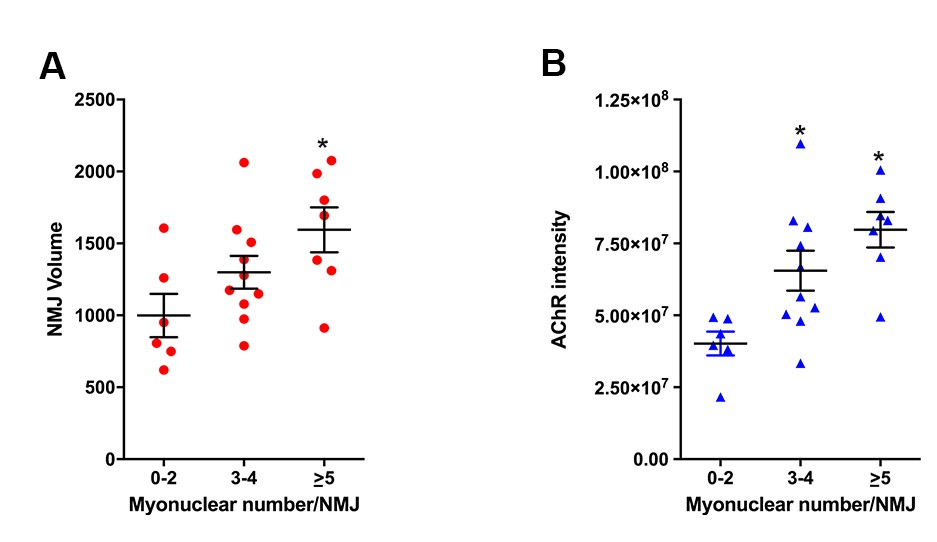
NMJ size, based on post-synaptic apparatus volume and AChR intensity, positively correlates with the size of post-synaptic myonuclear clusters.
(A) NMJ volume and (B) AChR cumulative intensity positively associates with number of post-synaptic myonuclei. *p<0.05 compared to 0–2 group, one-way ANOVA/Tukey multiple comparison test. n = 23 NMJs.
Figure 2—figure supplement 2
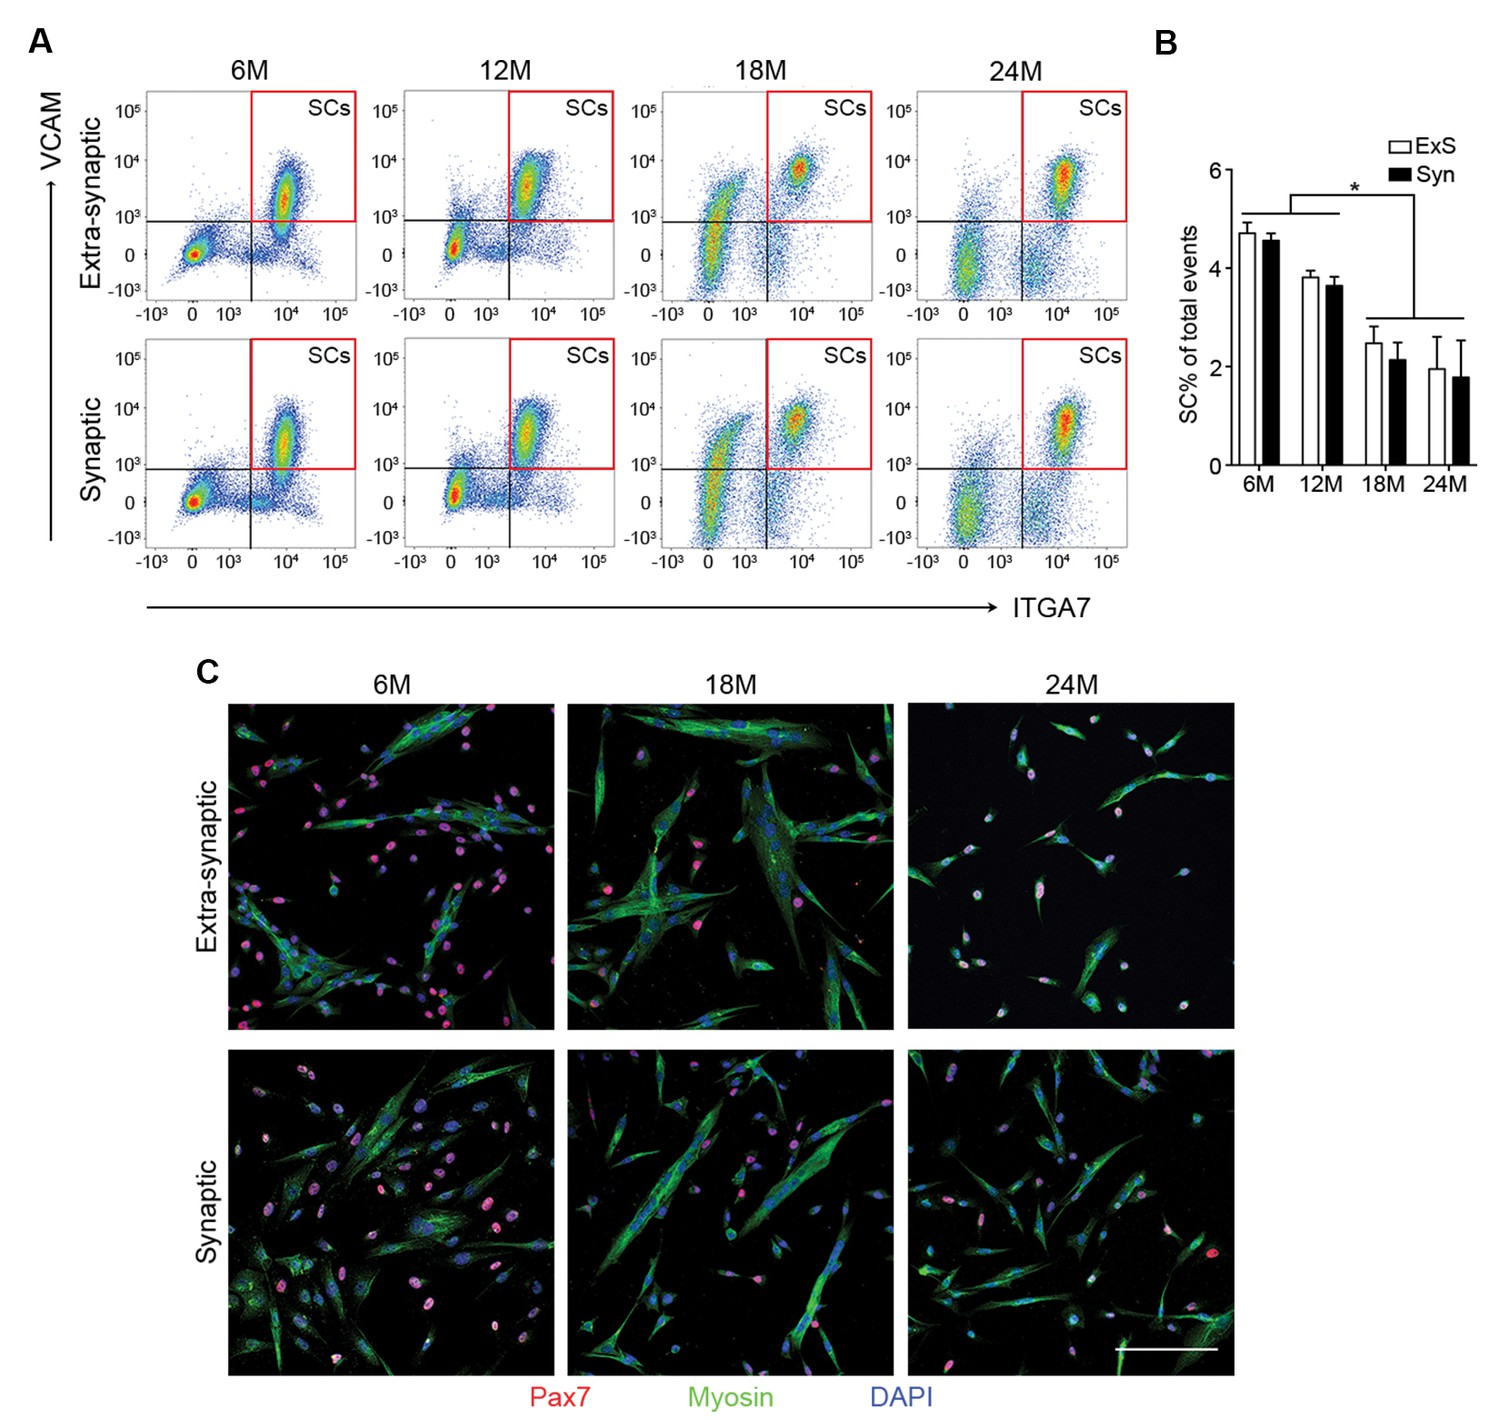
Age-related SC decline occurs to a similar extent between synaptic and extra-synaptic diaphragm regions.
(A) Representative FACS plots of cells isolated from 6/12/18/24-month-old C57BL6/J synaptic and extra-synaptic diaphragms. Red boxes represent the gate for the SC population. (B) Quantification of FACS-purified SC percentage of total events from synaptic (Syn) and extra-synaptic (ExS) regions of diaphragms. *p<0.05 compared to 6M/12M groups, two-way ANOVA/Sidak multiple comparison test. (C) Representative images of FACs-sorted SC cultures stained for Pax7 (red), Myosin (green), and DAPI (blue). Scale bar = 100 μm. n = 3 (24M-ExS, 24M-Syn); 4 (6M-ExS, 6M-Syn, 12M-ExS, 12M-Syn) or 7 (18M-ExS, 18M-Syn) mice (B).
Figure 3 with 5 supplements
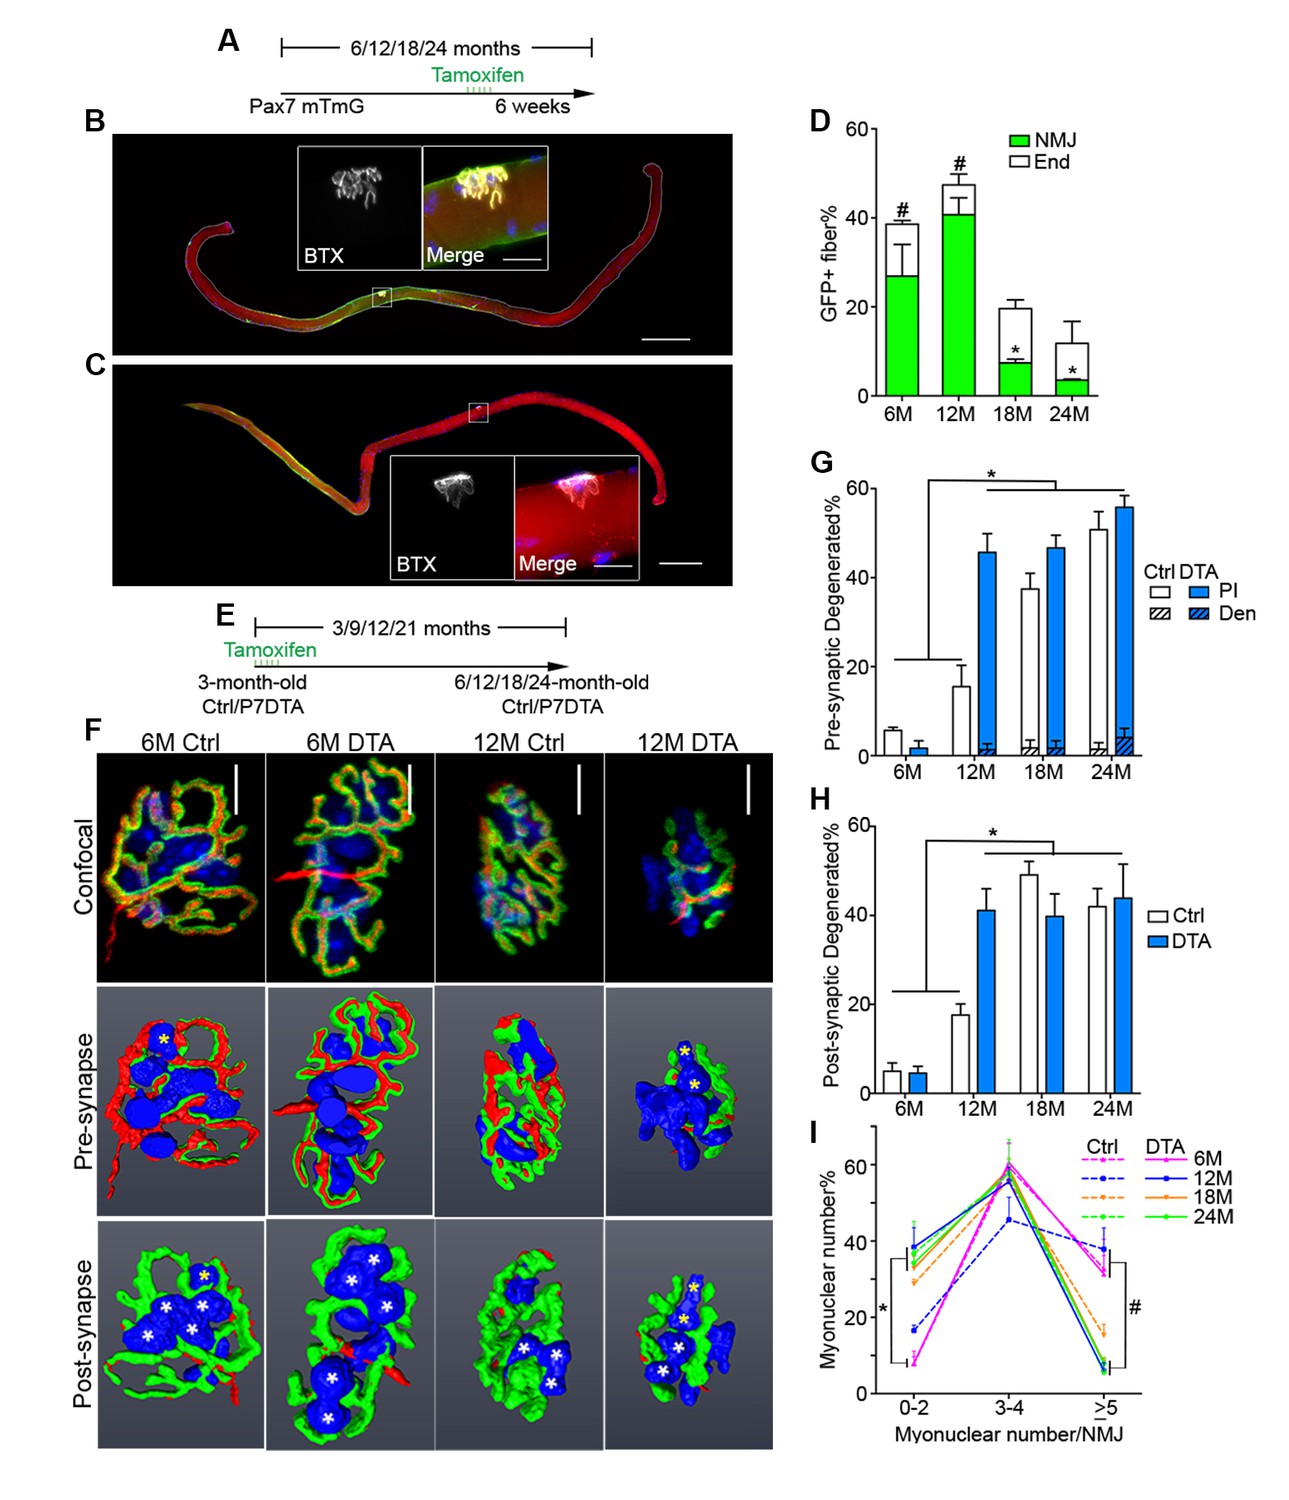
Contribution of SCs to NMJs is lost in aged muscle and SC depletion accelerates age-associated NMJ degeneration.
(A) Scheme demonstrating time of tamoxifen treatment and harvest of tissue for P7mTmG mice. (B–C) Representative images of single isolated P7mTmG EDL myofibers from (B) 12-month-old mice, where mGFP is in middle portions where the NMJ is located or (C) 18-month-old mice, where mGFP is located at the end of the fiber. Magnified inset images show NMJs. Scale bar for myofibers = 200 μm, for inset = 25 μm. (D) Quantification of mGFP+ fiber percentage and distribution based on mGFP location (at the end of the fiber or in the vicinity of the NMJ). *p<0.05 for NMJ-associated mGFP compared to 6M/12M groups, #p<0.05 for mGFP at the end compared to NMJ-associated mGFP at that age group, two-way ANOVA/Sidak multiple comparison test. (E) Scheme demonstrating time of tamoxifen treatment and harvest of tissue for Ctrl or P7DTA mice. (F) Confocal IF images and 3-D Amira-based reconstructions (viewed from the pre-synaptic or post-synaptic side) of Ctrl and P7DTA NMJs stained for post-synaptic AChRs (green), nerve terminal markers (red) and nuclei (blue). Post-synaptic myonuclei are indicated with white asterisks, and representative pre-synaptic nuclei indicated with yellow asterisks. Scale bar = 10 μm. (G–H) Quantification of (G) pre-synaptic degenerated, including partially innervated (PI) or completely denervated (Den), or (H) post-synaptic degenerated NMJ percentage of Ctrl and P7DTA TA muscles. *p<0.05, 6M Ctrl/P7DTA, 12M Ctrl vs. 12M P7DTA, 18/24M Ctrl/P7DTA, two-way ANOVA/Sidak multiple comparison test. (I) Percentage distribution of TA NMJs based on number of post-synaptic myonuclei. *p<0.05, 6M Ctrl/P7DTA vs. 12M/18M P7DTA, 24M Ctrl/P7DTA; #p<0.05, 6M Ctrl/P7DTA, 12M Ctrl vs. 12M/18M P7DTA, 24M Ctrl/P7DTA; two-way ANOVA/Sidak multiple comparison test. n = 3 mice per group, ≥50 myofibers examined per mouse (D); n = 3 (18M Ctrl, 24M Ctrl, 24M P7DTA); 4 (6M Ctrl, 6M P7DTA, 18M P7DTA) or 5 (12M Ctrl, 12M P7DTA) mice, >20 NMJs/mouse (G–I).
Figure 3—figure supplement 1
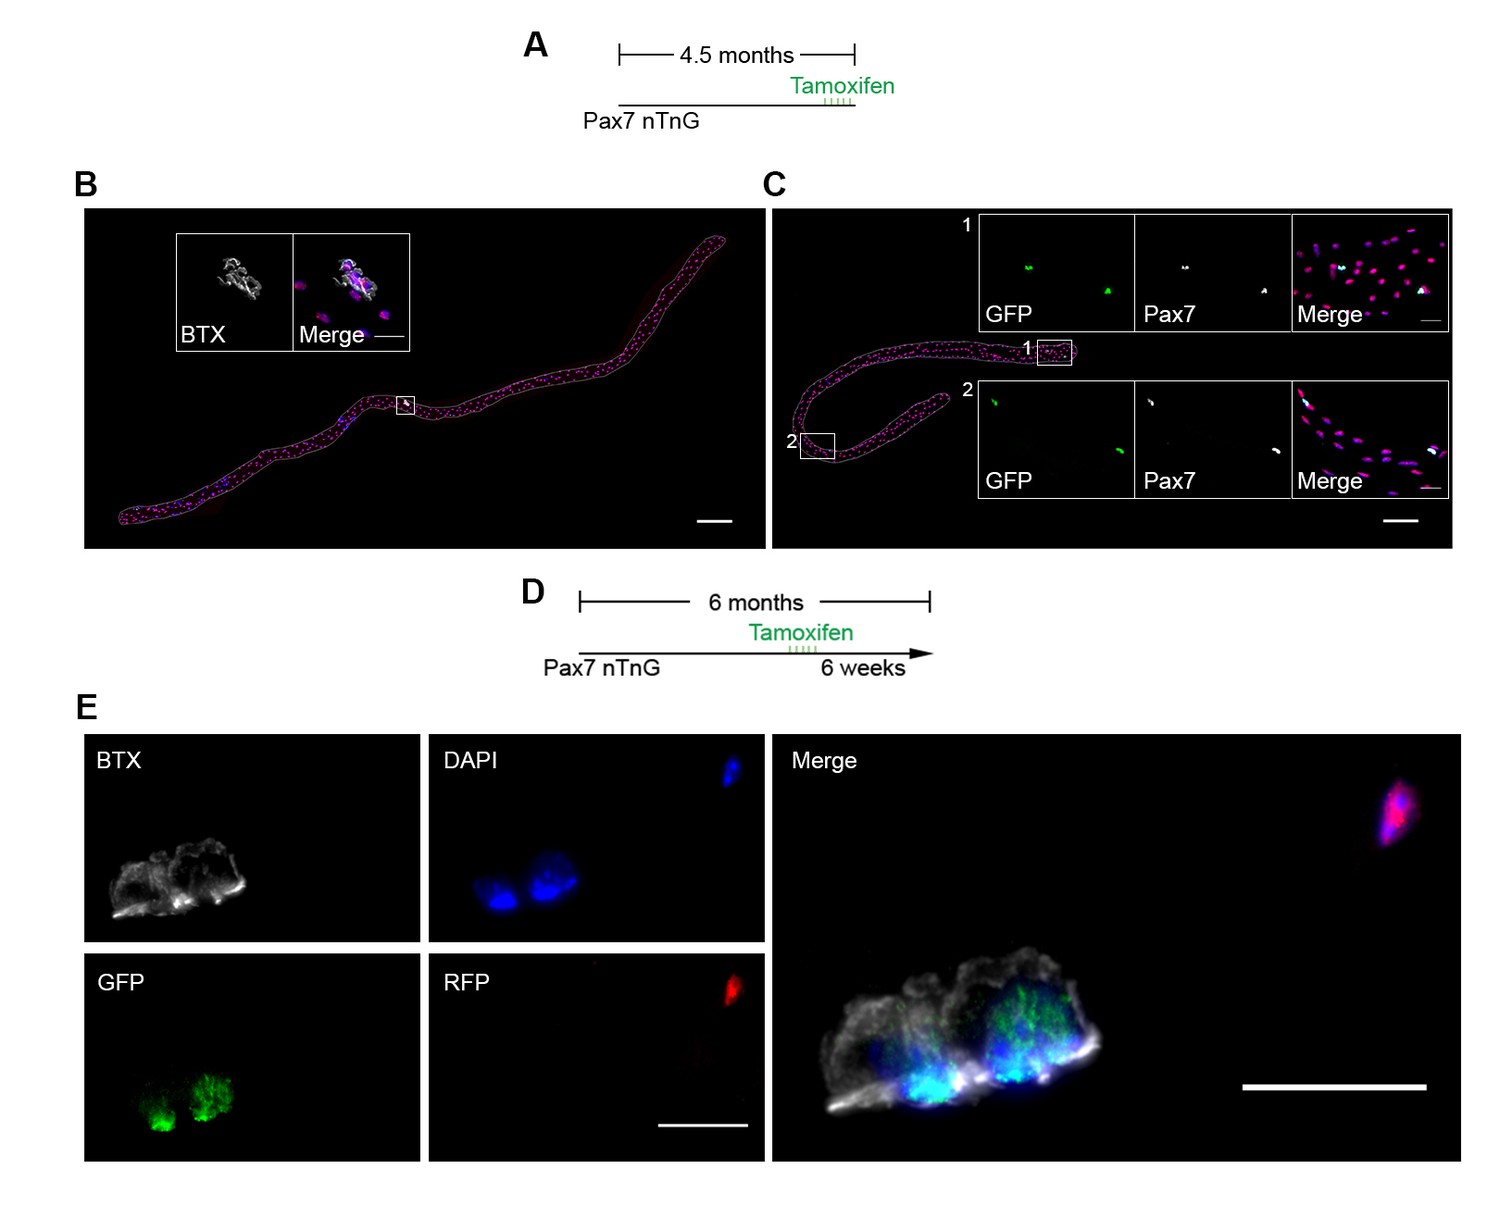
Contribution of SCs to NMJs in adult muscles.
(A–C) Representative images of adult P7nTnG EDL single myofibers, taken 24 hr after 5 days of Tamoxifen treatment (A), stained for AChRs (B) or Pax7 (C). Magnified inset images show (B) the NMJ with nuclear tomato-labeled post-synaptic myonuclei and (C) nuclear GFP-labeled SCs. Scale bar for myofibers = 200 μm, for inset = 25 μm. (D) Scheme demonstrating time of tamoxifen treatment and harvest of tissue for adult P7nTnG mice. Images of Ctrl and P7mTmG TA muscle sections, note the lack of GFP + myofibers. (E) Representative images of a NMJ with nuclear GFP-labeled post-synaptic myonuclei from a 6-month-old P7nTnG EDL myofiber. Scale bars = 25 μm.
Figure 3—figure supplement 2
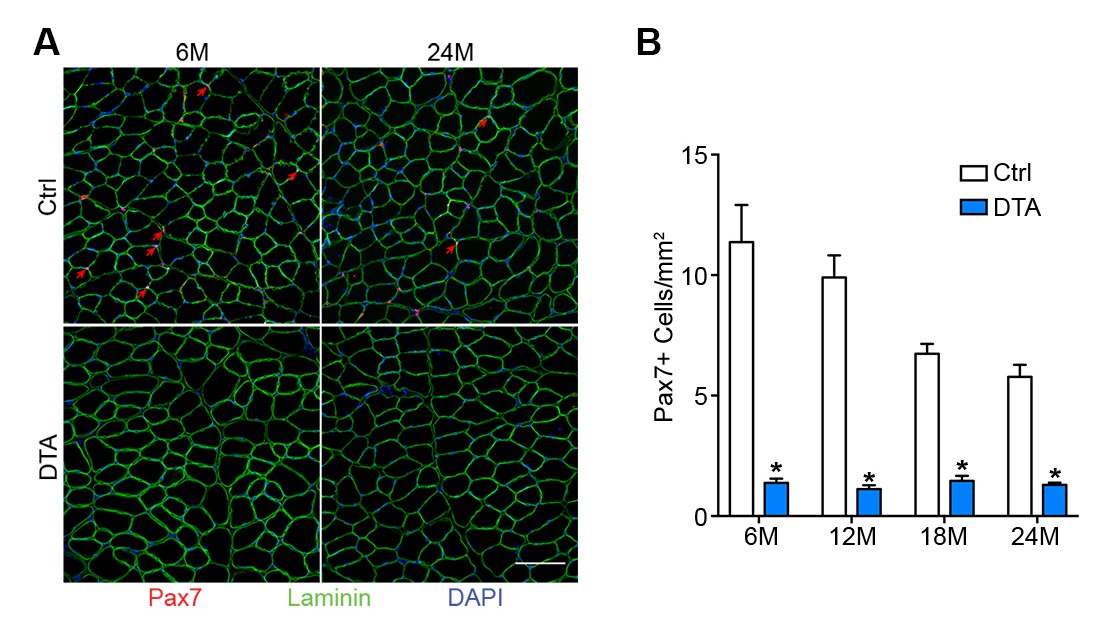
Pax7+ SCs are persistently depleted throughout the lifespan in P7DTA muscles.
(A) Representative 6/24-month-old Ctrl and P7DTA TA transverse sections stained with Pax7 (SCs, red arrows), DAPI (blue) and Laminin (green). Scale bar = 100 μm. (B) Quantification of Pax7+ SC number in Ctrl and P7DTA TA muscles. *p<0.05 compared to Ctrl group of the same age, unpaired Student’s t-tests. n = 3 (18M Ctrl, 18M P7DTA, 24M P7DTA); 4 (6M Ctrl, 6M P7DTA, 12M P7DTA, 24M Ctrl) or 5 (12M Ctrl) mice.
Figure 3—figure supplement 3
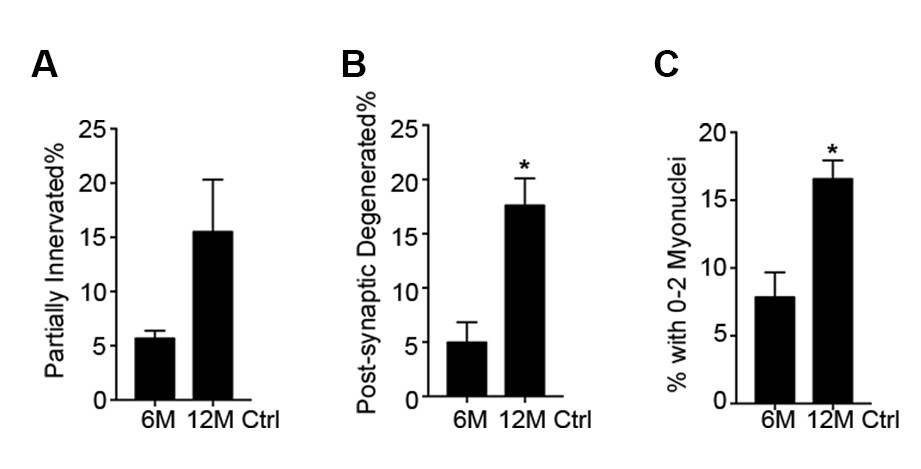
Post-synaptic degeneration of NMJs occurs prior to pre-synaptic degeneration with aging.
Same dataset as Figure 3G–I, but focused on the comparison between 6 and 12-month-old Ctrl NMJs. Quantification of (A) pre-synaptic partially innervated NMJ percentage or (B) post-synaptic degenerated NMJ percentage or (C) percentage of NMJs with 0–2 post-synaptic myonuclei from 6/12-month-old Ctrl TA muscles. *p<0.05, Student’s t test.
Figure 3—figure supplement 4
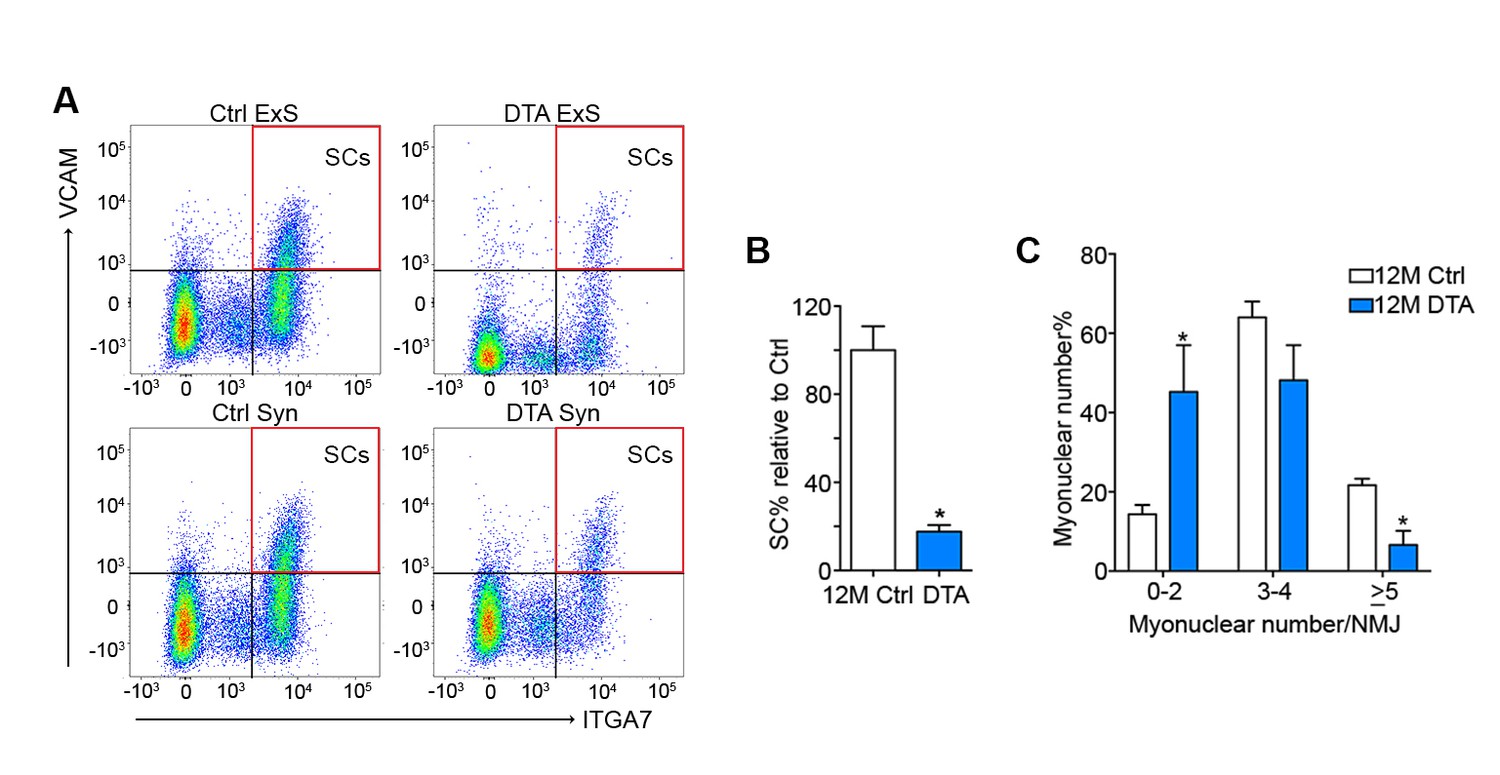
SCs are depleted in P7DTA diaphragms, accompanied by reduction in the size of post-synaptic myonuclear clusters.
(A) Representative FACS plots of cells isolated from 12-month-old Ctrl and P7DTA synaptic and extra-synaptic diaphragms. Red boxes represent the gate for the SC population. (B) Quantification of FACS-purified SC percentage of total events relative to Ctrl samples demonstrates SC depletion efficiency in the diaphragm. (C) Percentage distribution of diaphragm NMJs based on number of post-synaptic myonuclei. *p<0.05 compared to Ctrl, unpaired Student’s t-tests. n = 3 (Ctrl) or 5 (P7DTA) mice (B); n = 3 mice per group, 20 NMJs/mouse (C).
Figure 3—figure supplement 5
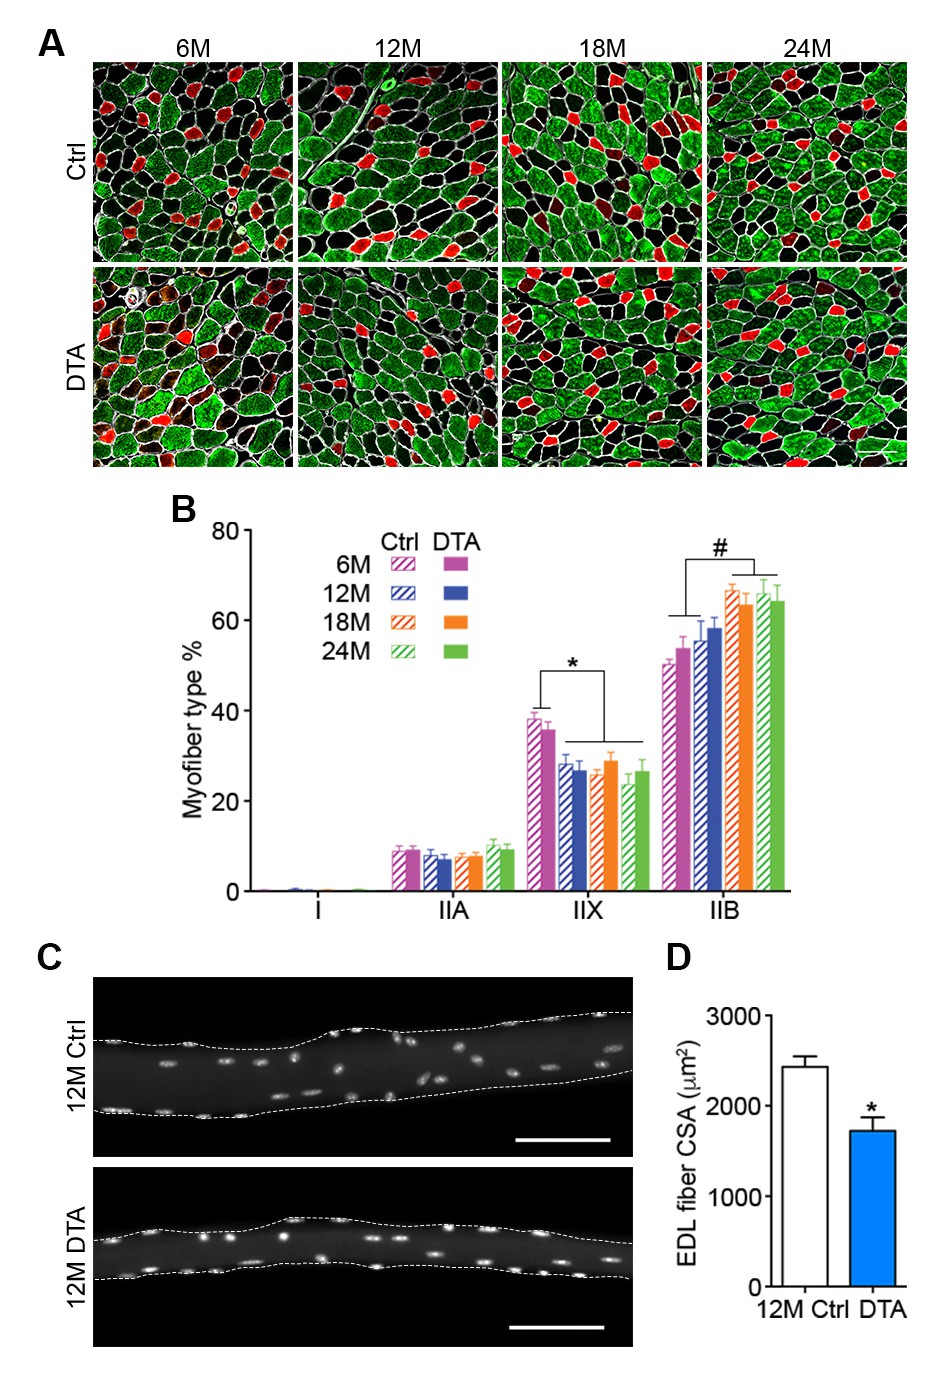
Age-related myofiber atrophy is observed in middle-aged P7DTA muscles.
(A) Representative images of Ctrl and P7DTA TA/EDL muscles showing MyHC type IIA (red), IIB (green) and IIX (black) myofibers and Laminin IF stain (white). Scale bar = 100 μm. (B) Quantification of myofiber type composition in Ctrl and P7DTA TA/EDL muscles. *p<0.05, 6M Ctrl/P7DTA vs. 12M/18M/24M Ctrl/P7DTA; #p<0.05, 6M Ctrl/P7DTA, 12M Ctrl vs. 18M/24M Ctrl/P7DTA; two-way ANOVA/Sidak multiple comparison test. (C) Representative images of fixed 12-month-old Ctrl and P7DTA EDL single myofibers stained with DAPI; dashed lines show the outline of the myofiber segments. Scale bar = 100 μm. (D) Quantification of myofiber cross-sectional area (CSA) in fixed 12-month-old Ctrl and P7DTA EDL muscles. *p<0.05 compared to Ctrl, unpaired Student’s t-tests. n = 3 (24M Ctrl); 4 (6M P7DTA, 12M Ctrl, 12M P7DTA, 18M P7DTA, 24M P7DTA) or 5 (6M Ctrl, 18M Ctrl) mice (B); n = 4 muscles per group (D).
Figure 4 with 3 supplements
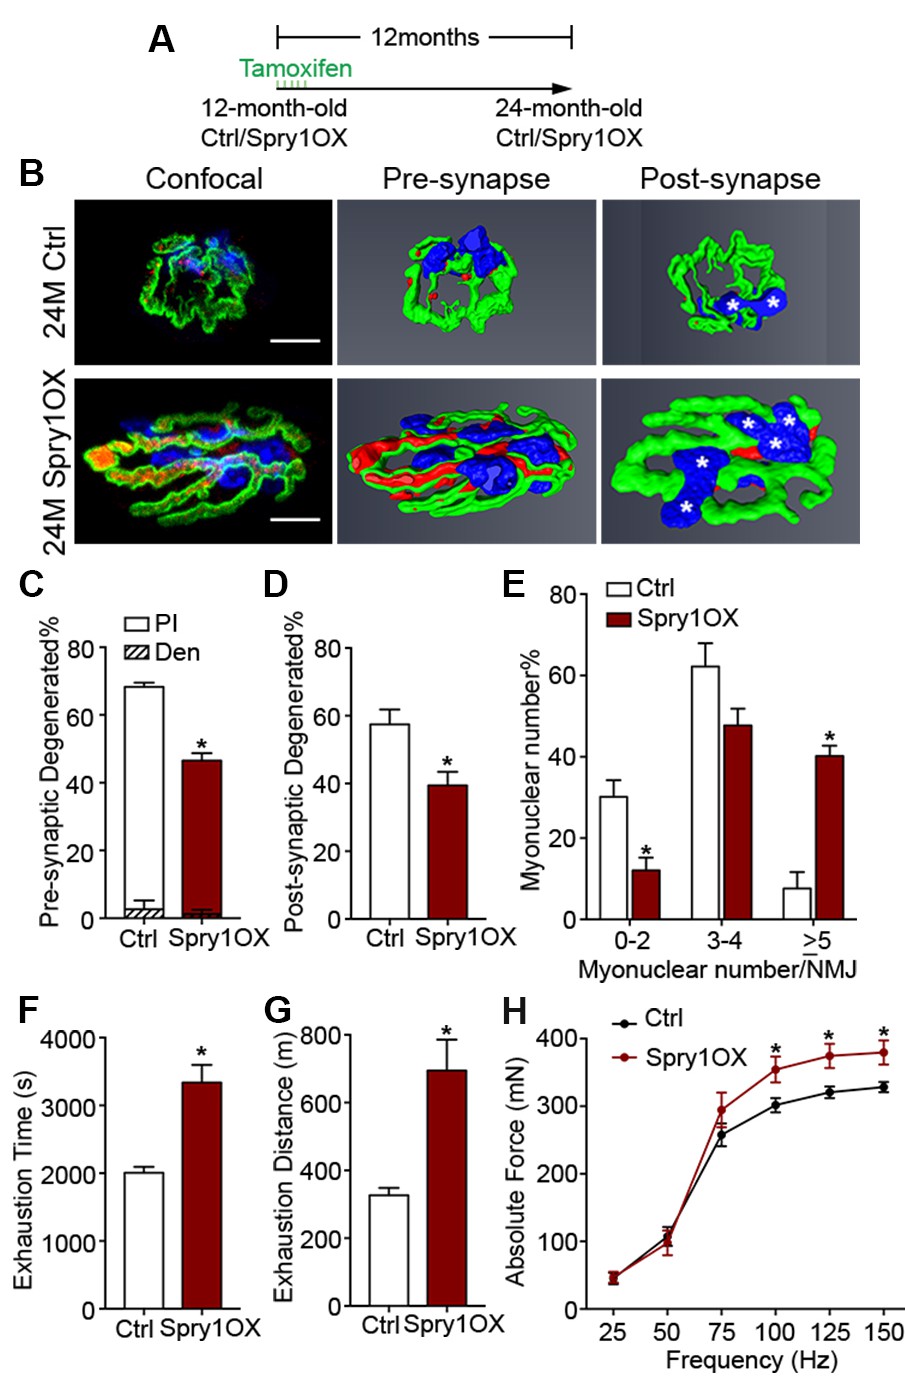
Prevention of age-related SC loss by Spry1 overexpression is associated with attenuation of sarcopenia-related declines in NMJ and skeletal muscle integrity.
(A) Scheme demonstrating time of tamoxifen treatment and harvest of tissue for Ctrl or Spry1OX mice. (B) Confocal IF images and 3-D Amira-based reconstructions (viewed from the pre-synaptic or post-synaptic side) of aged Ctrl and Spry1OX NMJs stained for post-synaptic AChRs (green), nerve terminal markers (red) and nuclei (blue). Post-synaptic myonuclei are indicated with white asterisks. Scale bar = 10 μm. (C–D) Quantification of (C) pre-synaptic degenerated, including partially innervated (PI) or completely denervated (Den), or (D) post-synaptic degenerated NMJ percentage of aged Ctrl and Spry1OX TA muscles. (E) Percentage distribution of TA NMJs based on number of post-synaptic myonuclei. (F–G) Treadmill performance of aged Ctrl and Spry1OX mice, measured as (F) exhaustion time and (G) exhaustion distance. (H) Peak absolute force generated by aged Ctrl and Spry1OX EDL muscles stimulated at different frequencies ex vivo. *p<0.05 compared to corresponding Ctrl, unpaired Student’s t-test. n = 4 mice per group, >20 NMJs/mouse (C–E); n = 3 (Ctrl) or 5 (Spry1OX) mice (F–G); n = 4 (Ctrl) or 6 (Spry1OX) mice (H).
Figure 4—figure supplement 1
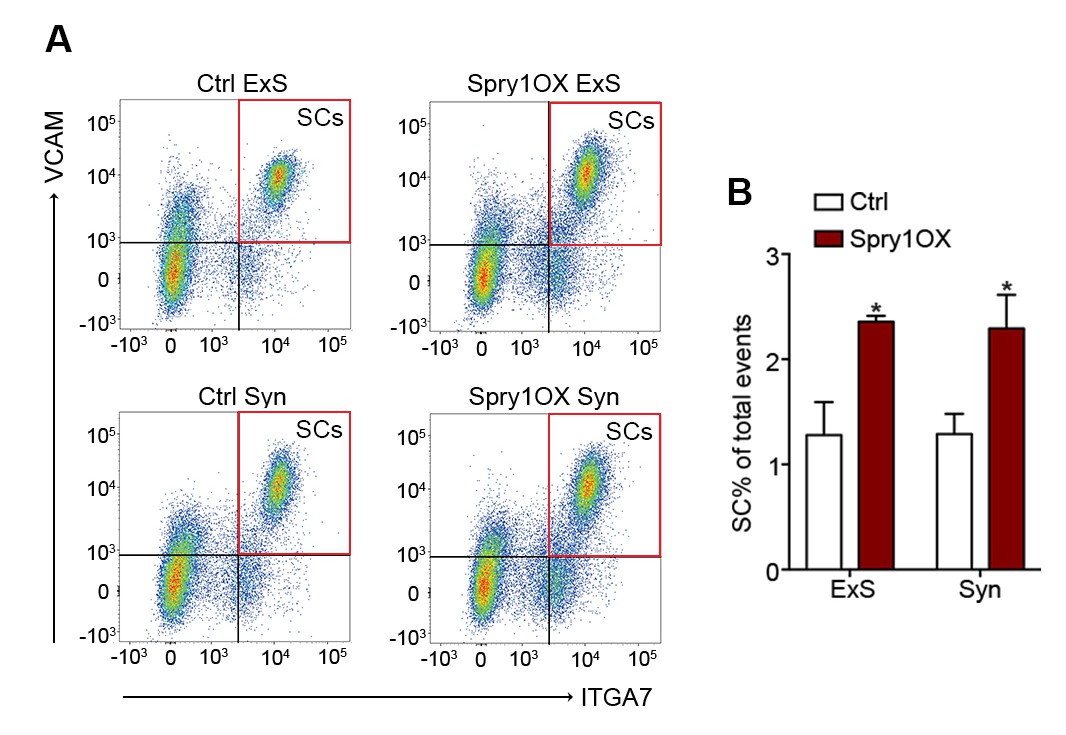
Forced expression of Spry1 in SCs attenuates age-associated SC loss.
(A) Representative FACS plots of cells isolated from 24-month-old Ctrl and Spry1OX synaptic and extra-synaptic diaphragms. Red boxes represent the gate for the SC population. (B) Quantification of FACS-purified SC percentage of total events from synaptic and extra-synaptic diaphragms. *p<0.05 compared to Ctrl group, two-factor ANOVA/Sidak multiple comparison test. n = 3 (Spry1OX) or 4 (Ctrl) mice.
Figure 4—figure supplement 2
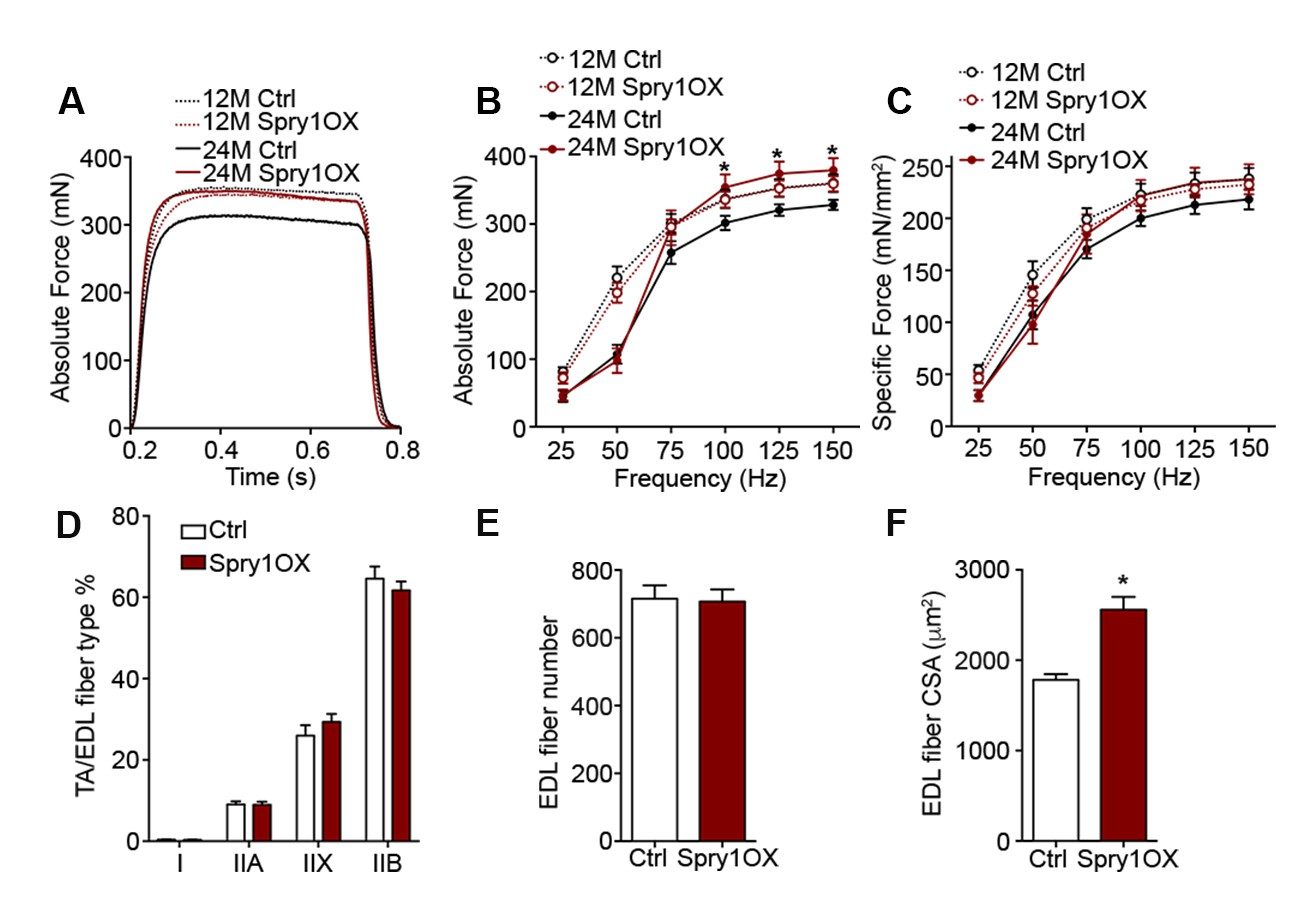
Forced expression of Spry1 in SCs impedes myofiber atrophy.
(A) Representative traces for absolute force from ex vivo muscle force generation measurements in 12-month-old (tamoxifen treated at 6 months) and aged Ctrl and Spry1OX EDL muscles upon stimulation at 150 Hz for 500 ms. (B) Same graph as shown in Figure 4H, but superimposed by peak absolute force generated by 12-month-old Ctrl and Spry1OX EDL muscles stimulated at different frequencies ex vivo. *p<0.05 compared to 12M groups and 24M Ctrl group, two-way ANOVA/Sidak multiple comparison test. (C) Peak specific force generated by 12-month-old and aged Ctrl and Spry1OX EDL muscles stimulated at different frequencies ex vivo. (D) Quantification of myofiber type composition in Ctrl and Spry1OX TA/EDL muscles. (E) Quantification of EDL myofiber number from aged Ctrl and Spry1OX mice. (F) Quantification of myofiber CSA in fixed Ctrl and Spry1OX EDL muscles. *p<0.05 compared to Ctrl, unpaired Student’s t-test. n = 4 (Ctrl) or 6 (Spry1OX) mice (B–C); n = 6 (Ctrl) or 9 (Spry1OX) mice (D); n = 4 muscles per group (E–F).
Figure 4—figure supplement 3
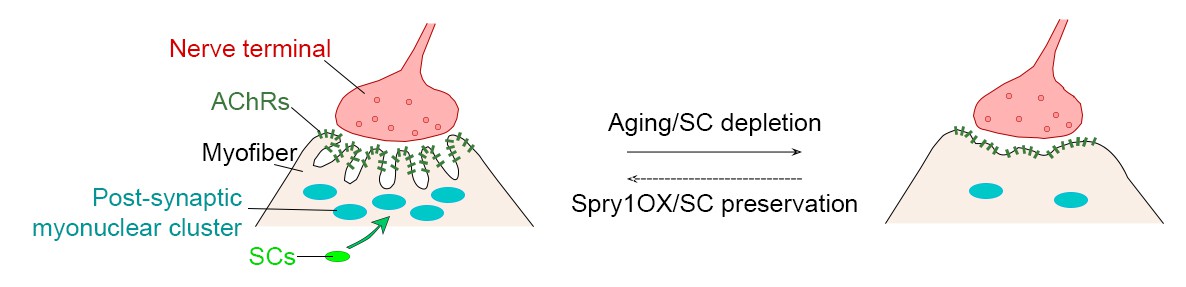
Model of the interrelationship between SC loss and NMJ deterioration with age.
NMJs deteriorate with age, demonstrated by reduced nerve terminal area and loss of post-synaptic complexity. Age-associated SC loss compromises SC-derived contribution to the post-synaptic myonuclei and is connected to age-related NMJ deterioration. SC depletion is sufficient to induce NMJ degeneration at a younger age. Conversely, Spry1OX attenuates aged related SC loss and NMJ degeneration.
Additional files
-
Supplementary file 1
RT-qPCR primer list.
- https://doi.org/10.7554/eLife.26464.018
Download links
A two-part list of links to download the article, or parts of the article, in various formats.
Downloads (link to download the article as PDF)
Open citations (links to open the citations from this article in various online reference manager services)
Cite this article (links to download the citations from this article in formats compatible with various reference manager tools)
Loss of adult skeletal muscle stem cells drives age-related neuromuscular junction degeneration
eLife 6:e26464.
https://doi.org/10.7554/eLife.26464


