A druggable secretory protein maturase of Toxoplasma essential for invasion and egress
- University of Geneva, Switzerland
- ETH Zurich/University of Zurich, Switzerland
- Inserm U1019, CNRS UMR8204, Institut Pasteur de Lille, France
- University of Zurich, Switzerland
Figures
Figure 1 with 6 supplements
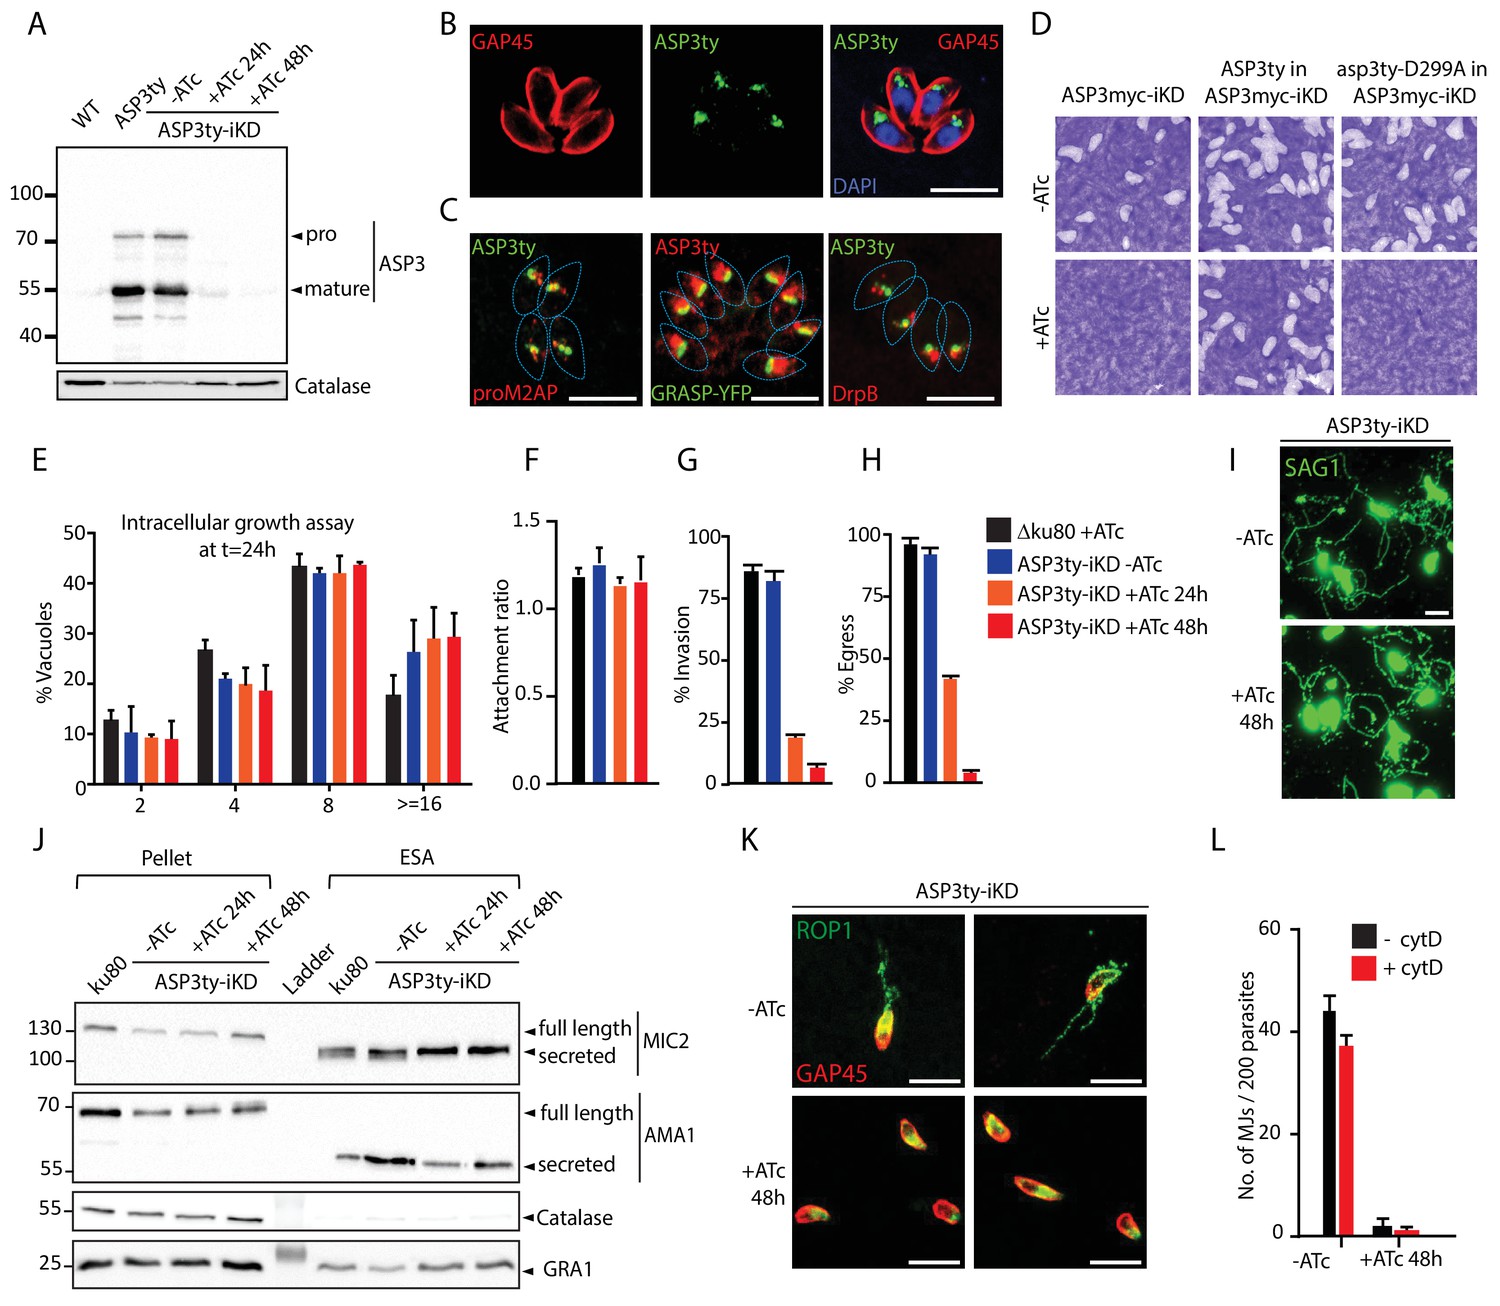
ASP3 is present in the secretory pathway and is essential for invasion and egress.
(A) Ty-tagged endogenous ASP3 (ASP3ty) expression and tight regulation of ASP3ty tet-inducible knockdown (ASP3ty-iKD -/+ATc) assessed by western blot. Catalase was used as loading control. (B) ASP3 localizes to a post-Golgi compartment. (C) Ty-tagged ASP3 expressed from a tubulin promoter partially colocalized with GRASP-YFP, proM2AP and DrpB. (D) ASP3 depletion results in drastic impairment of the lytic cycle, as assessed by plaque formation after 7 days, in the presence of ATc. Complementation with a second WT copy of ASP3 (ASP3ty) fully restored plaque formation whereas complementation with a catalytically dead mutant (asp3ty-D299A) could not. ASP3 depleted parasites (24 or 48 hr +ATc) showed no defect in E) intracellular replication and in F) attachment, but showed a strong defect in G) invasion and H) egress compared to control RHΔku80 (48 hr +ATc) or non-treated ASP3ty-iKD parasites. Data are presented as mean ±standard deviation (SD) from 3 independent experiments. (I) ASP3 depleted parasite (48 hr +ATc) showed no defect in gliding motility. Gliding trails are detected using anti-SAG1 antibodies. (J) Western blot analyses of excreted-secreted antigens (ESA) and pellets from ASP3ty-iKD parasites, +/−ATc, after stimulation with 2% Ethanol (EtOH) showed normal secretion of the microneme proteins MIC2 and AMA1. Full length and secreted fragments are showed with arrowheads. Catalase was used as cytosolic control and GRA1 for constitutive secretion. (K) ASP3 depletion resulted in a complete absence of rhoptry content secretion as assessed by evacuole formation by probing against the rhoptry protein ROP1. (L) The formation of the MJ was assessed by the specific labelling of secreted RON4 and showed to be dependent on the presence of ASP3. This was independent of cytochalasin D treatment. Data are represented as mean ±standard deviation of three independent biological replicate experiments. All scale bars throughout represent 8 μm.
-
Figure 1—source data 1
Source data of the triplicate experiments done on the ASP tet-inducible knockdown strains (-ATc, +ATc 24 hr and +ATc 48 hr) for Intracellular growth assay (E), Host cell attachment assay (F), Invasion assay (G), Egress assay (H) and quantification of MJs (L).
- https://doi.org/10.7554/eLife.27480.009
Figure 1—figure supplement 1

Phylogenetic clustering of apicomplexan aspartyl proteases.
Apicomplexan ASPs cluster into 6 distinct phylogenetic groups. An unrooted maximum likelihood tree of apicomplexan ASPs was generated using PhyML v3.0, using WAG model of amino acids substitution with NNI topology search, based on an amino acid alignment by MUSCLE. The aspartyl proteases are represented by the EuPathDB accession numbers, except for Goussia janae as Gj (Dogga et al., 2015). Node support values are indicated.
Figure 1—figure supplement 2
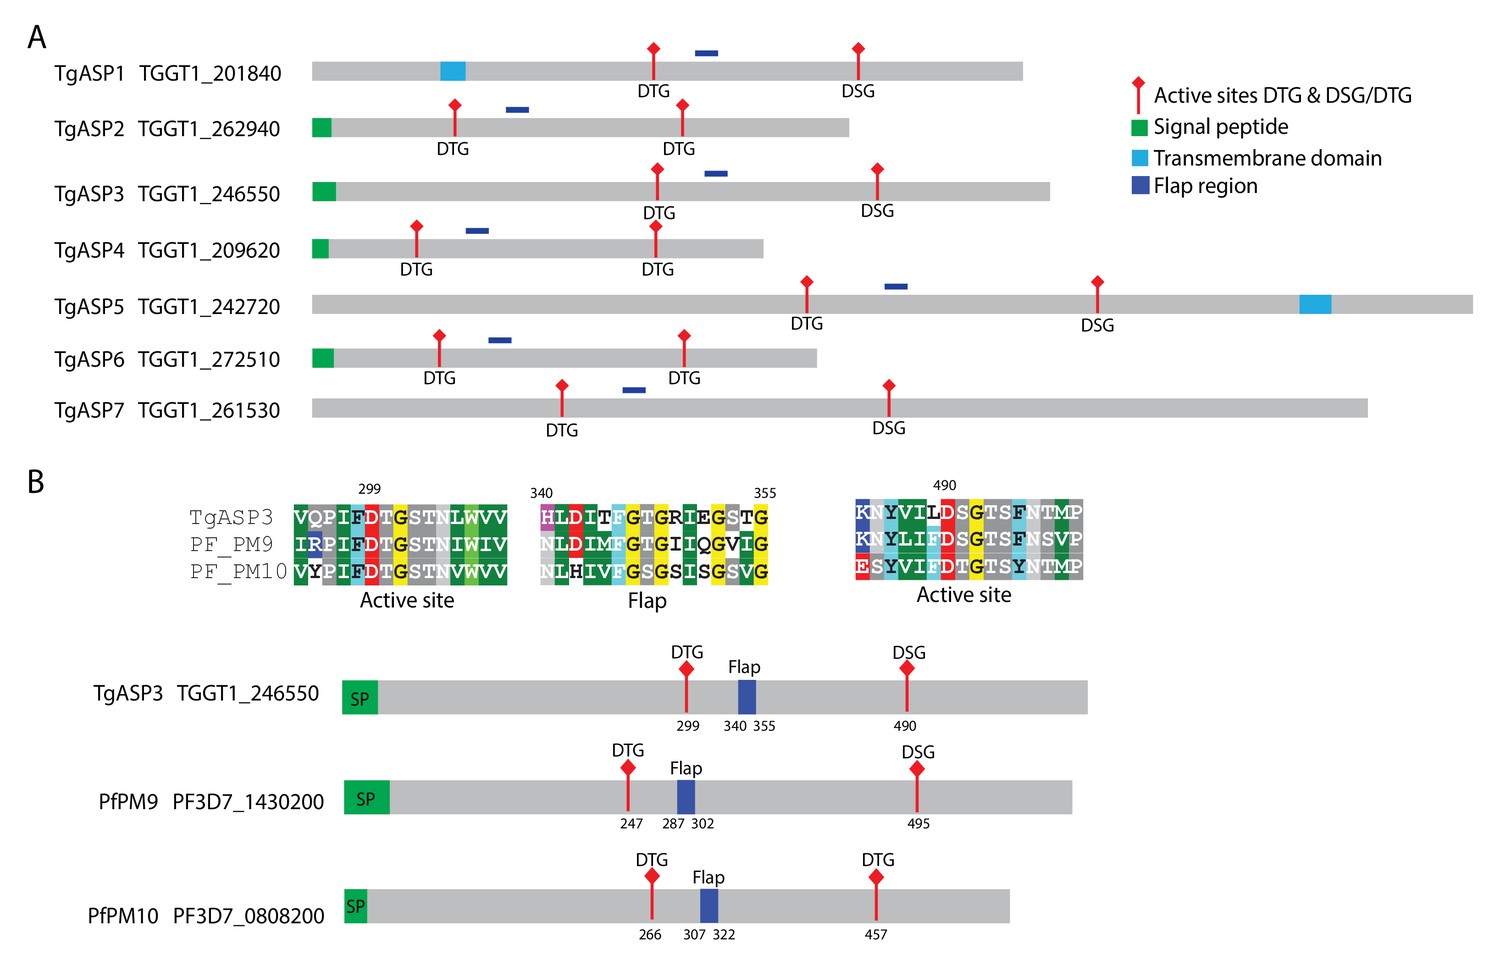
T. gondii aspartyl proteases and its P. falciparum homologs.
(A) Schematic representation of the 7 aspartyl proteases of T. gondii. (B) Alignment of ASP3 with its corresponding P. falciparum plasmepsins (PM) homologs PM9 and PM10. The protein sequences were aligned using the MUSCLE program. The signal peptides are depicted in green, TM domains in blue and the conserved flap region in dark blue. The positions of the two catalytic Asp residues in the motifs DTG or DTG/DSG are in red and indicated.
Figure 1—figure supplement 3
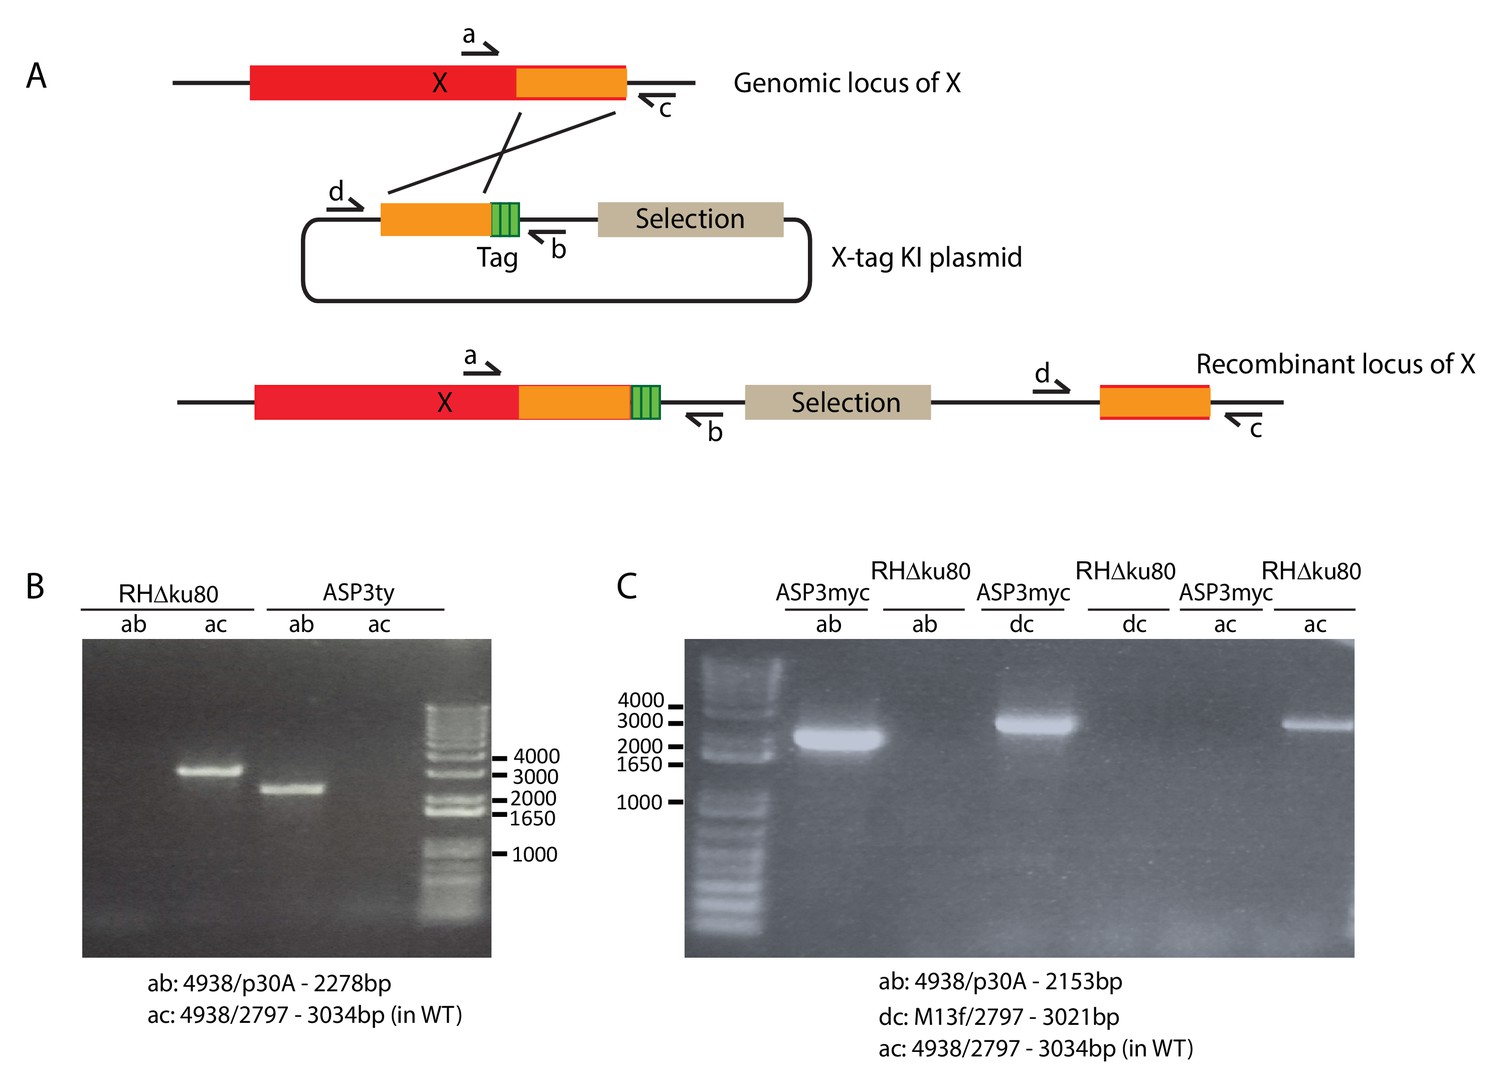
Strategy for epitope tagging at the endogenous locus.
(A) Schematic representation of the strategy used to generate the endogenous epitope tagged strains used in this study. (B) PCR analyses on the ASP3ty and (C) ASP3myc strains to check for correct integration.
Figure 1—figure supplement 4
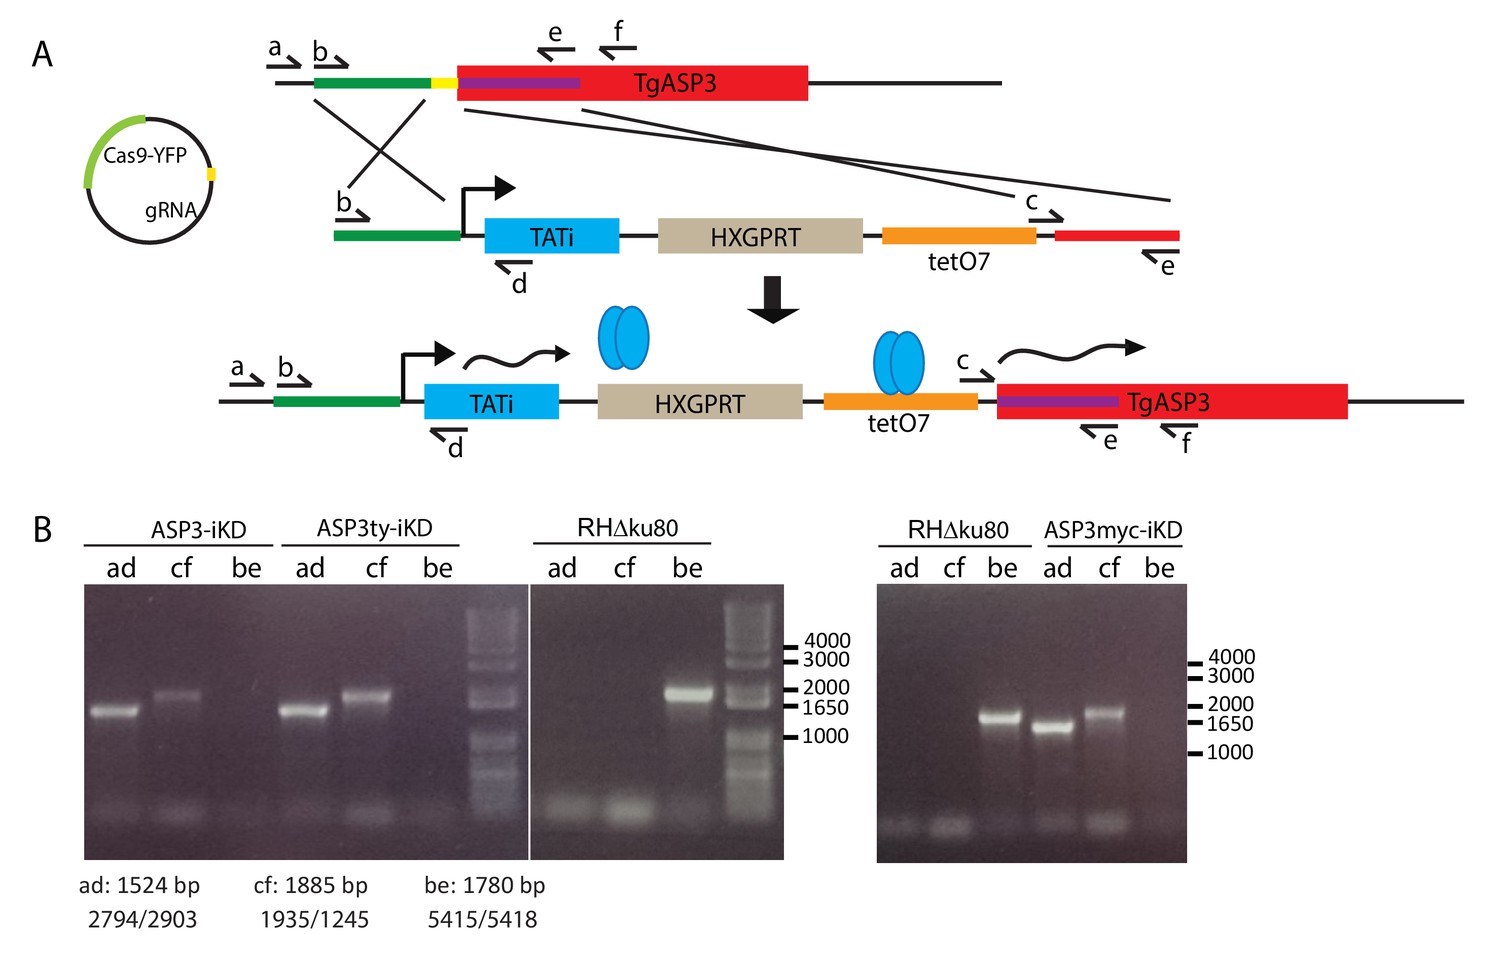
Generation of the tet-inducible ASP3 strains.
(A) Schematic representation of ASP3-iKD recombinant locus. By CRISPR/Cas9 mediated double homologous recombination, we inserted the transactivator TATi-1 expression cassette and a 7-tet-Op Sag1 (tetO7) inducible promoter, which replaced the endogenous ASP3 promoter. Upon addition of ATc, the gene is silenced. Subsequently, ASP3-iKD was endogenously tagged with either Myc or Ty tags to give ASP3ty-iKD and ASP3myc-iKD strains. (B) PCR analyses on the ASP3-iKD, ASP3ty-iKD and ASP3myc-iKD strains to assess correct integration.
Figure 1—figure supplement 5
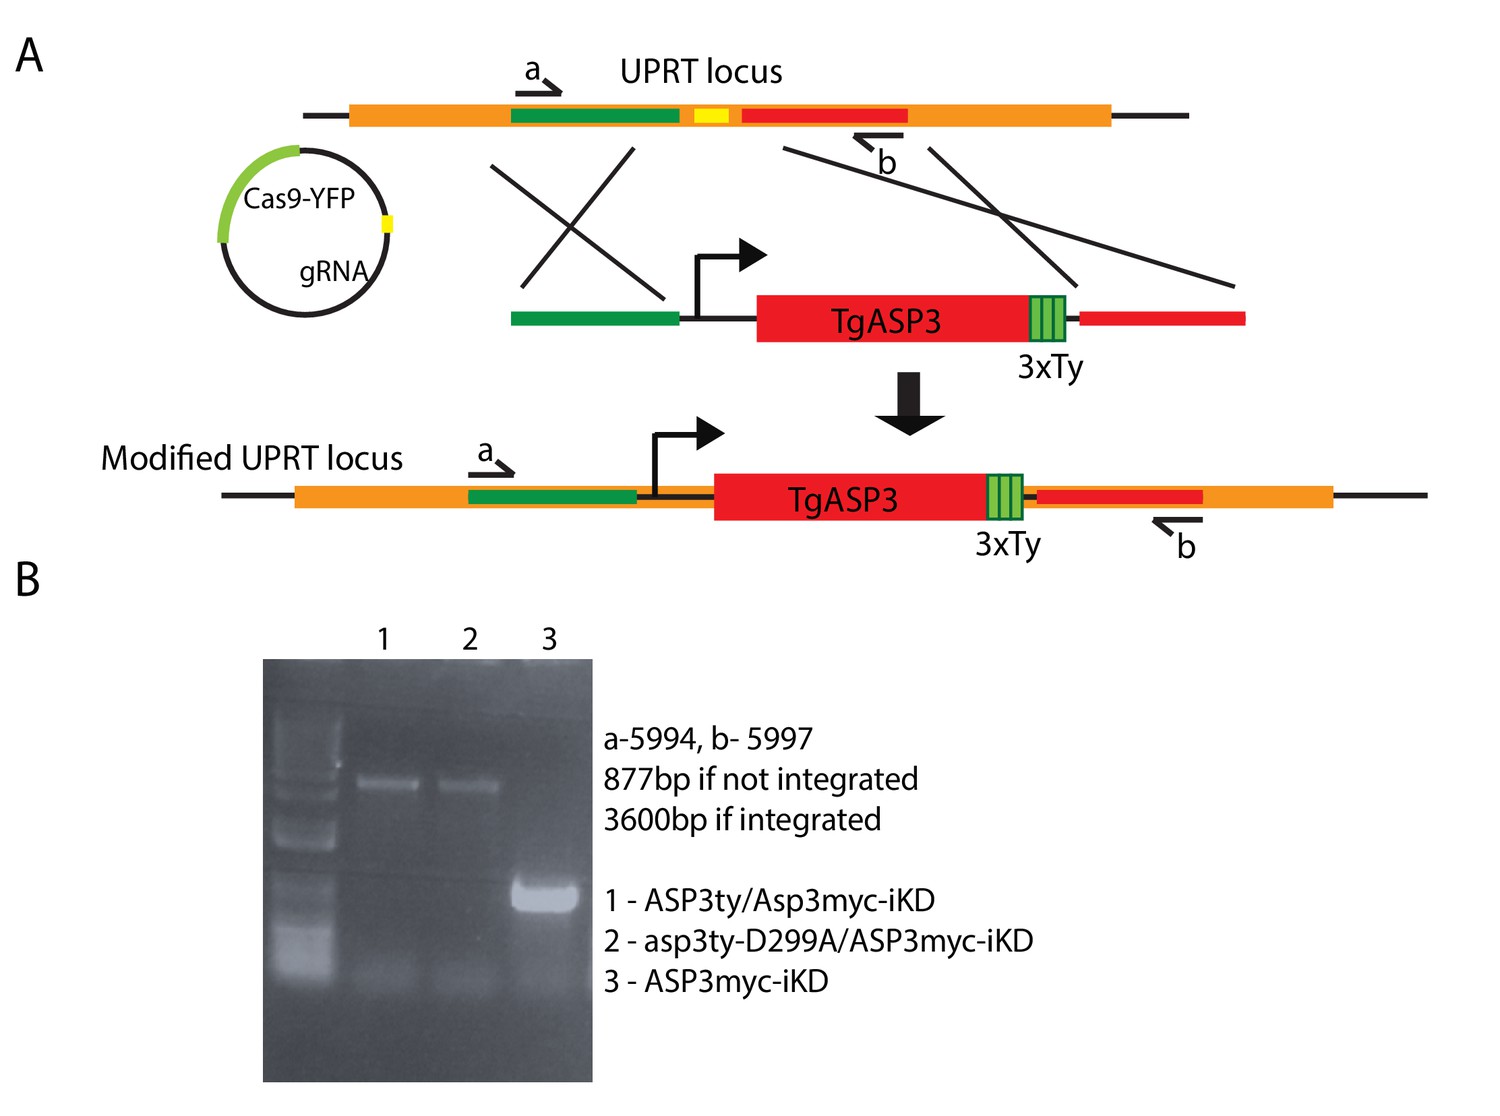
Complementation in tet-inducible ASP3 strain with WT ASP3ty and the catalytically dead mutant asp3ty-D299A.
(A) CRISPR/Cas9 gRNA mediated recombination in the UPRT locus of second cDNA copy of ASP3ty and asp3ty-D299A. (B) Correct integration of the above constructs was shown by PCR.
Figure 1—figure supplement 6
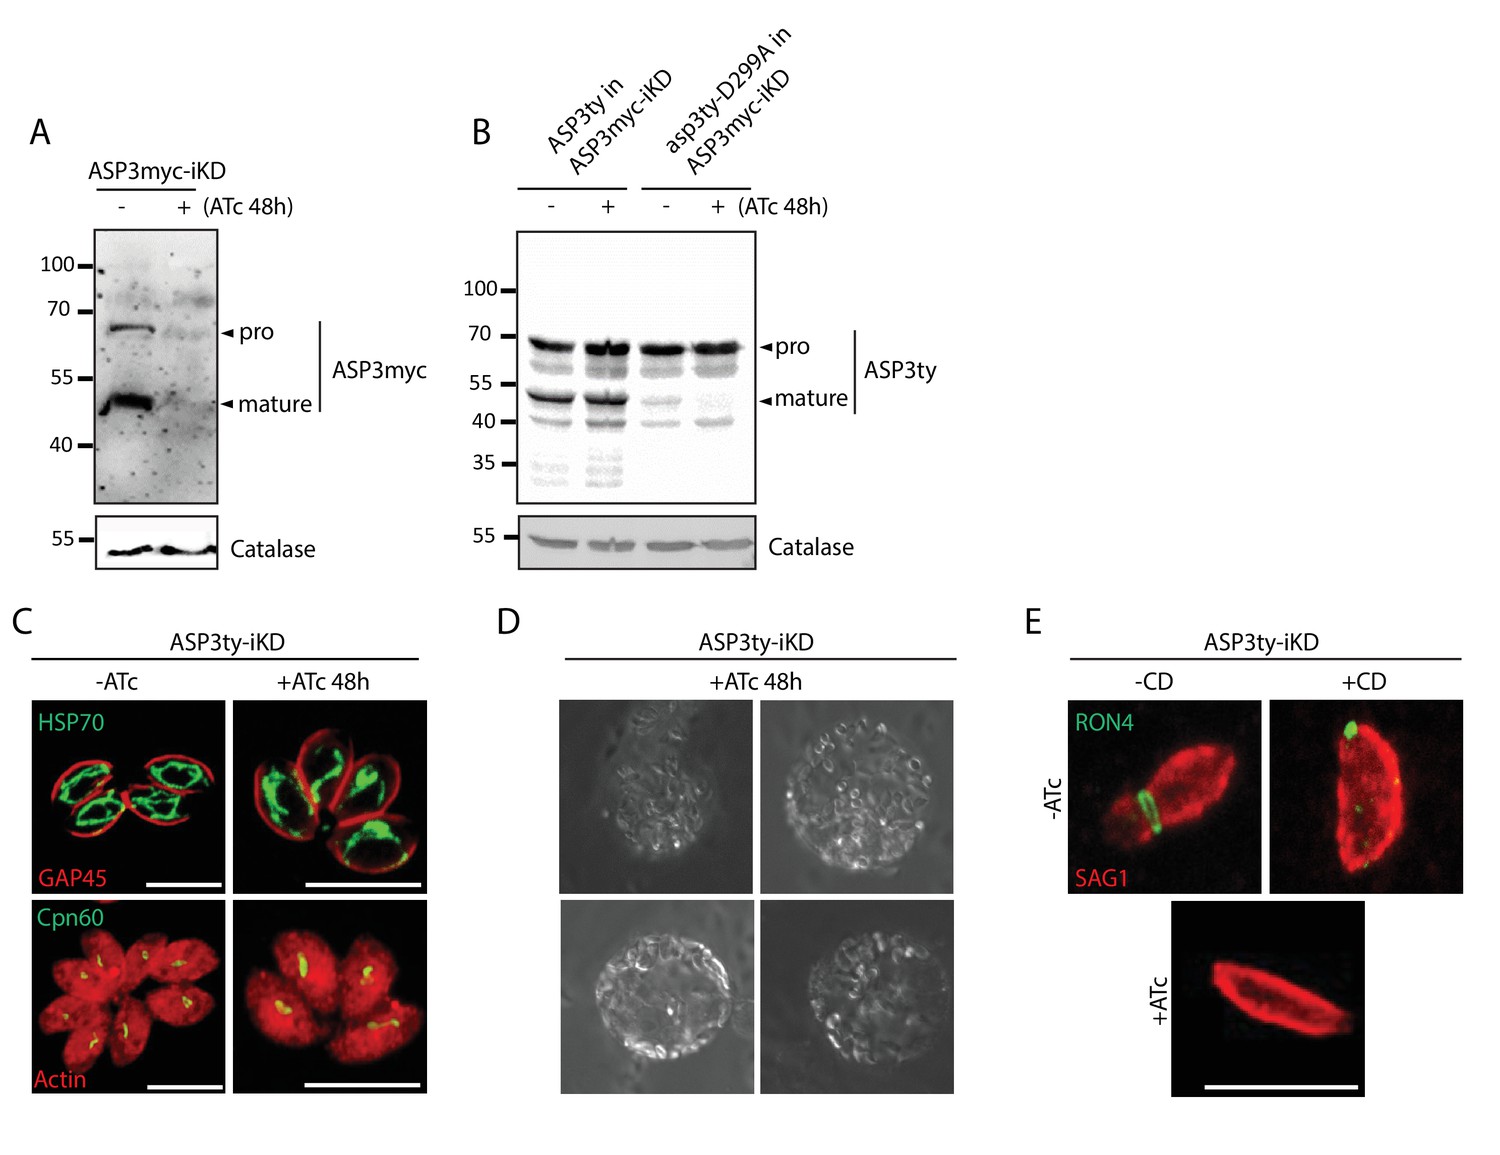
Phenotyping of ASP3 depleted parasites.
(A) ASP3myc-iKD was tightly regulated by 48 hr ATc treatment. (B) Complementation of ASP3myc-iKD with ASP3ty and asp3ty-D299A revealed that the processing of ASP3 is likely autocatalytic. Catalase was used as loading control. Arrowheads represent pro and mature forms of the proteins. (C) Knockdown of ASP3 does not affect the morphology of the mitochondrion and the apicoplast. (D) Snapshots of the floating spherical structures observed upon induced egress in parasites lacking ASP3. (E) Representative images of the parasites scored in Figure 1L. The formation of the MJ was assessed by the specific labelling of secreted RON4 and showed to be dependent on the presence of ASP3. This was independent of Cytochalasin D treatment.
Figure 2 with 1 supplement
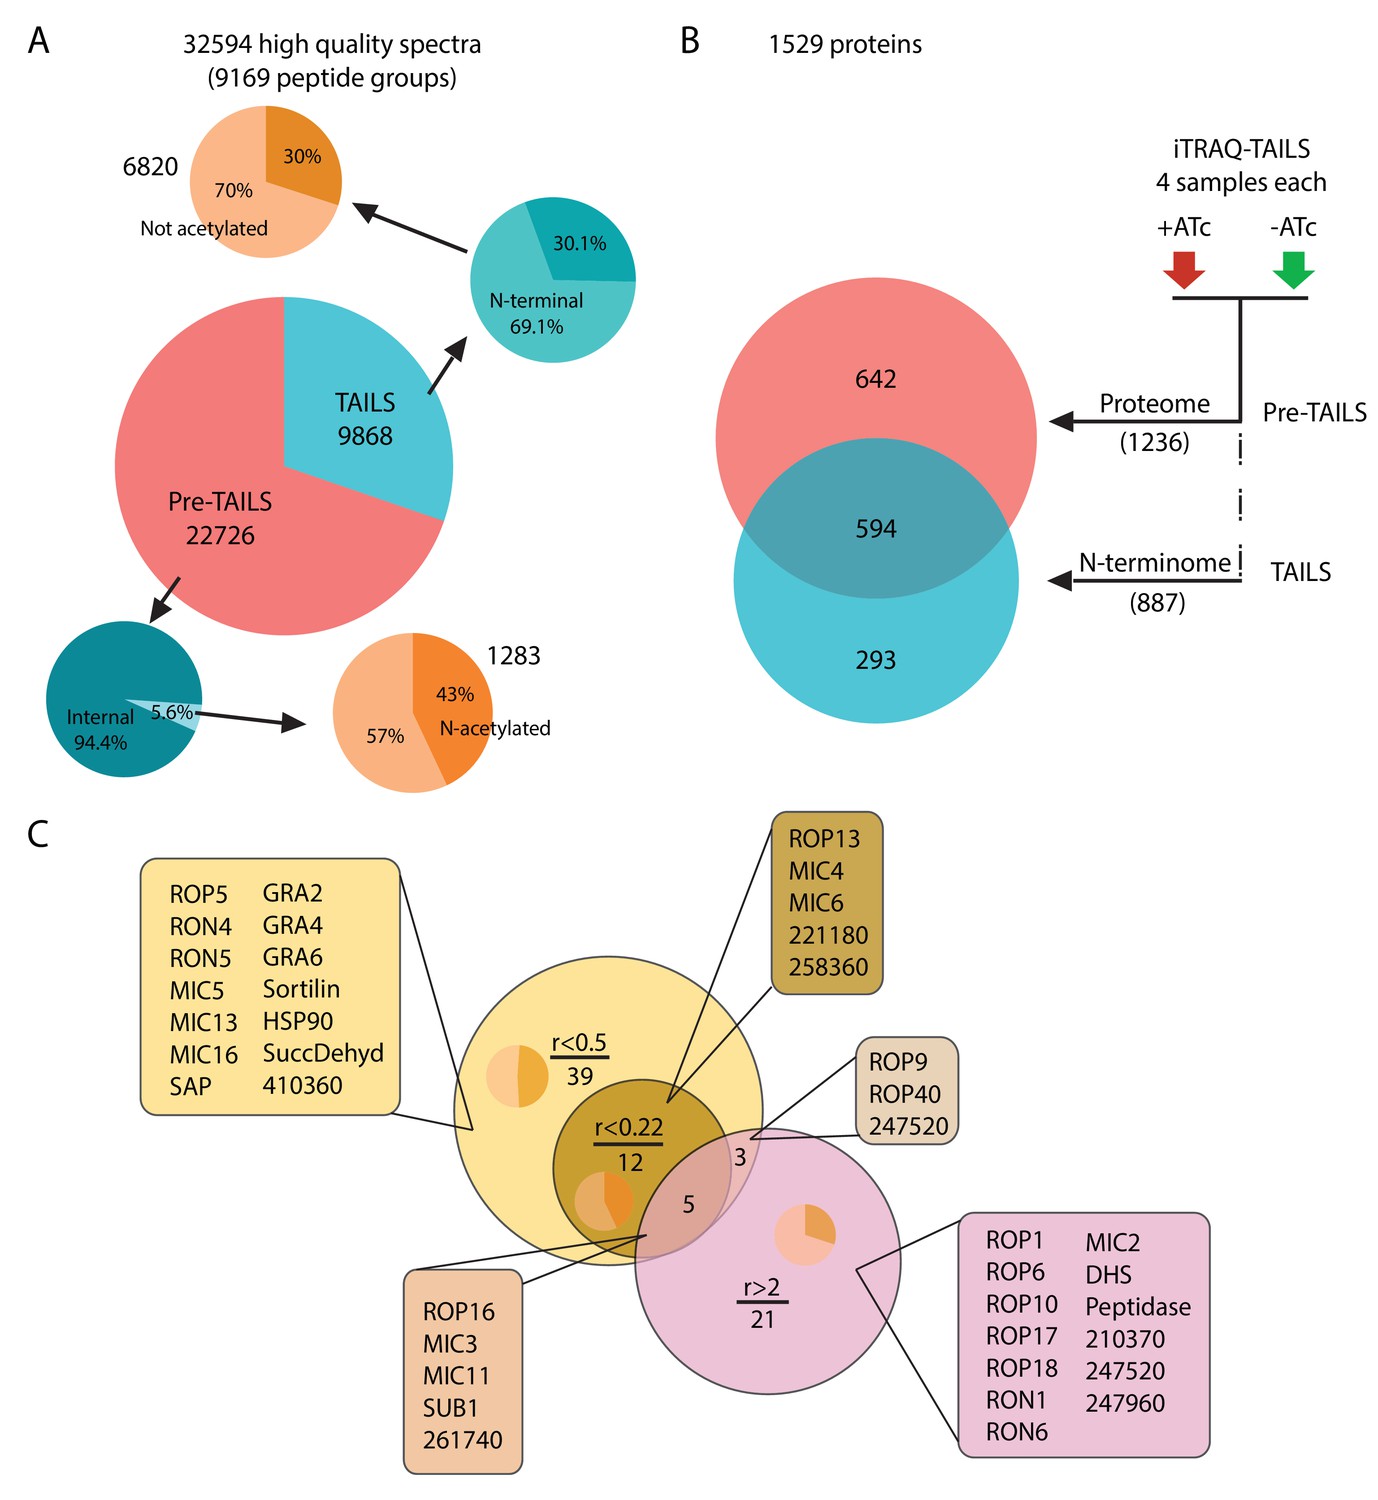
Global analysis of MS data and peptide ratios.
(A) All measured spectra (65’900) minus those with low quality attributes leave 32’594 high quality spectra (9169 peptide groups) for the analysis. The graphical representation depicts proportions of N-terminal peptides in the pre-TAILS and TAILS datasets (blue pie charts) and corresponding N-acetyl modifications (ochre pie charts). N-termini in the TAILS fraction are enriched by >10 fold (69% vs 6%) over internal peptides (generated by trypsin cleavage). (B) Graphical representation of the 1529 proteins in the combined datasets. Of those 642 and 293 are unique to the pre-TAILS or the TAILS fractions, respectively. (C) Graphical depiction of data generated by calculating +ATc/-ATc peptide ratios revealing ASP3-dependent processing (for details see also Table supplement 1-4). Threshold ratios (r) are indicated in the Venn diagram. Lists of proven or predicted secreted proteins represented by peptides with ratios indicated in the circles corresponding to each area in the diagram are boxed. Inset pie charts indicate the proportions of secreted (light sector) vs. cytosolic proteins (dark sector). Gene models for hypothetical proteins are indicated by the ToxoDB 6 digit designator (prefix TGGT1_).
Figure 2—figure supplement 1
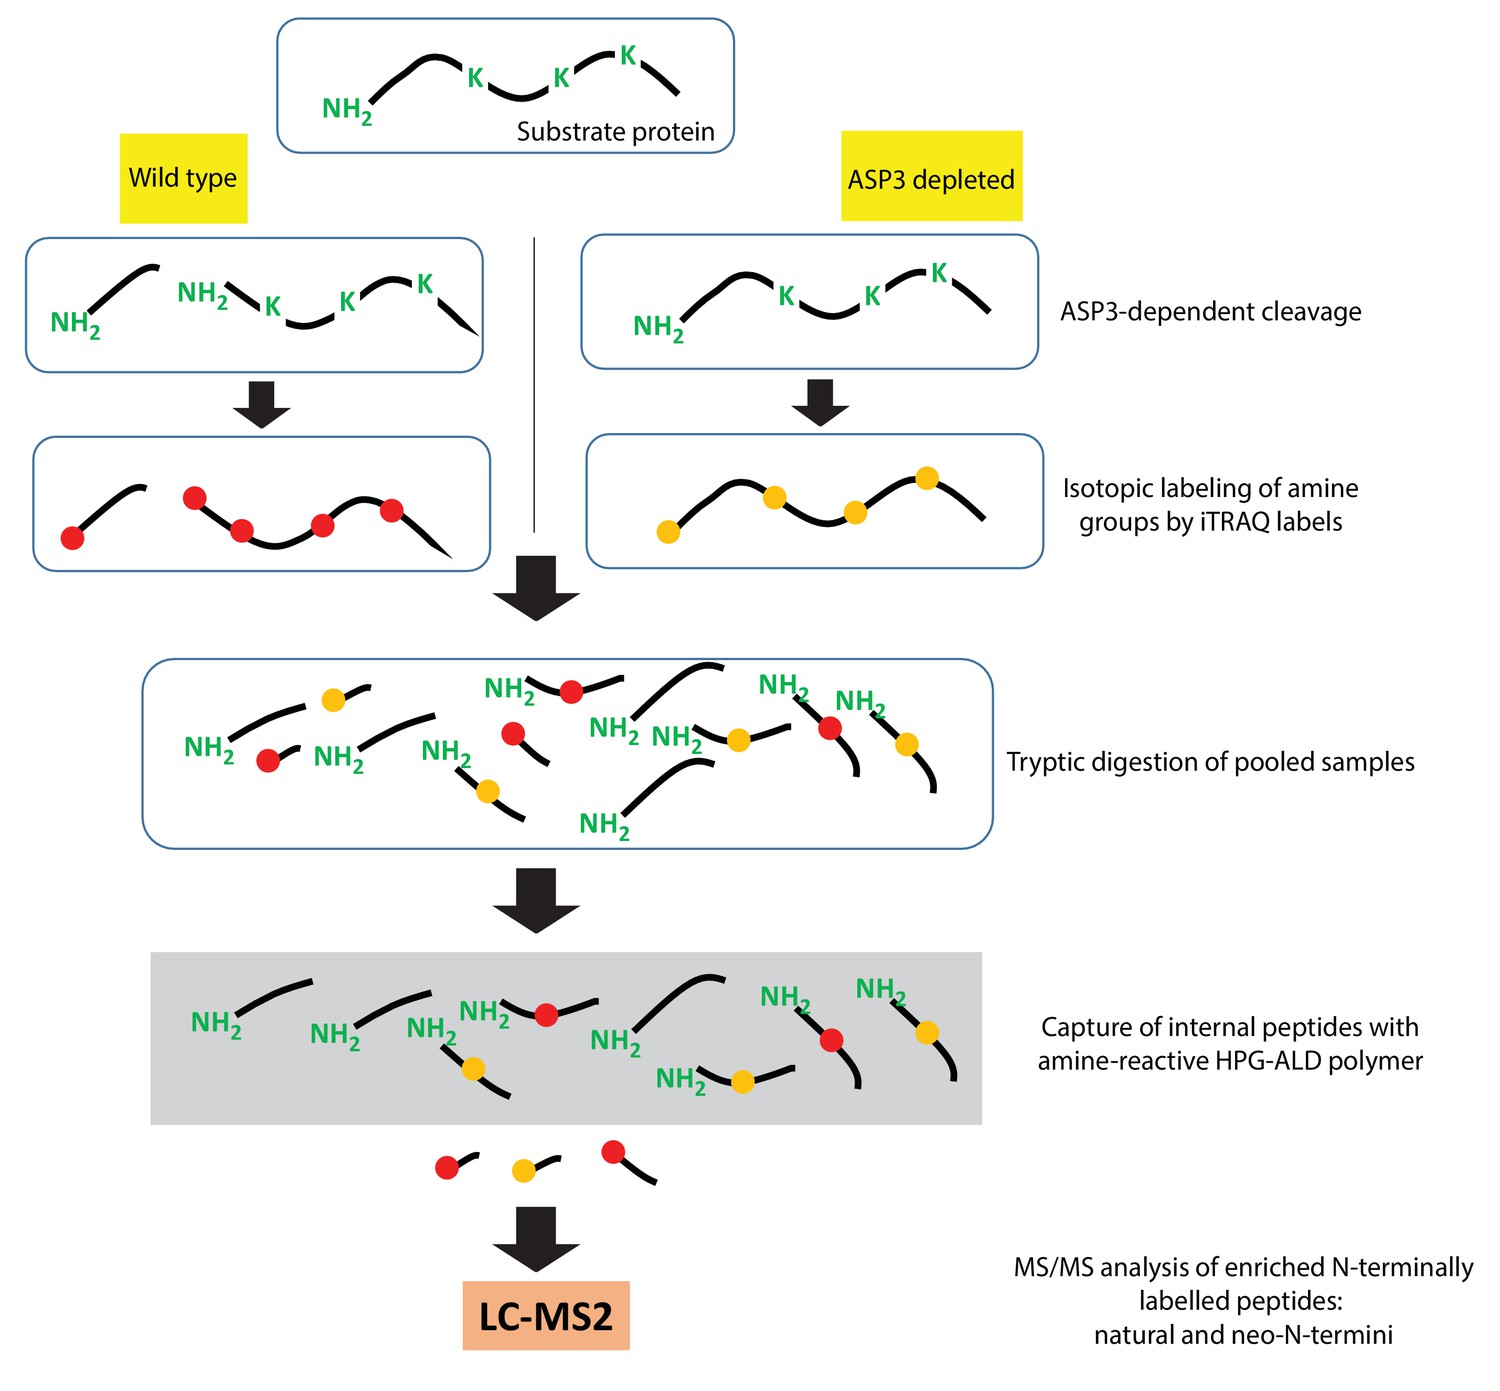
Schematic of the TAILS assay.
https://doi.org/10.7554/eLife.27480.014
Figure 3 with 1 supplement

ASP3 is a maturase for microneme proteins and impacts microneme processing post-exocytosis via SUB1.
(A) Schematic representation of MICs and their processing pre-exocytosis (red) and post-exocytosis by ROM4/5 (light blue). (B) Immunoblots assessing the processing of the microneme proteins M2AP, MIC3, MIC6, AMA1 upon ASP3 knockdown. Catalase was used as loading control. (C) ASP3ty but not asp3ty-D299A can rescue the processing of MIC6 in absence of ASP3myc. (D), (E), (F) Immunoblots assessing the processing of the microneme proteins MIC5, TLN4 and PLP1 upon ASP3 knockdown. MIC5 was Ty-tagged at the endogenous locus in ASP3-iKD and transient plasmid transfection of epitope tagged TLN4 was used. (G) IFAs evaluating the localization of microneme proteins upon ASP3 depletion – M2AP, MIC6 and MIC3, co-localized with either MIC2 or AMA1. White arrowhead points to the pro form of M2AP. (H) Immunoblot analyses of ESA from ASP3ty-iKD parasites, +/−ATc, after 2% EtOH stimulation show impaired post-exocytosis cleavage of MIC2, M2AP and MIC4. (I) Schematic representation of microneme proteins and their putative processing post-exocytosis by SUB1. (J) Endogenously tagged SUB1 was localized in the microneme independently of ASP3. (K) Depletion of ASP3 showed impaired processing of SUB1in ESA analyses. TgSUB1 was detected using an antibody raised against PfSUB1. Black arrowheads represent pro and mature forms of the proteins.
Figure 3—figure supplement 1
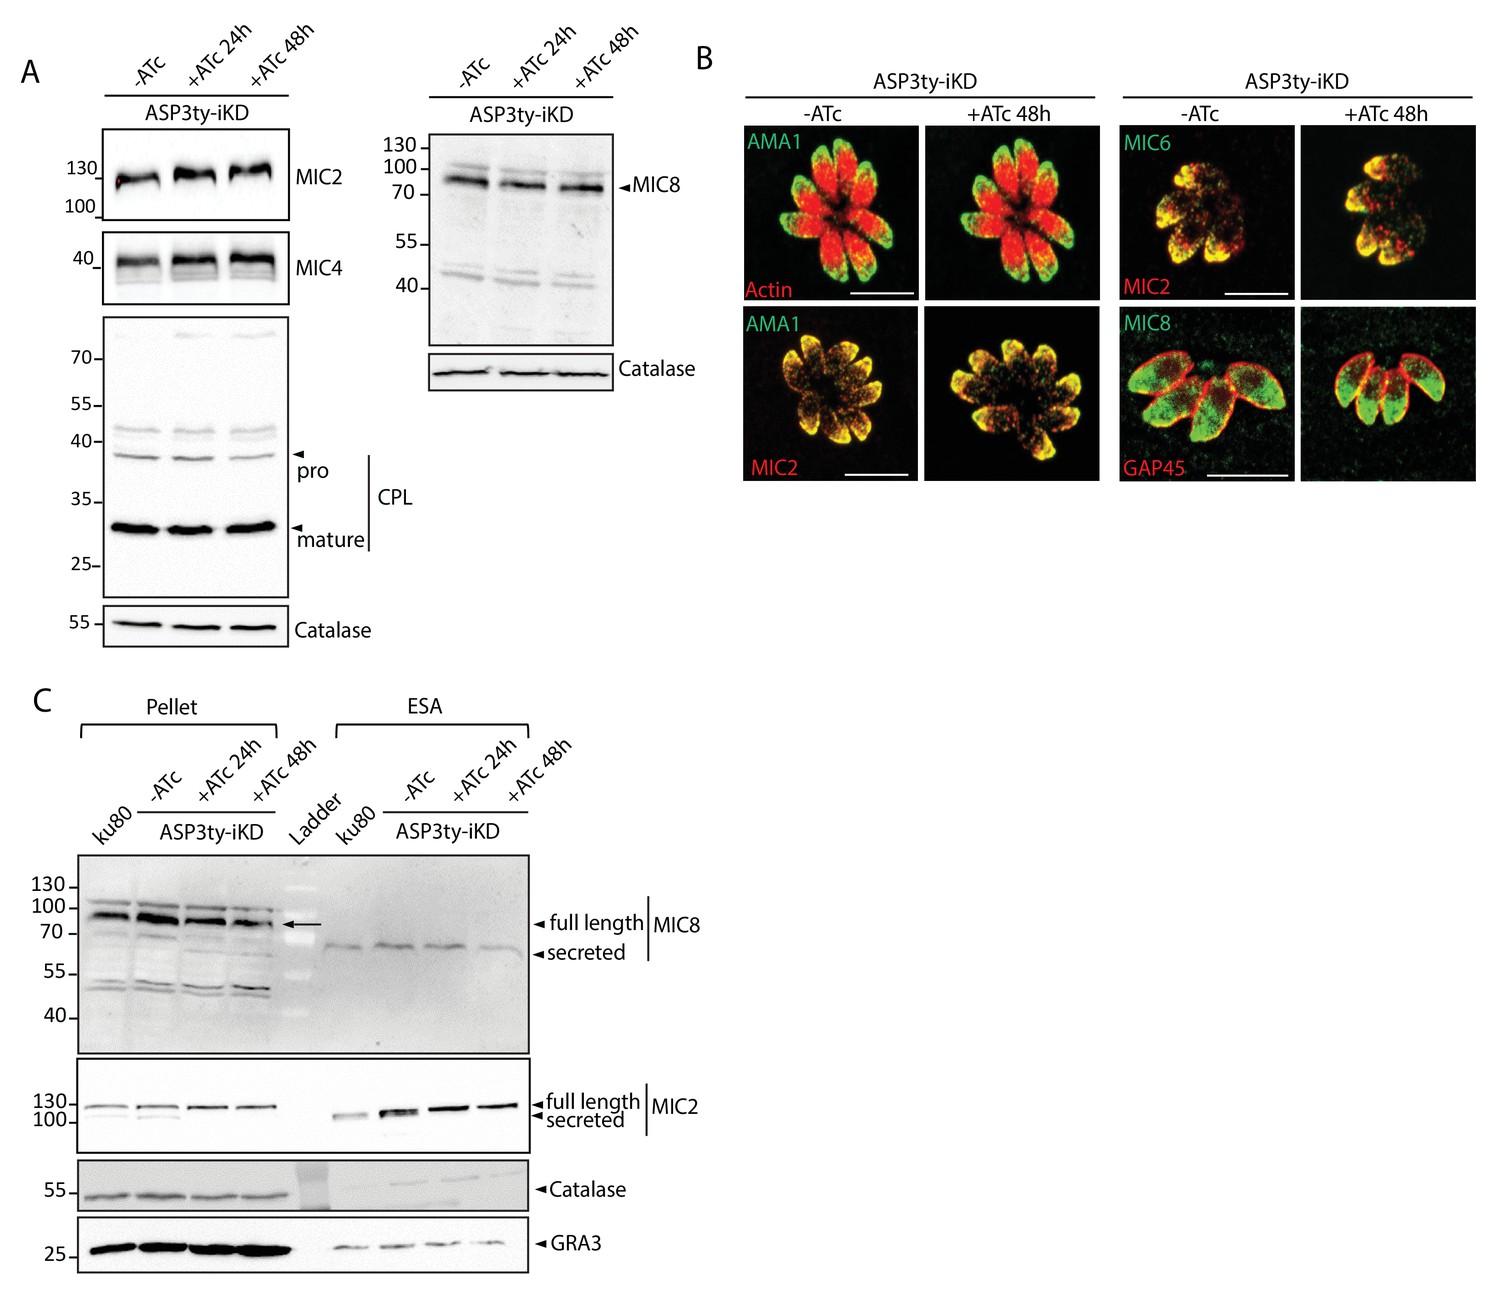
Effect of ASP3 depletion on MICs.
(A) In parasites lacking ASP3, MIC2, MIC4, CPL, MIC8 processing is unchanged. Catalase was used as loading control. Arrowheads represent pro and mature forms of the proteins. (B) Microneme protein localizations were not affected by ASP3 depletion (48 hr +/−ATc). (C) Secretion of MIC8 was not affected with ASP3 depletion, as assessed by western blot analyses of excreted-secreted antigens (ESA) and pellets from ASP3ty-iKD parasites, +/−ATc, after stimulation with 2% Ethanol (EtOH). MIC2 was used as positive control for secretion, while Catalase was used as cytosolic control and GRA1 for constitutive secretion. Full length and secreted fragments are showed with arrowheads.
Figure 4 with 4 supplements
ASP3 is involved in the processing of rhoptry proteins.
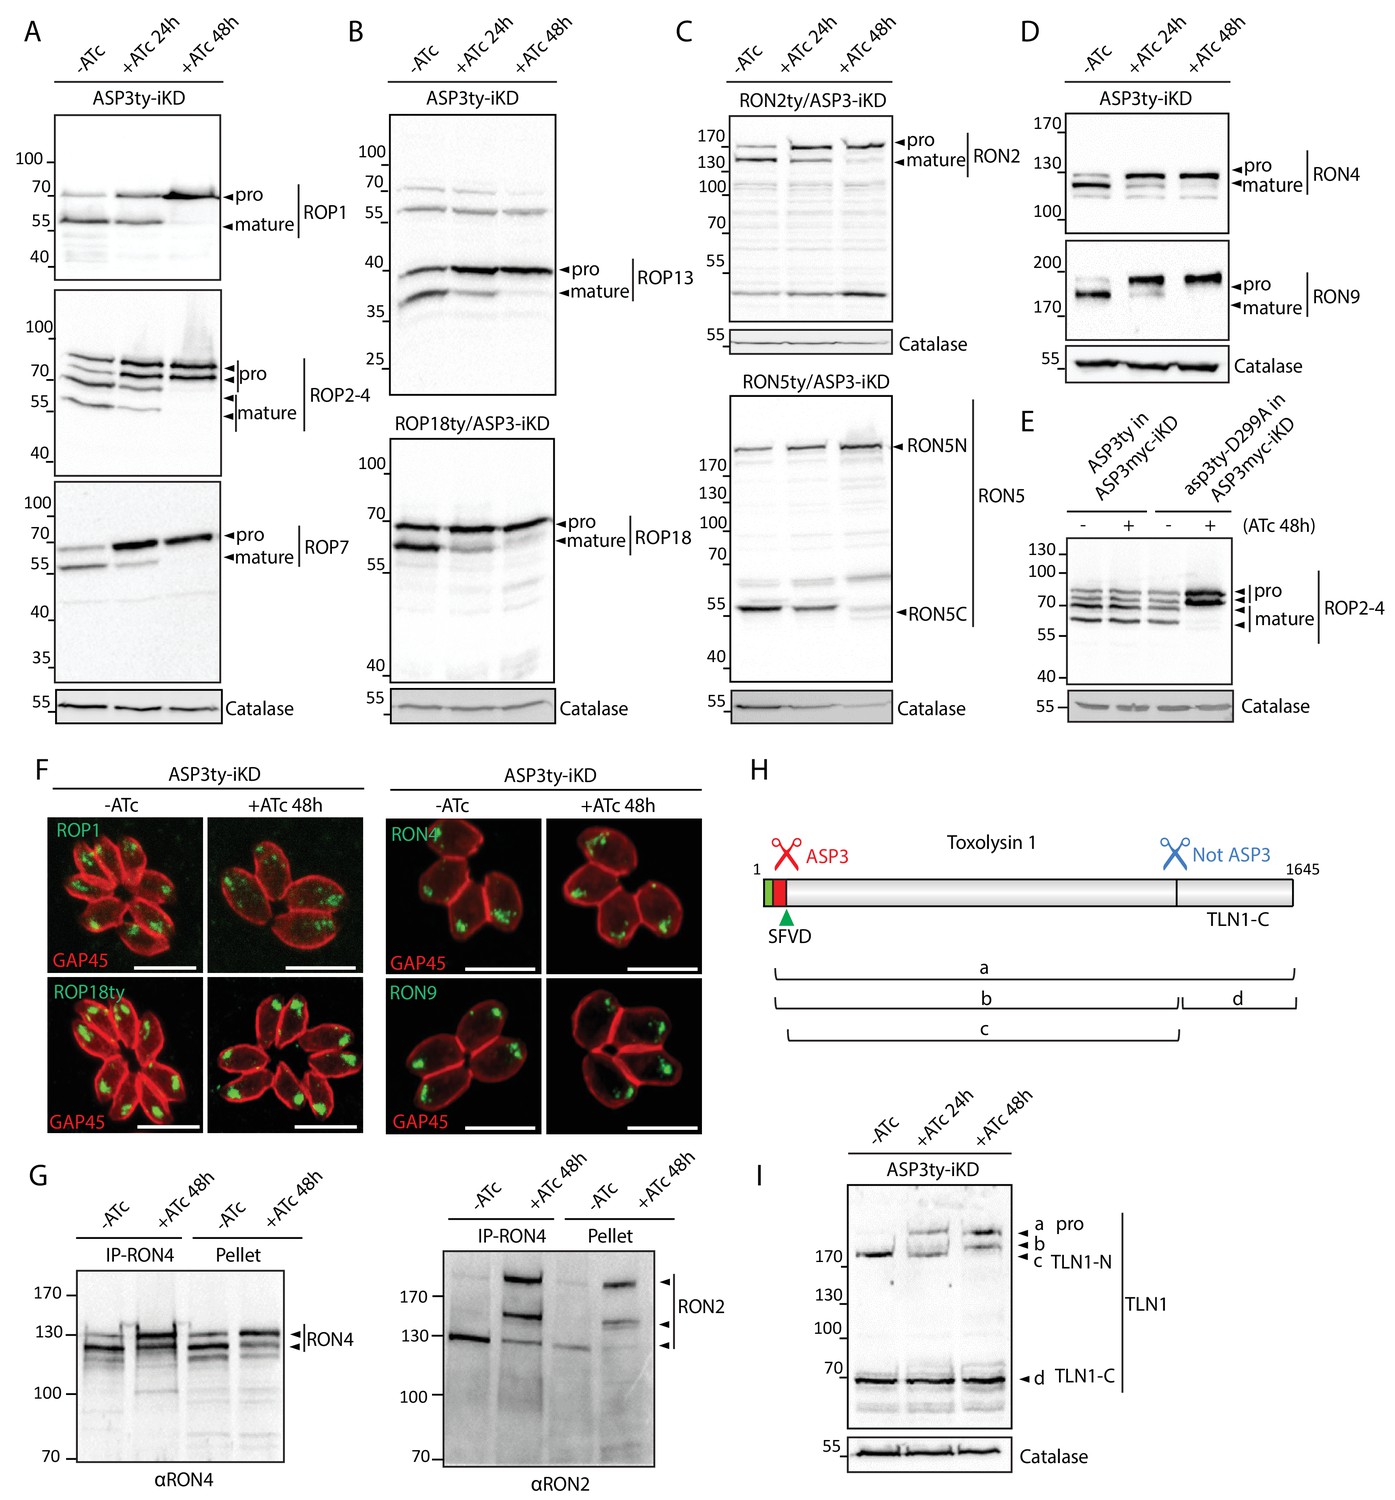
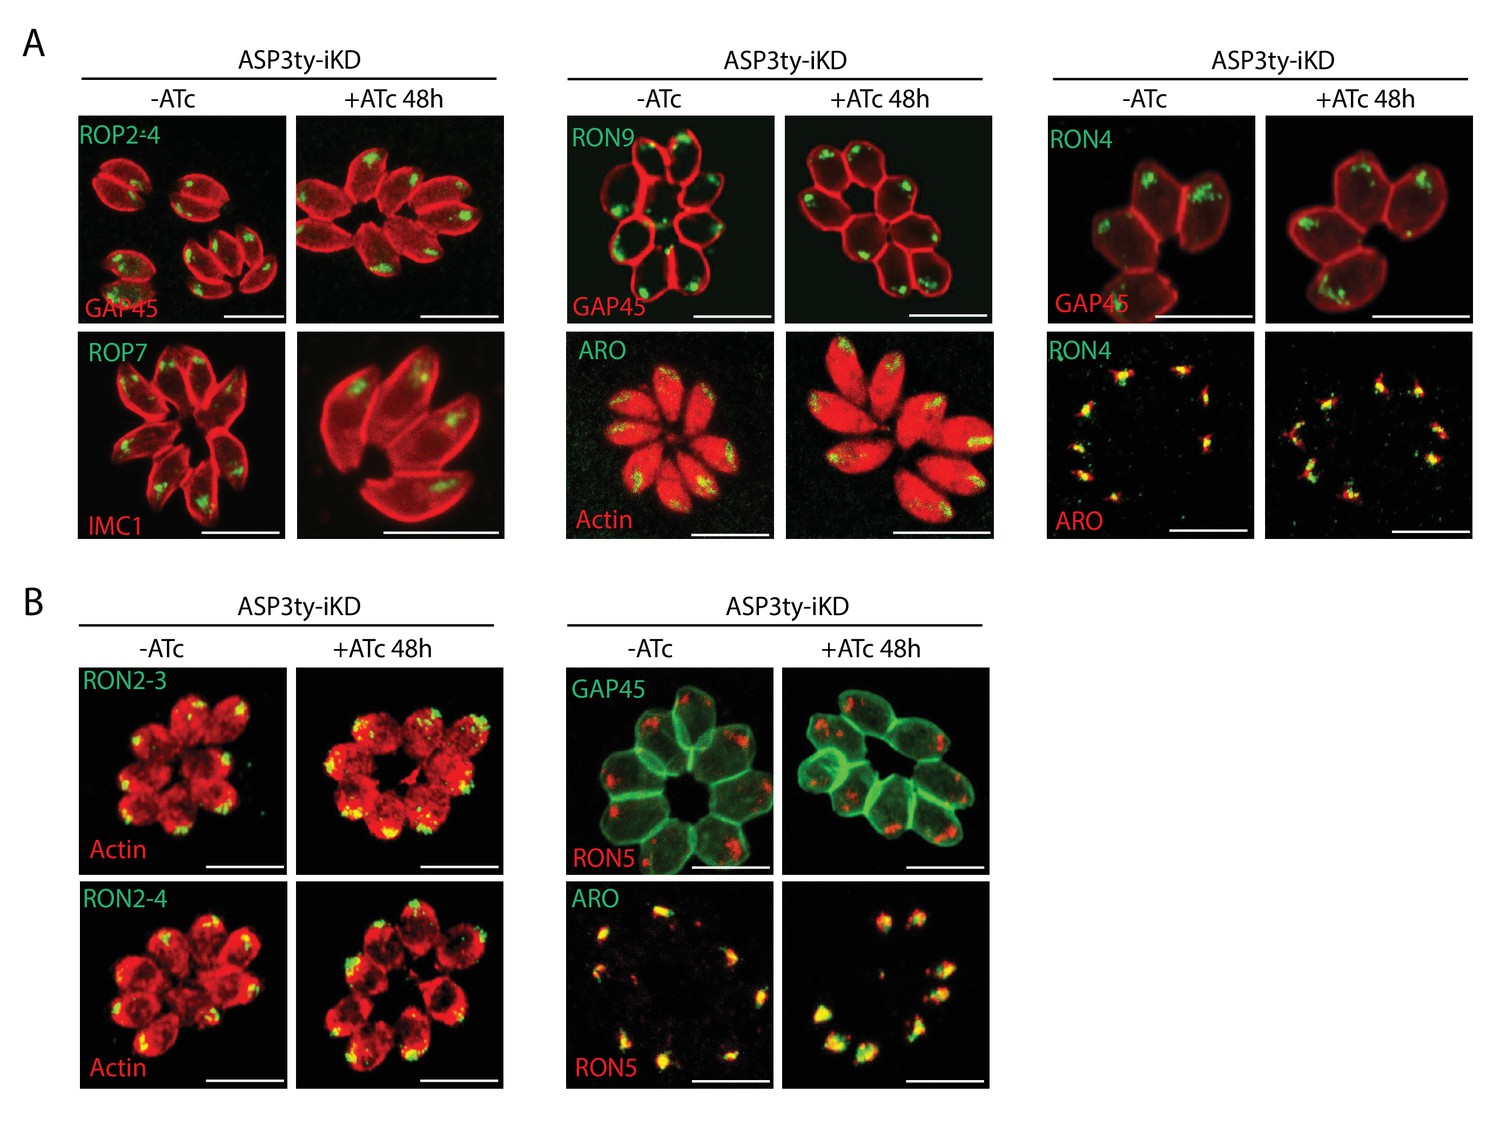
(A), (B) Immunoblots evaluating the processing of the rhoptry bulb proteins ROP1, ROP2-4, ROP7, ROP13, and ROP18 upon ASP3 knockdown. ROP18 was Ty-tagged at endogenous locus in ASP3-iKD. Catalase was used as a loading control. Arrowheads represent pro and mature forms of the proteins. (C), (D) Immunoblots evaluating the processing of the rhoptry neck proteins RON2, RON4, RON5 and RON9 upon ASP3 knockdown. RON2 and RON5 were Ty-tagged at the endogenous locus in ASP3-iKD. (E) ASP3ty but not asp3ty-D299A can rescue the processing of ROP2-4 in absence of ASP3myc. (F) IFAs evaluating localization of ROP1, ROP18, RON4, and RON9 upon ASP3 knockdown. No alteration was observed in absence of ASP3. (G) ASP3 depletion did not impact on the formation of the RON4-RON2 complex as demonstrated by co-immunoprecipitation of RON2 with RON4 antibodies. (H) Schematic for the processing events and products of TLN1. (I) Immunoblot evaluating TLN1 showed that ASP3 depletion abolished the pro-domain processing of TLN1.
Figure 4—figure supplement 1
Effect of ASP3 depletion on rhoptry proteins.
(A) and B) ASP3 knockdown did not impact on the localization of rhoptry proteins.
Figure 4—figure supplement 2
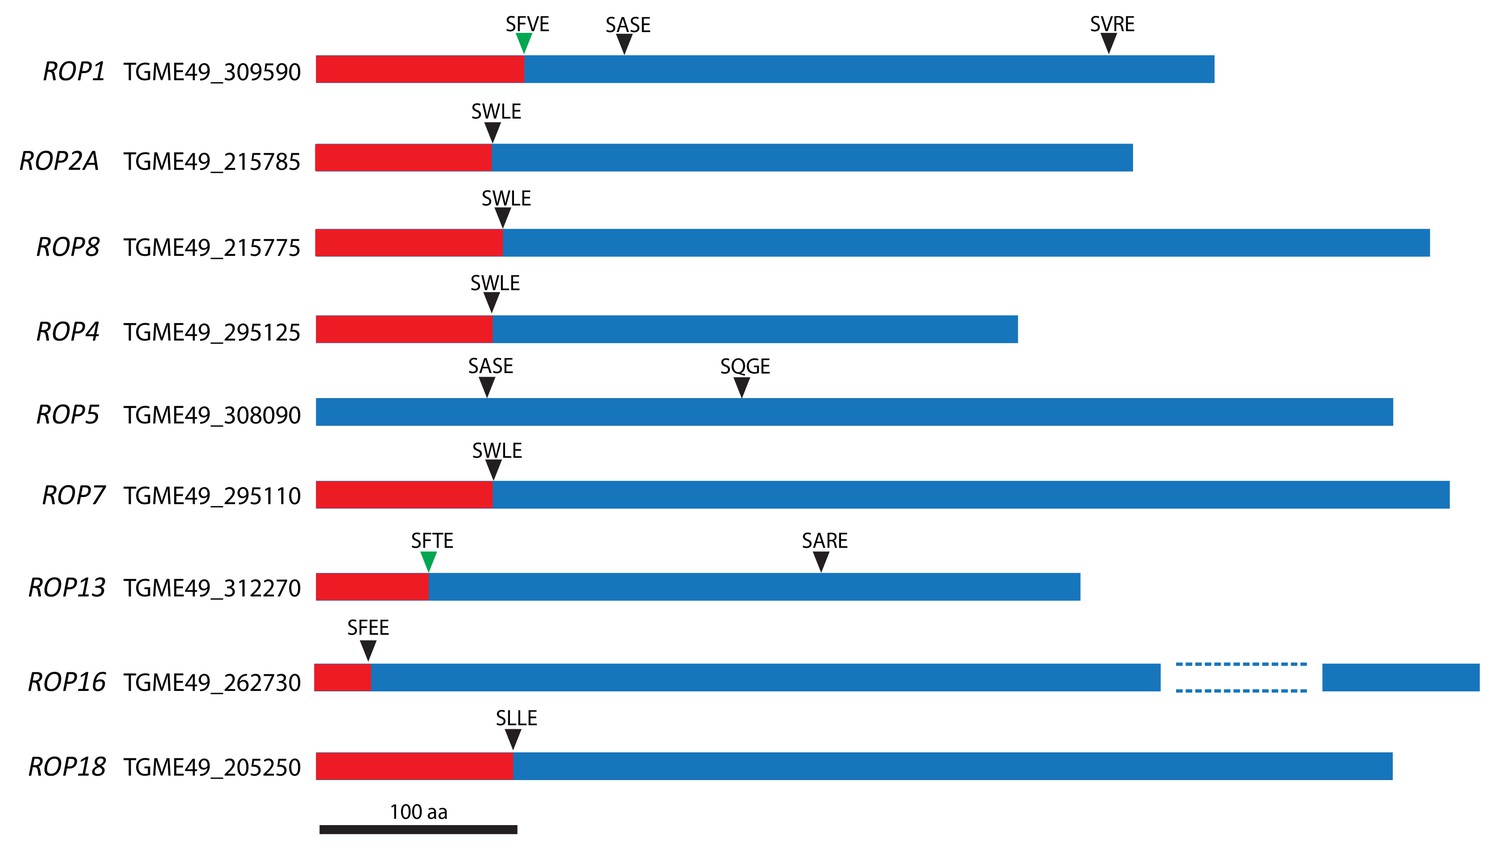
SφXE motifs in ROPs.
Schematic of some ROPs and positions of the putative cleavage site motif SφXE (φ is hydrophobic, X is any amino acid). Green arrowheads represent sites that have been previously validated.
Figure 4—figure supplement 3

SφXE motifs in RONs.
Schematic of some RONs and positions of the putative cleavage site motif SφXE (φ is hydrophobic, X is any amino acid).
Figure 4—figure supplement 4
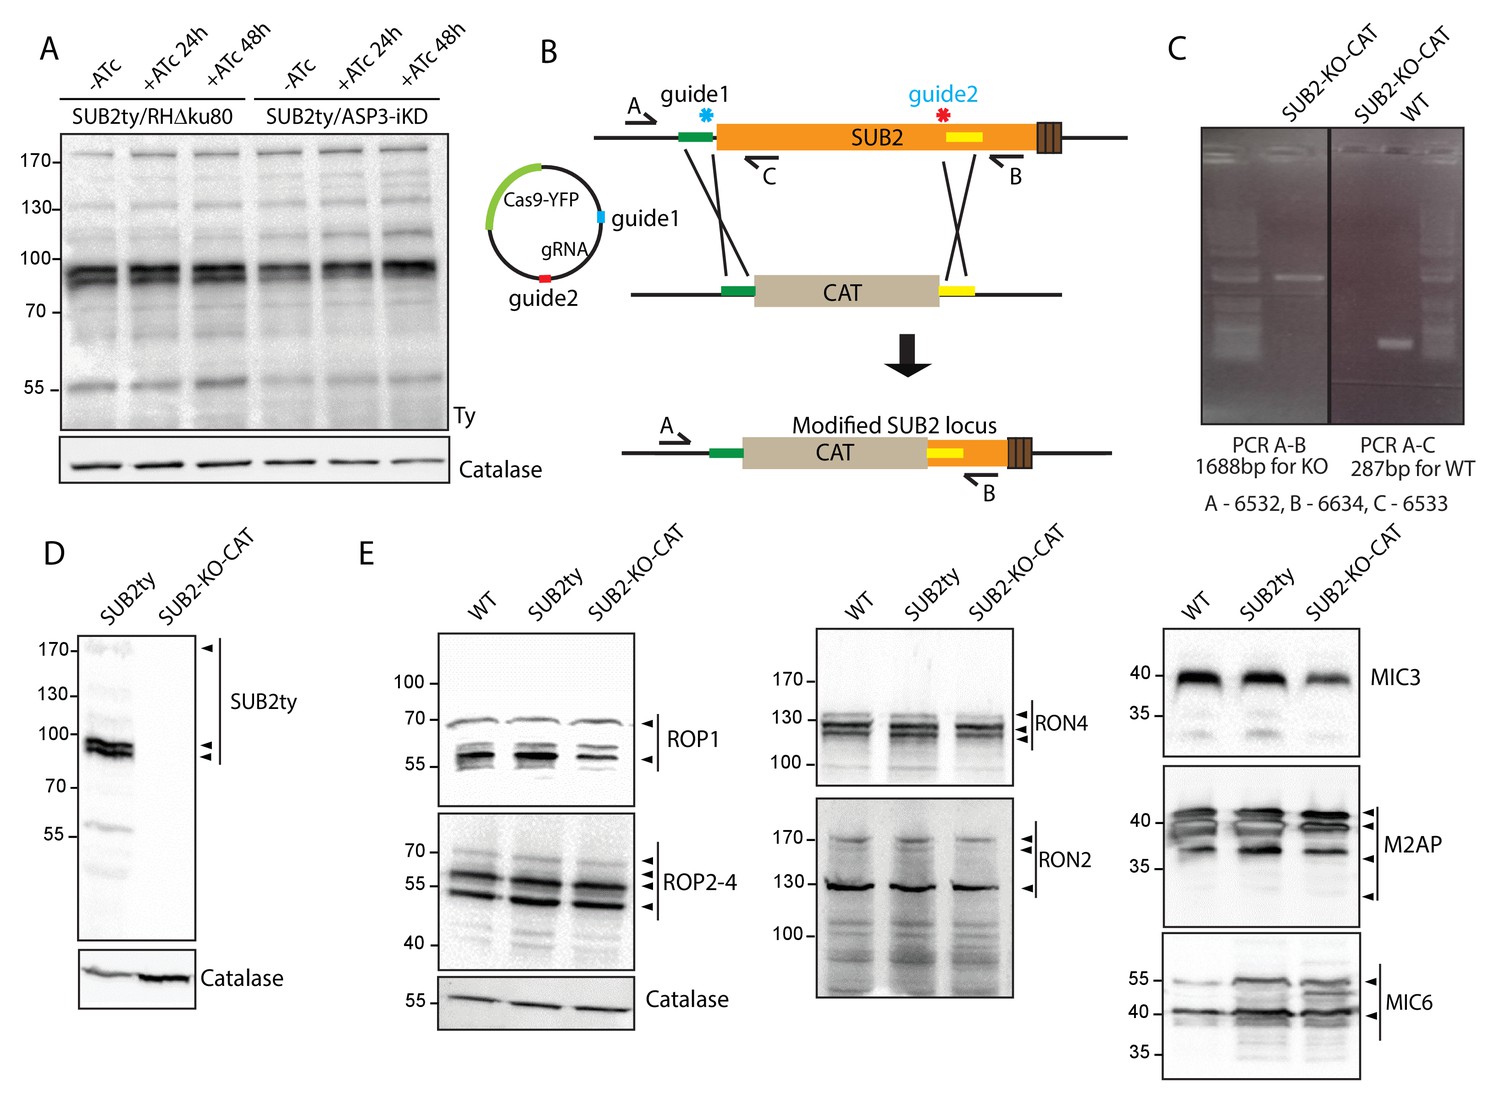
SUB2 has no impact on the processing of ROPs/RONs/MICs.
(A) Endogenously epitope tagged SUB2 in ASP3-iKD showed no alteration of processing upon condition knockdown of ASP3 compared to the parental RHΔku80 tagged strain. Catalase was used as loading control. (B) Schematic representation of the 2-gRNA CRISPR/Cas9 mediated knockout of SUB2 (in the SUB2ty strain) by replacing a region of the endogenous SUB2 with CAT cassette. (C) PCR analyses on the SUB2 knockout strains to check for integration of the cassette at the targeted locus. (D) Deletion of the SUB2 in the two knockout clones was assessed by western blot using Ty antibodies. Catalase was used as loading control. (E) SUB2 knockout did not impact on the processing of ROP1, ROP2-4, RON4, RON2, MIC3, M2AP, and MIC6. Catalase was used as loading control. Arrowheads indicate the pro and mature forms of the protein as described before.
Figure 5 with 2 supplements
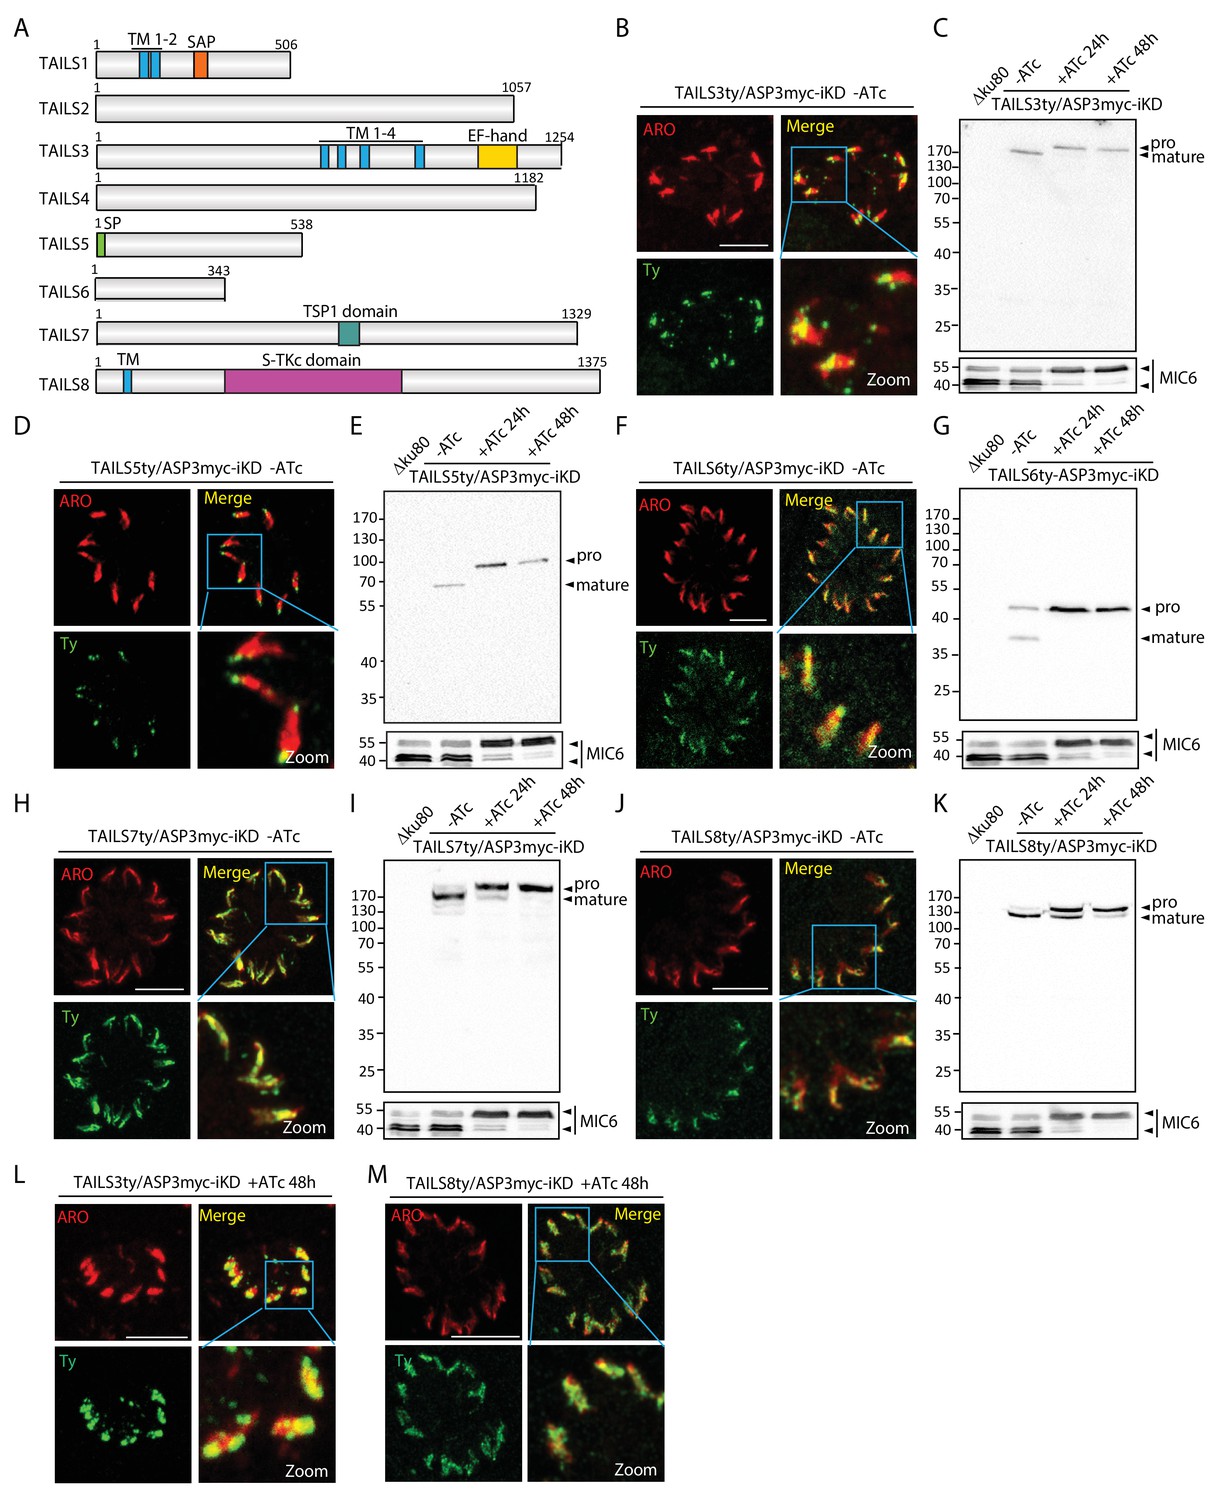
TAILS analysis identified new rhoptry proteins as ASP3 substrates.
(A) Schematic representation of the different candidate identified during the TAILS analysis. SP – signal peptide, TM – transmembrane, SAP - SAF-A/B, Acinus and PIAS domain, TSP1 - thrombospondin-1, S-TKc – Serine-Threonine kinase catalytic domain. (B), (D), (F), (H), (J) TAILS 3, 5, 6 7 and 8 were localized to the rhoptries and (C), (E), (G), (I) (K) showed impaired processing upon ASP3 depletion. Arrowheads represent pro and mature forms of the proteins. MIC6 was used as control. (L, M) Altered localization of TAILS3 and TAILS8 in the rhoptries upon ASP3 depletion.
Figure 5—figure supplement 1
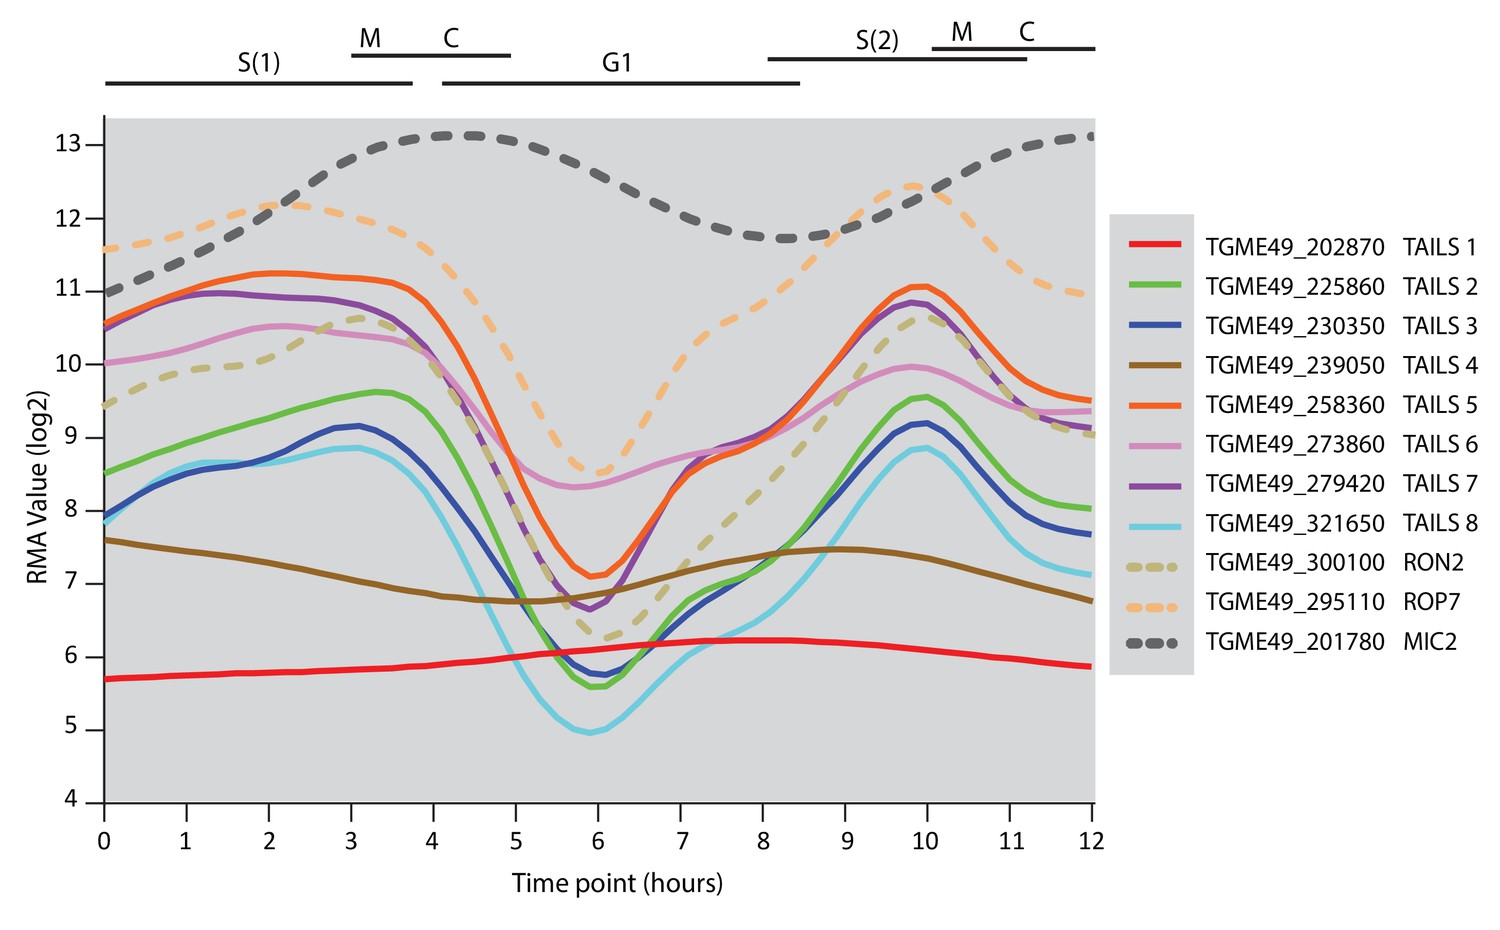
Expression profile of TAILS candidates.
Expression profile of the TAILS1-8 as well as RON2, ROP7 and MIC2 as representative examples of rhoptry neck, rhoptry bulb and microneme proteins, respectively.
Figure 5—figure supplement 2
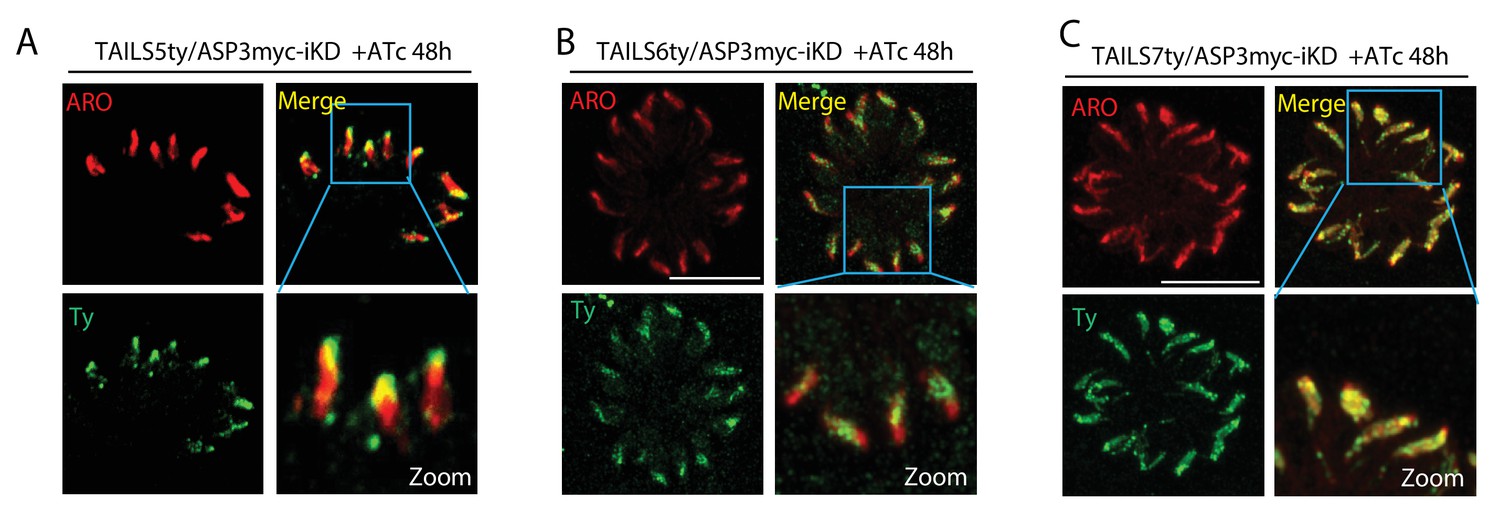
Effect of ASP3 knockdown on the localization of the TAILS candidates.
(A–C) Conditional depletion of ASP3 did not affect the localization of the TAILS5, TAILS6 and TAILS7 in the rhoptries.
Figure 6 with 2 supplements
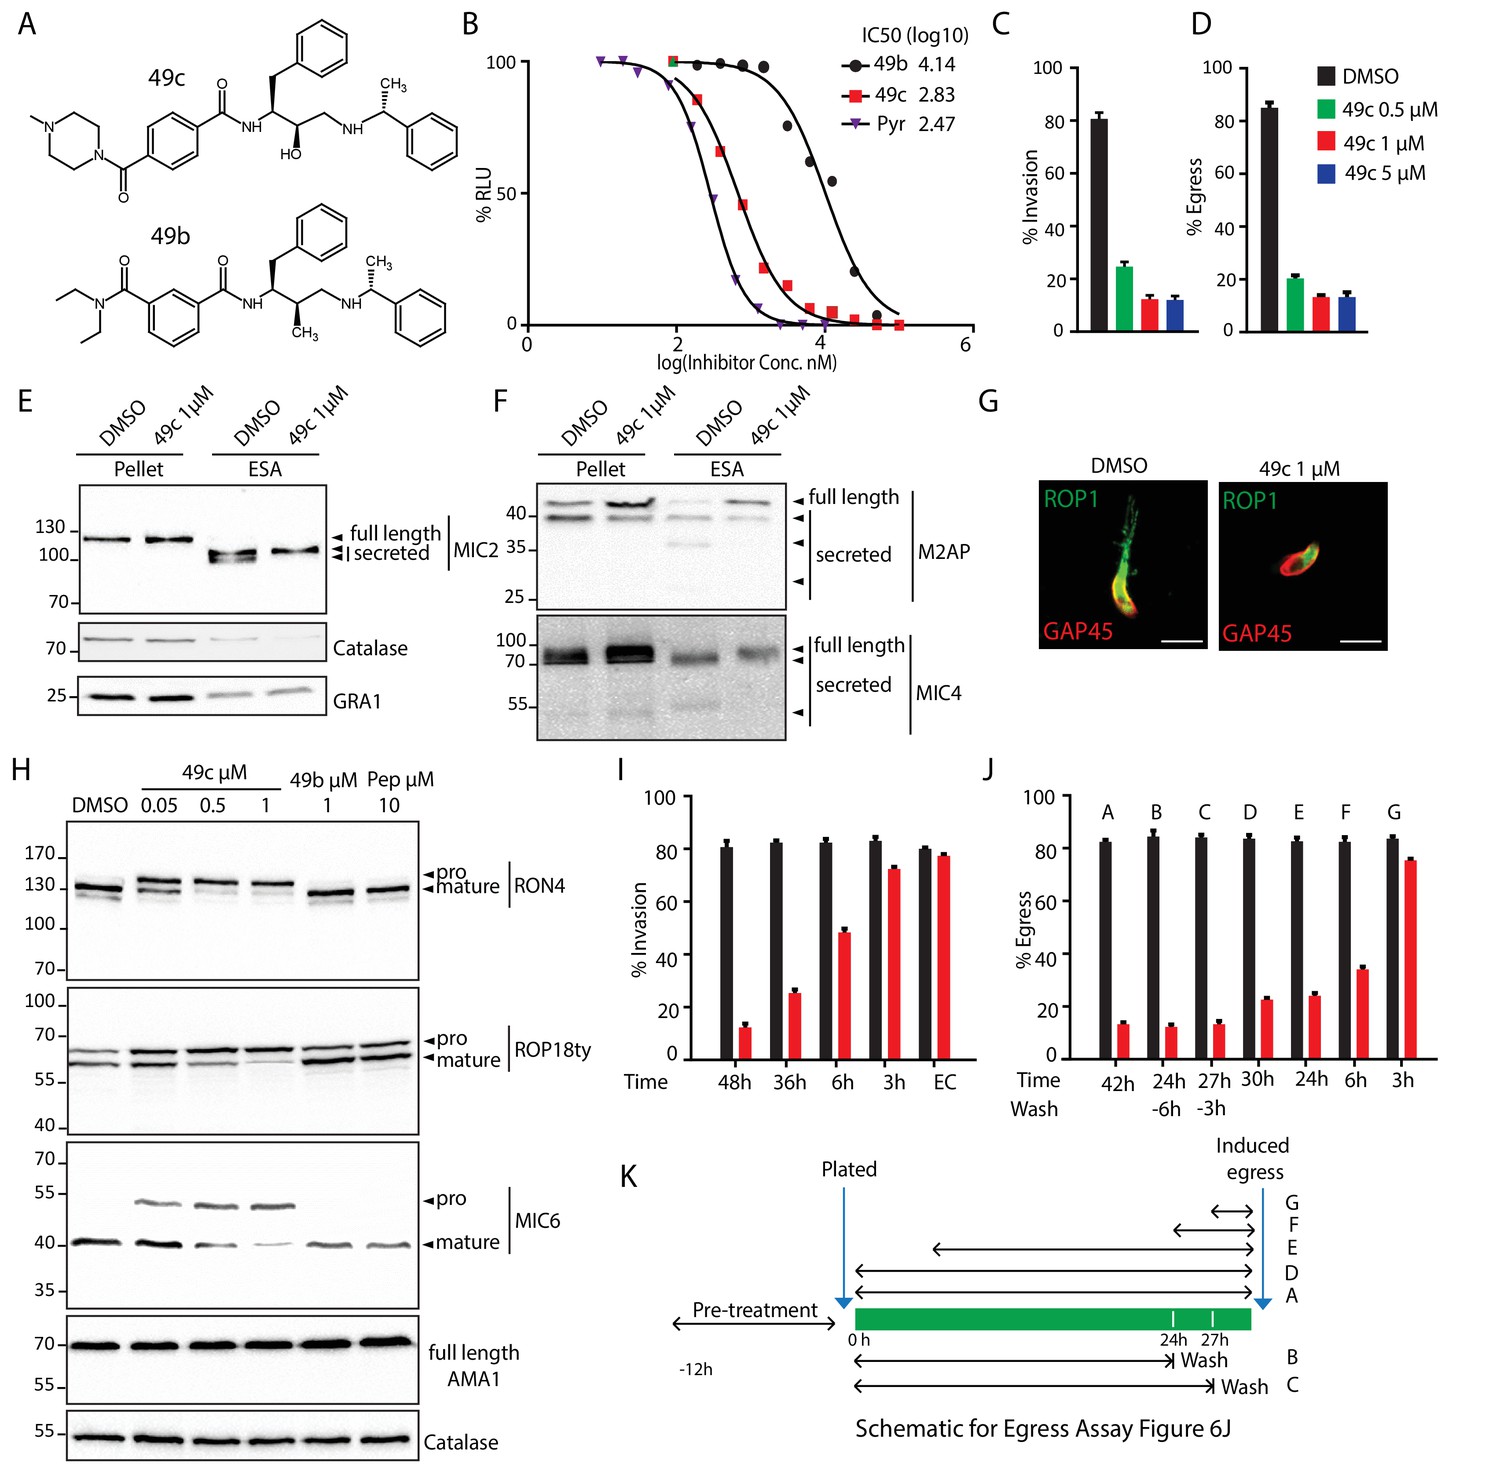
49c recapitulates the phenotype of ASP3 depletion in T. gondii.
(A) Chemical structure of compounds 49b and 49c. (B) IC50 on T. gondii RH-pTub-CBG99-luciferase parasites of 49b (13.8 μM), 49c (676 nM) and Pyrimethamine (295 nM), used here as a positive control. (C) 49c treatment impaired RH parasites invasion and (D) egress. Data are presented as mean ±standard deviation (SD) from 3 independent experiments. (E, F) Parasites, treated for 36 hr with DMSO or 49c, showed normal secretion of microneme proteins (MIC2, M2AP, MIC4), but altered processing in this fraction (MIC2, M2AP, MIC4). Arrowheads show full length and secreted fragments. Catalase was used as cytosolic control and GRA1 for constitutive secretion. (G) 49c treated during 48 hr of Δku80 parasites displayed a complete absence of rhoptry content secretion as assessed by probing against the rhoptry protein ROP1. (H) Processing of RON4, ROP18 and MIC6 was affected by 48 hr of 49c treatment while DMSO treated samples were not affected. AMA1 serves a control for an unprocessed microneme and Catalase as loading control. ROP18 was Ty-tagged at endogenous locus. Pepstatin was used as a negative control. (I) Invasion was blocked by 49c when parasites were treated for 6 hr or more prior to egress, but not less than 3 hr or when extracellular. (J) Parasites were blocked in egress when treated with 49c at least 3 hr before induced egress, but not later. (K) Schematic showing the various treatments for the induced egress assay in J.
-
Figure 6—source data 1
Source data of the triplicate experiments done on RHΔku80 parasites (DMSO or 49c treated) Intracellular growth assay (Figure 6—figure supplement 1A), Invasion assay (C), Egress assay (D), Invasion assay with washes (I) and Egress assay with washed (J).
- https://doi.org/10.7554/eLife.27480.029
-
Figure 6—source data 2
Source data of the in vitro measurement of IC50 done on luciferase expressing T. gondii tachyzoites (Figure 6B).
- https://doi.org/10.7554/eLife.27480.030
Figure 6—figure supplement 1
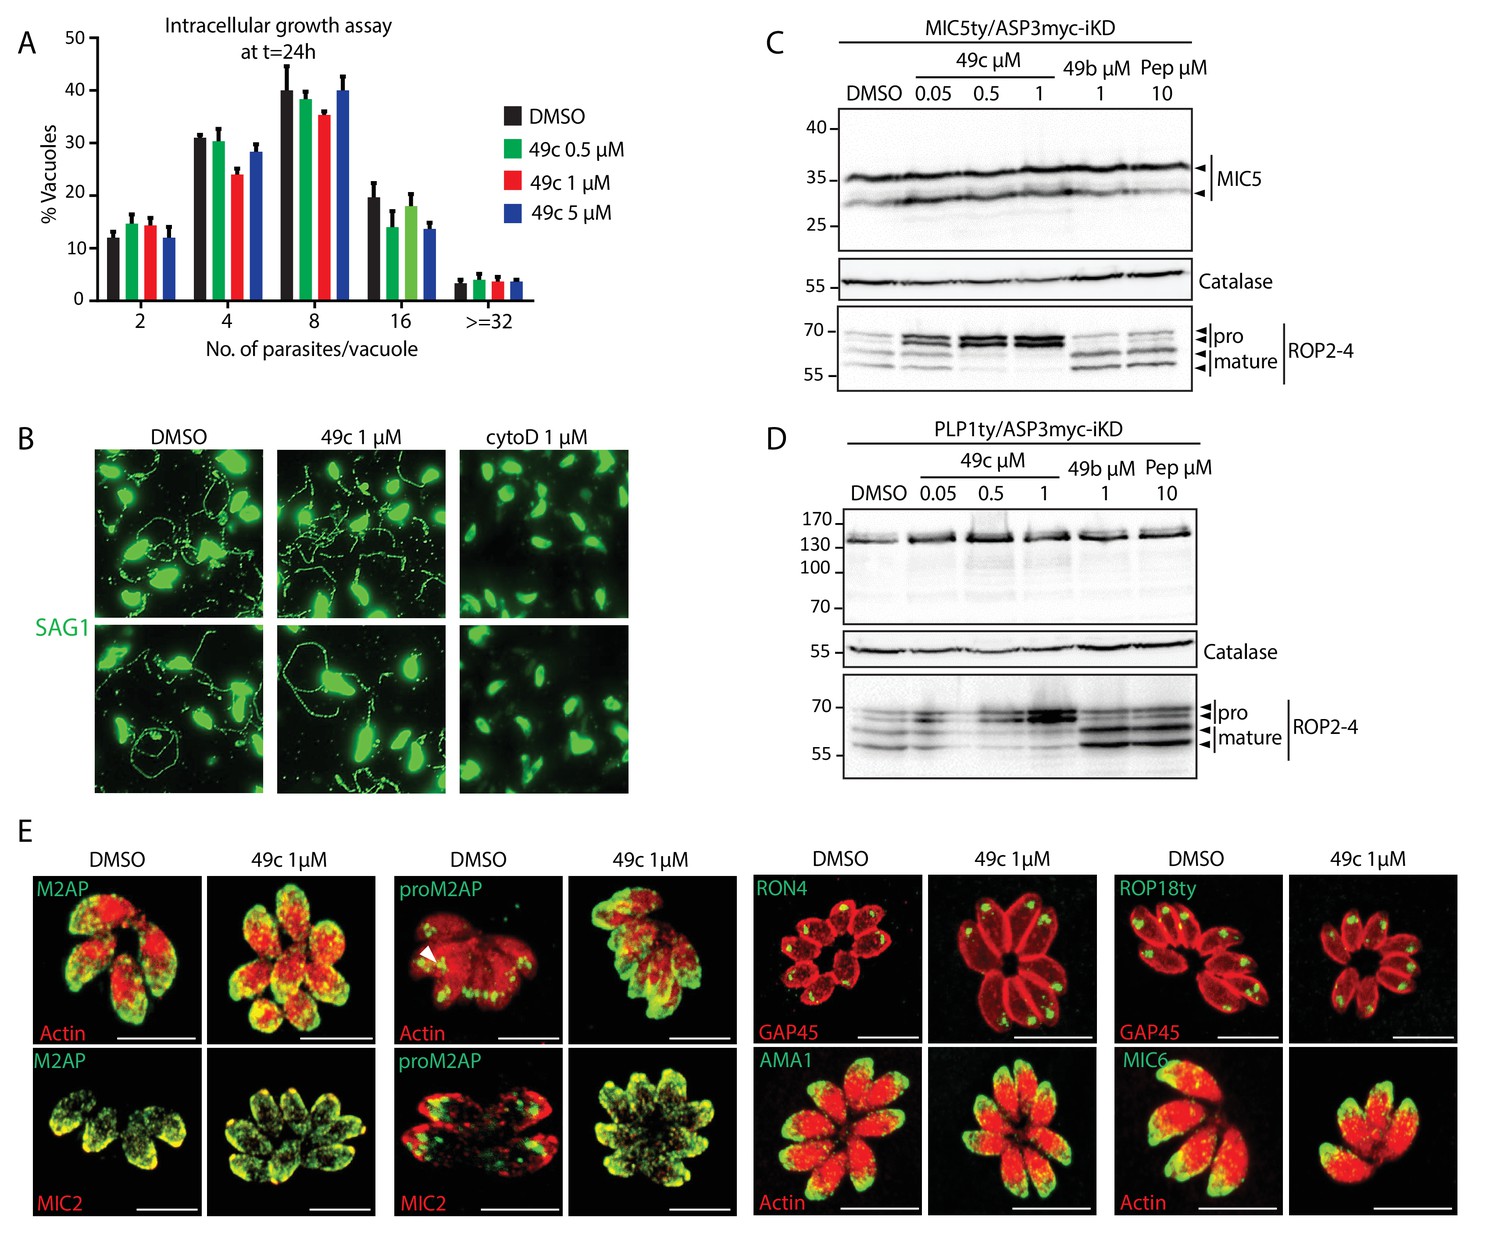
49c has no impact on parasite intracellular replication, gliding motility, and on the localization of rhoptry and microneme proteins.
(A) DMSO or 49c treated RHΔku80 parasites revealed no defect in intracellular replication. Data is presented as mean ±SD from 3 independent experiments. (B) Gliding motility was not affected by 49c treatment. DMSO and cytoD were used as positive and negative controls respectively. (C) Processing of MIC5 was unaffected by 48 hr of 49c treatment. DMSO/49b/Pepstatin treatment has no impact on processing of these proteins. ROP2-4 serves a control for an ASP3 dependent processing, which is indeed inhibited by 49c, and Catalase as loading control. MIC5 was Ty-tagged at endogenous locus. (D) Processing of PLP1 was analyzed by 48 hr of treatment with 49c/49b/DMSO/Pepstatin. ROP2-4 serves a control for a ASP3 dependent processing and Catalase as loading control. PLP1 was Ty-tagged at endogenous locus. (E) Localization of RON4, ROP18, MIC6 and AMA1 remained unchanged upon 49c treatment. ROP18 was Ty-tagged at the endogenous locus.
Figure 6—figure supplement 2
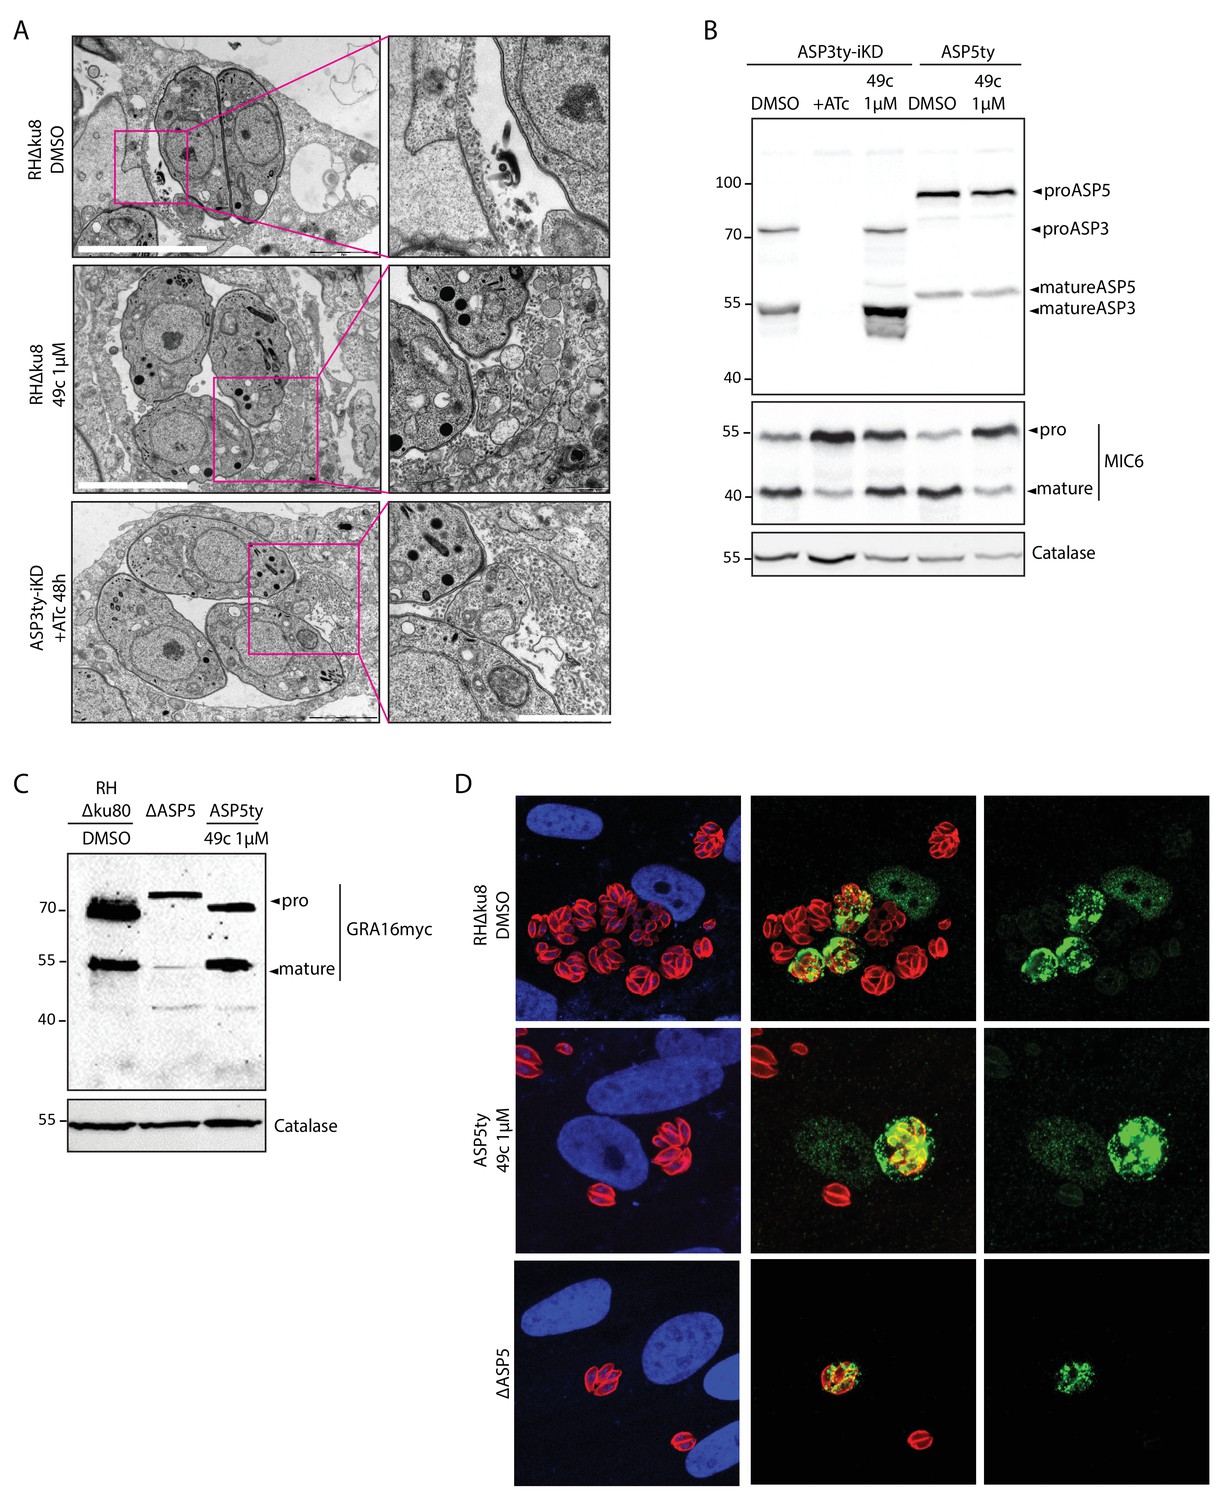
49c has no impact on ASP5 maturation, intravacuolar membranous nanotubular network (MNN) formation or on the maturation and export of ASP5 substrate, GRA16.
(A) Formation of intravacuolar membranous nanotubular network was not affected by either 49c treatment or ASP3 depletion. DMSO treated wild type parasites were used as negative control. (B) Endogenously Ty tagged ASP5 strain, when treated with DMSO or 49c show no defect in ASP5 maturation. (C) Immunoblot evaluating the processing of a second copy expression of myc tagged GRA16 showed that 49c has no impact on its ASP5 dependent processing. (D) 49c has no impact on the ASP5 mediated export of GRA16 to the host cell nucleus. DMSO treated wild type parasites and ΔASP5 parasites were used as negative and positive controls respectively.
Figure 7 with 1 supplement
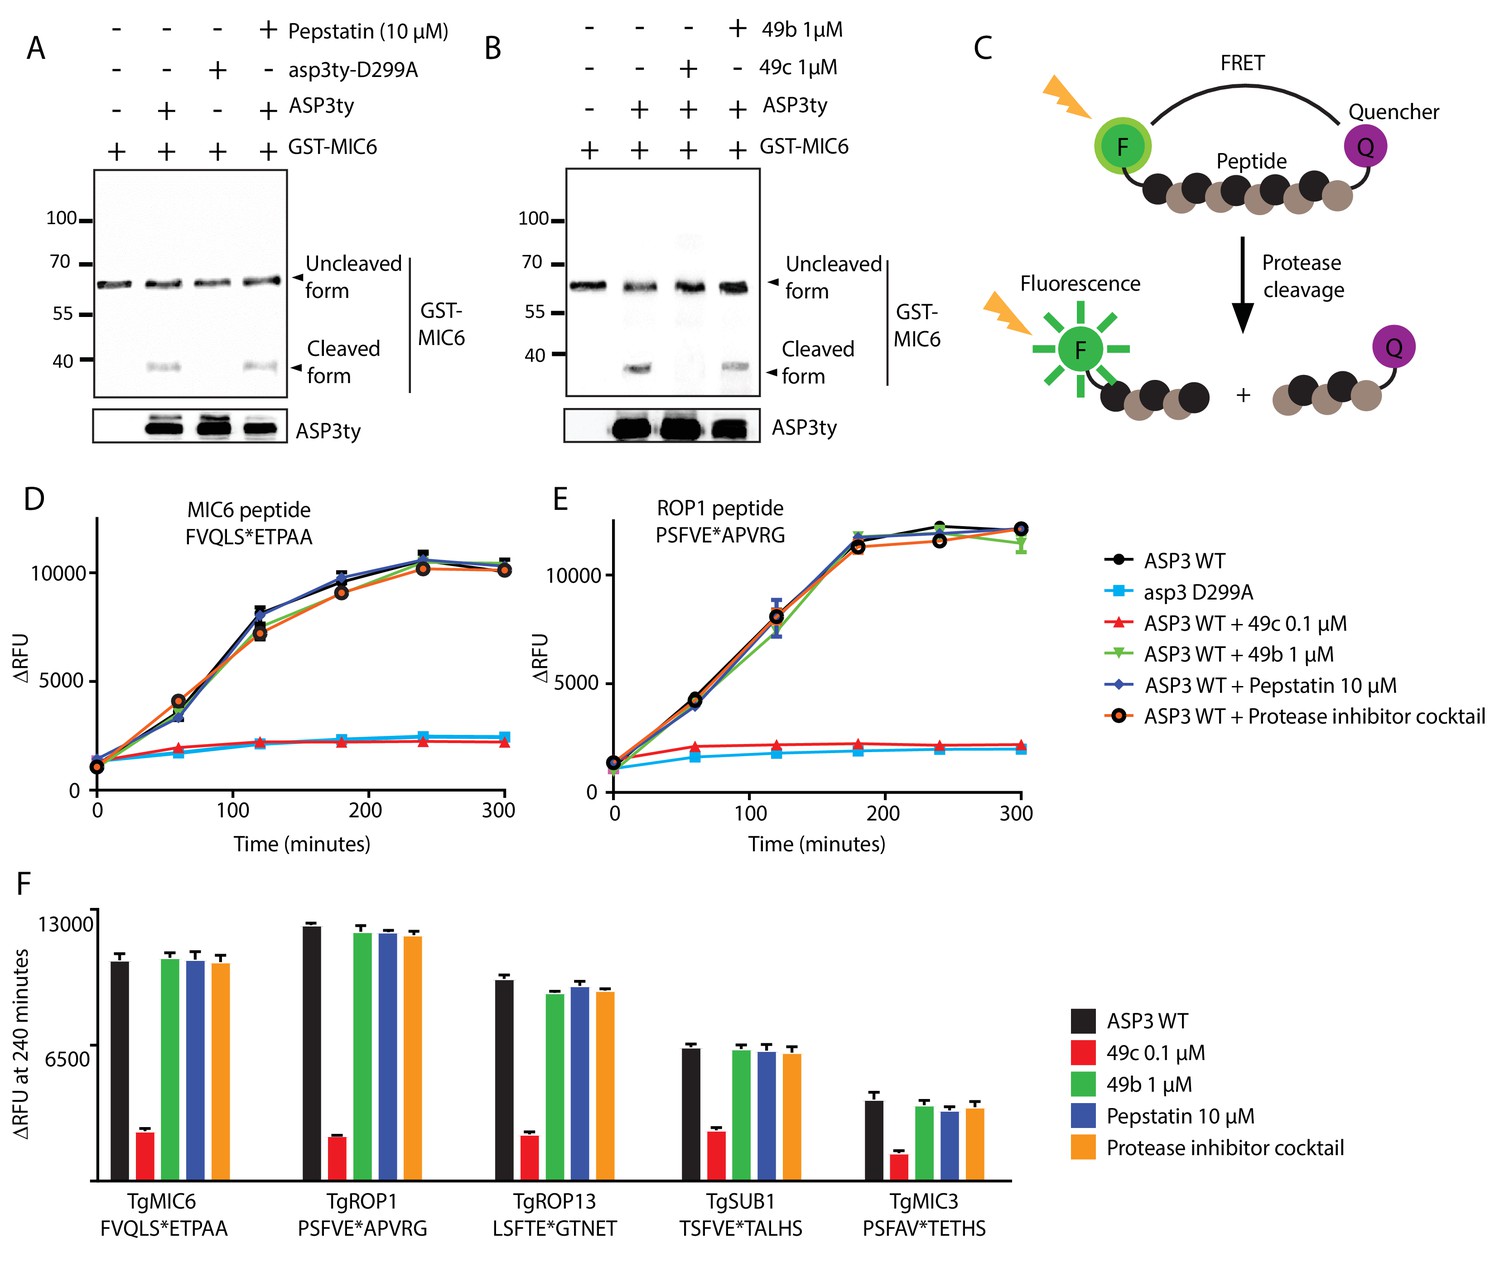
In vitro cleavage of ASP3 substrates.
(A) Recombinant GST-MIC6 was processed by ASP3ty but not by asp3ty-D299A. Pepstatin A was used as negative control. (B) 49c but not 49b prevented GST-MIC6 processing by ASP3ty. ASP3 WT and asp3ty-D299A mutant were immunoprecipitated from the parasite. (C) Schematic representation of the fluorogenic peptide cleavage assays. (D) Cleavage of MIC6 fluorogenic peptide by ASP3ty and asp3ty-D299A in the presence or absence of 49b, 49c, pepstatin and protease cocktail inhibitor. (E) Cleavage of ROP1 fluorogenic peptide by ASP3ty and asp3ty-D299A in the presence or absence of 49b, 49c, pepstatin and protease cocktail inhibitor. (F) Quantification of peptide cleavage assays for MIC6, ROP1, ROP13, SUB1 and MIC3 at 240 min in the presence or absence of 49b, 49c, pepstatin or protease cocktail inhibitor.
-
Figure 7—source data 1
Source data for the in vitro cleavage assays on fluorogenic peptides for MIC6 (D), ROP1 (E), MIC6/ROP1/ROP13/SUB1/MIC3 at 240 min (F) and RON4/MIC3 (Figure 7—figure supplement 1B).
- https://doi.org/10.7554/eLife.27480.033
Figure 7—figure supplement 1
In vitro cleavage assays on ASP3 putative substrates.
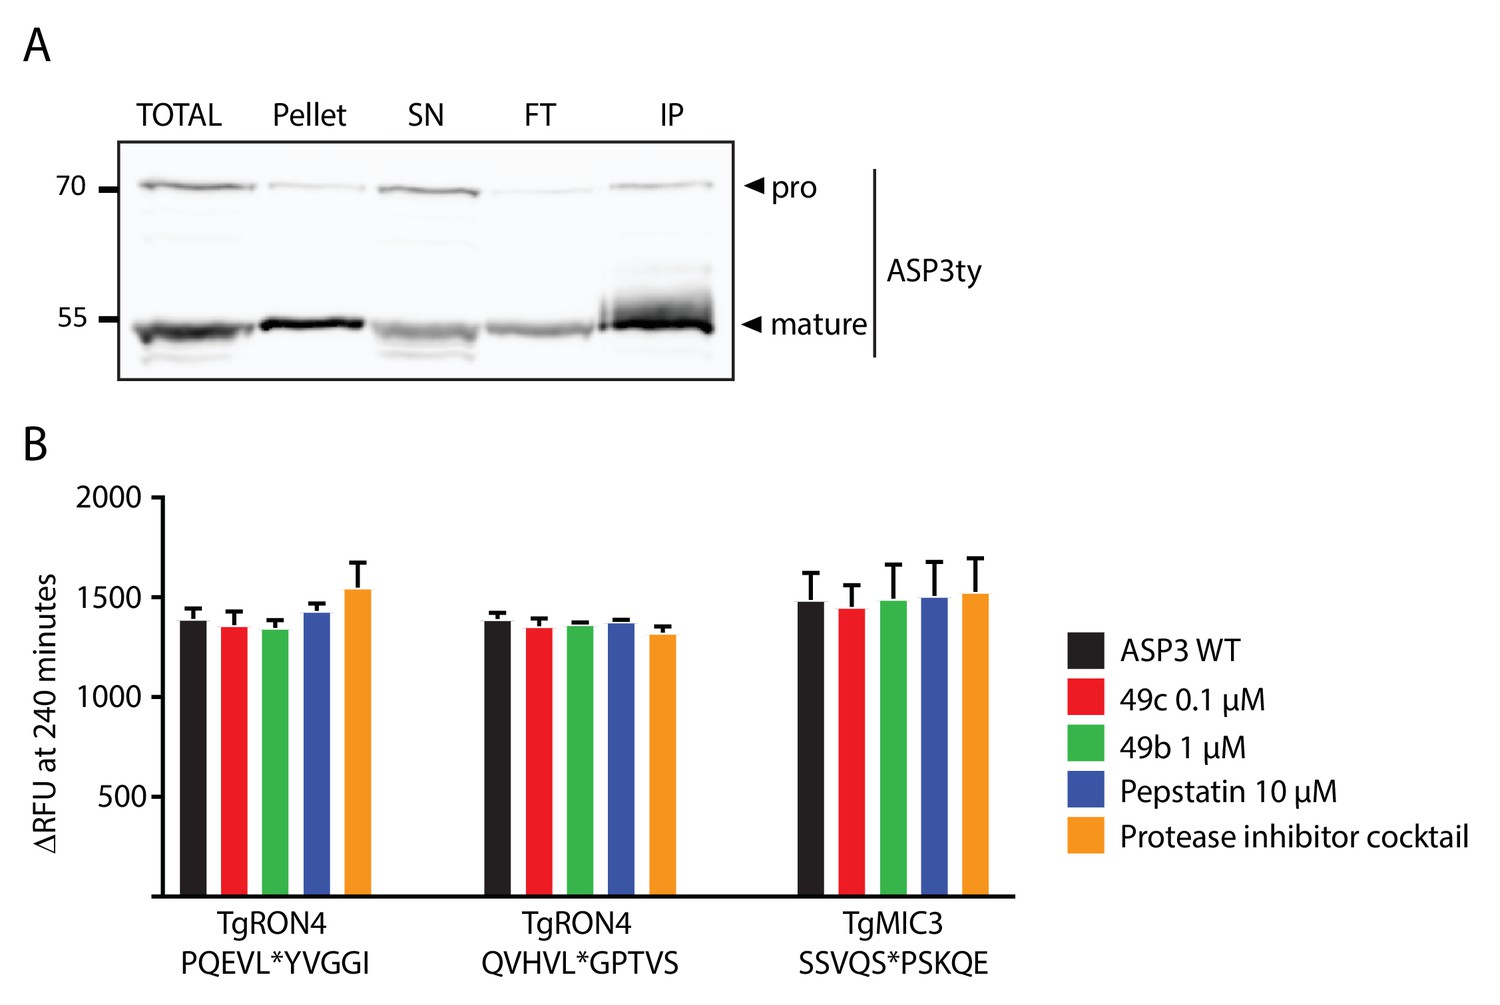
(A) Immunoblot analyses of the pulldown of ASP3ty. IP: immunoprecipitation, SN; supernatant, FT: flowthrough. (B) Quantification of peptide cleavage assay for RON4 and MIC3 at 240 min in the presence or absence of 49b, 49c, pepstatin and protease cocktail inhibitor.
Videos
Video 1
ASP3 depleted parasites display impaired egress.
During egress from host cell, ASP3 depleted parasites were often found trapped in floating spherical membranous structures. The parasites are very motile within these structures and attempt to mechanically rupture the membranes with most eventually escaping.
Video 2
ASP3 depleted parasites display impaired egress.
During egress from host cell, ASP3 depleted parasites were often found trapped in floating spherical membranous structures.
Video 3
ASP3 depleted parasites display impaired egress.
Motile ASP3 depleted parasites were trapped either in the host cell membrane and/or the PVM. The parasites are very motile within and attempt to mechanically rupture the membranes with most eventually escaping.
Tables
Table 1
List of peptides detected in the combined TAILS datasets with +ATc/-ATc peptide ratios < 0.22 (green columns) and >2 (red columns).
https://doi.org/10.7554/eLife.27480.015| ToxoDB gene name | Position in master protein | Annotated peptide sequence | Atc+/Atc- Ratio ≤ 0.22 | (log2) Atc+/Atc- Ratio ≤ −2.18 |
|---|---|---|---|---|
| SUB1 | TGGT1_204050 [45-59] | [E].YQNPTSTYNLIKEIR.[K] | 0.039 | −4.69 |
| SUB1 | TGGT1_204050 [43-59] | [H].GEYQNPTSTYNLIKEIR.[K] | 0.194 | −2.36 |
| PLP1 | TGGT1_204130 [200-220] | [T].APDDDFDFLFEDDTPKKPKSR.[V] | 0.156 | −2.68 |
| MIC11 | TGGT1_204530 [58-68] | [T].EDDKSAASIVR.[G] | 0.045 | −4.48 |
| MIC4 | TGGT1_208030 [45-77] | [D].ITPAGDDVSANVTSSEPAKLDLSCVHSDNKGSR.[A] | 0.186 | −2.42 |
| MIC4 | TGGT1_208030 [58-77] | [T].SSEPAKLDLSCVHSDNKGSR.[A] | 0.19 | −2.4 |
| Hypothetical | TGGT1_212210 [196-220] | [L].FKTGSSENNEVLPSFQDAEKAAPVR.[R] | 0.168 | −2.58 |
| MIC6 | TGGT1_218520 [95-123] | [S].ETPAACSSNPCGPEAAGTCKETNSGYICR.[C] | 0.089 | −3.5 |
| Hypothetical | TGGT1_221180 [471-501] | [A].ADGDSGAGTGSPGETSSKQDSGGVGTKVDAR.[V] | 0.164 | −2.61 |
| Hypothetical (TAILS5) | TGGT1_258360 [83-99] | [Q].SASEADEEEESGGSSKR.[S] | 0.163 | −2.62 |
| Hypothetical | TGGT1_261740 [52-79] | [R].ASHSSSKGEGGDEEKHKDKSPEEGAGDR.[D] | 0.205 | −2.29 |
| ROP16 | TGGT1_262730 [29-40] | [F].EEAQKASEAAKR.[Q] | 0.159 | −2.65 |
| Hypothetical (TAILS6) | TGGT1_273860 [145-166] | [K].QTTKKDEDEDGSEDSEDDEAER.[A] | 0.049 | −4.34 |
| Hypothetical (TAILS6) | TGGT1_273860 [147-166] | [T].TKKDEDEDGSEDSEDDEAER.[A] | 0.079 | −3.66 |
| Hypothetical (TAILS6) | TGGT1_273860 [143-166] | [S].AKQTTKKDEDEDGSEDSEDDEAER.[A] | 0.097 | −3.37 |
| Hypothetical (TAILS7) | TGGT1_279420 [184-205] | [F].SELKSTKSSTAPSDSVKAAATR.[L] | 0.22 | −2.18 |
| Putative HSP75 | TGGT1_292920 [825-849] | [A].EDDKAQPDSSSAQTDSTAGSEVEPR.[K] | 0.141 | −2.82 |
| ROP13 | TGGT1_312270 [67-90] | [E].GTNETNPPTSRPPGWKYEGSDLHR.[R] | 0.219 | −2.19 |
| Hypothetical | TGGT1_315270 [25-45] | [T].LLPSAPKPVDEAALAAAEKER.[E] | 0.19 | −2.4 |
| MIC3 | TGGT1_319560 [57-86] | [F].AVTETHSSVQSPSKQETQLCAISSEGKPCR.[N] | 0.074 | −3.76 |
| MIC3 | TGGT1_319560 [67-86] | [Q].SPSKQETQLCAISSEGKPCR.[N] | 0.079 | −3.65 |
| MIC3 | TGGT1_319560 [69-86] | [P].SKQETQLCAISSEGKPCR.[N] | 0.192 | −2.38 |
| Hypothetical (TAILS8) | TGGT1_321650 [257-268] | [F].AEHKSGGEKASR.[E] | 0.156 | −2.68 |
| ToxoDB Gene Name | Positions in Master Proteins | Annotated Peptide Sequence | Atc+/Atc- Ratio ≥ 2 | (log2) Atc+/Atc- Ratio ≥ 1 |
| MIC2 | TGGT1_201780 [27-36] | [G].GGWSIVDALR.[K] | 3.317 | 1.73 |
| SUB1 | TGGT1_204050 [212-225] | [V].NTSSKGSNDPLLDR.[L] | 3.267 | 1.71 |
| SUB1 | TGGT1_204050 [214-225] | [T].SSKGSNDPLLDR.[L] | 3.837 | 1.94 |
| MIC11 | TGGT1_204050 [40-59] | [L].SHHGEYQNPTSTYNLIKEIR.[K] | 4.195 | 2.07 |
| MIC11 | TGGT1_204530 [23-32] | [G].VSEGVVVPVR.[F] | 2.175 | 1.12 |
| MIC11 | TGGT1_204530 [25-32] | [S].EGVVVPVR.[F] | 3.548 | 1.83 |
| ROP18 | TGGT1_205250 [50-72] | [T].LGPSKLDSKPTSLDSQQHVADKR.[W] | 4.985 | 2.32 |
| Hypothetical | TGGT1_210370 [65-89] | [N].NPPPLEGASVSPENATDPPETGGSR.[R] | 2.824 | 1.5 |
| Methionine aminopeptidase | TGGT1_211330 [338-359] | [C].SSPDVSSDNASSSTDLSFPVLR.[R] | 2.033 | 1.02 |
| Hypothetical (TAILS3) | TGGT1_230350 [134-141] | [K].LDNPELSR.[Q] | 3.549 | 1.83 |
| IMC1 | TGGT1_231640 [1-20] | [-].MFKDCADPCSDCCQPAEQQR.[G] | 2.028 | 1.02 |
| IMC1 | TGGT1_233820 [1-27] | [-].MKPPSGLSGASAQGVGAEETSVSLLAR.[L] | 2.028 | 1.02 |
| IMC1 | TGGT1_235620 [13-49] | [M].VMPASQGAPHGAIAAESQEKTNSCVSQECPASSETAR.[Q] | 2.466 | 1.3 |
| Peptidase M16 | TGGT1_236210 [36-53] | [G].FFSAAPAAATAGVSPLAR.[S] | 2.005 | 1 |
| Hypothetical (TAILS4) | TGGT1_239050 [432-438] | [P].LSPPDSR.[G] | 5.526 | 2.47 |
| ROP9 | TGGT1_243730 [59-71] | [P].QGSPPASQKEAIR.[D] | 2.275 | 1.19 |
| Hypothetical | TGGT1_247520 [44-58] | [Q].NPAGGKGGSGPHGGR.[R] | 2.431 | 1.28 |
| Hypothetical | TGGT1_247520 [36-58] | [A].SDQKQGSQNPAGGKGGSGPHGGR.[R] | 6.971 | 2.8 |
| Hypothetical | TGGT1_247960 [43-52] | [L].LPGDPVLFPR.[S] | 9.446 | 3.24 |
| ROP17 | TGGT1_258580 [26-42] | [R].SPTSNDVFGELVASAER.[A] | 12.98 | 3.7 |
| ROP6 | TGGT1_258660 [65-79] | [K].GSDFGEVKLGSAGQR.[Q] | 6.897 | 2.79 |
| Hypothetical | TGGT1_261740 [56-79] | [S].SSKGEGGDEEKHKDKSPEEGAGDR.[D] | 3.973 | 1.99 |
| Hypothetical | TGGT1_261740 [54-79] | [S].HSSSKGEGGDEEKHKDKSPEEGAGDR.[D] | 5.053 | 2.34 |
| Hypothetical | TGGT1_261740 [56-79] | [S].SSKGEGGDEEKHKDKSPEEGAGDR.[D] | 11.39 | 3.51 |
| ROP16 | TGGT1_262730 [27-40] | [M].SFEEAQKASEAAKR.[Q] | 6.953 | 2.8 |
| Hypothetical | TGGT1_268835 [152-160] | [R].DSWMSLAPF.[V] | 2.14 | 1.1 |
| SRS30C | TGGT1_273120 [53-79] | [A].AKAQGGETPPSDPTCVVEGAVTKCTCR.[N] | 3.009 | 1.59 |
| Hypothetical | TGGT1_276190 [1-31] | [-].MSPADPEAGSLQSSAPPLASAGKSAGAGAPR.[A] | 2.081 | 1.06 |
| ROP40 | TGGT1_291960 [53-67] | [A].TDSDSEPEGKGGYQR.[L] | 6.511 | 2.7 |
| ROP40 | TGGT1_291960 [55-67] | [D].SDSEPEGKGGYQR.[L] | 7.127 | 2.83 |
| Hypothetical | TGGT1_295360 [1-29] | [-].MEQQQDELKHSWGANELPAGQQGSPLAER.[Q] | 2.309 | 1.21 |
| RON6 | TGGT1_297960A [50-56] | [L].LPAGQDR.[S] | 3.172 | 1.67 |
| ROP1 | TGGT1_309590 [274-296] | [L].LEPTEEQQEGPQEPLPPPPPPTR.[G] | 2.111 | 1.08 |
| ROP1 | TGGT1_309590 [58-76] | [G].VPAYPSYAQVSLSSNGEPR.[H] | 4.051 | 2.02 |
| ROP1 | TGGT1_309590 [87-115] | [M].SVKPHANADDFASDDNYEPLPSFVEAPVR.[G] | 4.094 | 2.03 |
| ROP1 | TGGT1_309590 [103-115] | [N].YEPLPSFVEAPVR.[G] | 10.23 | 3.36 |
| RON1 | TGGT1_310010 [66-82] | [R].AAANGSEGGVAQSEQER.[A] | 3.193 | 1.67 |
| ROP10 | TGGT1_315490 [35-48] | [R].ESPQWDSLLPLQDR.[R] | 16.32 | 4.03 |
| MIC3 | TGGT1_319560 [60-86] | [T].ETHSSVQSPSKQETQLCAISSEGKPCR.[N] | 4.882 | 2.29 |
| MIC3 | TGGT1_319560 [56-86] | [S].FAVTETHSSVQSPSKQETQLCAISSEGKPCR.[N] | 9.061 | 3.18 |
| MIC3 | TGGT1_319560 [64-86] | [S].SVQSPSKQETQLCAISSEGKPCR.[N] | 11.35 | 3.5 |
| MIC3 | TGGT1_319560 [52-86] | [S].LAPSFAVTETHSSVQSPSKQETQLCAISSEGKPCR.[N] | 34.74 | 5.12 |
Additional files
-
Supplementary file 1
Proteins represented by peptides with normalized +ATc/-ATc abundance ratios of <0.22 (stringent).
Predicted or experimentally validated subcellular localization is indicated. Gene IDs refer to ToxoDB, Release 31.
- https://doi.org/10.7554/eLife.27480.034
-
Supplementary file 2
Proteins represented by peptides with normalized +ATc/-ATc abundance ratios of <0.5 (relaxed).
Predicted or experimentally validated subcellular localization is indicated. Gene IDs refer to ToxoDB, Release 31.
- https://doi.org/10.7554/eLife.27480.035
-
Supplementary file 3
Proteins represented by peptides with normalized +ATc/-ATc abundance ratios of >2.
Predicted or experimentally validated subcellular localization is indicated. Gene IDs refer to ToxoDB, Release 31.
- https://doi.org/10.7554/eLife.27480.036
-
Supplementary file 4
Eight proteins represented by peptides with normalized +ATc/-ATc abundance ratios of <0.22 and>2 (see also Figure 3C).
Predicted or experimentally validated subcellular localization is indicated. Gene IDs refer to ToxoDB, Release 31.
- https://doi.org/10.7554/eLife.27480.037
-
Supplementary file 5
Detailed analysis of MIC3-derived peptide abundances and +ATc/-ATc abundance ratios (ProteomeDiscoverer output).
Color code: ratios > 2, pale red rows; ratios < 0.22, pale green rows; abundance ratios, yellow column (AC); normalized peptide abundances (+ATc), green columns (AO-AR); normalized peptide abundances (-ATc), purple columns (AS-AV); highly abundant peptide representing the ASP3-processed mature MIC3 N-terminus, red fields (32 AO-AR).
- https://doi.org/10.7554/eLife.27480.038
-
Supplementary file 6
List of oligonucleotide primers used in this study.
- https://doi.org/10.7554/eLife.27480.039
-
Supplementary file 7
List of plasmids generated for this study
- https://doi.org/10.7554/eLife.27480.040
-
Supplementary file 8
List of strains generated for this study
- https://doi.org/10.7554/eLife.27480.041
-
Supplementary file 9
List of EuPathDB IDs of protein sequences used for phylogeny tree generation.
- https://doi.org/10.7554/eLife.27480.042
-
Supplementary file 10
Curated alignments used to generate the phylogenetic tree of Apicomplexan aspartyl proteases
- https://doi.org/10.7554/eLife.27480.043
-
Transparent reporting form
- https://doi.org/10.7554/eLife.27480.044
Download links
A two-part list of links to download the article, or parts of the article, in various formats.
Downloads (link to download the article as PDF)
Open citations (links to open the citations from this article in various online reference manager services)
Cite this article (links to download the citations from this article in formats compatible with various reference manager tools)
A druggable secretory protein maturase of Toxoplasma essential for invasion and egress
eLife 6:e27480.
https://doi.org/10.7554/eLife.27480


