Environmental cystine drives glutamine anaplerosis and sensitizes cancer cells to glutaminase inhibition
- Massachusetts Institute of Technology, United States
- Whitehead Institute for Biomedical Research, United States
- Dana-Farber Cancer Institute, United States
Figures
Figure 1 with 3 supplements
Decreased use of glutamine for TCA cycle anaplerosis by A549 cells in tumors, and when cultured in adult bovine serum, compared to RPMI.
(A) Diagram detailing how uniformly-labeled glutamine ([U-13C5]glutamine) can be metabolized to generate labeled glutamate, aspartate and TCA cycle intermediates via oxidative metabolism. (B) Left Plasma fractional labeling of fully labeled glutamine (m + 5) in A549 tumor bearing mice following a 6 hr infusion of [U-13C5]glutamine (n = 3). Right Intratumoral fractional labeling of glutamine (m + 5), glutamate (m + 5), α-ketoglutarate (m + 5), fumarate (m + 4), malate (m + 4), aspartate (m + 4) and citrate (m + 4) following a 6 hr infusion of [U-13C5]glutamine (n = 3). (C) M + 5 fractional labeling of glutamine, glutamate and α-ketoglutarate, and m + 4 fractional labeling of fumarate, malate, aspartate and citrate for A549 cells cultured for 8 hr in RPMI or adult bovine serum with [U-13C5]glutamine added to ~33% enrichment (n = 3). (D) A549 cell counts over time when cultured continuously in adult bovine serum for eight days (n = 3, each time point). Doubling time was determined by non-linear regression of an exponential growth equation to the growth curve. (E) Proliferation rate of A549 cells cultured in RPMI or adult bovine serum with vehicle (DMSO) or 1 µM CB-839 (n = 3) as indicated. For all panels, the values represent the mean and the error bars represent ± SD.
-
Figure 1—source data 1
Mass isotopomer distributions for all metabolites analyzed by GC-MS in Figure 1.
- https://doi.org/10.7554/eLife.27713.007
-
Figure 1—source data 2
Mass isotopomer distributions for all metabolites analyzed by GC-MS in Figure 1—figure supplement 1.
- https://doi.org/10.7554/eLife.27713.008
-
Figure 1—source data 3
Mass isotopomer distributions for all metabolites analyzed by GC-MS in Figure 1—figure supplement 2.
- https://doi.org/10.7554/eLife.27713.009
-
Figure 1—source data 4
Mass isotopomer distributions for all metabolites analyzed by GC-MS in Figure 1—figure supplement 3.
- https://doi.org/10.7554/eLife.27713.010
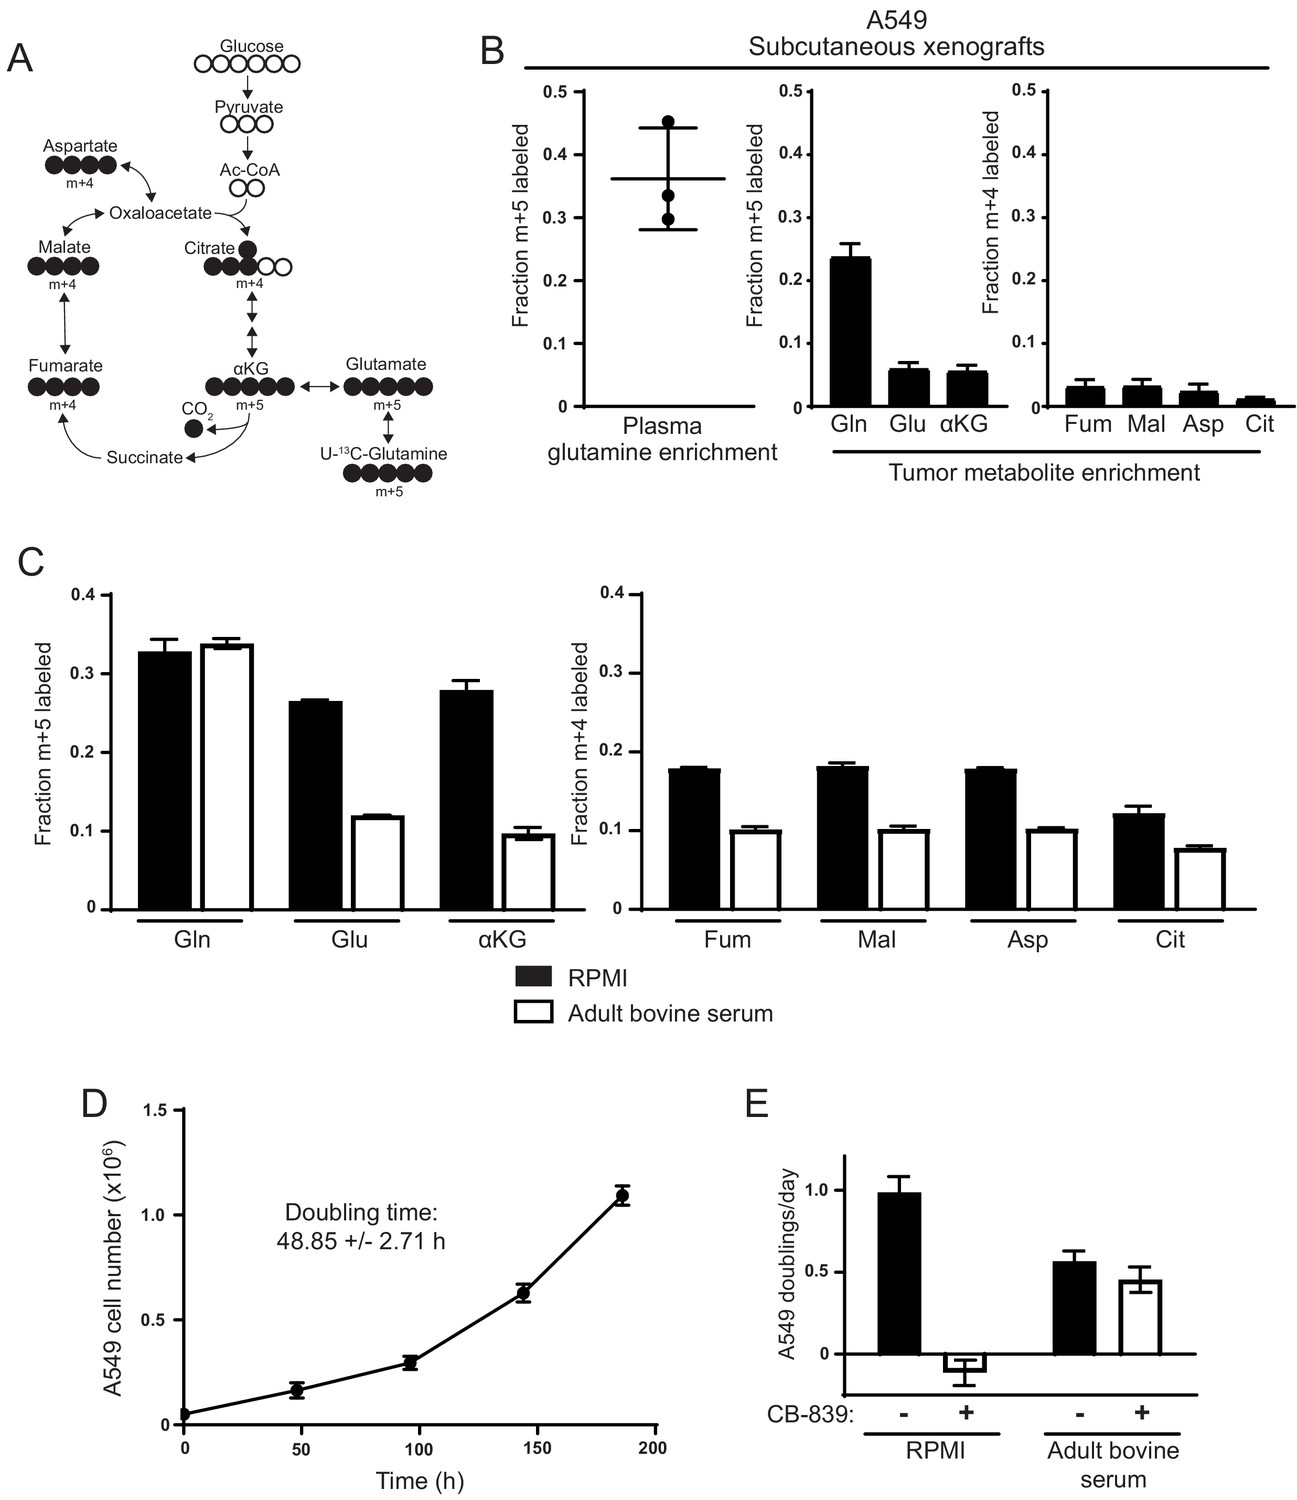
Figure 1—figure supplement 1
Glutamine labeling of metabolites in A549 cells cultured in adult bovine serum reaches isotopic steady state by 8 hr.
M + 5 fractional labeling of glutamine, glutamate and α-ketoglutarate, and m + 4 labeling of fumarate, malate, aspartate and citrate for A549 cells cultured for 8 hr or 24 hr in adult bovine serum with [U-13C5]glutamine added to ~33% enrichment (n = 3) is shown. The values represent the mean and the error bars represent ± SD.
Figure 1—figure supplement 2
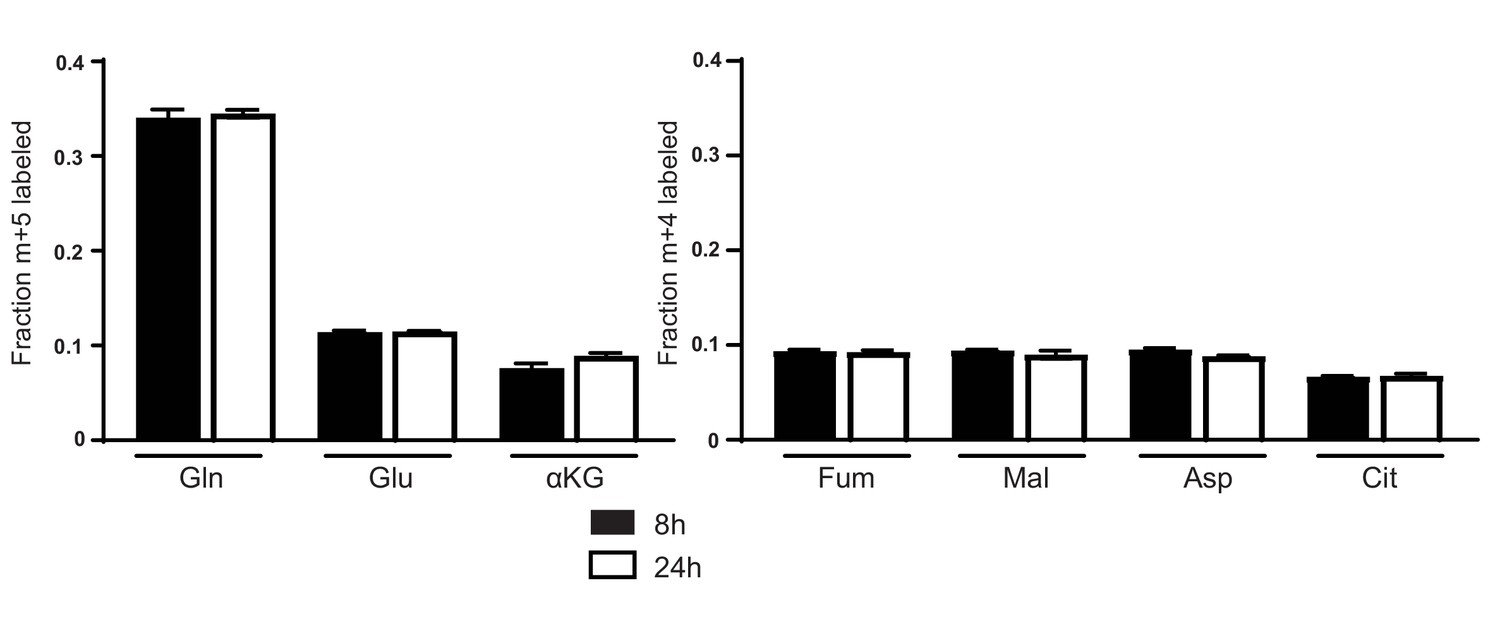
Decreased glutamine anaplerosis is not unique to serum or bovine derived blood products.
M + 5 fractional labeling of glutamine, glutamate and α-ketoglutarate, and m + 4 labeling of fumarate, malate, aspartate and citrate for A549 cells cultured for 8 hr in RPMI, adult bovine serum, adult bovine heparinized plasma or adult human serum with [U-13C5]glutamine added to ~33% enrichment (n = 3). The values represent the mean and the error bars represent ± SD.
Figure 1—figure supplement 3
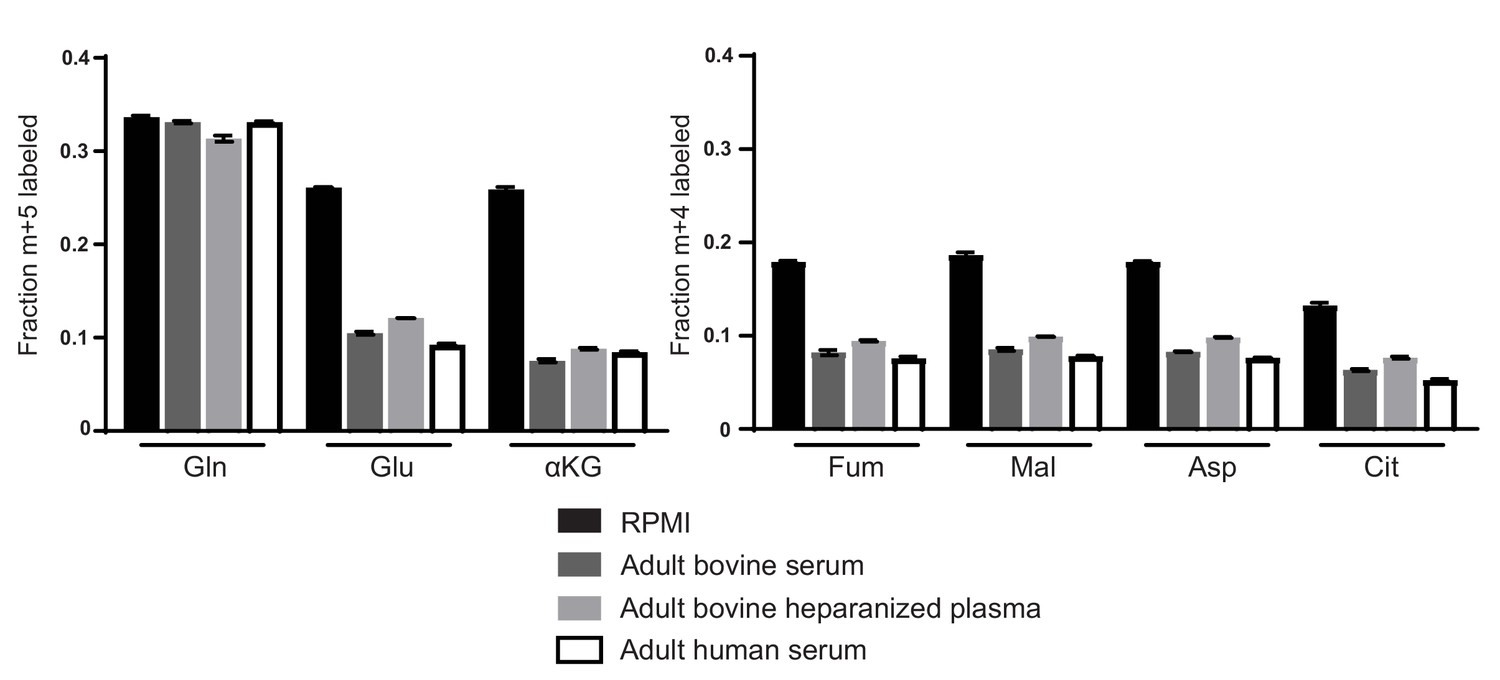
Decreased glutamine anaplerosis in adult bovine serum is not unique to A549 cells.
M + 5 fractional labeling of glutamine, glutamate and α-ketoglutarate, and m + 4 fractional labeling of fumarate, malate, aspartate and citrate for the indicated cell lines cultured for 8 hr in RPMI or adult bovine serum with [U-13C5]glutamine added to ~33% enrichment (n = 3) The values represent the mean and the error bars represent ± SD.
Figure 2 with 1 supplement
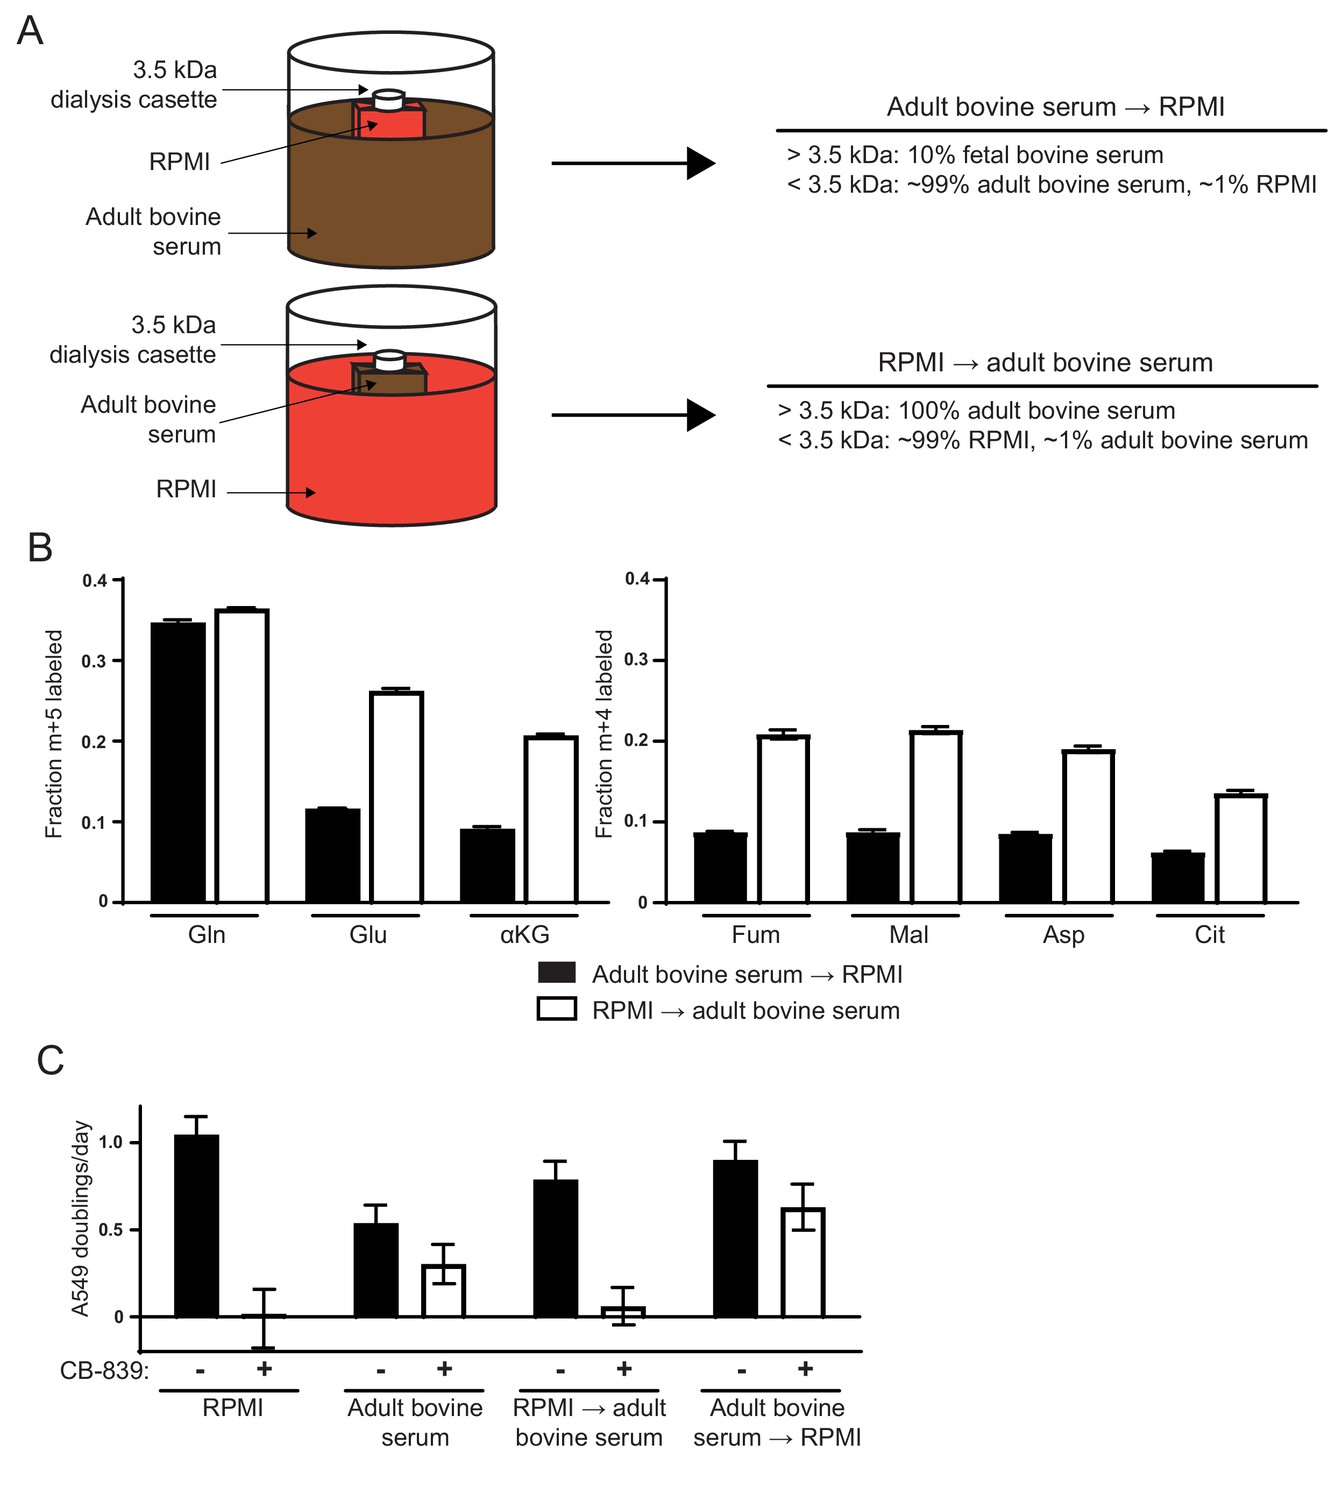
Differences in the small molecule (<3.5 kDa) fraction between RPMI and adult bovine serum account for differences in glutamine anaplerosis and sensitivity to glutaminase inhibition.
(A) Diagram detailing the generation of top ‘Adult bovine serum → RPMI’ and bottom ‘RPMI → adult bovine serum’. To make each dialyzed medium, 210 mL of RPMI or adult bovine serum was dialyzed twice against 4 L of adult bovine serum or RPMI respectively using 70 mL capacity 3.5 kDa cutoff dialysis cassettes. (B) M + 5 fractional labeling of glutamine, glutamate and α-ketoglutarate, and m + 4 labeling of fumarate, malate, aspartate and citrate for A549 cells cultured for 8 hr in ‘Adult bovine serum → RPMI’ and ‘RPMI → adult bovine serum’ with [U-13C5]glutamine added to each media at ~33% enrichment (n = 3). (C) Proliferation rates of A549 cells cultured in RPMI, adult bovine serum, ‘RPMI → adult bovine serum’, ‘Adult bovine serum → RPMI’ with vehicle (DMSO) or 1 µM CB-839 (n = 3). For all panels, the values represent the mean and the error bars represent ± SD.
-
Figure 2—source data 1
Mass isotopomer distributions for all metabolites analyzed by GC-MS in Figure 2.
- https://doi.org/10.7554/eLife.27713.013
-
Figure 2—source data 2
Mass isotopomer distributions for all metabolites analyzed by GC-MS in Figure 2—figure supplement 1.
- https://doi.org/10.7554/eLife.27713.014
Figure 2—figure supplement 1
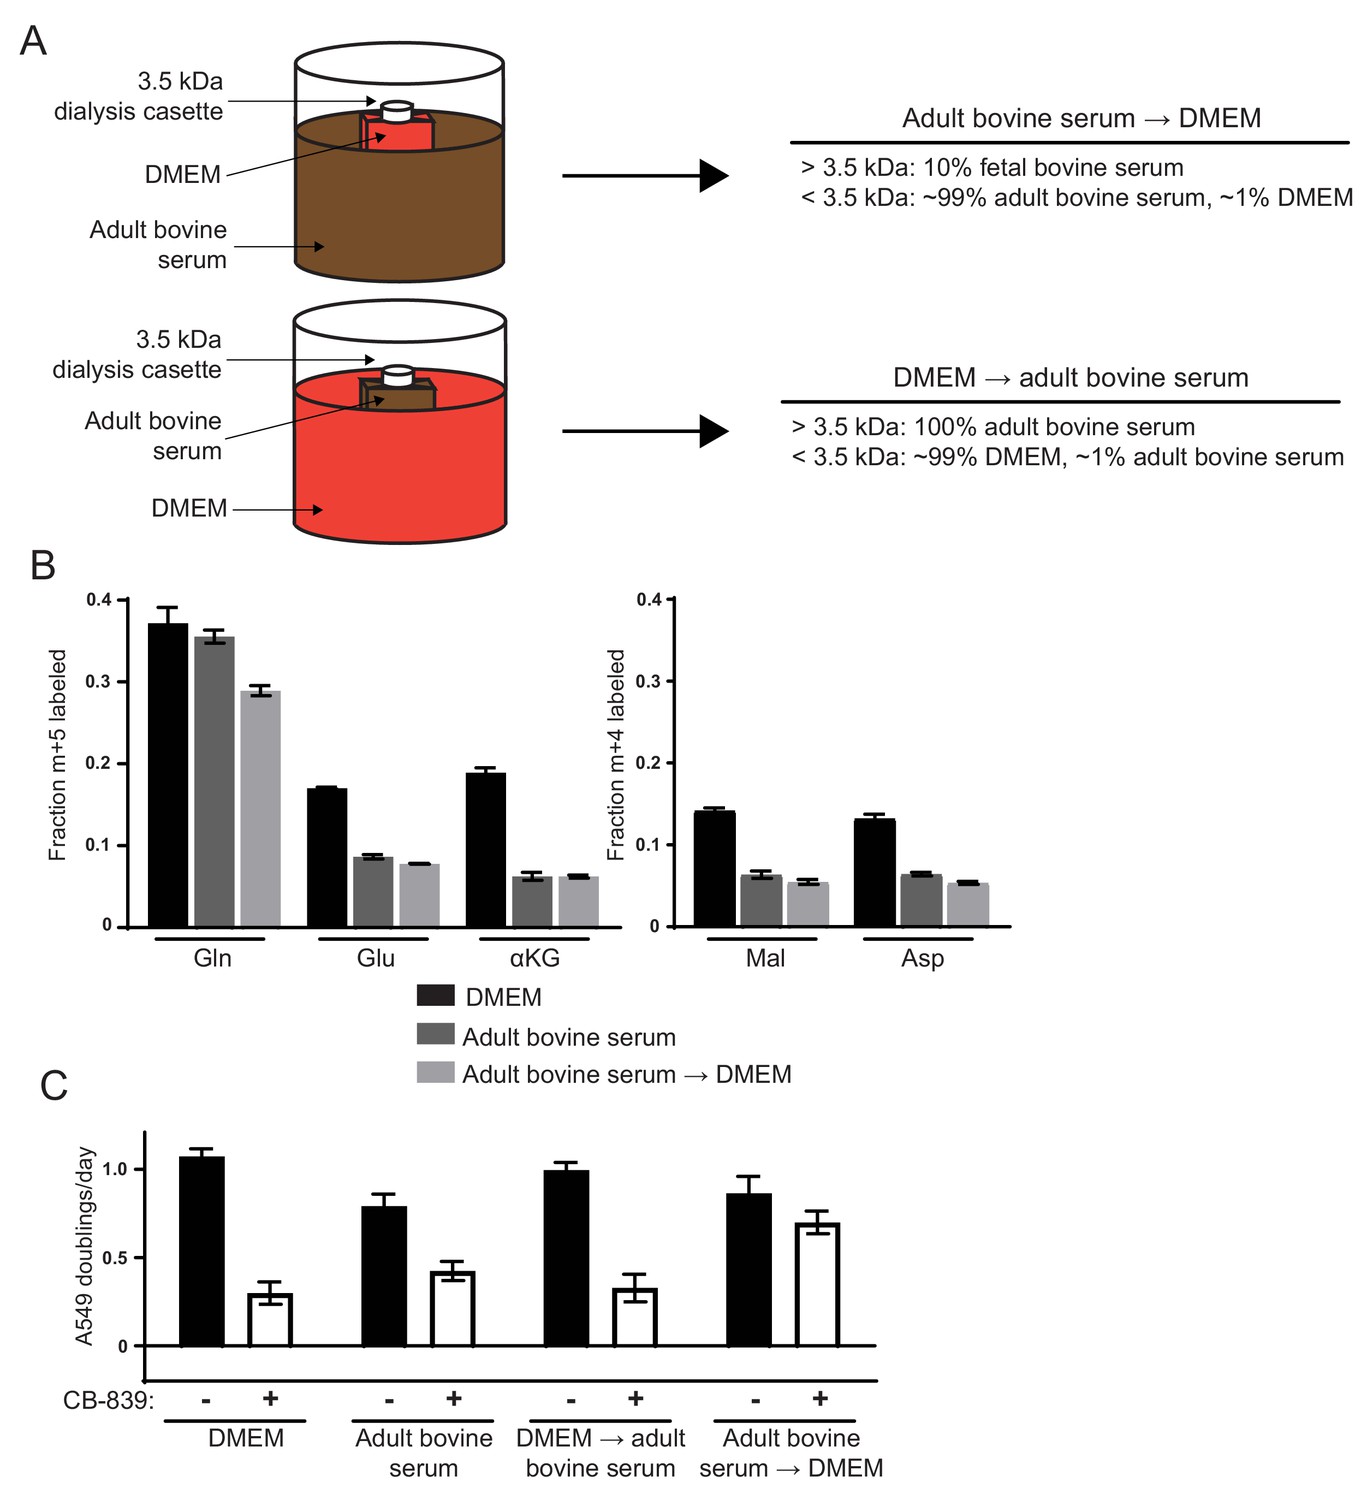
Differences in the small molecule (<3.5 kDa) fraction between DMEM and adult bovine serum account for differences in glutamine anaplerosis and sensitivity to glutaminase inhibition.
(A) Diagram detailing the generation of top ‘Adult bovine serum → DMEM’ and bottom ‘DMEM → adult bovine serum’. To make each dialyzed medium, 210 mL of DMEM or adult bovine serum was dialyzed twice against 4 L of adult bovine serum or DMEM respectively using 70 mL capacity 3.5 kDa cutoff dialysis cassettes. (B) M + 5 fractional labeling of glutamine, glutamate and α-ketoglutarate, and m + 4 labeling of fumarate, malate, aspartate and citrate for A549 cells cultured for 8 hr in DMEM, adult bovine serum and ‘Adult bovine serum → DMEM’ with [U-13C5]glutamine added to each media at ~33% enrichment (n = 3). (C) Proliferation rates of A549 cells cultured in DMEM, adult bovine serum, ‘DMEM → adult bovine serum’, ‘Adult bovine serum → DMEM’ with vehicle (DMSO) or 1 µM CB-839 (n = 3). For all panels, the values represent the mean and the error bars represent ± SD.
Figure 3 with 2 supplements
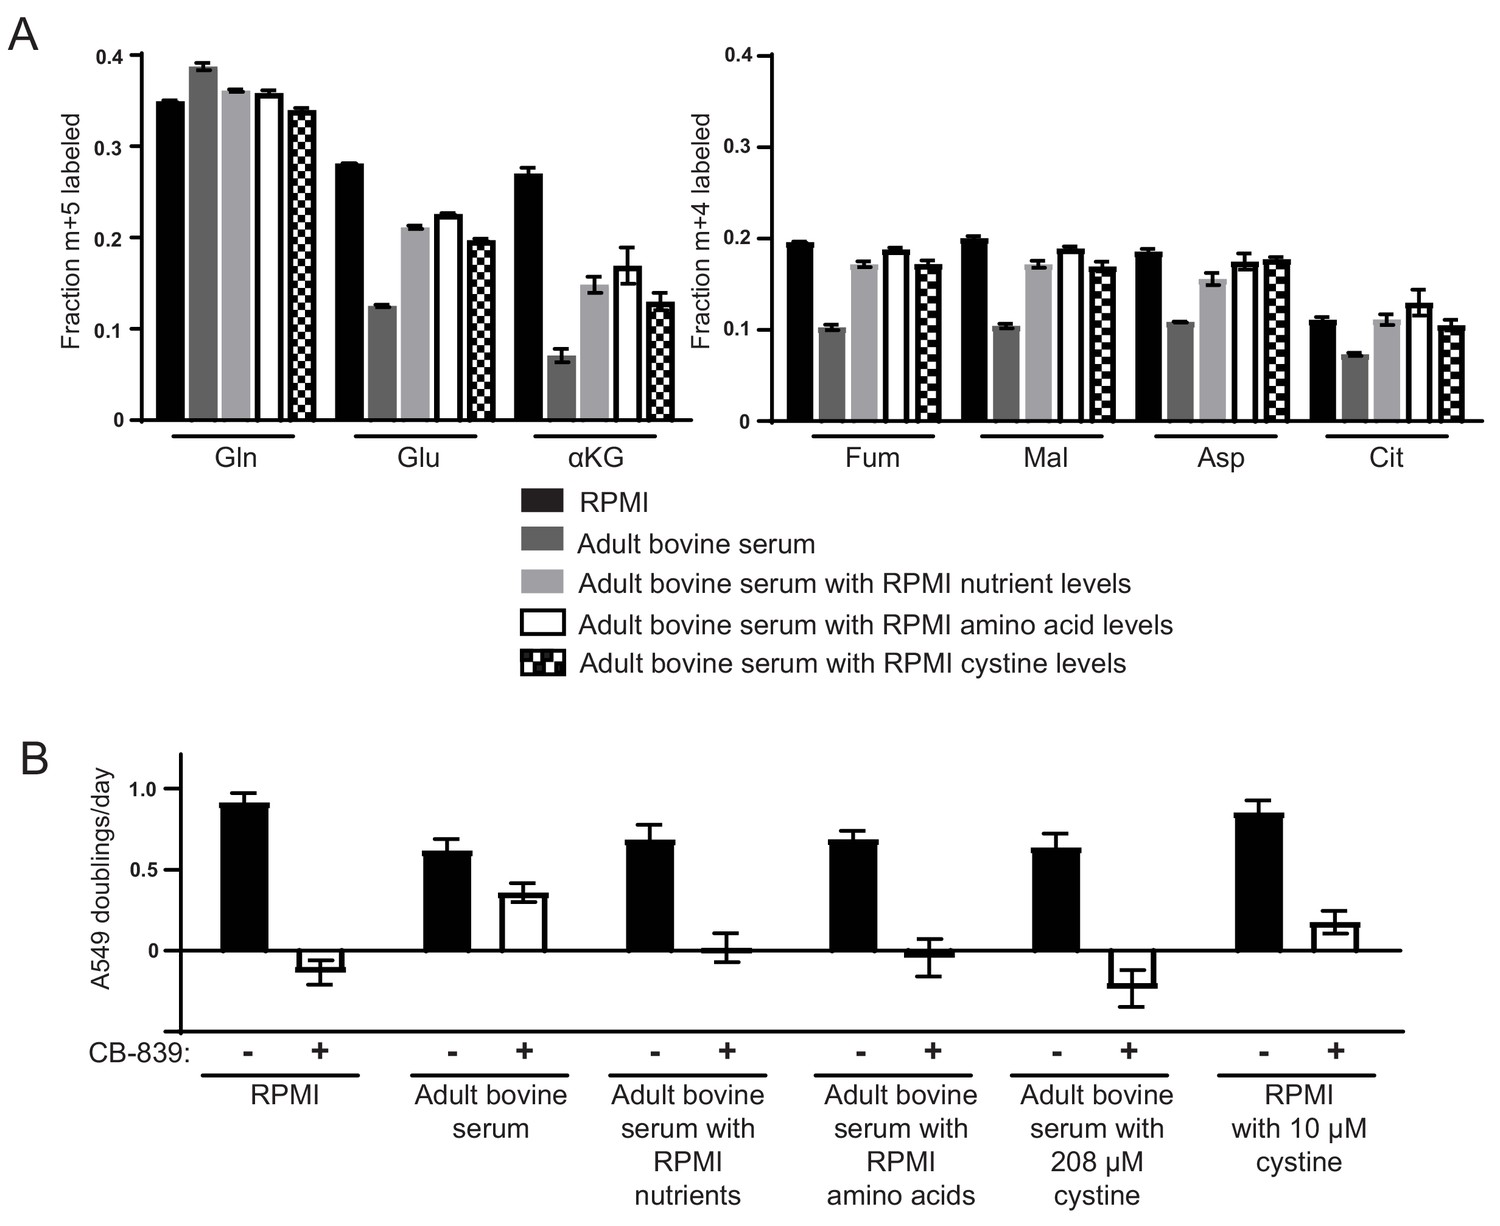
High levels of cystine enhance glutamine anaplerosis and potentiate the effects of the glutaminase inhibitor CB-839.
(A) M + 5 fractional labeling of glutamine, glutamate and α-ketoglutarate, and m + 4 labeling of fumarate, malate, aspartate and citrate is shown for A549 cells cultured for 8 hr in RPMI, adult bovine serum, adult bovine serum with RPMI nutrient levels, adult bovine serum with RPMI amino acid levels and adult bovine serum with 208 µM cystine added (RPMI cystine levels). Each medium included [U-13C5]glutamine added to ~33% enrichment (n = 3). (B) The proliferation of A549 cells cultured in the same media defined in (A) and RPMI containing 10 µM cystine with vehicle (DMSO) or 1 µM CB-839 as indicated (n = 3). For all panels, the values represent the mean and the error bars represent ± SD.
-
Figure 3—source data 1
Mass isotopomer distributions for all metabolites analyzed by GC-MS in Figure 3.
- https://doi.org/10.7554/eLife.27713.019
Figure 3—figure supplement 1
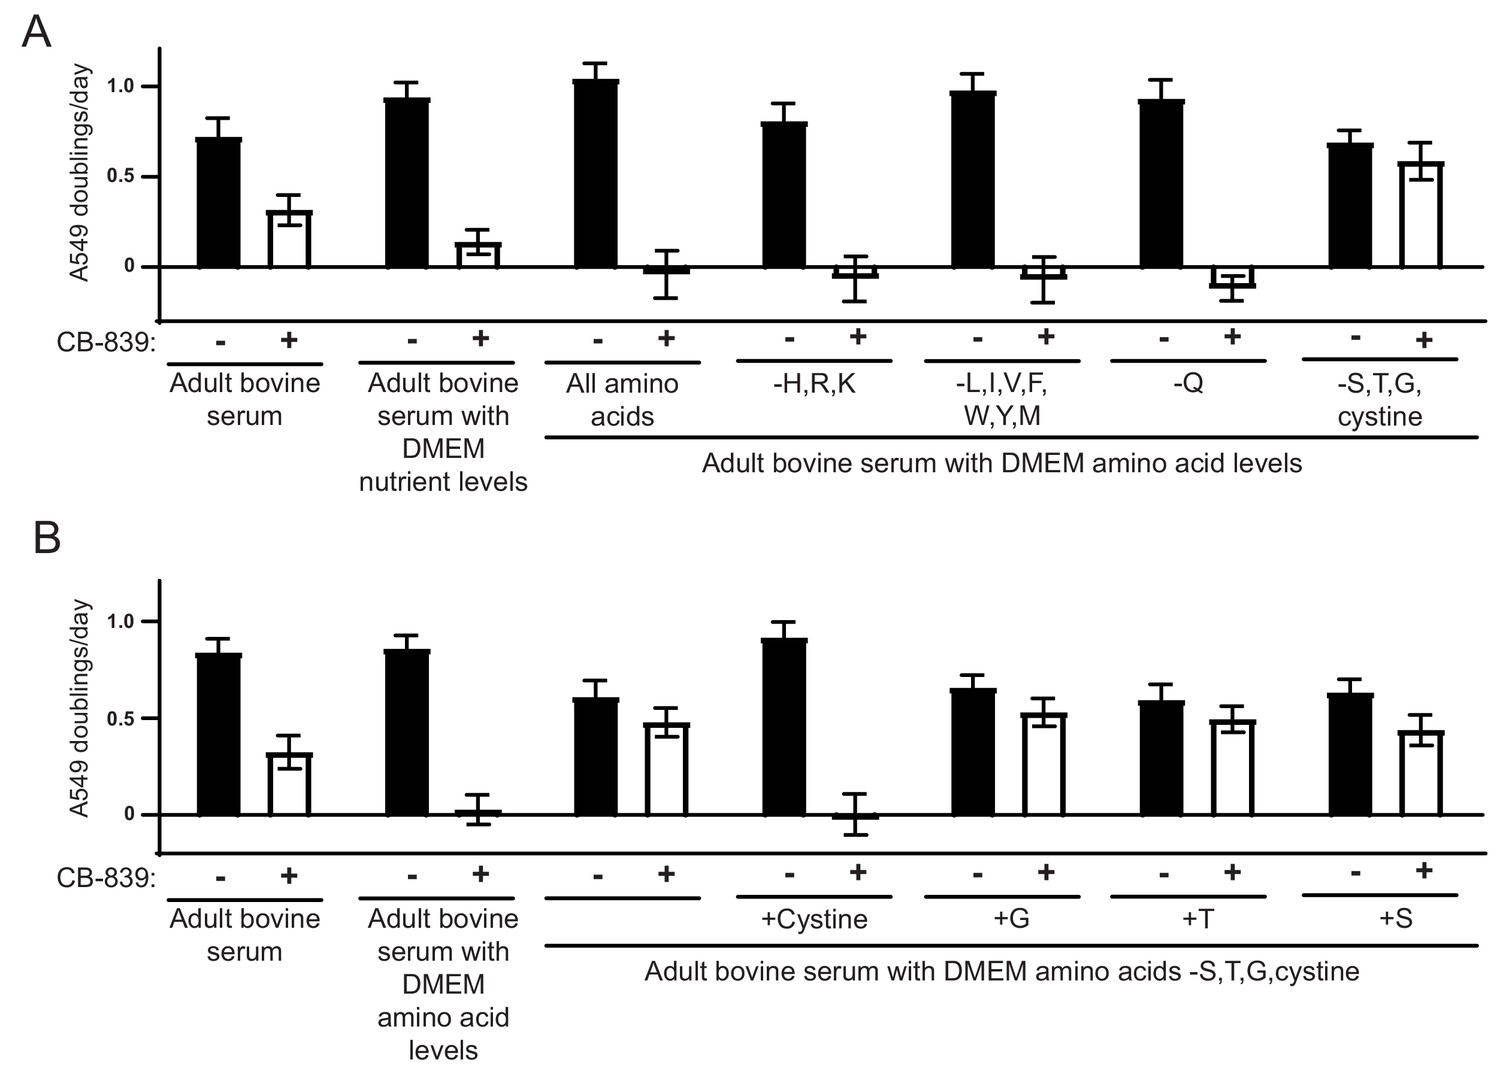
Identification of cystine as the metabolite in standard culture media that potentiates the glutaminase inhibitor CB-839.
(A) A549 cells were cultured in adult bovine serum with DMEM nutrient levels, adult bovine serum with DMEM amino acid levels and adult bovine serum with DMEM amino acid levels, but without supplementation of the amino acids indicated by their standard single letter code in each column. For each medium, the proliferation rate for cells cultured in the presence of vehicle (DMSO) or 1 µM CB-839 is shown (n = 3). (B) A549 cells were cultured in adult bovine serum, adult bovine serum with DMEM amino acid levels, adult bovine serum with all DMEM amino acids supplemented except serine, glycine, threonine and cystine, or the previous medium supplemented with DMEM levels of serine, glycine, threonine or cystine added individually as indicated. For each medium, the proliferation rate for cells cultured in the presence of vehicle (DMSO) or 1 µM CB-839 is shown (n = 3). For all panels, the values represent the mean and the error bars represent ± SD.
Figure 3—figure supplement 2
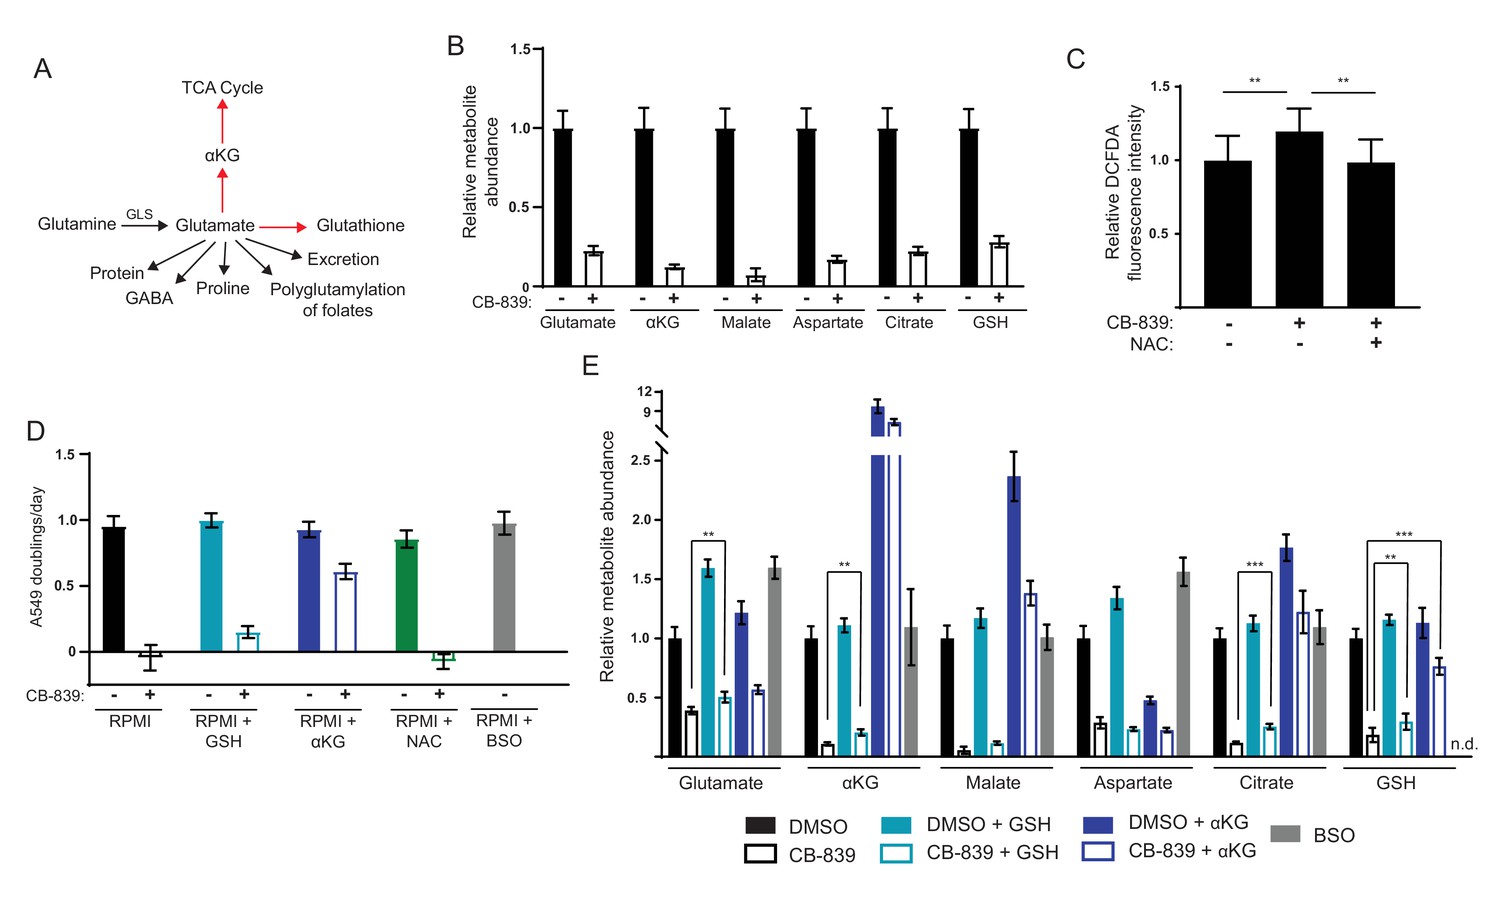
Glutathione depletion and ROS are not solely responsible for decreased cell proliferation following glutaminase inhibition in high cystine environments.
(A) Glutamate has multiple possible metabolic fates in cells, any of which may become limiting upon glutaminase inhibition. Two fates indicated by red arrows (TCA cycle anaplerosis and glutathione biosynthesis) have previously been reported to become limiting upon glutaminase inhibition. (B) A549 cells were cultured in RPMI in the presence of vehicle (DMSO) or 1 µM CB-839 for 24 hr. Metabolites were extracted, analyzed by LC-MS and the level of each metabolite was normalized to the DMSO treated control (n = 3). (C) A549 cells were cultured in the presence of DMSO, 1 µM CB-839, or 1 µM CB-839 with 2 mM NAC for 24 hr, and then stained with the ROS sensitive dye DCFDA. DCFDA signal intensity normalized to cell number is shown for each condition (n = 12). (D) A549 cells were cultured in RPMI with 2 mM glutathione monoethyl-ester (GSH), 5 mM dimethyl-α-ketoglutarate (αKG), 2 mM N-acetylcysteine (NAC) or 100 µM buthionine sulfoximine (BSO) as indicated. For each condition, the proliferation rate for cells cultured in the presence of vehicle (DMSO) or 1 µM CB-839 is shown (n = 3). (E) A549 cells were cultured for 24 hr in RPMI with 5 mM αKG, 2 mM GSH, 2 mM NAC or 100 µM BSO, in the presence of DMSO or 1 µM CB-839. Metabolites were extracted, analyzed by LC-MS and the level of each metabolite was normalized to the RPMI alone DMSO treated control (n = 3). n.d. indicates that the metabolite was not detected. For all panels, the values represent the mean and the error bars represent ± SD. P values were calculated using a two-tailed unpaired t tests. * indicates p<0.05; ** indicates p<0.01; *** indicates p<0.001.
Figure 4 with 4 supplements
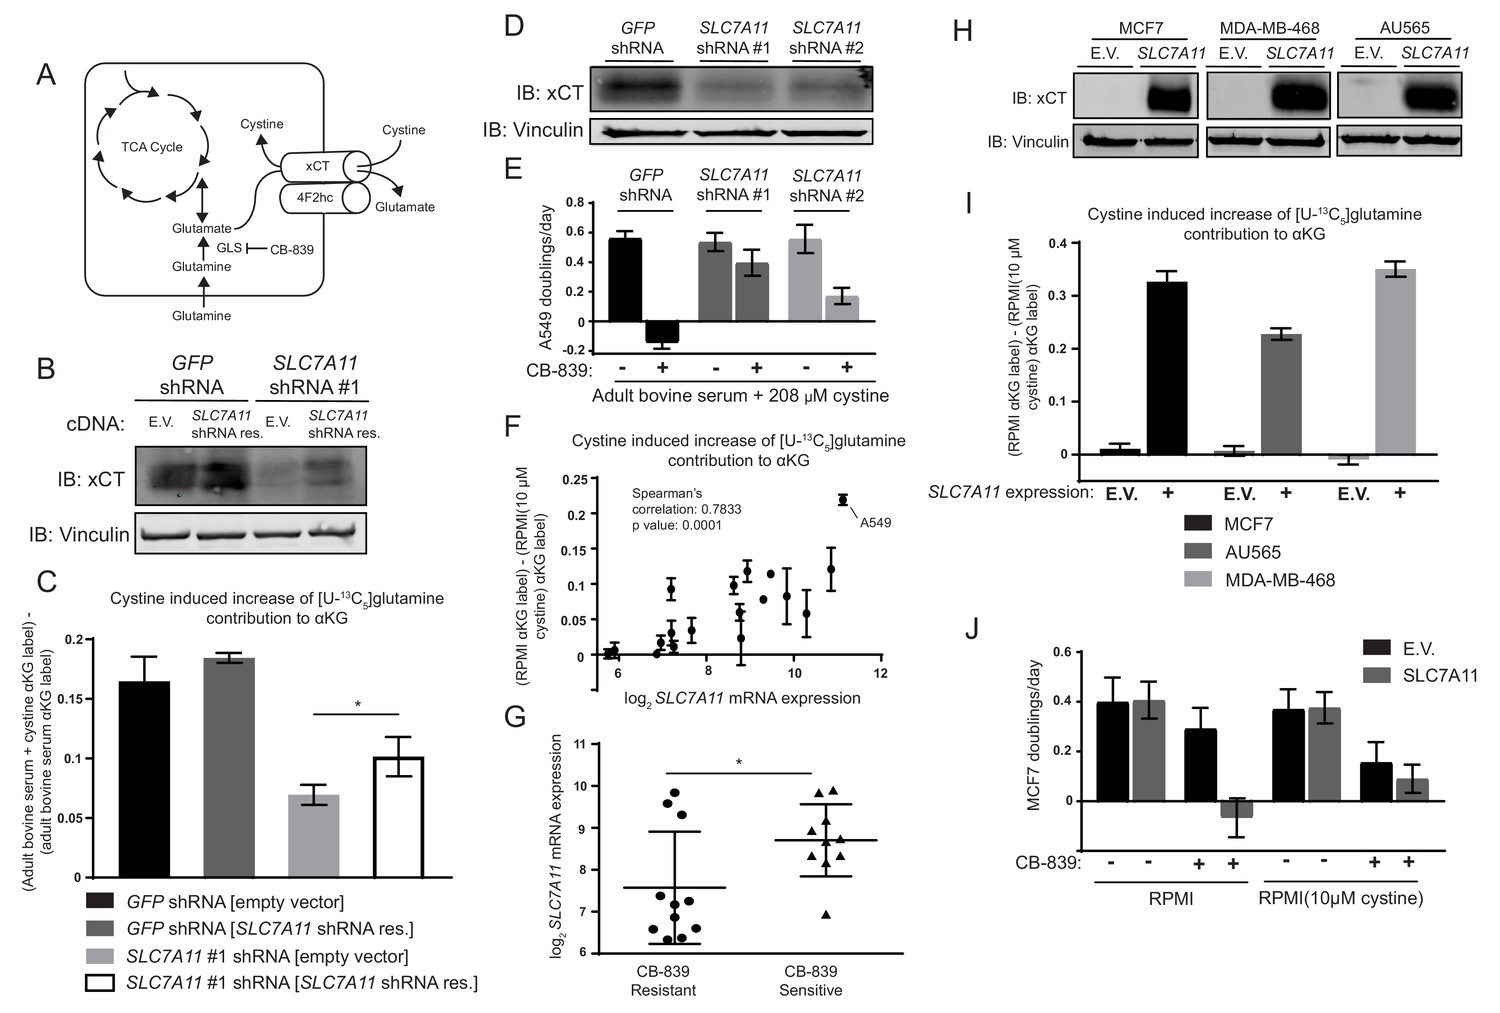
The cystine/glutamate antiporter xCT/SLC7A11 is necessary and sufficient for cystine induced glutamine anaplerosis and CB-839 sensitivity.
(A) System xc– is a plasma membrane antiporter composed of two polypeptides, xCT (encoded by SLC7A11) and 4F2hc/CD98 (encoded by SLC3A2), that exchanges intracellular glutamate for extracellular cystine. (B) A549 cells were infected with lentiviruses encoding a SLC7A11 targeting shRNA or a control shRNA targeting GFP as indicated. These cells were then infected with retroviruses expressing either shRNA resistant SLC7A11 cDNA or empty vector (E.V.) as indicated. Shown is an immunoblot analysis of these modified cell lines for xCT protein expression with vinculin as a loading control. (C) The four cell lines from (B) were cultured for 8 hr in adult bovine serum or adult bovine serum with 208 µM cystine. Each medium included [U-13C5]glutamine added to ~33% enrichment (n = 3). M + 5 fractional labeling of α-ketoglutarate and glutamine for each cell line in each condition was determined. Shown is the difference in m + 5 fractional label of α-ketoglutarate (normalized to m + 5 fractional enrichment of glutamine) between adult bovine serum with 208 µM cystine and adult bovine serum. We define this as the ‘cystine induced increase of glutamine contribution to αKG’. (D) Immunoblot analysis of A549 cells infected with lentiviruses encoding SLC7A11 targeting shRNAs or a control shRNA targeting GFP as indicated. (E) Proliferation rates of cell lines from (D) cultured in adult bovine serum with 208 µM cystine with vehicle (DMSO) or 1 µM CB-839 is shown (n = 3). (F) Multiple cell lines (see Figure 4—source data 1 for identity of cell lines) were cultured for 8 hr in RPMI or RPMI with 10 µM cystine. Each medium included [U-13C5]glutamine added to ~33% enrichment (n = 2–3). M + 5 fractional labeling of α-ketoglutarate and glutamine for each cell line in each condition was determined. Shown is ‘cystine induced increase of glutamine contribution to αKG’ defined as the difference of m + 5 fractional label of α-ketoglutarate (normalized to m + 5 fractional enrichment of glutamine) between RPMI and RPMI with 10 µM cystine for a given cell line. This term is plotted against SLC7A11 mRNA expression data obtained from the cancer cell line encyclopedia (CCLE) (Barretina et al., 2012). (G) SLC7A11 mRNA expression data from the CCLE is shown for breast cancer cell lines reported to be CB-839 resistant (IC50 >1 µM) or CB-839 sensitive (IC50 <1 µM) (Gross et al., 2014). Difference in SLC7A11 expression between the two groups was tested by two-tailed unpaired t-test. (H) Indicated cell lines were infected with lentiviruses encoding SLC7A11 cDNA or empty vector (E.V.). Shown is an immunoblot analysis of xCT protein expression for these modified cell lines with vinculin expression presented as a loading control. (I) Cystine induced increase of glutamine contribution to αKG was determined as in (F) for the cell lines described in (H). (J) Proliferation rates for MCF7 cells without (E.V.) or with SLC7A11 expression cultured in RPMI or RPMI with 10 µM cystine in the presence of vehicle (DMSO) or 1 µM CB-839 as indicated. For all panels, values represent the mean and the error bars represent ± SD. P values were calculated using a two-tailed unpaired t tests. * indicates p<0.05; ** indicates p<0.01; *** indicates p<0.001.
-
Figure 4—source data 1
Mass isotopomer distributions for all metabolites analyzed by GC-MS in Figure 4.
Cell line identity and SLC7A11 mRNA expression level for cell lines analyzed in 4F. Cell line identity and CB-839 sensitivity for cell lines analyzed in 4G.
- https://doi.org/10.7554/eLife.27713.025
Figure 4—figure supplement 1
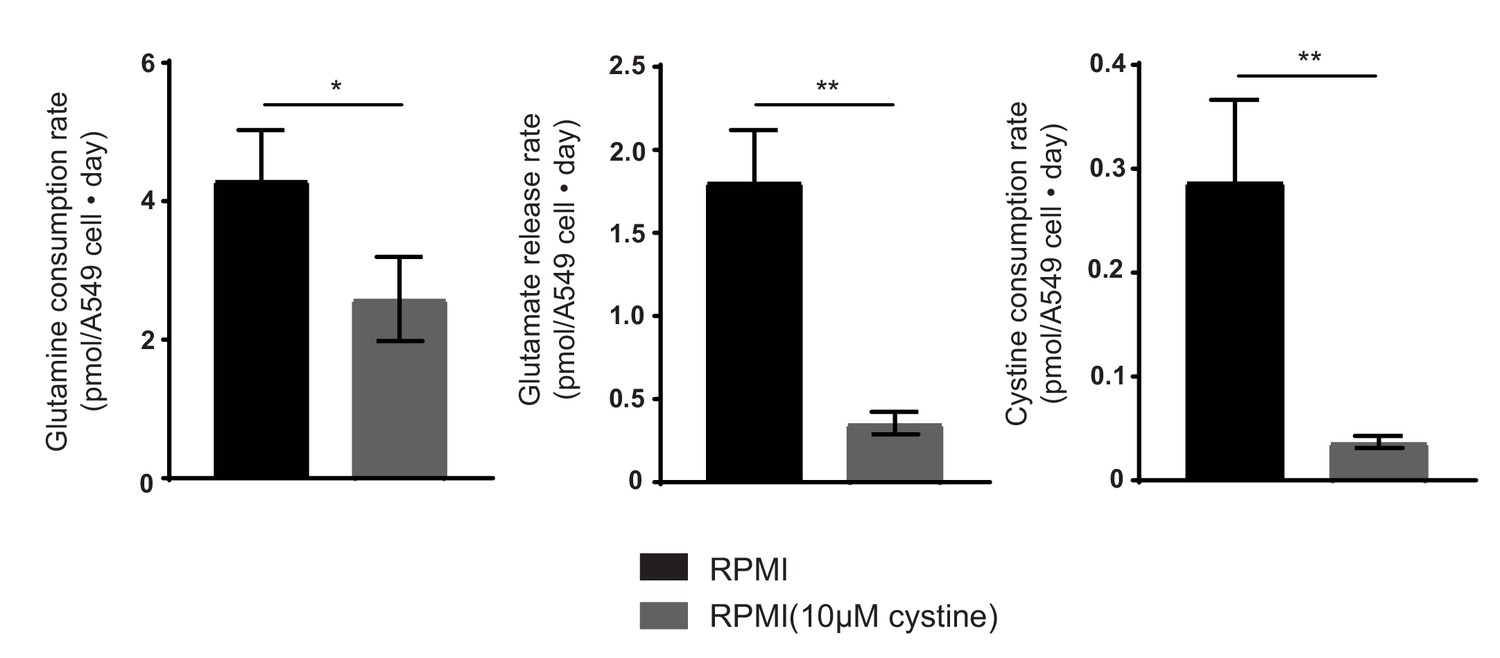
Extracellular cystine alters both cellular glutamine and cystine consumption and glutamate release rates.
(A) A549 cells were cultured in RPMI or RPMI with 10 µM cystine. Per cell rates of glutamine consumption, glutamate release and cystine consumption were measured as detailed in Materials and methods (n = 3). The values represent the mean and the error bars represent ± SD. P values were calculated using a two-tailed unpaired t tests. * indicates p<0.05; ** indicates p<0.01; *** indicates p<0.001.
Figure 4—figure supplement 2
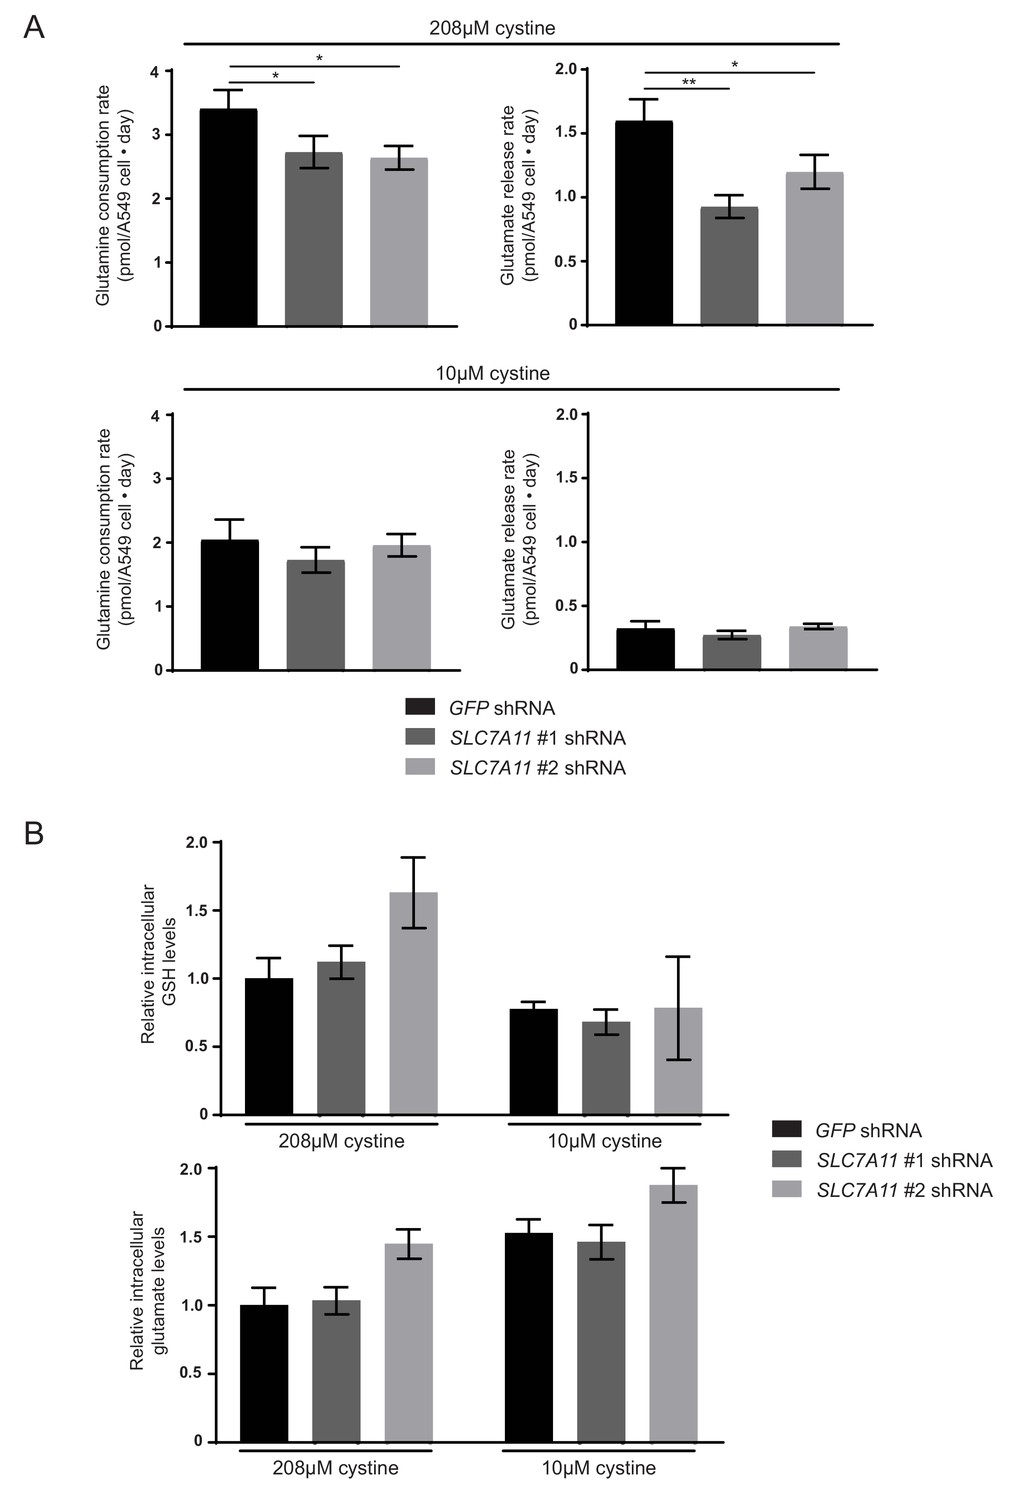
Knockdown of SLC7A11 reduces cellular glutamine uptake and glutamate release potentiated by high environmental cystine.
(A) A549 cells infected with lentiviruses encoding SLC7A11 targeting shRNAs or a control shRNA targeting GFP were cultured in RPMI or RPMI with 10 µM cystine. Per cell rates of glutamine consumption and glutamate release are shown (n = 3). (B) A549 cells infected with lentiviruses encoding SLC7A11 targeting shRNAs or a control shRNA targeting GFP were cultured in RPMI or RPMI with 10 µM cystine for 24 hr. Metabolites were extracted, analyzed by LC-MS and the level of each metabolite was normalized to the A549 GFP shRNA cell line cultured in standard RPMI (n = 3). The values represent the mean and the error bars represent ± SD. P values were calculated using a two-tailed unpaired t tests. * indicates p<0.05; ** indicates p<0.01; *** indicates p<0.001.
Figure 4—figure supplement 3
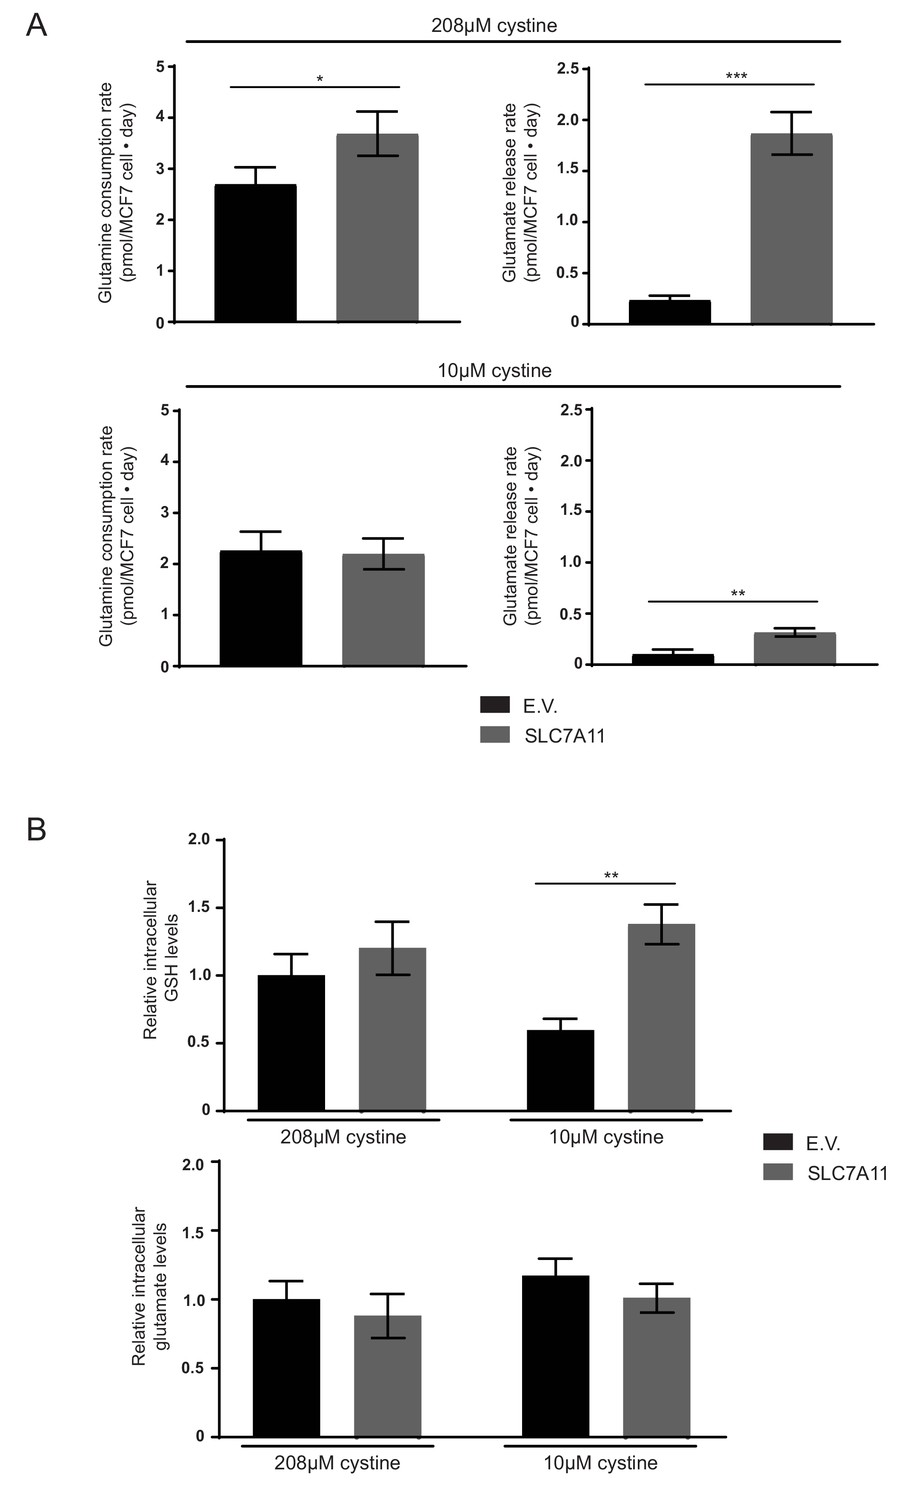
SLC7A11 expression enhances cellular glutamine uptake and glutamate release potentiated by high environmental cystine.
(A) MCF7 cells infected with lentiviruses encoding SLC7A11 cDNA or empty vector (E.V.). were cultured in RPMI or RPMI with 10 µM cystine. Per cell rates of glutamine consumption and glutamate release and were measured (n = 3). (B) MCF7 cells infected with lentiviruses encoding SLC7A11 cDNA or empty vector (E.V.). were cultured in RPMI or RPMI with 10 µM cystine for 24 hr. Metabolites were extracted, analyzed by LC-MS and the level of each metabolite was normalized to the MCF7 E.V. cell line cultured in standard RPMI (n = 3). The values represent the mean and the error bars represent ± SD. P values were calculated using a two-tailed unpaired t tests. * indicates p<0.05; ** indicates p<0.01; *** indicates p<0.001.
Figure 4—figure supplement 4
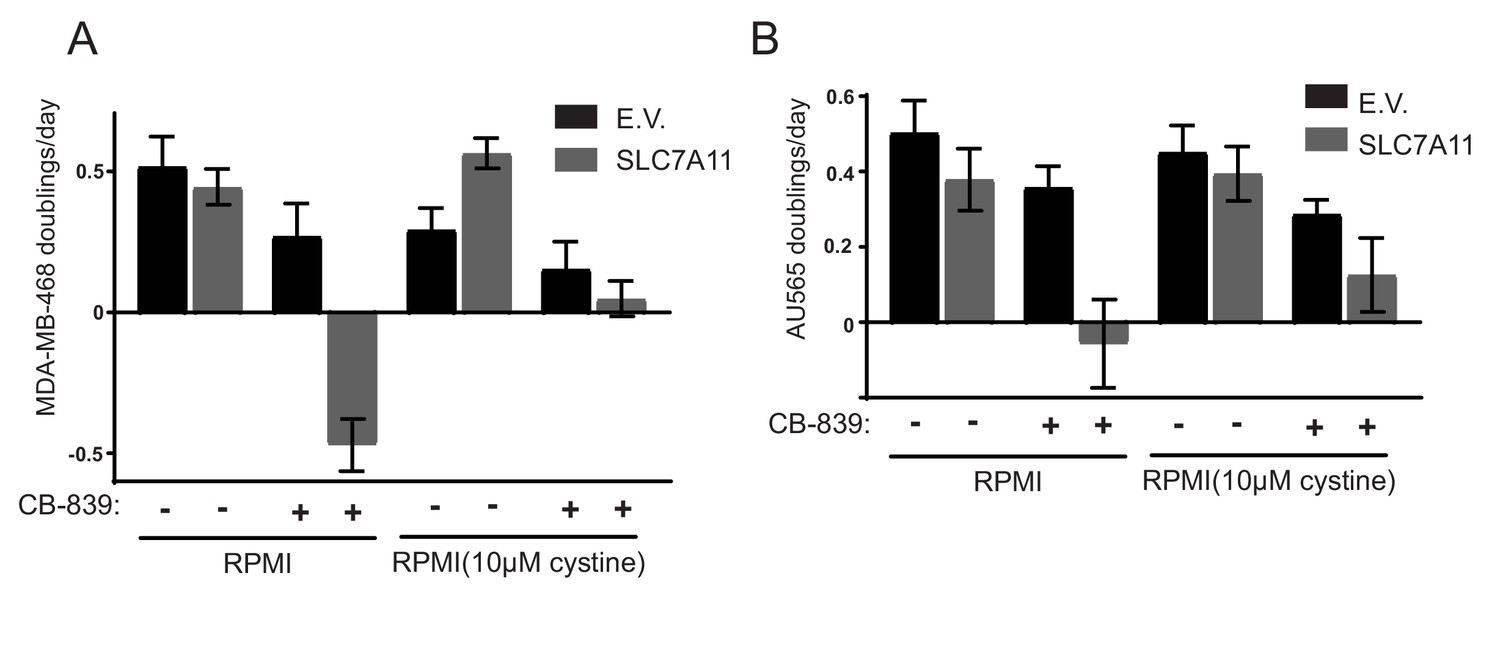
Overexpression of xCT/SLC7A11 causes cystine-induced CB-839 sensitivity for MDA-MB-468 and AU565 breast cancer cell lines.
Proliferation rates for MDA-MB-468 and AU565 cell lines overexpressing SLC7A11 or empty vector (from Figure 4G) cultured in RPMI or RPMI with 10 µM cystine in the presence of vehicle (DMSO) or 1 µM CB-839 as indicated. The values represent the mean and the error bars represent ± SD.
Figure 5
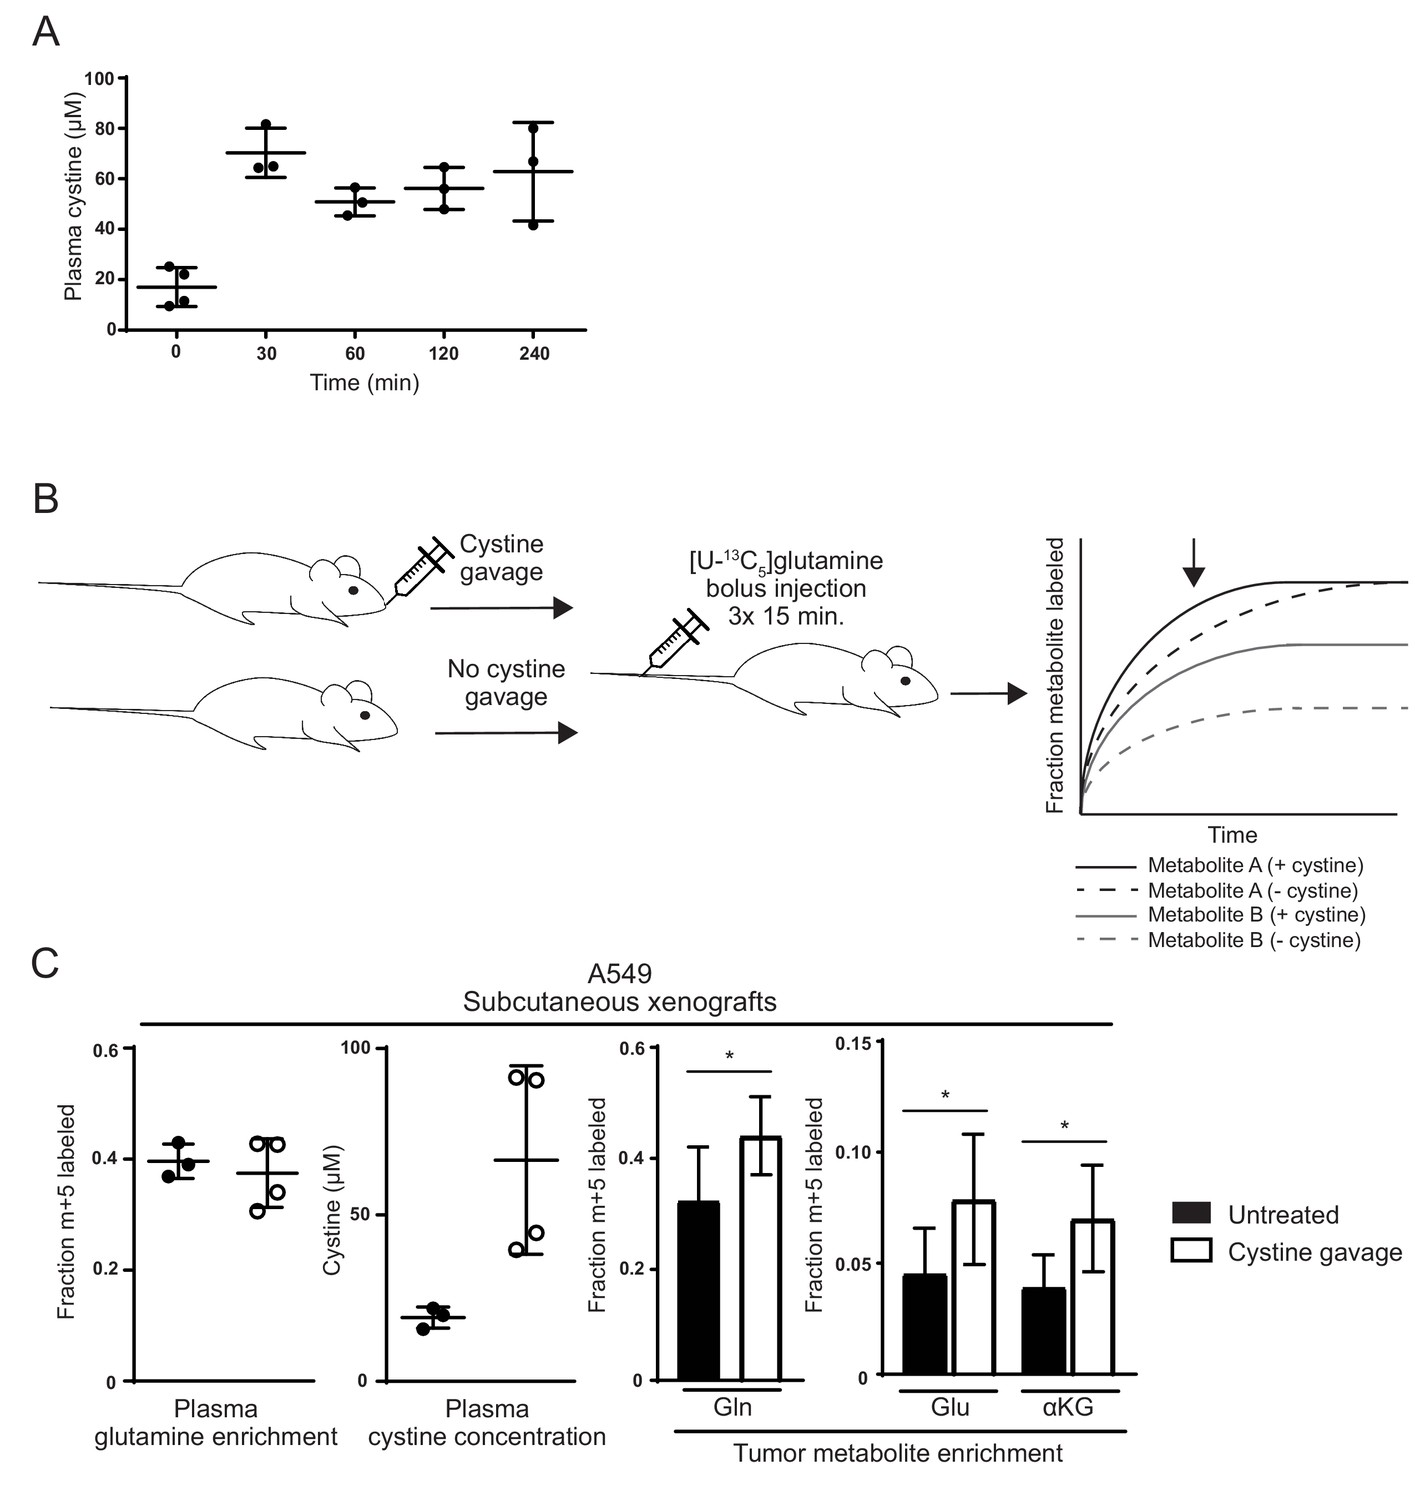
Raising cystine levels increases glutamine metabolism in tumors.
(A) nu/nu mice were treated with 2.4 g/kg cystine by oral gavage, and plasma from these animals was collected at the indicated time points. Cystine concentration in plasma at each time point as determined by GC-MS is shown. (B) Schematic diagram of cystine administration to tumor bearing mice, followed by bolus I.V. injections of [U-13C5]glutamine,and analysis of intratumoral metabolite labeling during the period of kinetic labeling. Shown in the graph are hypothetical labeling patterns of two metabolites over time after glutamine injection. Metabolite A (shown in black) is labeled by glutamine faster in the presence of cystine, but the level of steady state labeling is unaffected. Metabolite B (shown in gray) is labeled by glutamine faster in the presence of cystine and also to a greater extent at steady state. We harvest and analyze tumors in the pre-steady state period of labeling as indicated by the arrow, and thus it is not possible to determine to what extent an increase in labeling is due to faster labeling kinetics or increased steady state contribution of the label to the given metabolite. (C) A549 tumor bearing mice were treated (n = 4) or not (n = 3) with oral cystine prior to three bolus [U-13C5]glutamine injections every 15 min. Plasma and tumor tissue was then harvested 15 min after the last injection (described in Materials and methods). Left Enrichment of m + 5 glutamine and cystine concentration in the plasma of these animals. Right Fractional labeling of glutamine (m + 5), glutamate (m + 5), α-ketoglutarate (m + 5) in A549 tumor tissue. For all panels, the values represent the mean and the error bars represent ± SD. P values were calculated using a two-tailed unpaired t tests. * indicates p<0.05; ** indicates p<0.01; *** indicates p<0.001.
-
Figure 5—source data 1
Mass isotopomer distributions for all metabolites analyzed by GC-MS in Figure 5.
- https://doi.org/10.7554/eLife.27713.027
Tables
Table 1
Amino acid, glucose, pyruvate and lactate concentrations in all media used in this study compared to human plasma clinical reference values
https://doi.org/10.7554/eLife.27713.015| Metabolite | Human male plasma reference range* [µM] | RPMI-1640 with 10% dialyzed fetal bovine serum [µM] | DMEM with 10% dialyzed fetal bovine serum [µM] | Adult bovine serum† [µM] | Adult bovine heparinized plasma† [µM] | Adult human serum† [µM] |
|---|---|---|---|---|---|---|
| Alanine | 146–494 | 0 | 0 | 314 ± 6 | 321 ± 3 | 670 ± 13 |
| Arginine | 28–96 | 1034 | 360 | 312 ± 10 | 150 ± 9 | 216 ± 8 |
| Aspargine | 32–92 | 341 | 0 | 17 ± 1 | 19 ± 1 | 81 ± 2 |
| Aspartate | 2–9 | 135 | 0 | 7.4 ± 0.4 | 5.3 ± 0.4 | 59.2 ± 1.3 |
| Cystine | 24–54 | 187 | 180 | 0.3 ± 0.1 | 2 ± 0.1 | 3.4 ± 0.2 |
| Glutamate | 6–62 | 122 | 0 | 192 ± 3 | 120 ± 1 | 348 ± 5 |
| Glutamine | 466–798 | 1849 | 3600 | 183 ± 4 | 291 ± 1 | 409 ± 7 |
| Glycine | 147–299 | 120 | 360 | 302 ± 6 | 221 ± 1 | 409 ± 8 |
| Histidine | 72–108 | 87 | 180 | 8.9 ± 0.2 | 8.2 ± 0.2 | 17.7 ± 0.3 |
| Isoleucine | 46–90 | 344 | 720 | 112 ± 2 | 84 ± 1 | 114 ± 1 |
| Leucine | 113–205 | 344 | 720 | 218 ± 3 | 172 ± 1 | 231 ± 5 |
| Lysine | 135–243 | 197 | 720 | 92 ± 2 | 146 ± 1 | 206 ± 4 |
| Methionine | 13–37 | 91 | 180 | 21 ± 1 | 26 ± 1 | 39 ± 1 |
| Phenylalanine | 46–74 | 82 | 360 | 92 ± 2 | 68 ± 1 | 144 ± 3 |
| Proline | 97–297 | 157 | 0 | 88 ± 2 | 61 ± 1 | 301 ± 4 |
| Serine | 89–165 | 257 | 360 | 119 ± 2 | 74 ± 1 | 237 ± 5 |
| Threonine | 92–180 | 151 | 720 | 63 ± 1 | 50 ± 1 | 192 ± 3 |
| Tryptophan | 25–65 | 22 | 72 | ND | ND | ND |
| Tyrosine | 37–77 | 99 | 360 | 56 ± 1 | 47 ± 1 | 101 ± 3 |
| Valine | 179–335 | 154 | 720 | 251 ± 5 | 181 ± 2 | 325 ± 6 |
| Glucose | 9990 | 22500 | 3932 ± 26 | 8403 ± 33 | 2407 ± 23 | |
| Pyruvate | 27–160 | 0 | 900 | 9.4 ± 0.2 | 70.8 ± 0.5 | 10.3 ± 0.7 |
| Lactate | 0 | 0 | 10878 ± 217 | 9291 ± 61 | 9250 ± 178 |
-
* Shown is the range ±2 standard deviations from the mean value for the indicated metabolite. These values are from (Blau, 2003).
† Shown are the mean values ± the standard error of the mean for the indicated metabolites as determined by GC-MS (see Materials and methods for detailed procedure), except glucose concentration, which was determined using a YSI bioanalyzer. All samples were analyzed in triplicate. ND indicates that the metabolite was not detected.
Additional files
-
Transparent reporting form
- https://doi.org/10.7554/eLife.27713.028
Download links
A two-part list of links to download the article, or parts of the article, in various formats.
Downloads (link to download the article as PDF)
Open citations (links to open the citations from this article in various online reference manager services)
Cite this article (links to download the citations from this article in formats compatible with various reference manager tools)
Environmental cystine drives glutamine anaplerosis and sensitizes cancer cells to glutaminase inhibition
eLife 6:e27713.
https://doi.org/10.7554/eLife.27713


