Sparse genetic tracing reveals regionally specific functional organization of mammalian nociceptors
- University of Pennsylvania, United States
Figures
Figure 1 with 2 supplements
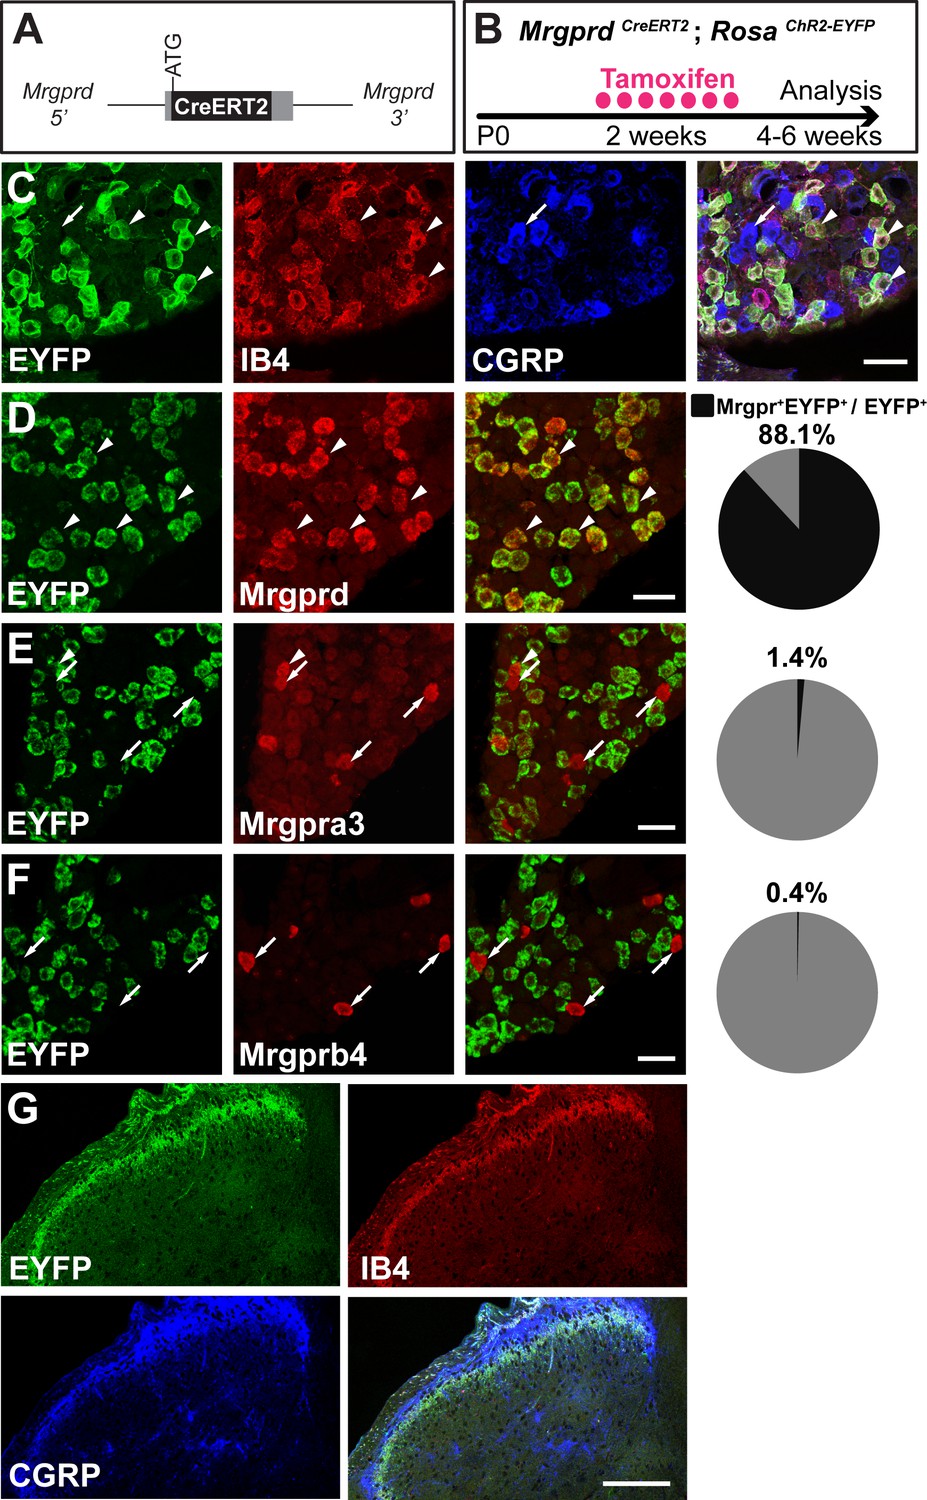
MrgprdCreERT2 mice can mediate recombination specifically in adult Mrgprd+ non-peptidergic nociceptors.
(A) Knock-in MrgprdCreERT2 allele. (B) Illustration showing tamoxifen treatment scheme, 0.5 mg tamoxifen/day, P10-P17 treatment of MrgprdCreERT2; RosaChR2-EYFP mice. (C) Triple staining of DRG section showing EYFP overlaps with IB4 but not CGRP. (D–F) Double fluorescent in situ DRG sections showing EYFP in Mrgprd (D) but not Mrgpra3 (E) or Mrgprb4 (F) cells. Pie charts show overlap quantification (% of EYFP+ cells that co-express Mrgpr, n = 3 animals). (G) DH section showing EYFP+ terminal overlap with IB4 but not CGRP. Arrowheads show overlapping cells, arrows show non-overlapping cells. Scale bars = 50 µm (C–F), 100 µm (G).
Figure 1—figure supplement 1
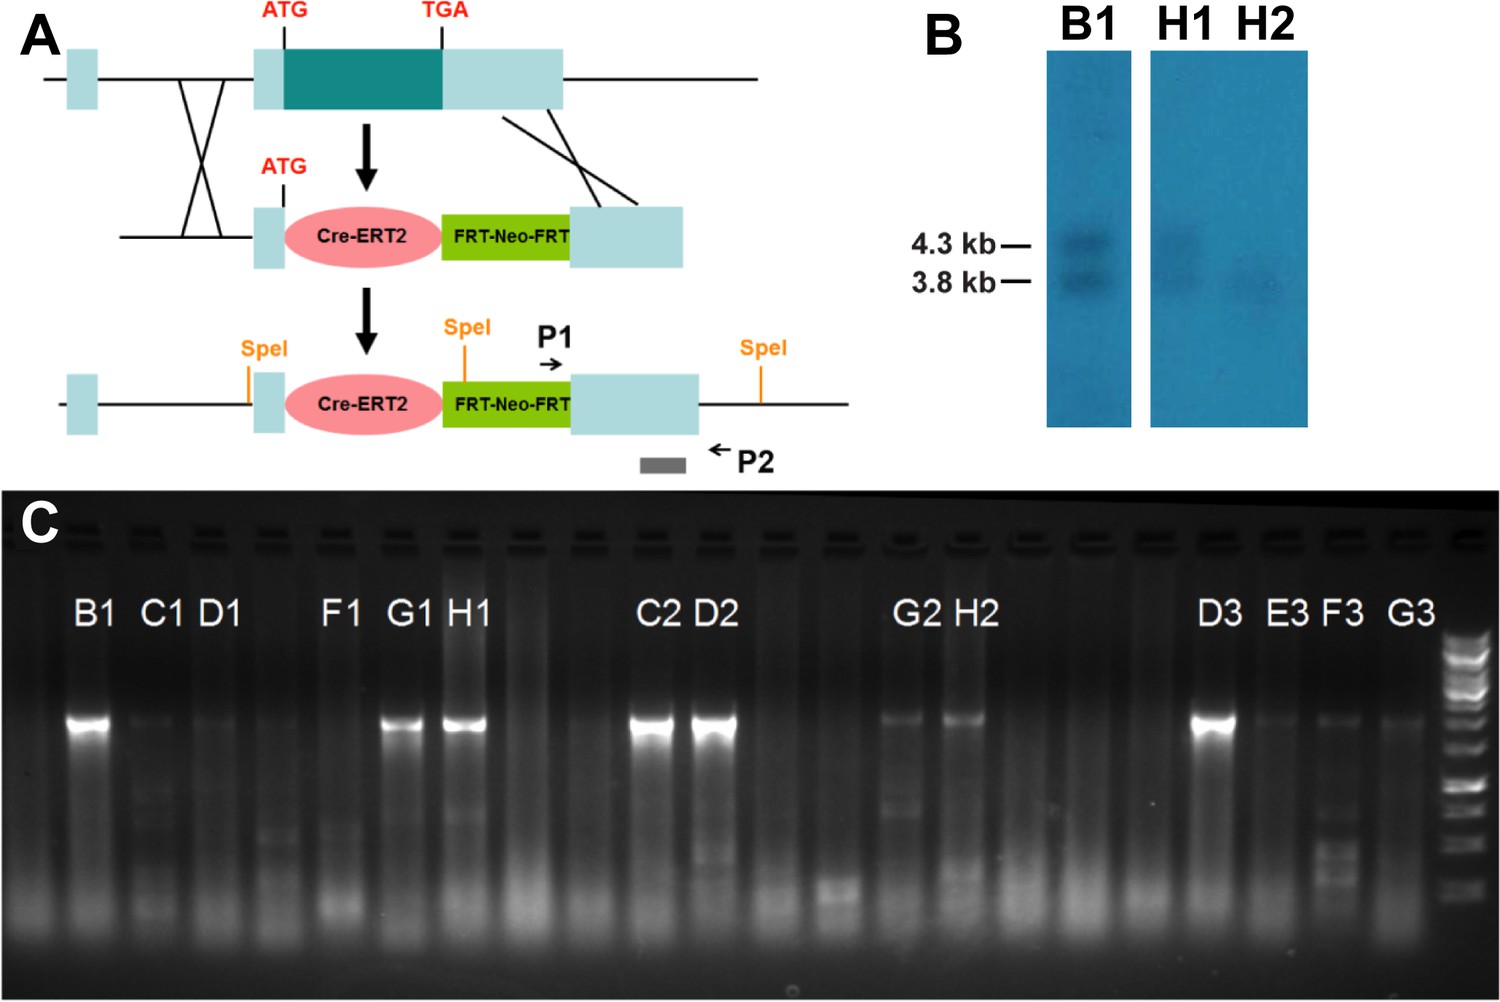
Generation of MrgprdCreERT2 knock-in mouse line.
(A) Illustration showing the knock-in targeting strategy. Grey bar, 3’ UTR Southern blot probe site. P1, P2, primers for PCR screening. (B) Southern blot of SpeI-digested ES genomic DNA, using a probe against Mrgprd 3’ UTR (grey bar in A). 4.3 kb, MrgprdCreERT2 knock-in allele. 3.8 kb, Mrgprd wild-type allele. (C) PCR screen of electroporated ES clones, using P1, P2 primers. The positive PCR product is about 2 kb.
Figure 1—figure supplement 2

Prenatal tamoxifen treatment labels Mrgprd+ along with Mrgpra3/b4+non-peptidergic DRG neurons.
(A–D) Representative DRG sections of 3pw MrgprdCreERT2; RosatdTomato mice (2.5–5 mg tamoxifen at E16.5) immunostained with the indicated markers. tdT+ neurons are positive for non-peptidergic neuron markers peripherin (92.5 ± 4.0%) (A) and IB4 (85.6 ± 1.2%) (C), but do not express NF200 (1.2 ± 0.01%) (B) or CGRP (1.4 ± 0.00%) (D). (E) Representative immunostained DH section showing tdT+ fibers innervating layer II, ventral to CGRP+ fibers but dorsal to PKCγ interneurons. (F–H) Double fluorescent in situ shows expression of Mrgprd (75.2 ± 0.8%) (F), Mrgpra3 (15.0 ± 0.2%) (G) and Mrgprb4 (8.6 ± 0.1%) (H) in tdTomato expressing neurons from prenatally treated MrgprdCreERT2; RosatdTomato mice (5 mg tamoxifen at E17.5). (I) Model showing MrgprdCreERT2 specificity based on time of tamoxifen dosage. MrgprdCreERT2 recombination is consistent with expression of Mrgprd across development. Arrowheads indicate marker overlap with tdT, arrows indicate tdT+ cells that do not express indicated marker. Scale bars, 50 µm (A–D, F–H), 100 µm (E).
Figure 2
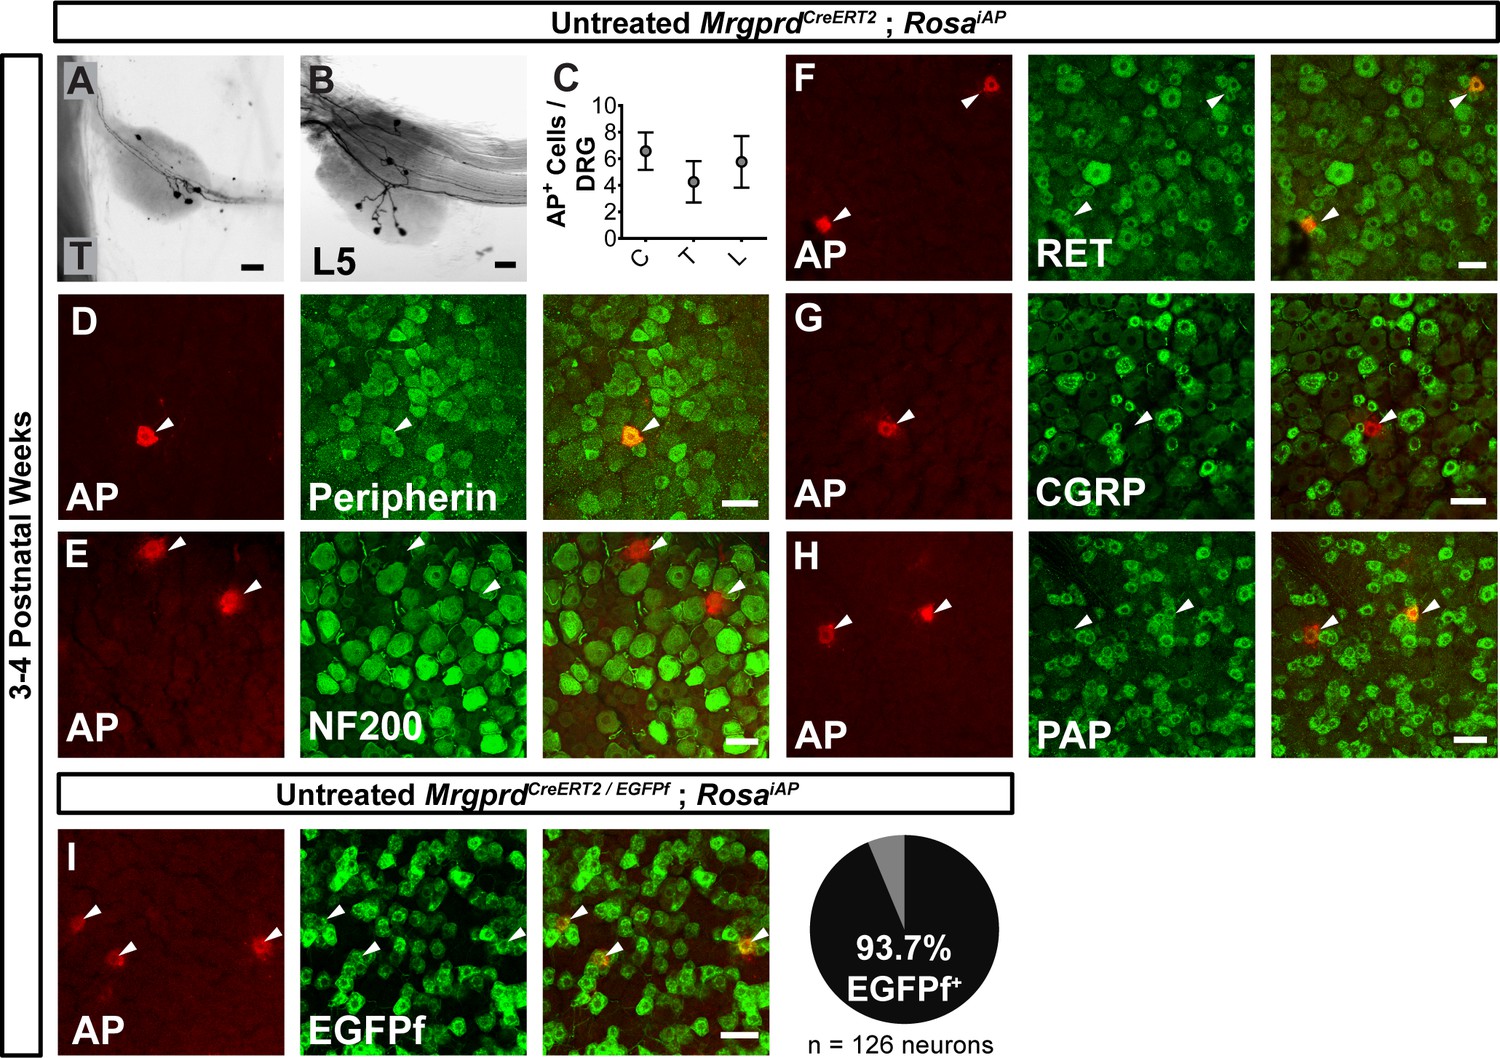
Sparse Mrgprd+ nociceptor labeling in untreated 3–4 pw MrgprdCreERT2; RosaiAP mice.
(A and B) Whole mount AP DRG staining of thoracic (A) and L5 (B) DRGs. (C) AP+ cells / DRG for cervical (C), thoracic (T), and lumbar (L) DRGs, n = 47 DRGs from three animals. (D–H) Whole mount DRG immunostaining plus AP fluorescent staining. Sparse AP+ cells express non-peptidergic nociceptor markers peripherin (D), RET (F) and PAP (H) but not large diameter neuron maker NF200 (E) or peptidergic marker CGRP (G). (I) Whole mount EGFPf immunostaining plus AP fluorescence staining of untreated MrgprdCreERT2/EGFPf; RosaiAP DRGs. AP+ neurons are Mrgprd+ nociceptors. Quantification of overlap (% of AP+ cells that co-express MrgprdEGFPf, n = 126 neurons from three animals). Scale bars = 50 µm.
Figure 3 with 2 supplements
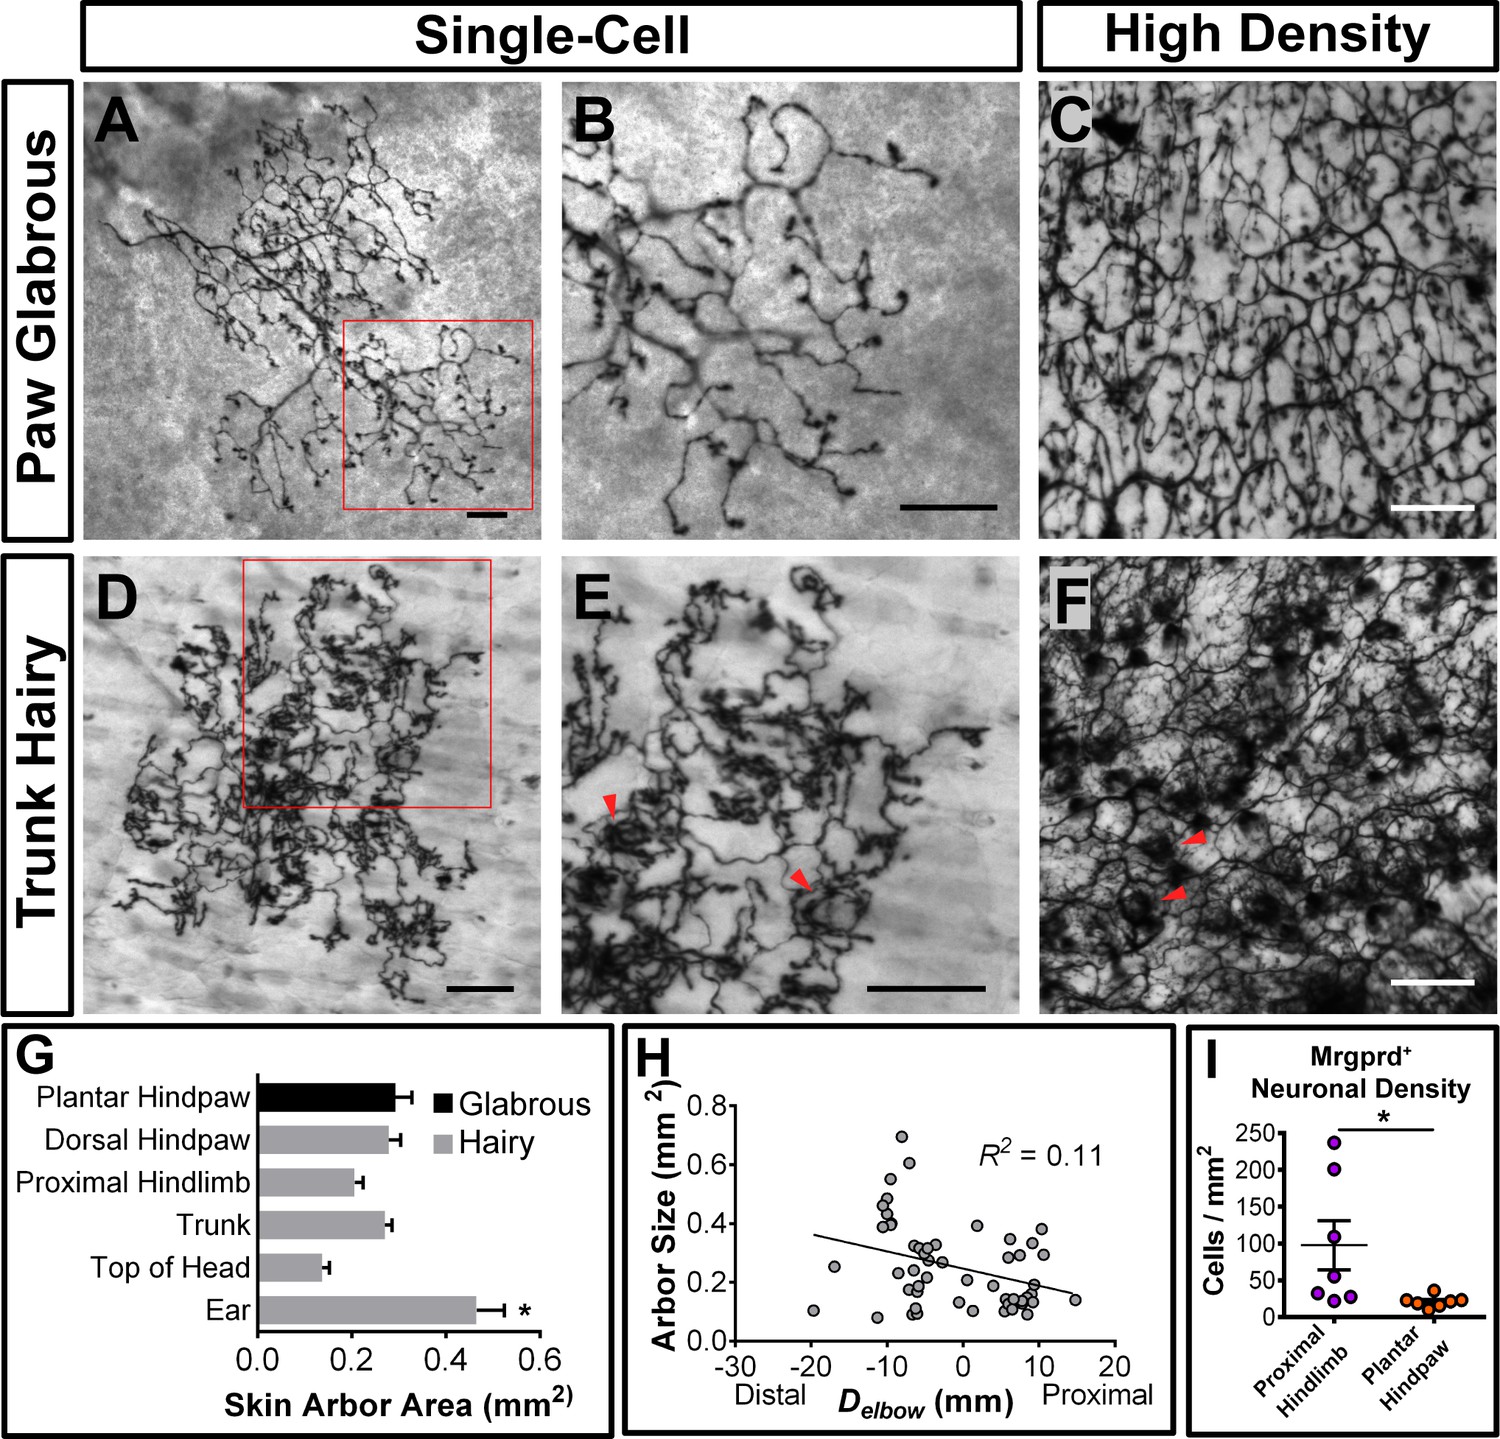
Peripheral organization of non-peptidergic nociceptors in 3–4 pw MrgprdCreERT2; RosaiAP mice.
(A, B, D, E) Sparse labeled non-peptidergic nociceptors show bushy-ending structure in the glabrous skin (A–B) and trunk hairy skin (D–E). B, E, high magnification images of regions boxed in A and D, respectively. (C, F) High-density labeled (0.5 mg tamoxifen at P11) glabrous and hairy skin. Overall neurite density is lower in glabrous compared to hairy skin. Red arrowheads in E and F mark neurite clumps that surround hair follicles. (G) Arbor areas in different skin regions. n = 173 terminals from nine animals. *p<0.05 (one-way ANOVA with Tukey’s multiple comparisons test). (H) Arbor areas in the hind limb skin vs. proximodistal distance (Delbow) from the elbow (point 0, terminals distal to this edge are given negative Delbow values). n = 52 arbors from four animals. No clear relationship between proximodistal location and size is evident (linear regression). (I) Mrgprd+ neuron density (number of retrogradely labeled DiI/MrgprdEGFPf double positive neurons/area of DiI labeled skin, see Figure 3—figure supplement 2) is lower in plantar hind paw compared to proximal hind limb skin. *p<0.05 (Student’s t test). Scale bars = 100 µm.
-
Figure 3—source data 1
Summary of peripheral terminals of sparsely labeled Mrgprd+ non peptidergic nociceptors.
Data pooled from nine 3pw animals. Asterisk (*) indicates a significant difference from other regions (p<0.05, one-way ANOVA with Tukey’s multiple comparisons test).
- https://doi.org/10.7554/eLife.29507.009
-
Figure 3—source data 2
Retrograde DiI+labeling of nociceptors in MrgprdEGFPf mice.
Side (right or left) of injection locations were alternated between animals. Asterisks (**) indicate missing tissue.
- https://doi.org/10.7554/eLife.29507.010
Figure 3—figure supplement 1

Mrgprd+ fiber hairy skin innervation.
(A) Percentage of bushy or free ending type arbors labeled in untreated MrgprdCreERT2; RosaiAP mice by location. n = 132 hairy, 22 glabrous terminals from four animals. (B and C) Sparse labeled free terminal-type arbor in trunk hairy skin. C is a high magnification view of the region boxed in B. (D–H) Whole mount immunostaining of hair follicle innervation in MrgprdEGFPf skin. Mrgprd+ fibers form circumferential-like endings around the necks of all three hair follicle types found in mouse hairy skin: guard (identified by presence of CK8+ Merkel cells and innervation by NF200+ Aβ mechanoreceptors) (D and E), awl/auchenne (identified by innervation by NF200+ fibers but no Merkel cells) (F and G), and zigzag (identified by a lack of both Merkel cells and NF200+ fiber innervation) (H). Mrgprd+ fibers encircle hair follicles close to the skin surface, more superficial than NF200+ Aβ fiber circumferential or lanceolate endings (E and G). Arrowheads, Mrgprd+ circumferential endings. Arrows, NF200+ Aβ fiber circumferential or lanceolate endings. Scale bars = 100 µm (A–C), 20 µm (D–H).
Figure 3—figure supplement 2

Retrograde DiI labeling of MrgprdEGFPf nociceptors.
(A–D). DiI labeled skin areas in plantar hind paw (A) or ventral proximal hind limb (C) skin. DiI+ skin areas (B and D) were identified and quantified based on signal intensity threshold at 10 standard deviations above background fluorescence (representative background shown in dotted line box in A). (E and F) DiI/MrgprdEGFPf double-positive neurons were counted in serial sections. (G) Number of DiI/MrgprdEGFPf double-positive neurons vs. DiI+ skin area (Figure 3—source data 2). Linear regressions: proximal hind limb, R2 = 0.41, plantar hind paw, R2 = 0.57. Scale bars = 500 µm (A–D), 50 µm (E and F).
Figure 4 with 1 supplement
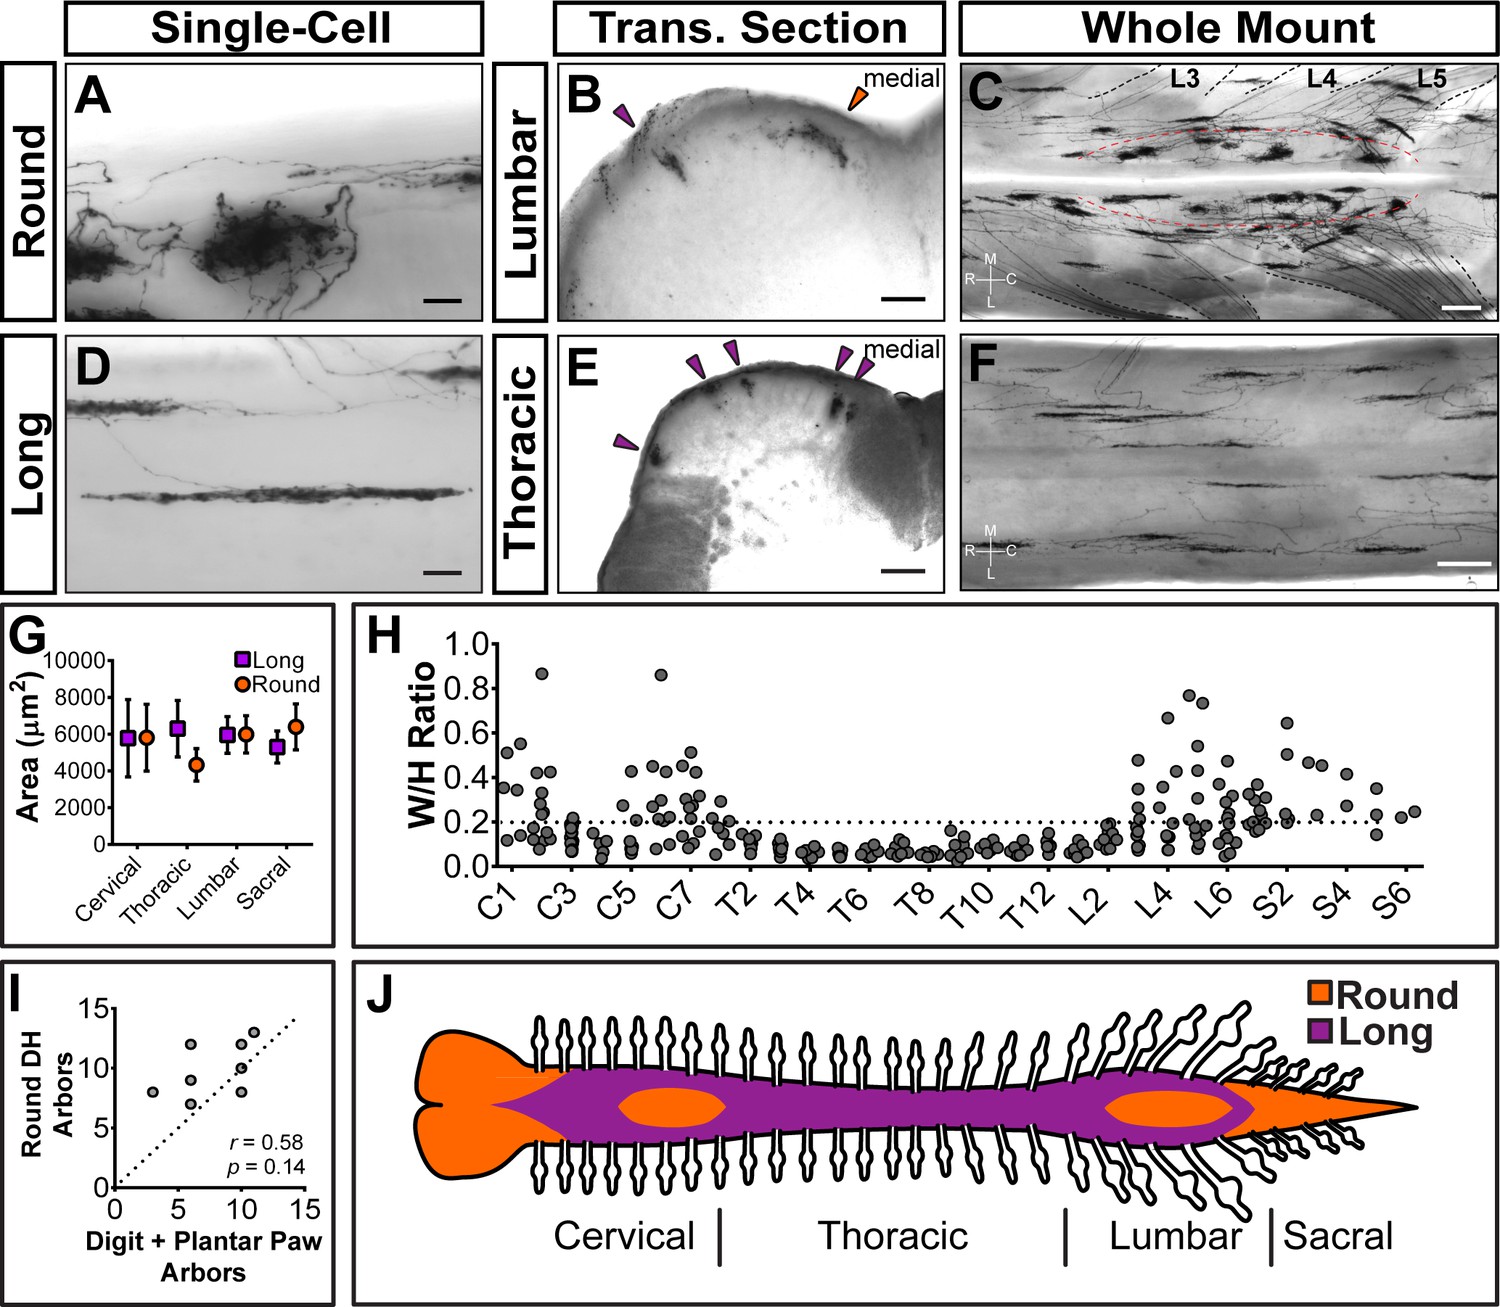
Sparsely labeled MrgprdCreERT2; RosaiAP nociceptors have region-specific central arbor morphologies.
(A–F) Round and long non-peptidergic central arbors seen in top-down whole mount (A, C, D, F) and transverse section (B and E) spinal cords. Round arbors are in the medial lumbar enlargement (B and C) while long arbors are in the lateral lumbar enlargement and thoracic spinal cord (B–F). Dorsal roots are outlined and labeled in C. Red dashed lines outline the round arbor zone. Orange arrowhead marks a round arbor, purple arrowheads mark long arbors. M, medial. L, lateral. R, rostral. C, caudal. (G) Round and long (defined by ratio in H) arbor areas are comparable for all regions. (H) Arbor Width/Height ratios by ganglion of origin. Round terminals: W/H > 0.2. n = 368 arbors from seven animals (I) Comparison of the number of labeled arbors in the hind limb digit and plantar paw skin with the number of ipsilateral round arbors in the dorsal horn. n = 4 animals, dotted line shows 1:1 relationship. r, p values from Spearman’s rank correlation test. (J) Illustration showing the distribution of round (orange zone) and long (purple zone) arbors in the spinal cord. Scale bars = 50 µm (A and B, D and E), 250 µm (C and F).
-
Figure 4—source data 1
Summary of non-peptidergic nociceptor central arbor height and width measurements.
Round and long terminals were defined by W/H ratios (round = W/H ratio >0.2, long = W/H ratio <0.2). Data pooled from seven 3pw animals.
- https://doi.org/10.7554/eLife.29507.014
Figure 4—figure supplement 1
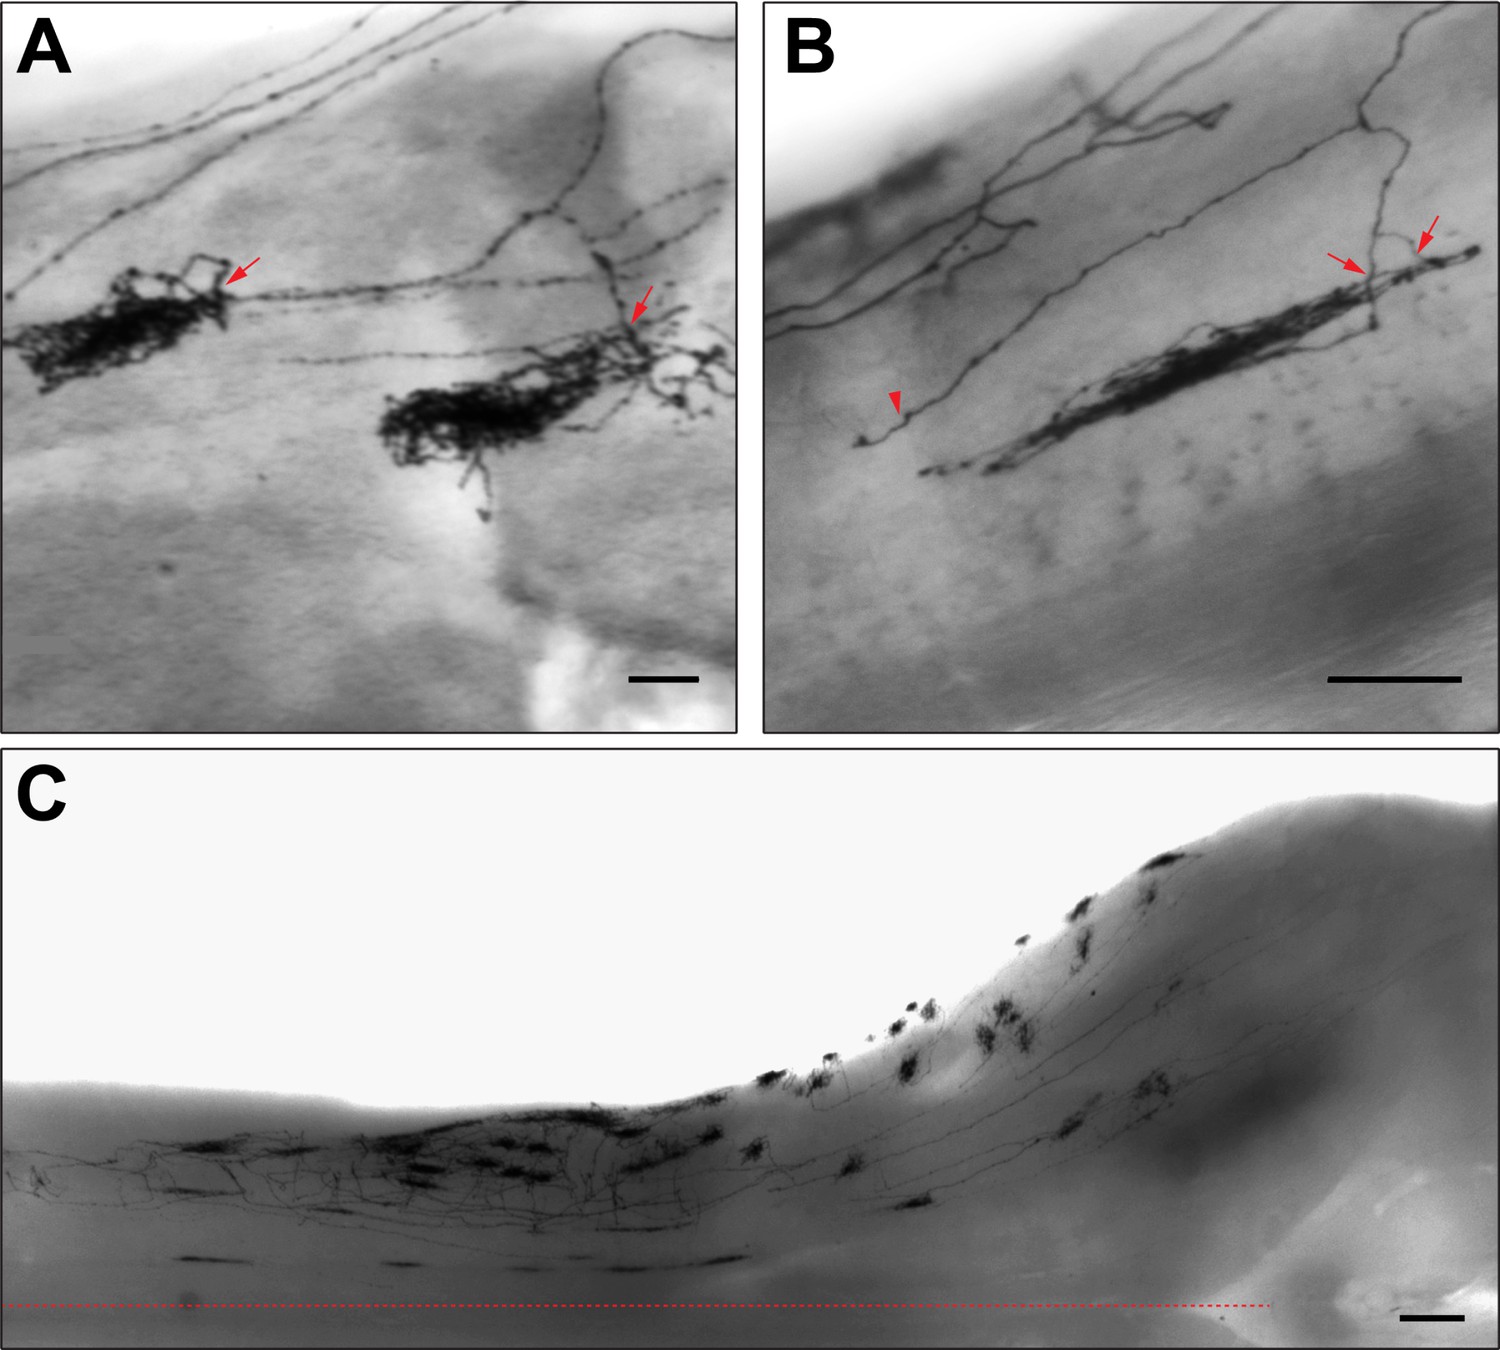
Central arbors of sparsely labeled non-peptidergic neurons in MrgprdCreERT2; RosaiAP mice.
(A and B) Examples of bifurcating non-peptidergic nociceptor central projections from 1pw (0.05 mg tamoxifen at E16.5) (A) and 3pw (B) spinal cords. Bifurcated branches sometimes give rise to independent arbors (arrows in A), join other branches to give rise to a common arbor (arrows in B) or end without elaborating an arbor (arrowhead in B). (C) Round arbors in the upper cervical spinal cord and medulla, many of which descend from the TG non-peptidergic neurons. Scale bars, 50 µm (A and B), 250 µm (C).
Figure 5
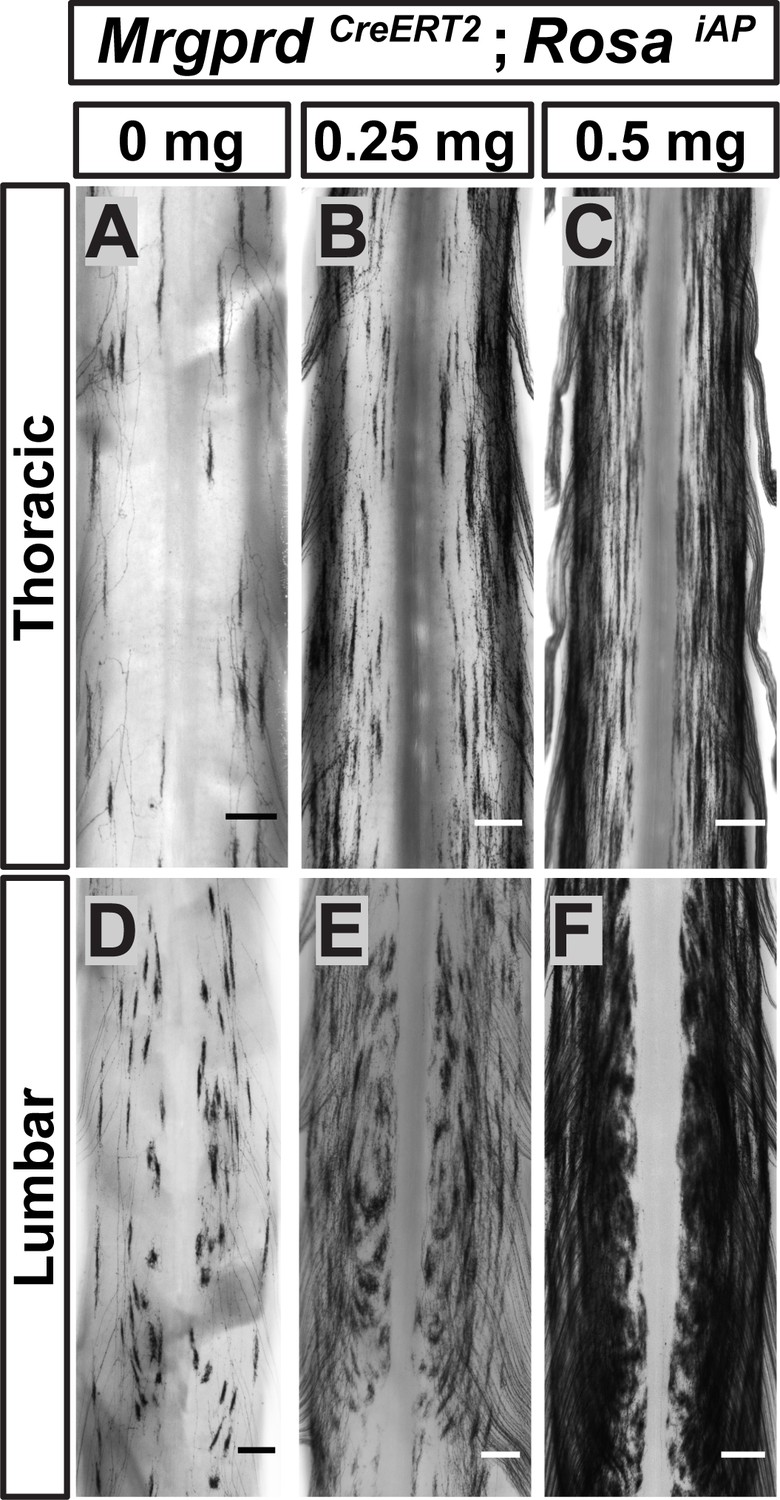
Non-peptidergic nociceptor labeling with increasing densities reveals somatotopic organization of Mrgprd+ central arbors.
(A–F) AP staining of MrgprdCreERT2; RosaiAP thoracic (A–C) and lumbar (D–F) spinal cords that received prenatal 0 mg (A and D), 0.25 mg (B and E) or 0.5 mg (C and F) prenatal tamoxifen. Even with increased labeling densities, round and long arbors occupy exclusive zones of the DH. n = 3 animals per treatment. Scale bars = 250 µm.
Figure 6

Neighboring non-peptidergic nociceptors overlap extensively in the skin and spinal cord.
(A–C) Whole mount immunostaining of MrgprdCreERT2/EGFPf; RosatdTomato (0.5 mg tamoxifen at E16.5) hairy skin with anti-GFP and anti-RFP antibodies. The terminal field of one non-peptidergic nociceptor is labeled with tdT, as outlined in A. B and C show higher magnification views of the regions boxed in A (solid line = B, dotted line = C). Innervation of hair follicles is shown in C. (D) Immunostaining of a section of glabrous skin. (E and F) Immunostaining of medial cervical (D) and thoracic (E) spinal cord sections, showing sparse labeled round terminal and long arbors. Scale bars = 100 µm (A), 20 µm (B–F).
Figure 7 with 1 supplement
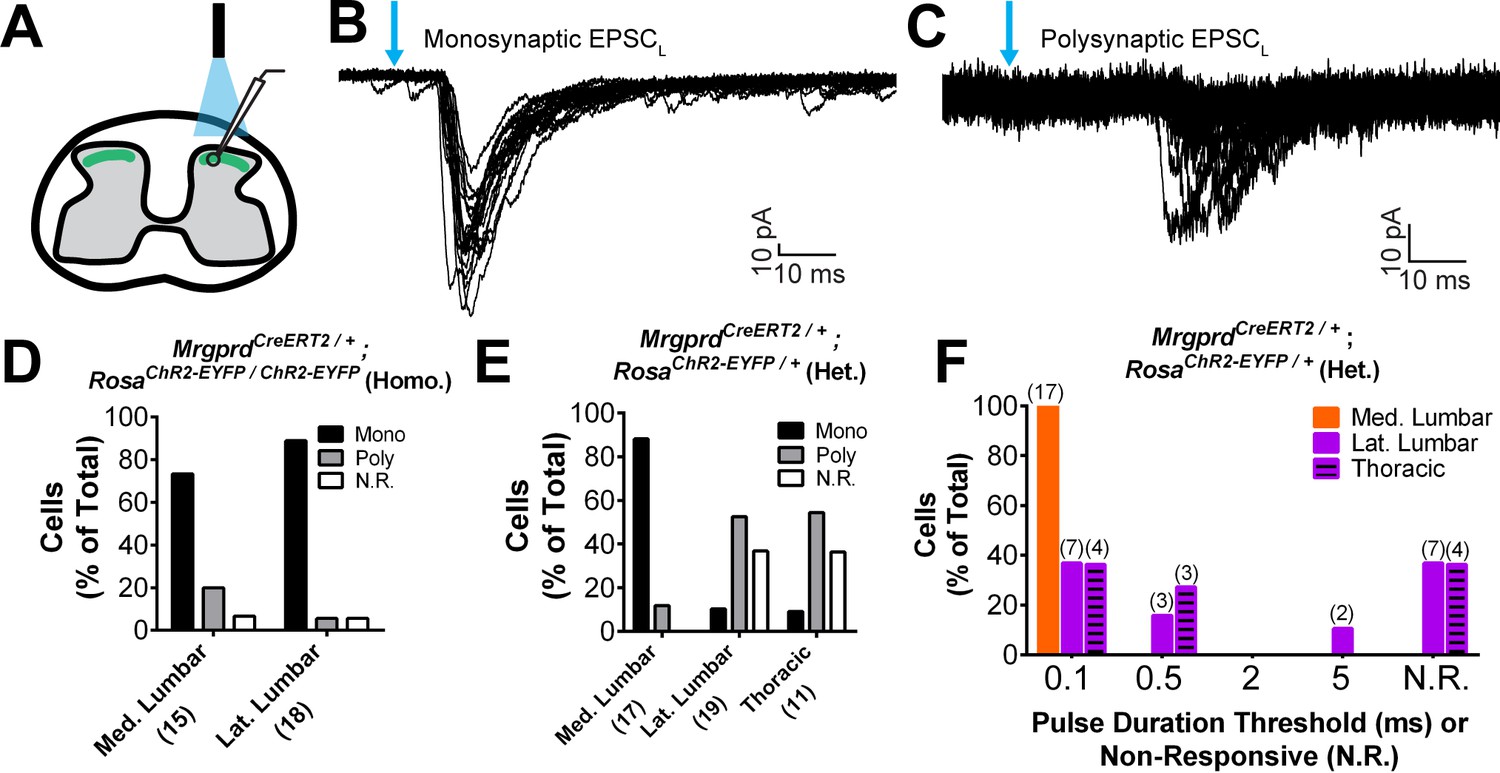
Plantar paw circuits show a heightened signal transmission in the dorsal horn.
(A) Illustration of spinal cord slice recording from MrgprdCreERT2; RosaChR2-EYFP mice (P14-P21 tamoxifen) using optical stimulation. Neuron cell bodies located in the territory innervated by EYFP+ fibers were chosen for recording. (B and C) Monosynaptic (B) and polysynaptic (C) light-induced EPSC (EPSCL) traces recorded from layer II neurons during 0.2 Hz light stimulation (overlay of 20 traces). Light pulses indicated by blue arrows, scale bars shown in lower right. (D) In MrgprdCreERT2 / +; RosaChR2-EYFP/ChR2-EYFP homozygous slices, similar incidences of light-responsive neurons were found in medial and lateral lumbar regions. (E) In MrgprdCreERT2 / +; RosaChR2-EYFP/+ heterozygous slices, a much higher incidence of light-responsive neurons was seen in medial lumbar compared to lateral lumbar or medial thoracic circuits. (F) Frequency distribution of threshold light pulse durations required for eliciting EPSCLs among cells in E. Among responsive cells, postsynaptic neurons in lateral lumbar and thoracic regions require longer pulse durations to be activated compared to those in medial lumbar region. Cell (n) numbers indicated in parentheses in x-axis labels in D and E and above bars in F.
-
Figure 7—source data 1
Summary of incidences of light-induced excitatory postsynaptic current (EPSCL) responses recorded from layer II neurons in MrgprdCreERT2; RosaChR2-EYFP homozygous and heterozygous mice.
Patch clamp recordings were taken from either transverse or sagittal DH slices, as indicated. Responses were classified as mono- or polysynaptic (see text). Shaded boxes show the response of the majority (>50%) of recorded cells.
- https://doi.org/10.7554/eLife.29507.019
Figure 7—figure supplement 1

RosaChR2-EYFP expression levels.
(A and B). Native (no immunostaining) ChR2-EYFP fluorescence of MrgprdCreERT2; RosaChR2-EYFP (P10-P17 tamoxifen) DRG sections. (C) T10-T12 and L4-L5 DRG cell body fluorescence frequency distributions overlap, indicating no regional change in ChR2-EYFP expression level. n = 814 T10-T12 neurons from 3 animals, 853 L4-L5 neurons from 3 animals. Scale bars = 100 µm. (D) Western blot of DRG lysates from one negative control mouse (CD1 wildtype, NC), 3 MrgprdCreERT2; RosaChR2-EYFP/ChR2-EYFP mice (ChR2/ChR2, 1–3), and 3 MrgprdCreERT2; RosaChR2-EYFP/+ (ChR2/+, 4–6) mice with anti-GFP antibody (against ChR2-EYFP) and anti-NF200 as a loading control. (E) Quantification of ChR2-EYFP band intensity (normalized to upper NF200 loading control band) shows that ChR2 heterozygous DRGs show a ~ 40% reduction in ChR2-EYFP expression compared to homozygotes. p=0.09 (Student’s t-test).
Figure 8 with 1 supplement
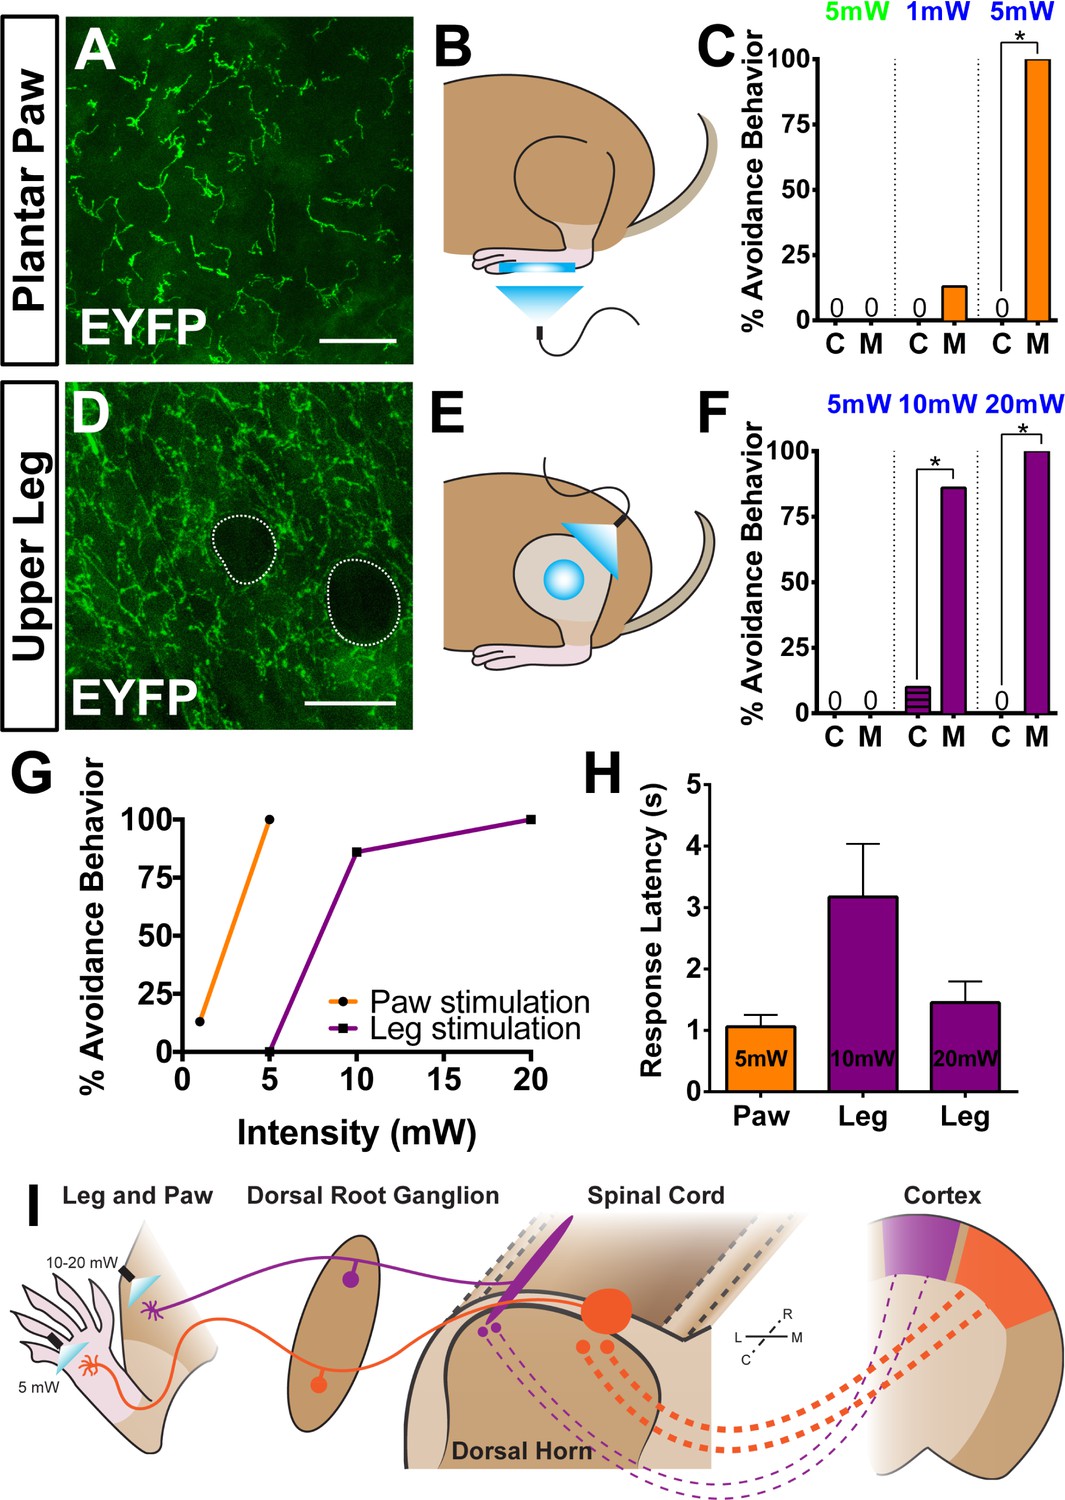
Peripheral optogenetic activation of Mrgprd+ nociceptors reveals regional differences in optical threshold required to elicit withdrawal responses.
(A–C) Optical stimulation in the paw. (A) Representative whole-mount immunostaining of plantar paw skin in MrgprdCreERT2 / +; RosaChR2-EYFP/ChR2-EYFP mice, n = 3 mice. (B) Schematic of light placement on paw skin, see videos. (C) Histogram showing percentage of mice displaying aversive responses to 5 mW green light and 1 or 5 mW blue light to littermate control (C) and MrgprdCreERT2 / +; RosaChR2-EYFP/ChR2-EYFP(M). n = 6–10 for each genotype with 1–2 trials per mouse. *p<0.001 Chi-square test. (D–F) Optical stimulation in the leg. (D) Representative whole-mount immunostaining of upper leg skin in MrgprdCreERT2 / +; RosaChR2-EYFP/ChR2-EYFP mice, n = 3 mice. Dotted lines outline hair follicles. (E) Schematic of light placement on hair-shaven leg skin, see videos. (F) Histogram showing percentage of mice displaying aversive responses to 5, 10, or 20 mW blue light at the leg (see above panel C for genotype description and statistical analyses). (G) A lower activation threshold is required for paw versus leg skin nociceptors. (H) Temporal delay time (seconds) from light onset to the first aversive behavior with 5, 10, or 20 mW blue light in paw or leg of MrgprdCreERT2 / +; RosaChR2-EYFP/ChR2-EYFP mice. Error bars represent SEM. (I) Model showing somatotopic organization of mammalian nociceptive circuitry. Distinct central arbor morphologies (‘round versus long’) of Mrgprd+ non-peptidergic nociceptors are observed in the medial versus lateral dorsal spinal cord, which correlates well with regional peripheral sensitivity and cortical representation. Scale bars = 50 µm.
Figure 8—figure supplement 1

In vivo optogenetic peripheral stimulation.
(A and B) MrgprdCreERT2; RosaChR2-EYFP sectioned upper leg hairy skin (B) and plantar paw glabrous skin. (A) shows the lower density and farther distance from the skin surface of plantar paw neurites. Dotted lines indicate dermis/epidermis junction and outer skin surface. (C and D) Quantification of neurites per 100 μm (C) and neurite distance below the skin surface. n = 3 animals, *p<0.05 (Student’s t-test)(D). (E) Measured light power at three locations (closest side, midpoint, farthest side) in the behavior chamber with 5 mW, 10 mW, and 20 mW blue laser intensity. (F) Response rate (% of mice) showing withdrawal responses to 5 mW blue light stimulation at paw or upper leg. n = 6–10 mice, 1–2 trials per mouse. *p<0.05, Chi-square test. Scale bars = 50 μm (A and B).
Videos
Video 1
High speed video recording of green laser light (5 mW) plantar paw stimulation of Control (RosaChR2-EYFP) mice.
Green light does not induce an avoidance response.
Video 2
High speed video recording of green laser light (5 mW) plantar paw stimulation of MrgprdCreERT2; RosaChR2-EYFP mice.
Green light does not induce an avoidance response.
Video 3
High speed video recording of blue laser light (5 mW) plantar paw stimulation of Control mice.
Blue light does not induce an avoidance response in Control mice.
Video 4
High speed video recording of blue laser light (5 mW) plantar paw stimulation of MrgprdCreERT2; RosaChR2-EYFP mice.
5 mW blue laser light triggers robust avoidance responses, including paw withdrawal and shaking, when applied to the paw of MrgprdCreERT2; RosaChR2-EYFP mice.
Video 5
High speed video recording of blue laser light (5 mW) shaved upper leg stimulation of Control mice.
No avoidance response is seen.
Video 6
High speed video recording of blue laser light (5 mW) upper leg stimulation of MrgprdCreERT2; RosaChR2-EYFP mice.
5 mW blue laser light is insufficient to trigger avoidance responses when applied to the shaved upper leg of MrgprdCreERT2; RosaChR2-EYFP mice.
Video 7
High speed video recording of blue laser light (20 mW) upper leg stimulation of Control mice.
No avoidance response is seen, indicating that 20 mW laser light stimulation is not by itself aversive.
Video 8
High speed video recording of blue laser light (20 mW) upper leg stimulation of MrgprdCreERT2; RosaChR2-EYFP mice.
20 mW laser light induces robust avoidance behavior, including limb withdrawal and licking, when applied to the shaved upper leg of MrgprdCreERT2; RosaChR2-EYFP mice.
Tables
Table 1
Summary of central innervation patterns of sparsely labeled Mrgprd+ non peptidergic nociceptors.
Data pooled from three 3pw animals.
| N | % of Total | |
|---|---|---|
| Total neurons | 234 | |
| Segments traveled from point of entry | ||
| 0 | 170 | 72.6 |
| 1 | 54 | 23.1 |
| 2 | 9 | 3.8 |
| 3 | 1 | 0.4 |
| Direction traveled (for axons traveling 1–3 segments) | ||
| Caudal | 46 | 19.7 |
| Rostral | 18 | 7.7 |
| No central branch bifurcations | 154 | 65.8 |
| 1 central branch bifurcation | 72 | 30.8 |
| >1 central branch bifurcation | 8 | 3.4 |
| No central terminals | 1 | 0.4 |
| 1 central terminals | 215 | 91.9 |
| 2 central terminals | 16 | 6.8 |
| 3 central terminals | 2 | 0.9 |
Additional files
-
Transparent reporting form
- https://doi.org/10.7554/eLife.29507.030
Download links
A two-part list of links to download the article, or parts of the article, in various formats.
Downloads (link to download the article as PDF)
Open citations (links to open the citations from this article in various online reference manager services)
Cite this article (links to download the citations from this article in formats compatible with various reference manager tools)
Sparse genetic tracing reveals regionally specific functional organization of mammalian nociceptors
eLife 6:e29507.
https://doi.org/10.7554/eLife.29507


