The diversity of floral temperature patterns, and their use by pollinators
- University of Bristol, United Kingdom
- University of Exeter, United Kingdom
Figures
Figure 1 with 1 supplement
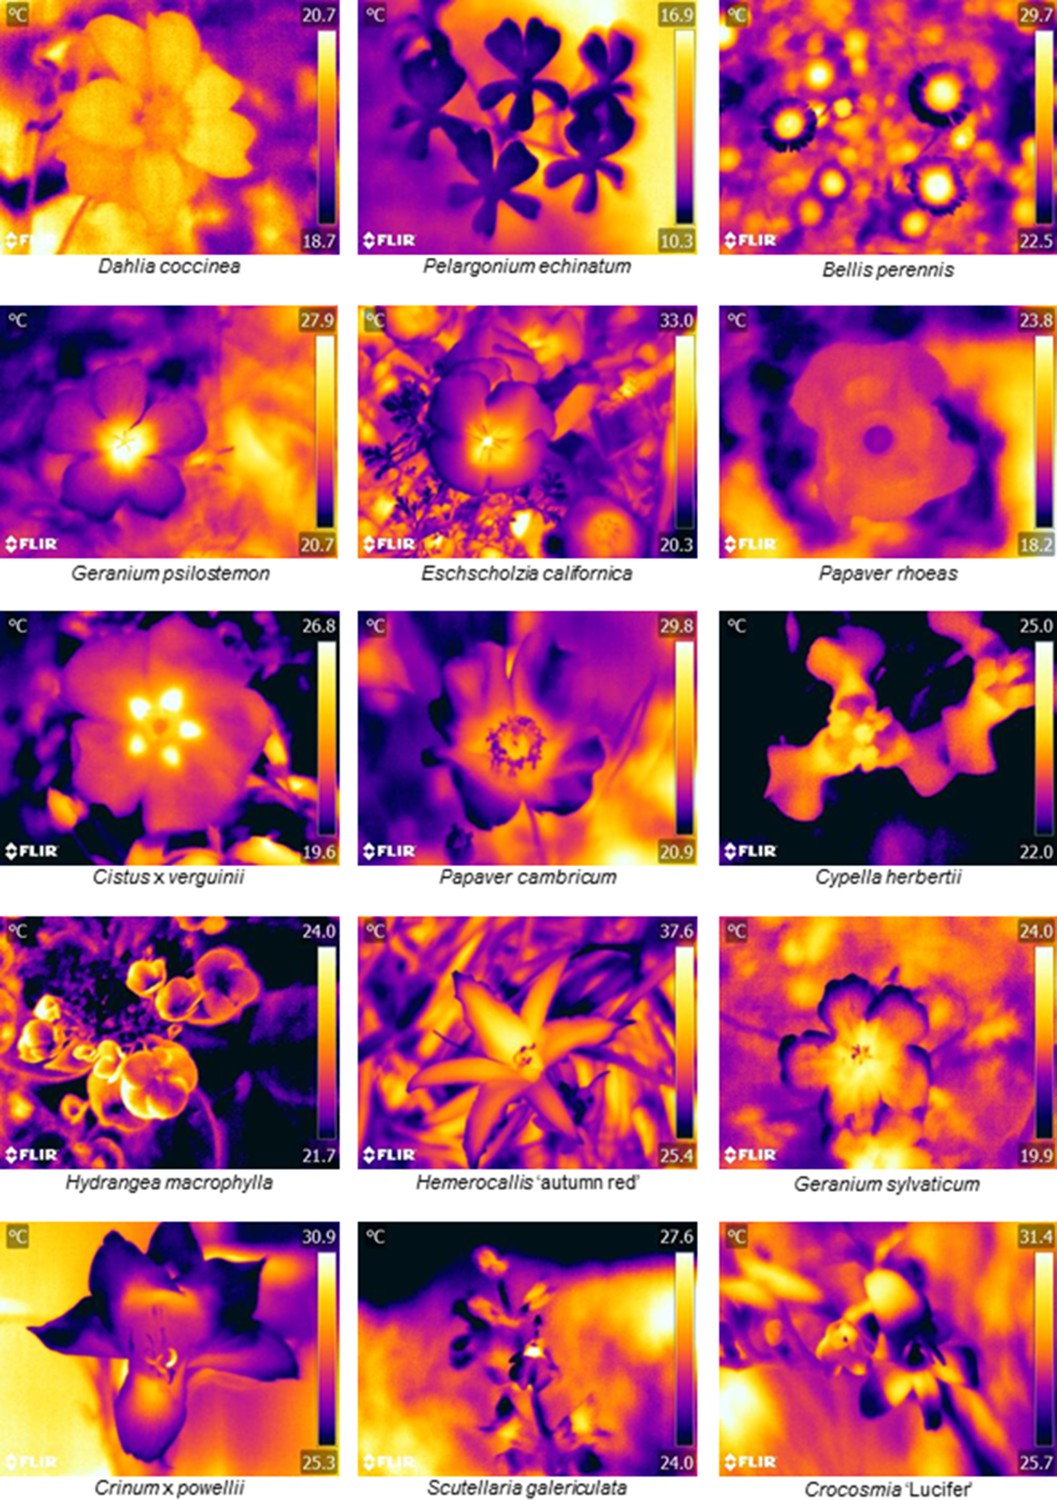
Floral thermographs demonstrating the range of floral temperature patterns observed.
Floral thermographs demonstrating the range of floral temperature patterns observed. Colour indicates temperature in °C as indicated on the scale bar to the right of each panel. The flower species is labelled below each thermograph. Human colour images corresponding to each thermograph are available in Figure 1—figure supplement 1. Supplementary file 1 summarises the temperature differences measured across all 118 species observed, and thermographs of each species can be found in Supplementary Data available at https://doi.org/10.5061/dryad.qp244 (Harrap et al., 2017).
Figure 1—figure supplement 1
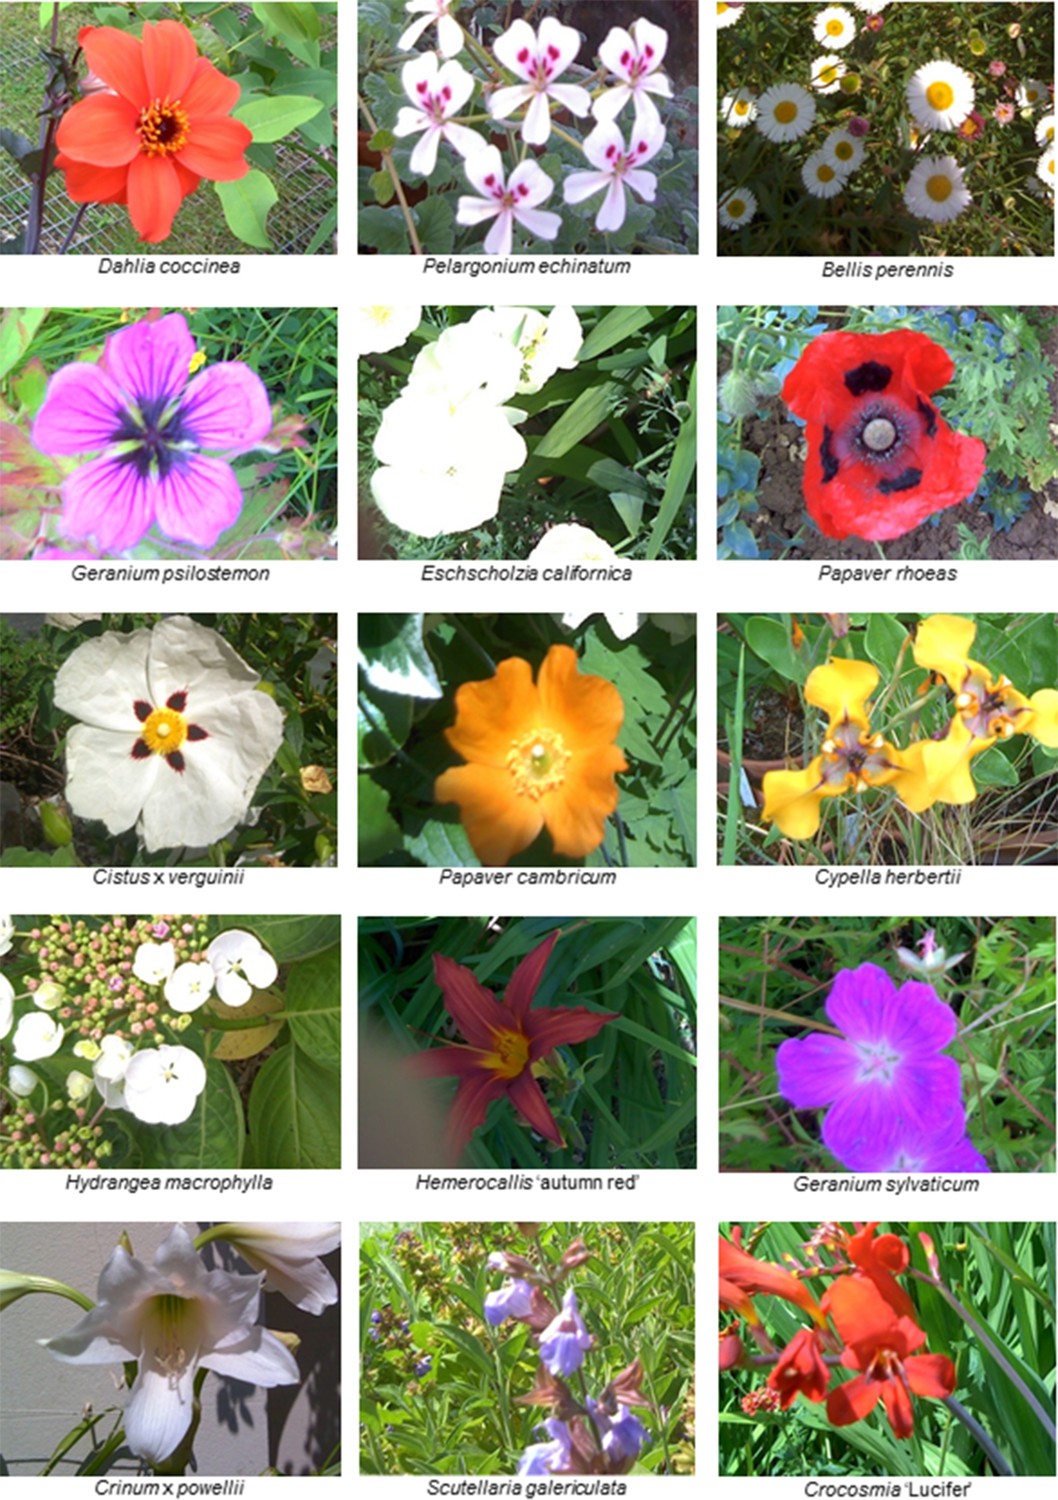
Human colour images of each flower species shown in Figure 1.
Species names are at the bottom of each photograph. Note, when using the FLIR E60bx IR camera, the twinned digital and thermal images are taken at slightly different angles and magnification, so images do not match perfectly.
Figure 2 with 1 supplement
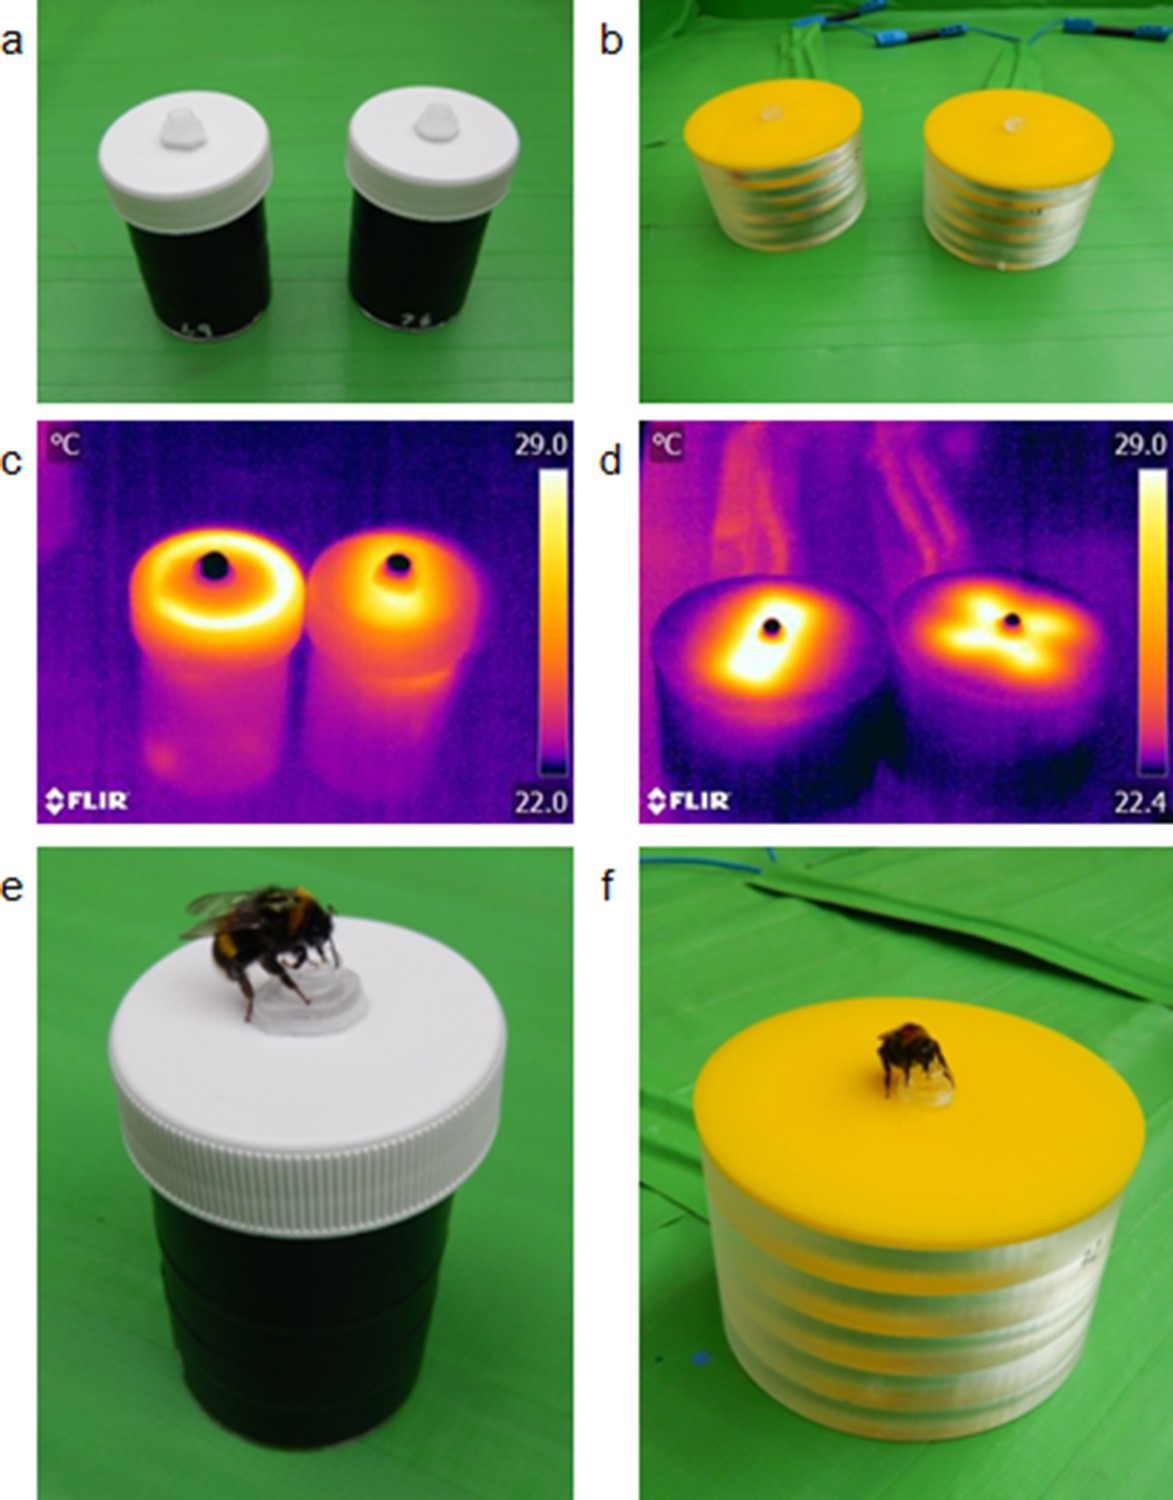
The artificial flowers used in the bumblebee learning experiments.
Panels a and b: how both variants of artificial flowers used in the small (a) and large (a) artificial flower experiments appear. Panels c and d: thermographs of both artificial flower variants in in the small (c) and large (d) flower experiments, demonstrating how artificial flowers within each experiment differ in temperature patterns but not visually. Panels e and f: bumblebees feeding from the small (e) and large (f) artificial flowers.
Figure 2—figure supplement 1
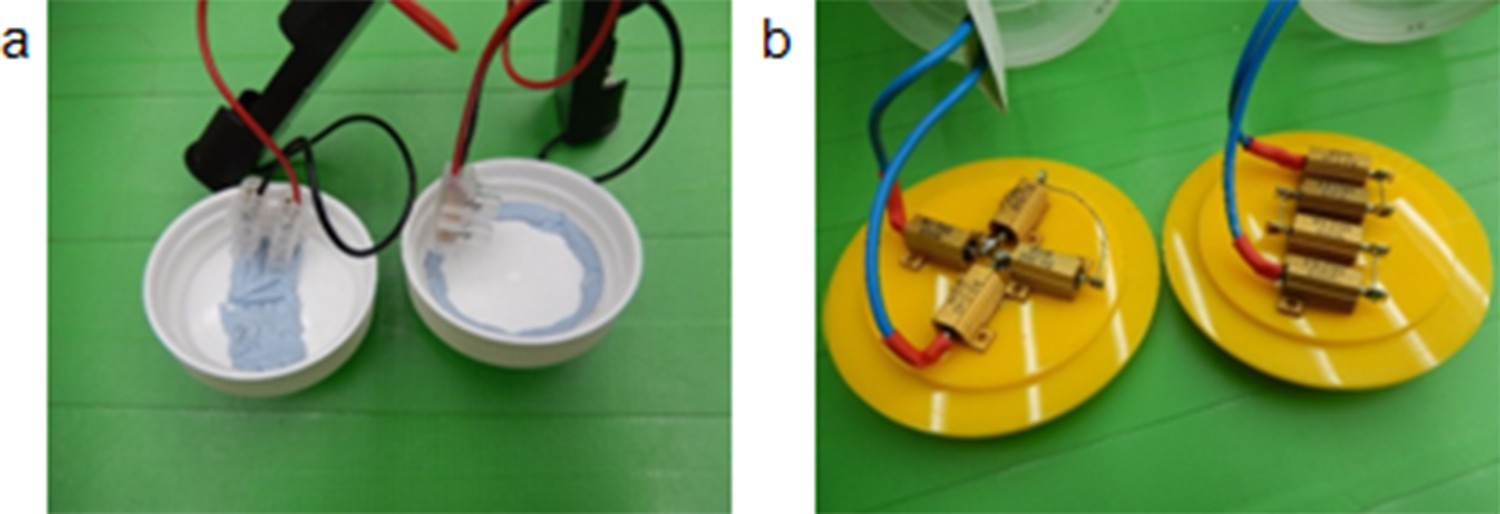
The heating elements stuck to the underside of the small (panel a) and large (panel b) artificial temperature flowers used in the conditioning experiments.
When current is applied to these heating elements, the areas above them heat up, as shown in Figure 2.
Figure 3
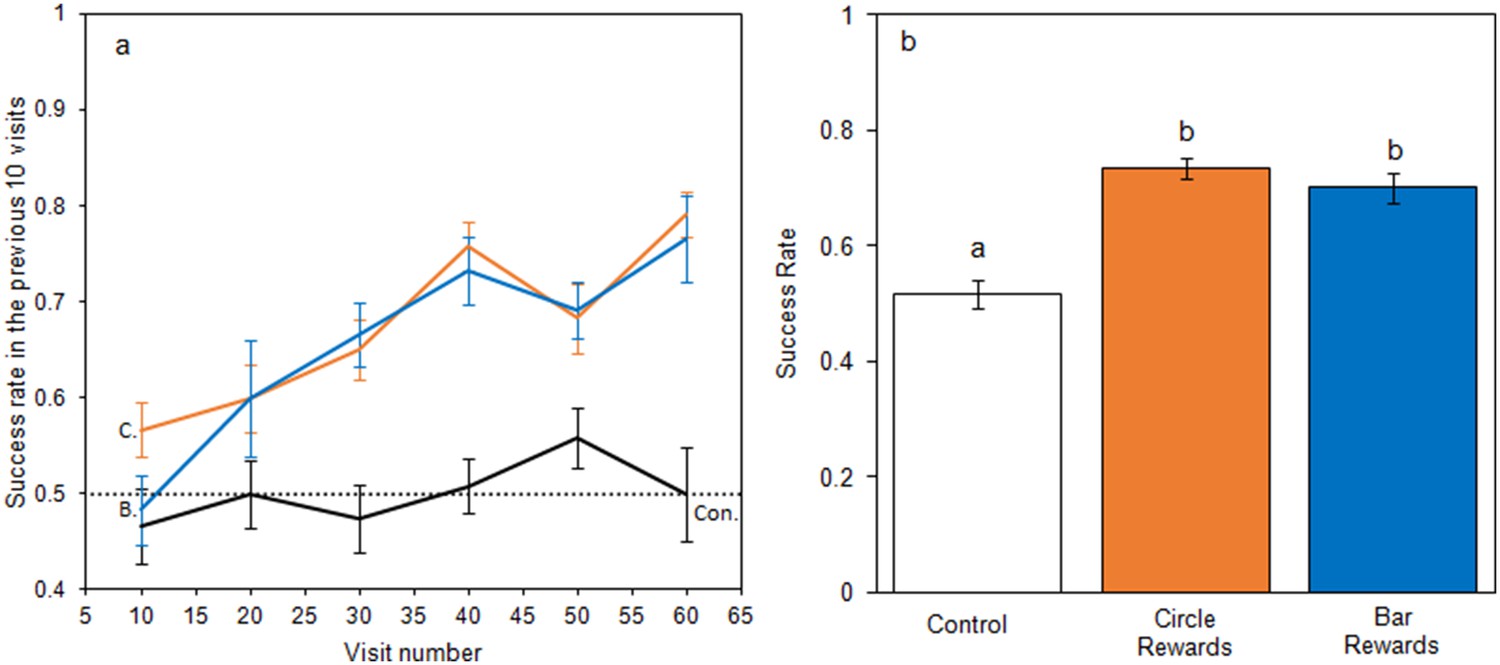
Bumblebee learning within our small artificial flower experiment.
Panel a: the relationship between bees’ foraging success and experience of the small artificial flowers (flower visits made) during the learning phase. The dotted line indicates the 50% success level. Solid lines indicate the mean foraging success of bees in the previous 10 visits. Error bars represent ± SEM. Colour and label of solid lines and error bars correspond with test group: black, the control group, labelled ‘Con.”; orange, Circle rewards group, labelled ‘C.”; blue, Bar reward group labelled ‘B.”. Panel b shows mean foraging success ± SEM of bees in different test groups during the nonrewarding test phase. Letters above bars denote groups as defined by post hoc Tukey’s tests where p < 0.05. 12 bees completed this experiment in each test group (36 bees in total from four different nests).
Figure 4
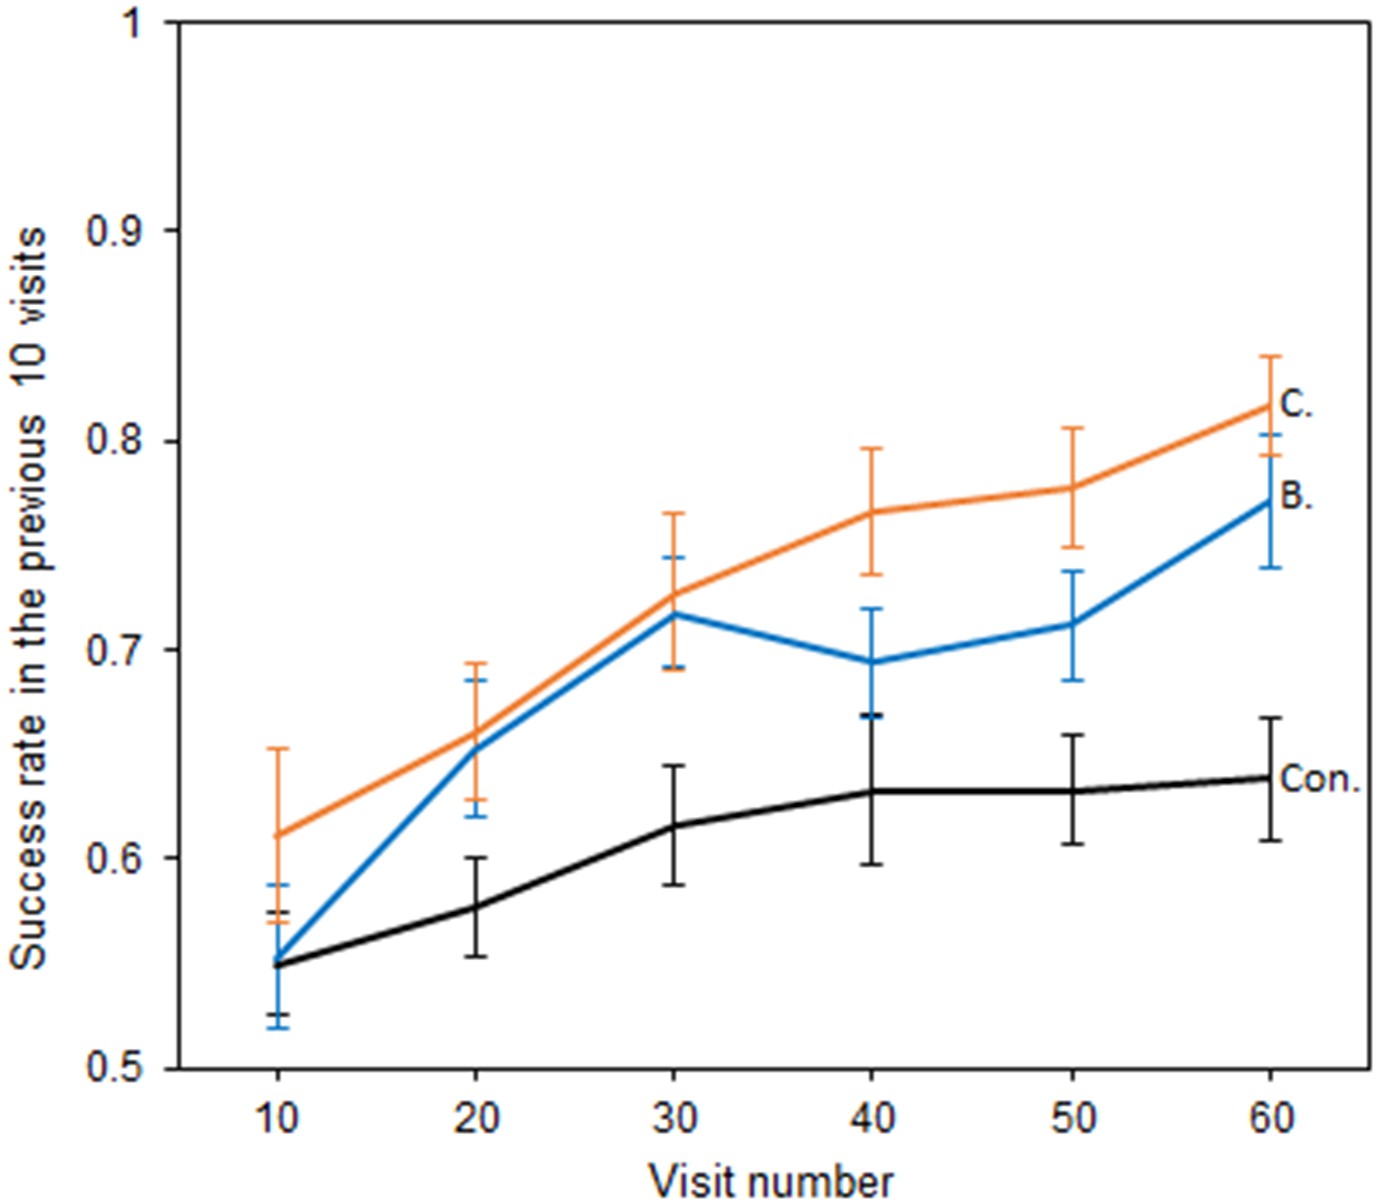
The relationship between bumblebees’ foraging success and experience of the large artificial flowers (flower visits).
Solid lines indicate the mean foraging success of bees in the previous 10 visits. Error bars represent ±SEM. Colour and label of solid lines and bars correspond with test group: black, the Control group, labelled ‘Con.”; orange, Cross rewards group (rewarding cross pattern), labelled ‘C.”; blue, Bar reward group (rewarding bar pattern), labelled ‘B.”. 18 bees completed this experiment in the control and Cross rewards group and 17 bees in the Bar rewards group (53 bees in total from seven different nests).
Additional files
-
Supplementary file 1
A summary of the temperature patterns observed on each of the 118 species thermographed, and the additional 18 cultivars and subspecies.
Species are ordered taxonomically. The temperature at the hottest and coldest region of the flower and the difference in temperature between these points is also given. Plants derived from the same species where counted together for occurrence or average temperature difference calculations. Plants not used in the calculations are marked with a ‘*’ next to their Δ temp. value.
- https://doi.org/10.7554/eLife.31262.009
-
Supplementary file 2
Hourly weather data is provided for each hour thermographs were collected.
All weather data was obtained from the nearest Met Office weather station: for Bristol survey days, Filton weather station (51°31'15.6"N 2°34'33.6"W); for Botanic Garden of Wales survey days, Aberporth weather station (52°07'48.0"N 4°32'20.4"W).
- https://doi.org/10.7554/eLife.31262.010
-
Supplementary file 3
Daily weather data for days where sampling took place.
All weather data was obtained from the nearest Met Office weather station: for Bristol survey days, Filton weather station; for Garden of Wales survey days Saron weather station (52°01'N 4°37'W) for daily temperature and rainfall data, Aberporth weather station for all other data.
- https://doi.org/10.7554/eLife.31262.011
-
Transparent reporting form
- https://doi.org/10.7554/eLife.31262.012
Download links
A two-part list of links to download the article, or parts of the article, in various formats.
Downloads (link to download the article as PDF)
Open citations (links to open the citations from this article in various online reference manager services)
Cite this article (links to download the citations from this article in formats compatible with various reference manager tools)
The diversity of floral temperature patterns, and their use by pollinators
eLife 6:e31262.
https://doi.org/10.7554/eLife.31262


