Embryonic and postnatal neurogenesis produce functionally distinct subclasses of dopaminergic neuron
- Institute of Psychiatry, Psychology and Neuroscience, King’s College London, United Kingdom
- Harvard University, United States
Figures
Figure 1
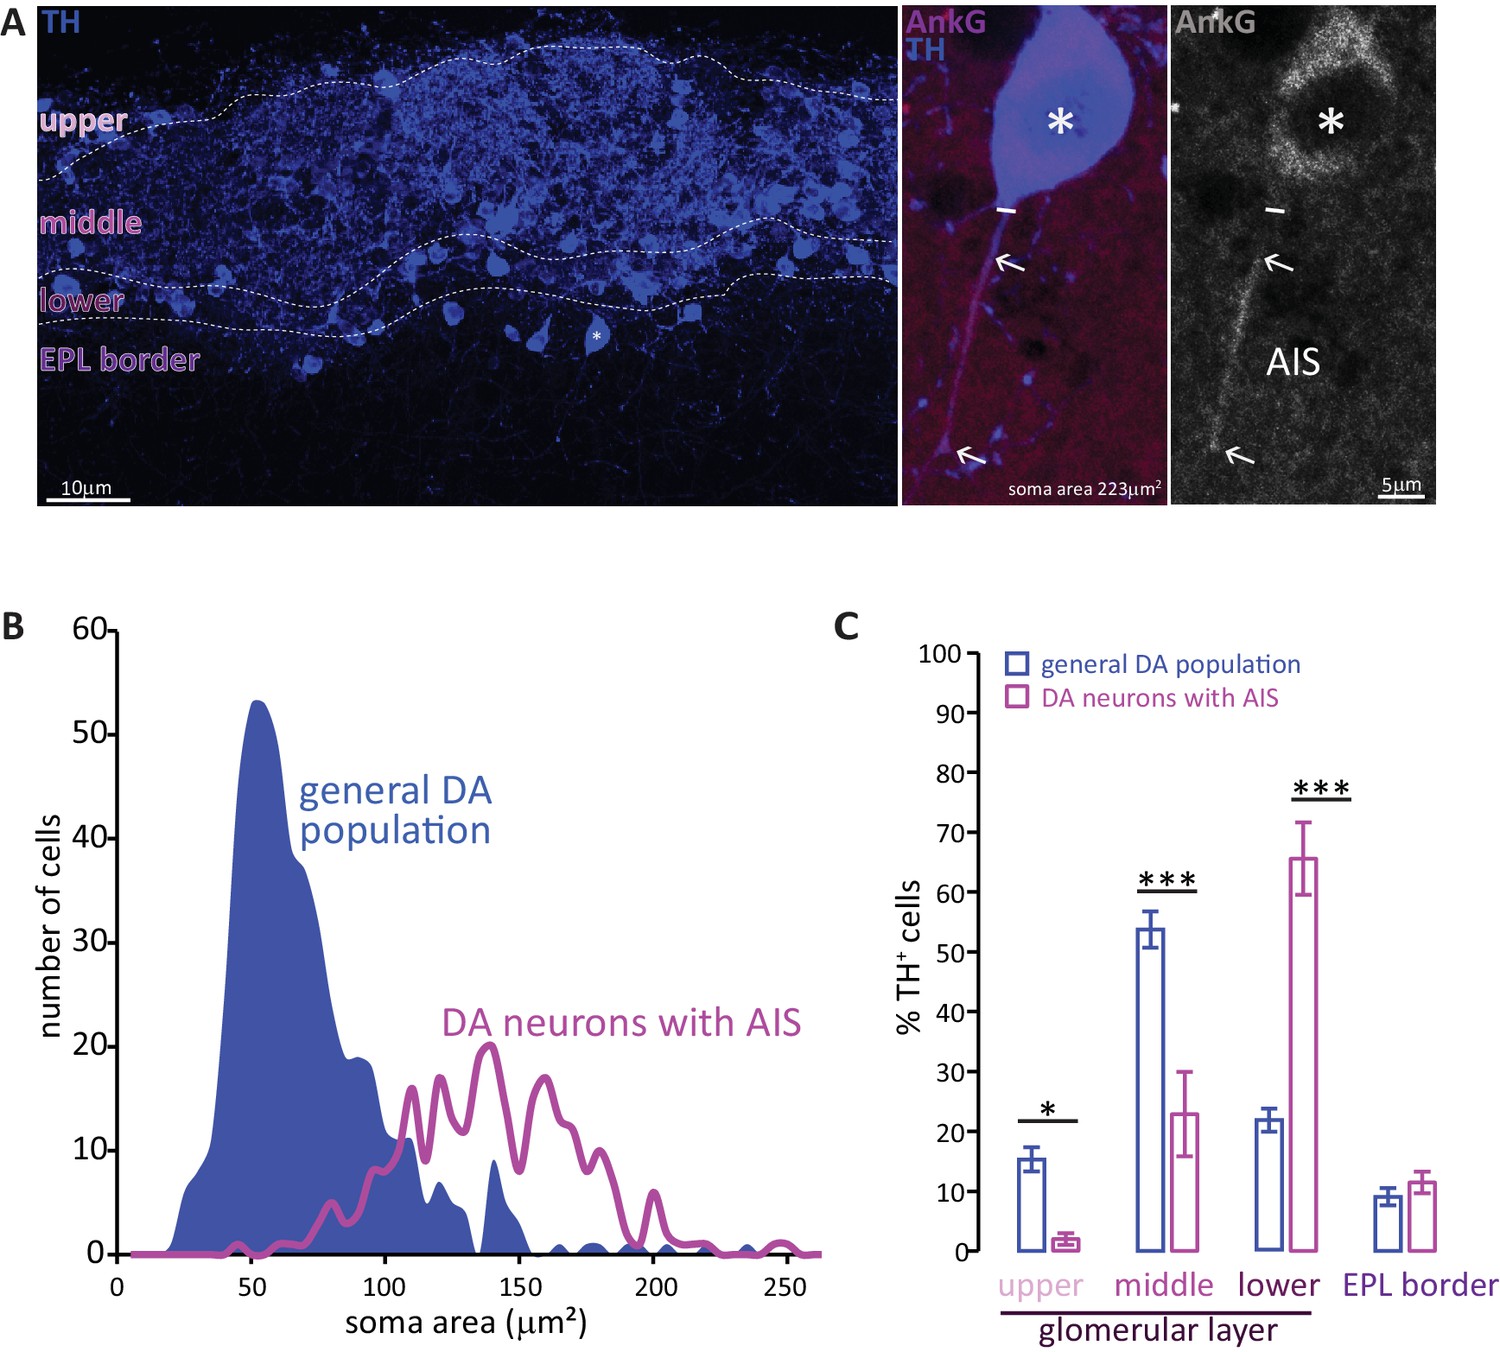
Two subtypes of DA neuron can be characterised based on size, location and presence of an AIS.
(A) Left: example image of olfactory bulb stained with an anti-TH antibody (blue). Dashed lines indicate subregions of the glomerular layer (GL). The asterisk indicates an AIS-positive DA cell. Middle, right: zoomed image of the asterisked cell from the left panel, co-stained for TH (blue) and the AIS marker ankyrin-G (AnkG, magenta or greyscale). The solid line indicates the emergence of the axonal process from the soma; arrows indicate AIS start and end positions. (B) Frequency plots showing soma area of the general DA population (blue, filled area, n = 519, N = 3), and of the subset of DA neurons that possesses an AIS (magenta line, n = 271, N = 6). (C) Locations in the GL for both the general DA population (blue, mean ± sem; n = 888, N = 6) and AIS-positive DA neurons (magenta, mean ± sem; n = 127, N = 6). Post-hoc Sidak’s test following two-way repeated measures ANOVA; *p<0.05; ***p<0.001.
Figure 2
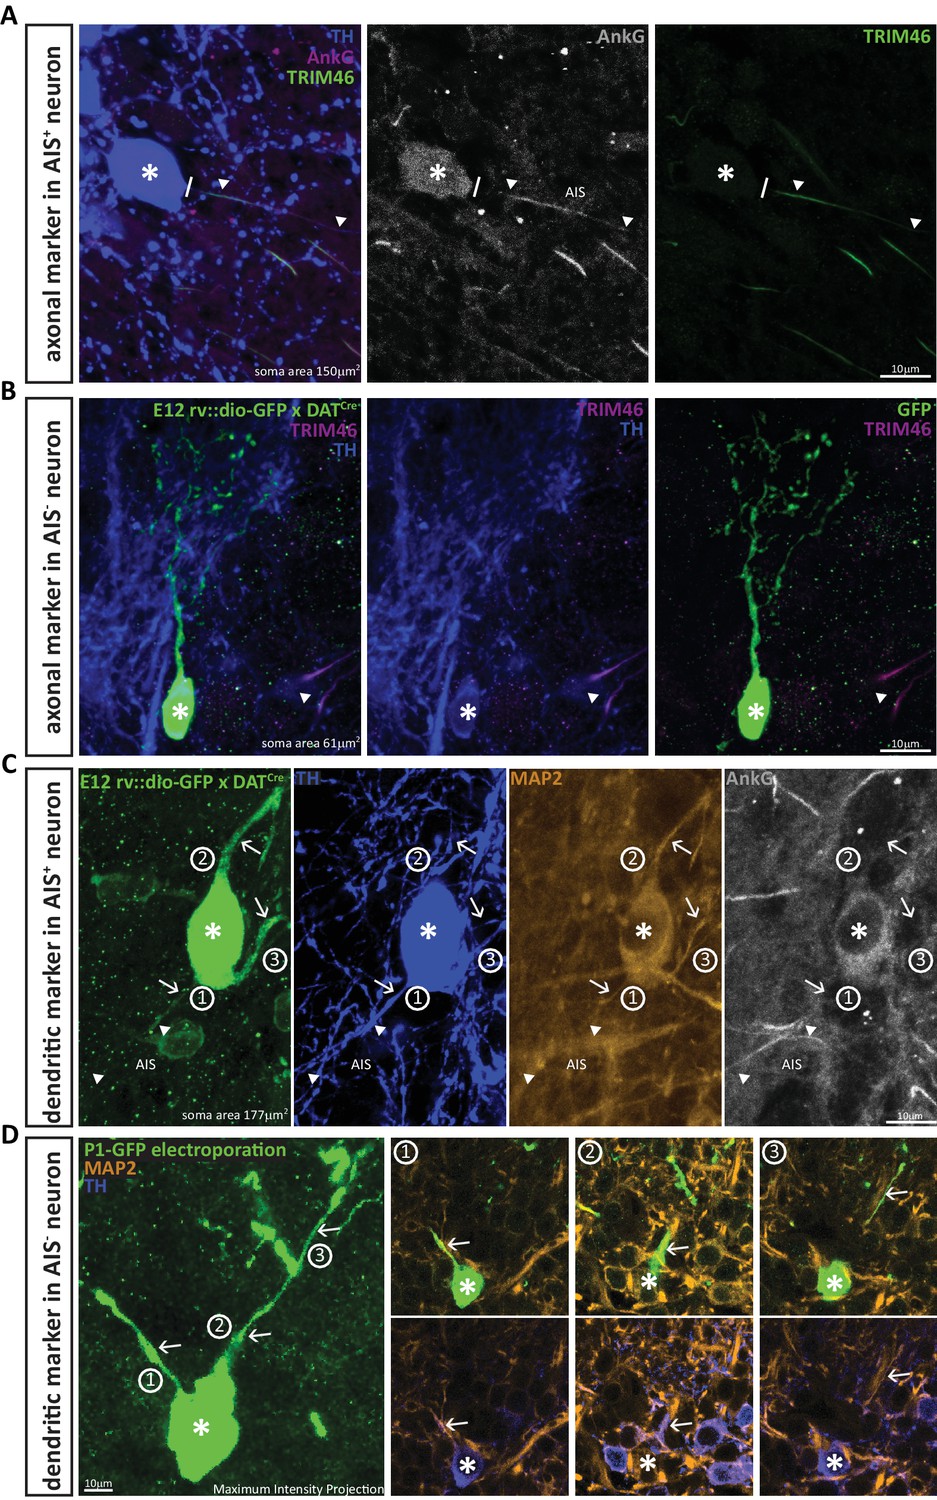
DA neurons that lack an AIS also lack the axonal marker TRIM-46, and all their processes co-stain with the dendritic marker MAP-2.
(A) Example image of a DA cell in a wild-type mouse stained for TH (blue), AnkG (magenta) and the axonal marker TRIM-46 (green). Asterisks indicate soma position; lines indicate the emergence of the axonal process from the soma; triangles indicate AIS start and end positions. (B) Example image of an anaxonic DA cell in a DAT-Cre mouse injected at E12 with rv::dio-GFP, stained for TH (blue) and TRIM-46 (magenta). Asterisks indicate soma position; triangle shows a TRIM-46- and TH-positive process belonging to a neighbouring, non-GFP-expressing cell. (C) Example image of an AIS-containing DA cell in a DAT-Cre mouse injected at E12 with rv::dio-GFP, stained for TH (blue), MAP-2 (orange) and AnkG (grey). Asterisks indicate soma position; triangles indicate AIS start and end positions; numbers and arrows indicate the three main processes emerging from the soma. Note that MAP-2 fluorescence in the axon (process 1) ends when AnkG fluorescence begins. (D) Left: Maximum intensity projection image of an anaxonic DA cell in a wild-type mouse electroporated with GFP at P1, stained for TH (blue) and MAP-2 (orange). The asterisks indicates soma position; numbers and arrows indicate the three main processes emerging from the soma. Right: panels 1–3 show single z-plane images of each dendritic process, visualised with GFP plus MAP-2 label (top) or TH plus MAP-2 label (bottom). Note that all processes are positive for all three markers.
Figure 3

AIS-positive DA cells have more widely ramified dendritic morphology.
(A) Schematic representation of the experimental strategy adopted to achieve sparse labelling of DA cells: P1-2 neonates or E12 embryos from VGAT-Cre or DAT-Cre lines were injected with floxed AAV-YFP or rv:: dio-GFP viruses. Tissue was collected for analysis at P28. (B–C) Example images of OB DA cells sparsely labelled with GFP (green), co-stained for TH (blue). GL, glomerular layer; EPL, external plexiform layer. AIS-negative DA cells ramify their dendrites narrowly. (D) Example image of a GFP-labelled, AIS-positive DA cell which ramifies more broadly, co-stained for TH (blue) and AnkG (magenta). Right: zoomed insets showing GFP, TH and/or AnkG label; line indicates axon start; triangles show AIS start and end positions. (E) Sholl plots of branching patterns for reconstructed DA neurons without (black, n = 14) and with (magenta, n = 9) an AIS. Data points are mean ± SEM; effect of cell type in mixed model ANOVA; *p<0.05; for further quantifications see Table 1. (F) Morphological reconstructions of 23 sufficiently sparsely-labelled DA neurons without (top) and with (bottom) an AIS. Approximate AIS location is indicated with a magenta square.
Figure 4
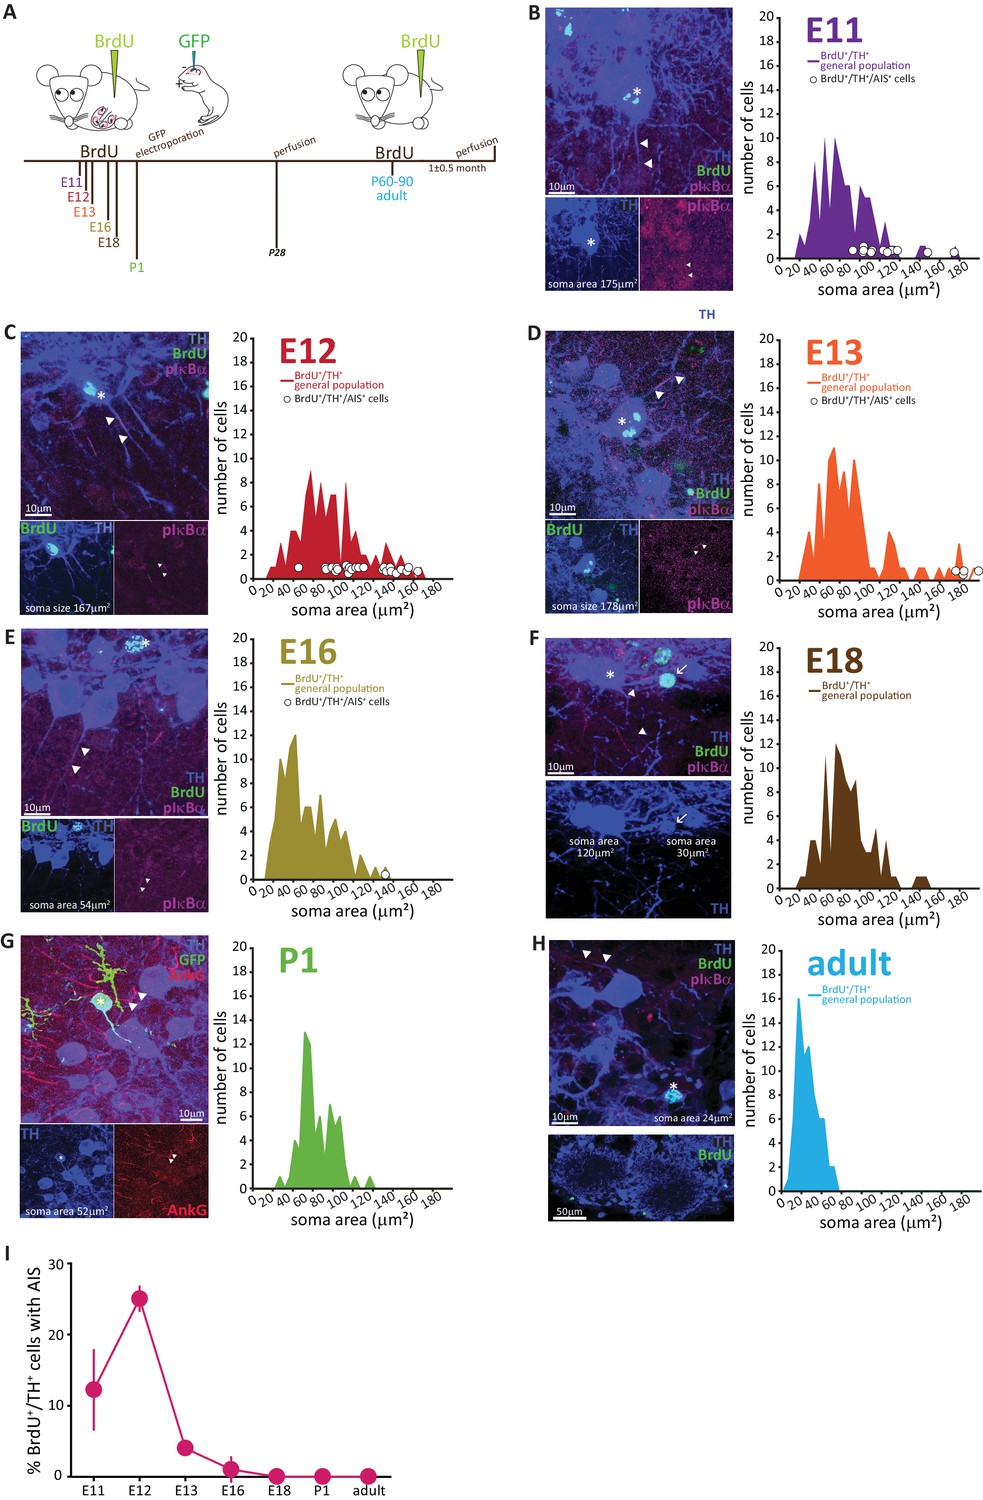
AIS-positive DA cells are generated exclusively in early embryonic development.
(A) Schematic representation of the experimental strategy for birthdating experiments: pregnant wild-type mice were injected with a single dose of BrdU at different gestational days. Tissue was collected from their offspring at 1 month of age (P28), and also from the injected mothers which constitute the ‘adult’ group. We also labelled neonatally generated cells by electroporating GFP-encoding plasmid DNA injected into the lateral ventricles at P1. (B–H) Left: example images from OB slices stained with antibodies against BrdU (green), TH (blue) and the AIS markers pIκbα or AnkG (magenta). Asterisks indicate BrdU+/TH +cells; triangles indicate AIS start and end positions; in E-H AISes are indicated in BrDU- cells for comparison. Right: soma area distribution of BrdU+/TH+ DA cells (for each BrdU time point n = 100, N = 3; for P1 electroporation n = 68, N = 3; for adult mothers n = 70, N = 2). Circles indicate AIS-positive cells (BrdU+/TH+/pIκBα+) at their respective soma size value. (I) Summary graph indicating the percentage of AIS-positive cells (BrdU+/TH+/pIκBα+) generated at each developmental time point (mean ± SEM). No AIS-positive DA cells were born after E18.
Figure 5

Fully mature adult-born DA neurons are small and never possess an AIS.
(A) Schematic representation of the experimental strategy: pregnant wild-type mice were injected with a single dose of BrdU, and their tissue was collected 4 months later to allow full maturation of adult-born neurons. (B) Example image of adult tissue perfused 4 months post-BrdU injection, stained with antibodies against BrdU (green), TH (blue) and the AIS marker pIκBα (magenta). Asterisk indicates a BrdU +DA cell (TH+/pIκBα-), triangles indicate AIS start and end positions; the arrow indicates a neighbouring large AIS +DA neuron that is BrdU-negative.
Figure 6

In neonates there is a preponderance of large DA neurons that can already possess an AIS.
(A) Low-magnification example images of tissue from P0 and P28 wild-type mice stained with an antibody against TH (blue). Arrows indicate cells with a soma area bigger than 100 μm2; ‘GL’ indicates glomerular layer, ‘EPL’ indicates external plexiform layer. (B) Soma area distribution of TH +DA cells in P0 mice (teal, n = 781, N = 3), overlaid on the soma area distribution of the general DA cell population at P28 (blue filled line; see Figure 1B); Kolmogorov-Smirnov test between the two distributions **, D = 0.3581, p<0.01. (C) High-magnification example image of tissue from a P0 mouse stained with antibodies against TH (blue) and AnkG (magenta). Asterisk indicates the soma of an AIS-positive cell; dashed lines show the inset area magnified below; solid line shows axon start; triangles indicate AIS start and end positions. (D) Soma area of TH+/AnkG+ DA cells in P0 mice. Empty circles represent individual cells, full circle shows mean ± SEM (110 ± 10 μm2; n = 16, N = 2).
Figure 7

AIS-positive cells form the vast majority of embryonically-generated DA neurons that persist throughout adult life.
(A) Schematic representation of the experimental strategy: pregnant wild-type mice were injected with a single dose of BrdU at E12. Tissue was collected from their offspring when they reached 6 months of age and compared with data collected from littermates perfused at 1 month of age (data shown in Figure 6C). (B) Left: Low-magnification example image of 6-month-old tissue stained with antibodies against BrdU (green), TH (blue) and the AIS marker pIκBα (magenta). GL, glomerular layer; EPL, external plexiform layer; asterisk indicates an E12-6mo BrdU+/TH+ DA cell; dashed line indicates the inset magnified on the right. Right: magnified example image of an E12-6mo BrdU+/TH+/pIκBα+cell; solid line indicates axon start; arrows show AIS start and end positions. (C) Soma area distribution of E12-6mo BrdU+/TH+ DA cells (dark red, n = 78, N = 4), overlaid on the soma area distribution of E12-1mo BrdU+/TH+ DA cells (dashed light red line; see Figure 4C). (D) Soma area of E12-6mo BrdU+/TH+/pIκBα+ DA cells. Empty circles represent individual AIS-positive neurons, dark red lines show mean ± SEM (102 ± 4 μm2; n = 71, N = 4). (E) Mean ± SEM percentage of AIS-positive E12-BrdU+/TH+ DA cells in tissue from 1-month-old (light red, 25%; n = 100, N = 3) and 6-month-old (dark red, 91%; n = 78, N = 4) mice.
Figure 8 with 1 supplement
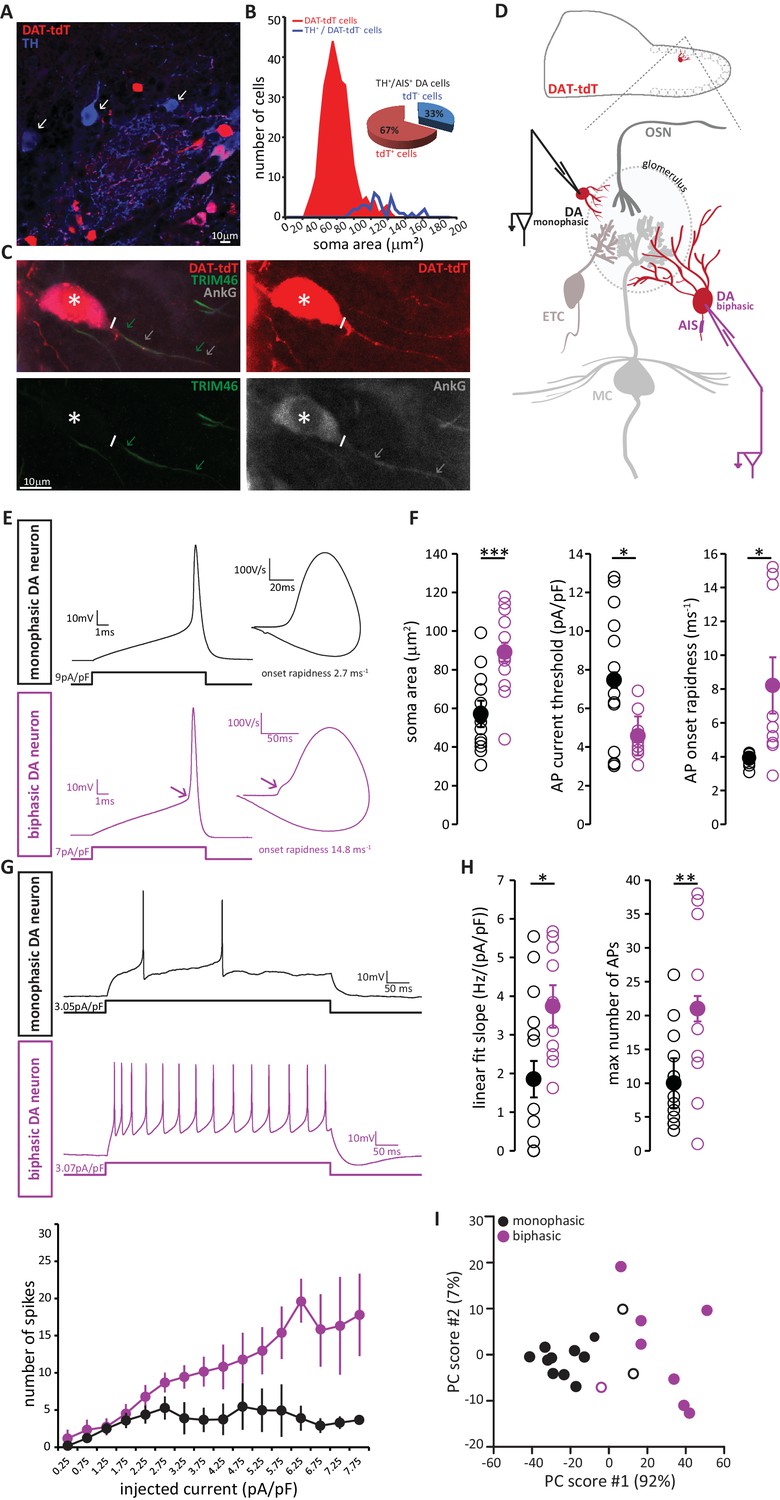
AIS-positive DA neurons have greater intrinsic excitability.
(A) Example image of a fixed, 50 µm OB slice from a P28 DAT-tdT (red) mouse, immunostained with an anti-TH antibody (blue). While most TH-positive neurons exhibit red tdT fluorescence, some are tdT-negative (arrows). (B) Soma size distributions of all DAT-tdT-positive cells (red), and of DA neurons that are DAT-tdT-negative but TH-positive (blue). Inset: percentages of AIS-positive/TH-positive DA cells that are either tdT-positive or –negative (n = 50, N = 5). (C) Example image of a DAT-tdT-labelled DA cell (red) stained with the axonal marker TRIM-46 (green) and the AIS marker AnkG (greyscale). Asterisks indicate the soma; line indicates axon start; arrows indicate start and end position of the TRIM (green) and AnkG (white) label. (D) Schematic representation of the experimental strategy for whole-cell recordings: acute 300 µm OB slices were obtained from P21-35 DAT-tdT mice, and tdT-positive DA cells of either subtype were targeted for whole-cell patch-clamp recording. (E) Example current-clamp traces of single APs fired by monophasic (AIS-negative, black, n = 15) and biphasic (AIS-positive, magenta, n = 11) DAT-tdTomato neurons. Left: action potentials fired to threshold 10 ms somatic current injection. Right: phase plane plots of the spikes shown on the left. Arrow points to the AIS-dependent first action potential phase. (F) Quantification of soma area (t-test; ***p=0.0006), current threshold (Welch-corrected t-test; *p=0.017), and onset rapidness (Welch-corrected t-test; *p=0.035) in monophasic and biphasic cells. Empty circles show values from individual cells, filled circles show mean ± SEM. (G) Top: Example current-clamp traces of multiple APs fired in response to a 300pA/500 ms somatic current injection in monophasic and biphasic cells. Bottom: input-output curve of injected current density versus mean ± SEM spike number for each group. (H). Quantification of input-output slope (t-test; *p=0.044), and of the maximum number of action potentials fired by each cell over the whole range of injected current intensities (t-test; **p=0.0092). Empty circles show values from individual cells; filled circles show mean ± SEM. (I) Classification of DAT-tdT neurons based on values obtained from whole-cell recordings. Each circle shows one cell, plotted according to its primary and secondary PCA component scores (these components accounted for 92% and 7% of the variance in the data, respectively). Filled circles show cells correctly classified by k-means analysis; open circles show the few cells (3/26 overall) that were incorrectly classified.
Figure 8—figure supplement 1
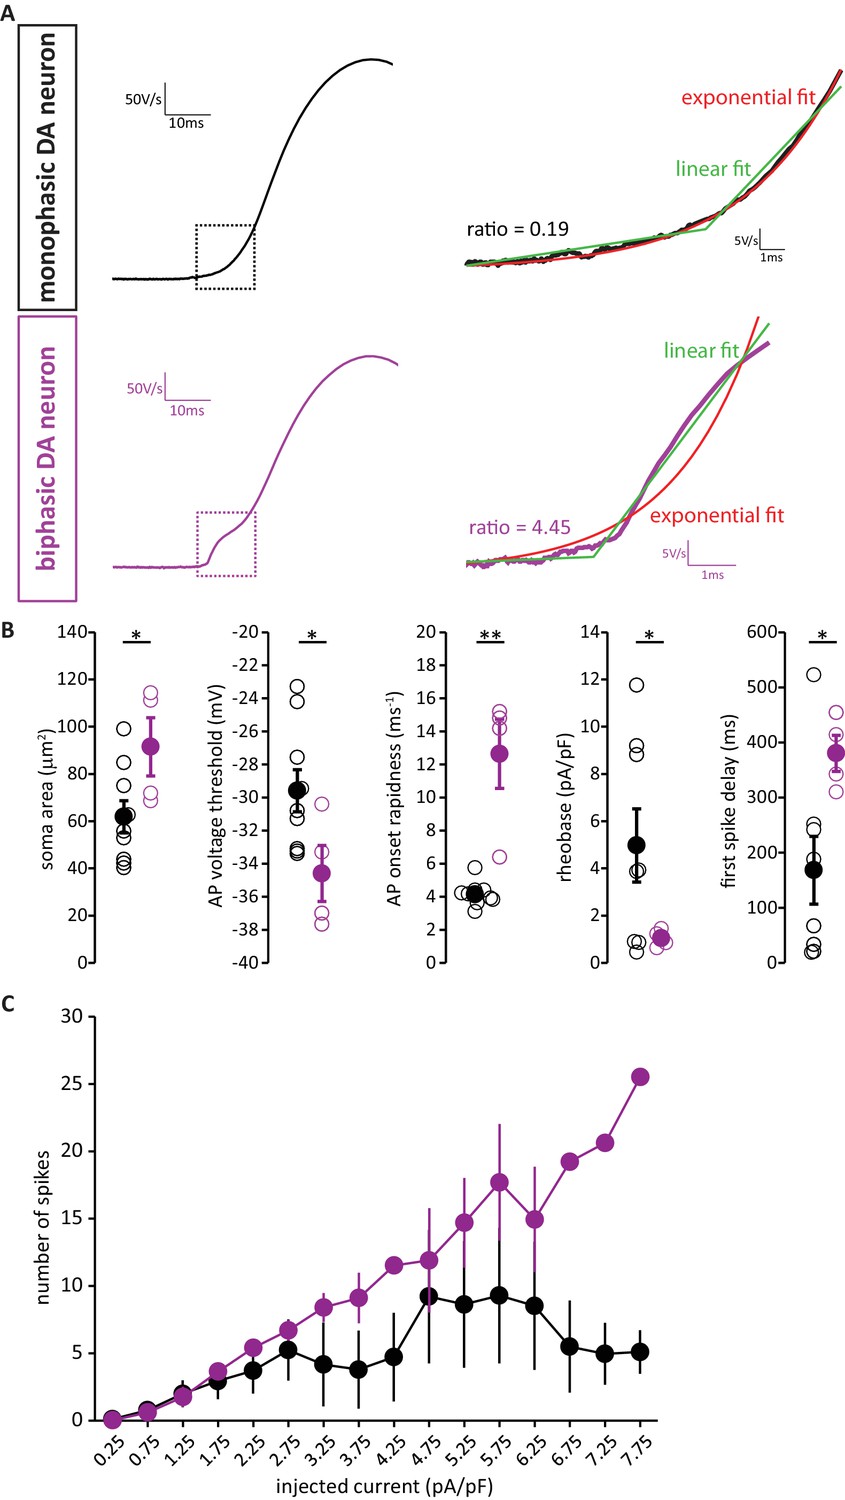
AIS-positive DA neurons also have greater intrinsic excitability with strict, objective phase plane plot classification.
(A) Example current-clamp traces of phase plane plots of single APs fired by monophasic (AIS-negative, black, top) and biphasic (AIS-positive, magenta, bottom) DAT-tdTomato neurons. Dashed box indicates the AIS-dependent first action potential phase, which is shown at higher detail on the right and fitted with two methods. The ratio between the errors of the linear fit (green) and the exponential fit (red) is indicated near the trace. (B) Quantification of soma area (t-test; p=0.04), voltage threshold (t-test; p=0.046), onset rapidness (Mann-Withney test; p=0.003), rheobase (t-test; p=0.039) and first spike delay (t-test; p=0.0431) in monophasic and biphasic cells. Empty circles show values from individual cells, filled circles show mean ± SEM; *p<0.05; **p<0.01. (C) Input-output curve of injected current density versus mean ±SEM spike number for each group.
Figure 9

Both OB DA cell subtypes display diverse odour response types.
(A) Schematic representation of the experimental strategy for in vivo recordings: adult DAT-GCaMP6s mice (anaesthetised with ketamine/xylazine) were presented with a panel of eight odours. Resulting changes in GCaMP fluorescence in DA neurons were imaged through a cranial window positioned over the OB. (B) Example field of view of the deeper part of the glomerular layer used for image acquisition (sum intensity projection of time axis, enhanced contrast). Fields of view were selected so as to contain both ‘big’ (soma area >99 μm2, putatively AIS-positive; magenta arrow) and ‘small’ (soma area <70 μm2, putatively AIS-negative; green arrow) DA neuron types. (C) Representative examples of the three categories of Δf/f GCaMP responses that we observed in the dataset. Deflections from baseline were considered events when they exceeded a threshold (horizontal dashed line) set at three times the baseline standard deviation. Excitatory responses occurred either quickly after odour presentation (early excitatory responses,[↑]; recorded in 52% of cells) or on a later timeframe (late excitatory responses, ; recorded in 22% of cells). The early/late cut-off value was 6 s (vertical dashed line; see Materials and methods). Approximately a fifth of all cells also showed supra threshold negative deflection from baseline (inhibitory responses [↓]; present in 25% of cells). Green circle indicates absolute maximum or minimum value (peak) and green line shows the mean of the 3 s around the peak; yellow line indicates the 3 s of baseline prior to odour presentation (blue box). (D) Time of peak frequency plot for excitatory (red) and inhibitory (blue) events occurring after 3 s odour presentation (blue bar). The vertical dashed line indicates the cut-off value for early (≤6 s) and late (>6 s) excitatory responses. (E) Left: Raw fluorescence traces of early-excitatory, late-excitatory and inhibitory responses to three repeated presentations of a 3 s odour stimulus (blue box). Right: Mean Δf/f response over the three repeats, after background subtraction and bleach correction. Grey shading indicates standard deviation (SD). (F) Mean ±SEM coefficient of variation (CV) of peak time over the three odour presentations for early excitatory, late excitatory and inhibitory responses. Wilcoxon test vs. 1; ***p<0.001. (G) Mean ± SEM amplitude z-score value (mean of the two smallest responses out of the three odour repeats) for early excitatory, late excitatory and inhibitory responses. Wilcoxon test vs. 1; ***p<0.001. (H) Percentage of small (putative AIS-negative) and big (putative AIS-positive) cells in each mouse that showed at least one early excitatory (left), late excitatory (middle) or inhibitory (right) response. Colour-coding indicates the 13 mice that were imaged. Wilcoxon paired rank test; *p<0.05.
Figure 10 with 1 supplement
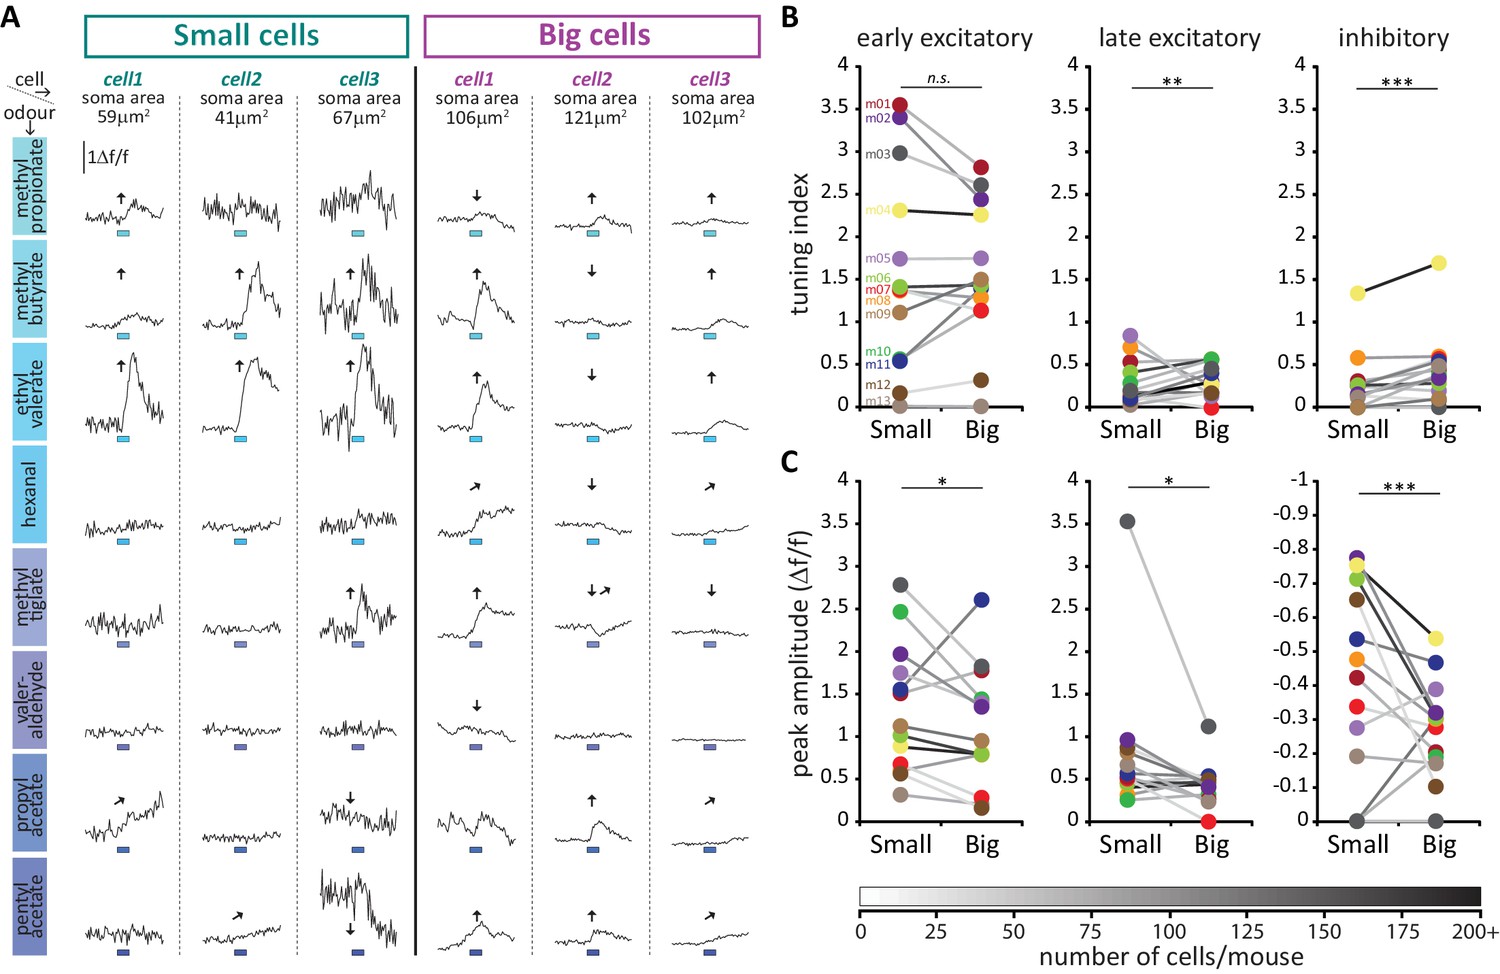
Large putative AIS-positive DA cells respond less strongly to odours and are more broadly tuned.
(A) Example Δf/f GCaMP responses to the eight odours (rows, 3 s stimulus timing is indicated by blue shaded bars) for three big and three small example cells (columns; soma areas are indicated below the responses) imaged in the same mouse. Significant responses are indicated as: ↑ early excitatory, late excitatory, ↓ inhibitory. (B) Mean values of odour tuning indices for early excitatory (left), late excitatory (middle) and inhibitory responses (right) measured in small and big cells. Coloured dots indicate mean values for each cell type from each of the 13 imaged mice. The grayscale colour of the connecting lines indicates the number of recorded cells for each mouse (scale below). Cell-type effect in multilevel ANOVA; n.s., non-significant; *p<0.05; **p<0.01. (C) Similar to B. Median values of odour peak intensity for early excitatory (left), late excitatory (middle) and inhibitory responses (right). Cell-type effect in multilevel ANOVA; *p<0.05; ***p<0.0001.
Figure 10—figure supplement 1
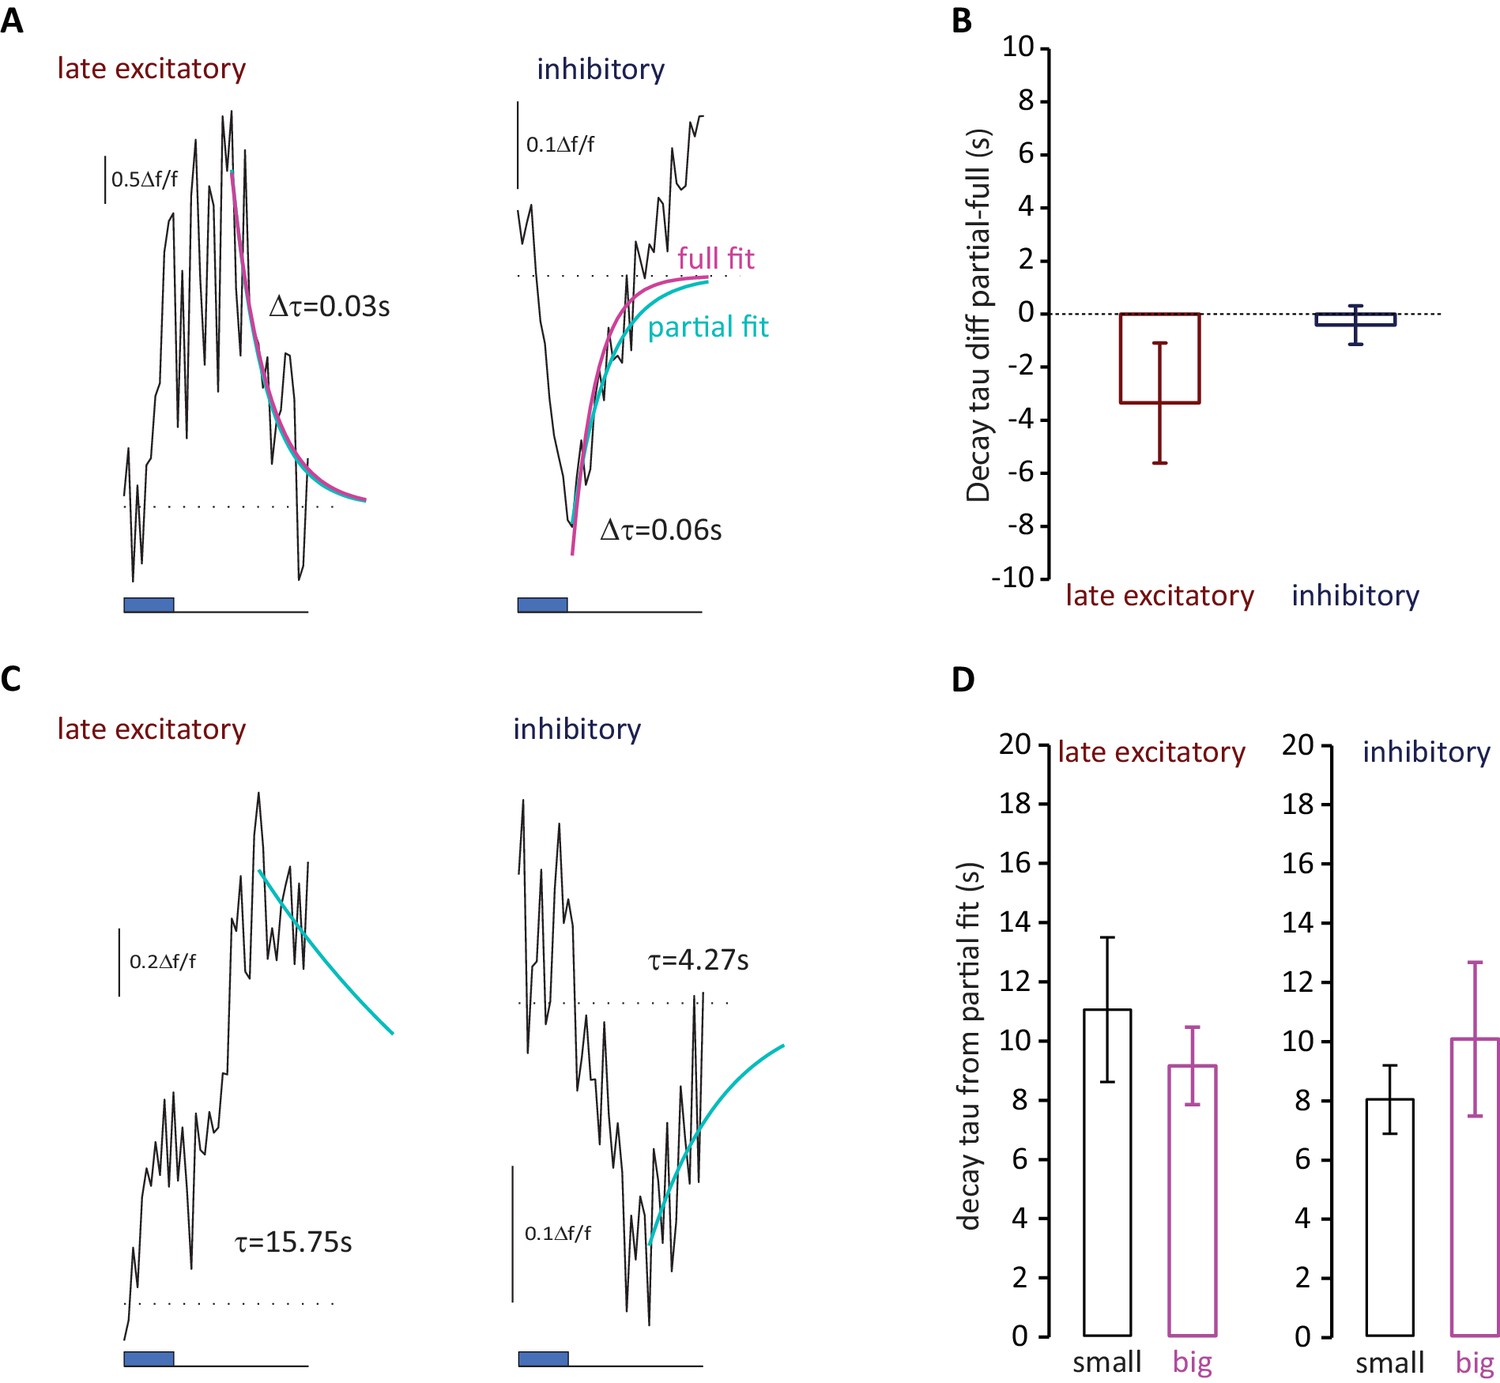
Decay kinetics of late-latency responses do not differ between small and big OB DA neurons.
(A) Example mean traces of late-latency excitatory and inhibitory responses that returned to baseline within the imaging timeframe (10.5 s after stimulus onset). Blue box shows stimulus timing; dotted line shows baseline Δf/f; blue line indicates exponential fit to the first 10 points from the peak only (partial); magenta line indicates exponential fit plotted to the whole trace from the peak (full). Values for the difference between the two decay constants from the fits displayed for each trace. (B) Mean ± SEM differences between decay constants from whole-trace fit (full) and first-10-points fit (partial) for each response type (late excitatory n = 14; inhibitory n = 44; Wilcoxon test vs. 0, late excitatory p=0.50; inhibitory p=0.17). (C) Example mean traces of late-latency excitatory and inhibitory responses whose decay could be estimated with an exponential fit to the first ten points following the response peak (blue line). Decay constants are shown for each trace. (D) Mean ± SEM partial fit decay constants for small and big cell late excitatory and inhibitory response types (late excitatory, fixed effect of cell type in multilevel ANOVA, F1,98 = 0.32, p=0.57; inhibitory, F1,113 = 0.078, p=0.78).
Tables
Table 1
Morphological properties of AIS-negative and AIS-positive DA neurons.
Mean values ± SEM of morphological properties for sparsely labelled AIS-negative (n = 14) and AIS-positive (n = 9) DA cells. Statistical differences between groups (AIS-negative vs AIS-positive) were calculated with a Student’s t test for normally distributed data (‘t’; with Welch correction ‘tW’) or with a Mann–Whitney test for non-normally distributed data (‘MW’). Bold type indicates statistically different measures. Morphological reconstructions and average Sholl plots are presented in Figure 3.
| Morphological properties | |||
|---|---|---|---|
| AIS-negative (mean ± sem) | AIS-positive (mean ± sem) | Test type, p-value | |
| Soma area (μm2) | 70.49 ± 2.71 | 139.00 ± 17.16 | tW, 0.003 |
| Distance of soma from nerve layer (μm) | 75.07 ± 12.79 | 141.60 ± 31.38 | MW, 0.02 |
| Number of primary dendrites | 3.14 ± 0.23 | 3.44 ± 0.29 | t, 0.43 |
| Length of primary dendrites (μm) | 12.14 ± 2.97 | 26.13 ± 5.23 | MW, 0.01 |
| Area under Sholl curve (μm) | 338.60 ± 42.58 | 871.10 ± 167.20 | tW, 0.01 |
| Furthest intersection (μm) | 77.86 ± 8.23 | 148.30 ± 13.94 | t, 0.0001 |
| Maximum no. of intersections | 8.36 ± 0.68 | 12.56 ± 1.68 | tW, 0.04 |
| Radius for maximum no. of intersections (μm) | 36.16 ± 4.45 | 80.00 ± 13.97 | tW, 0.02 |
Table 2
Intrinsic electrophysiological properties of DAT-tdTomato neurons.
Mean values ± SEM of passive, action potential and repetitive firing properties for monophasic (putative AIS-negative, n = 15) and biphasic (putative AIS-positive, n = 11) DAT-tdTomato cells. Statistical differences between groups (monophasic vs biphasic) were calculated with a Student’s t test for normally-distributed data (‘t’) or with a Mann–Whitney test for non-normally distributed data (‘MW’). Bold type indicates statistically different measures, for which individual data points and example traces are presented in Figure 5.
| Intrinsic electrophysiological properties | |||
|---|---|---|---|
| Monophasic (mean ± sem) | Biphasic (mean ± sem) | Test type, p-value | |
| Passive properties | |||
| Soma area (μm2) | 57 ± 4.8 | 89 ± 6.8 | t,<0.01 |
| Membrane capacitance (pF) | 19 ± 2 | 22 ± 2 | t, 0.39 |
| Resting membrane potential (mV) | −78 ± 1.9 | −74 ± 2.9 | MW, 0.31 |
| Input Resistance (MΩ) | 960 ± 272 | 572 ± 115 | MW, 0.13 |
| Action potential properties | |||
| Threshold (pA/pF) | 7.5 ± 1.0 | 4.6 ± 0.4 | t, 0.02 |
| Threshold (mV) | −30 ± 1.0 | −33 ± 1.0 | t, 0.13 |
| Max voltage reached (mV) | 19 ± 2.4 | 18 ± 4.0 | t, 0.80 |
| Peak amplitude (mV) | 49 ± 2.2 | 50 ± 4.4 | t, 0.79 |
| Width at half-height (ms) | 0.55 ± 0.03 | 0.50 ± 0.04 | t, 0.37 |
| Rate of rise (max dV/dt) (mV/ms) | 230 ± 16 | 251 ± 31 | t, 0.53 |
| Onset rapidness (1/ms) | 3.95 ± 0.28 | 8.22 ± 1.66 | t, 0.03 |
| After hyper polarization AHP (mV) | −54 ± 1.4 | −55 ± 1.5 | t, 0.72 |
| AHP relative to threshold (mV) | 25 ± 1.3 | 24 ± 1.3 | t, 0.95 |
| Repetitive firing properties | |||
| Rheobase (pA/pF) | 3.6 ± 1.0 | 1.7 ± 0.8 | MW, 0.28 |
| Max number of action potentials | 10 ± 2 | 21 ± 4 | t, 0.01 |
| First action potential delay (ms) | 168 ± 38 | 273 ± 45 | t, 0.08 |
| Inter-spike interval CV | 0.28 ± 0.04 | 0.24 ± 0.03 | t, 0.46 |
| Slope of input/output curve (Hz/(pA/pF)) | 1.85 ± 0.54 | 3.53 ± 0.48 | t, 0.04 |
Key resources table
| Reagent type (species) or resource | Designation | Source or reference | Identifiers |
|---|---|---|---|
| Strain, strain background (M. musculus) | C57BL/6J mice | Charles River | Strain code 027 |
| Strain, strain background (M. musculus) | DAT-Cre, B6.SJL-Slc6a3tm1.1(cre)Bkmn/J | The Jackson Laboratory | Jax stock 006660 |
| Strain, strain background (M. musculus) | VGAT-Cre, Slc32a1tm2(cre)Lowl/J | The Jackson Laboratory | Jax stock 016962 |
| Strain, strain background (M. musculus) | flex-tdTomato, B6.Cg–Gt(ROSA)26Sortm9(CAG-tdTomato)Hze, | The Jackson Laboratory | Jax stock 007909 |
| Strain, strain background (M. musculus) | flex-GCaMP6s animals, Ai96; B6;129S6-Gt(ROSA)26Sortm96(CAG-GCaMP6s)Hze/J | The Jackson Laboratory | Jax stock 024106 |
| Transfected construct (Adeno-associated virus) | AAV9.EF1a.ChR2-YFP lox/lox virus | Penn Vector Core, USA | AV-9-PV1522, |
| Transfected construct (retrovirus) | floxed rv::dio-GFPlox/lox | Oscar Marin | Ciceri et al., 2013 Nat Neuroscience 16(9):1199–210 |
| Antibody | polyclonal Anti-Tyrosine Hydroxylase, raised in Rabbit; use 1:500 | Millipore | catalogue number AB152; RRID:AB_390204 |
| Antibody | monoclonal Anti-Tyrosine Hydroxylase, raised in mouse; use 1:500 | Millipore | clone (LNC1) - catalog number MAB318; RRID: AB_2313764 |
| Antibody | polyclonal Anti-Tyrosine Hydroxylase, raised in chicken; use 1:250 | Abcam | catalog number ab76442; RRID:AB_1524535 |
| Antibody | monoclonal anti-Ankyrin-G IgG2a, raised in mouse; use 1:500 | Neuromab | clone (106/36) - catalog number75–146; RRID: AB_10673030 |
| Antibody | monoclonal anti-Ankyrin-G IgG2b, raised in mouse; use 1:500 | Neuromab | clone (106/65) - catalog number75–147; RRID: AB_10675130 |
| Antibody | monoclonal anti-Ankyrin-G IgG1, raised in mouse; use 1:500 | Neuromab | clone (106/20) - catalog number75–187; RRID:AB_10674433 |
| Antibody | monoclonal Phospho-IκBα (Ser32) (14D4), raised in rabbit; use 1:1000 | Cell Signaling Technology | catalog number 2859; RRID:AB_561111 |
| Antibody | polyclonal Anti-TRIM46, raised in rabbit; use 1:500 | Gift from Casper Hoogenraad | van Beuningen et al. (2015) Neuron. 88:1208–1226 |
| Antibody | monoclonal anti-MAP-2, raised in mouse; use 1:500 | Gift from Phillip Gordon-Weeks | |
| Antibody | monoclonal anti-chemical BrdU, raised in Rat; use 1:200 | Serotec | clone BU1/75 (ICR1)- catalog number OBT0030; RRID:AB_609568 |
| Antibody | polyclonal anti-GFP, raised in chicken; use 1:2000 | Abcam | catalog number ab13970; RRID:AB_300798 |
| Antibody | polyclonal anti-GFP, raised in guinea pig; use 1:500 | Synaptic Systems | catalog 132 005; RRID:AB_11042617 |
| Chemical compound, drug | Heparin | Alfa Aesar | CAS A16198 |
| C | |||
| Chemical compound, drug | PIPES | Sigma | CAS P6757 |
| Chemical compound, drug | 5-Bromo-2′-deoxyuridine | Sigma | CAS 59143 |
| Chemical compound, drug | Alexa 488 | Thermo Fisher Scientific | A10436 |
| Chemical compound, drug | Methyl Propionate | Sigma | CAS 81988 |
| Chemical compound, drug | Methyl Butyrate | Sigma | CAS 246093 |
| Chemical compound, drug | Ethyl Valerate | Sigma | CAS 290866 |
| Chemical compound, drug | Hexanal | Sigma | CAS 115606 |
| Chemical compound, drug | Methyl Tiglate | Penta | CAS 13–73400 |
| Chemical compound, drug | Valeraldehyde | Sigma | CAS 110132 |
| Chemical compound, drug | Propyl Acetate | Tokyo Chemical Industry | CAS A0044 |
| Chemical compound, drug | Pentyl Acetate | Sigma | CAS 109549 |
| Chemical compound, drug | Diethyl Phthalate | Sigma | CAS 84662 |
| Software, algorithm | ImageJ software (Fiji) | NIH; Schneider et al. (2012) | RRID:SCR_003070 |
| Software, algorithm | ClampFit 10.4 | pClamp | Molecular Devices; RRID:SCR_011323 |
| Software, algorithm | Prism 5.3 | GraphPad | RRID:SCR_002798 |
| Software, algorithm | Matlab | Mathworks | RRID:SCR_001622 |
| Software, algorithm | Vaa3D | Allen Institute for Brain Science | RRID:SCR_002609 |
| Software, algorithm | IBM SPSS Statistics | IBM | RRID:SCR_002865 |
Additional files
-
Transparent reporting form
- https://doi.org/10.7554/eLife.32373.017
Download links
A two-part list of links to download the article, or parts of the article, in various formats.
Downloads (link to download the article as PDF)
Open citations (links to open the citations from this article in various online reference manager services)
Cite this article (links to download the citations from this article in formats compatible with various reference manager tools)
Embryonic and postnatal neurogenesis produce functionally distinct subclasses of dopaminergic neuron
eLife 7:e32373.
https://doi.org/10.7554/eLife.32373


