Single-cell transcriptional dynamics of flavivirus infection
- Stanford University, United States
- Stanford University School of Medicine, United States
- Chan Zuckerberg Biohub, United States
Figures
Figure 1 with 1 supplement
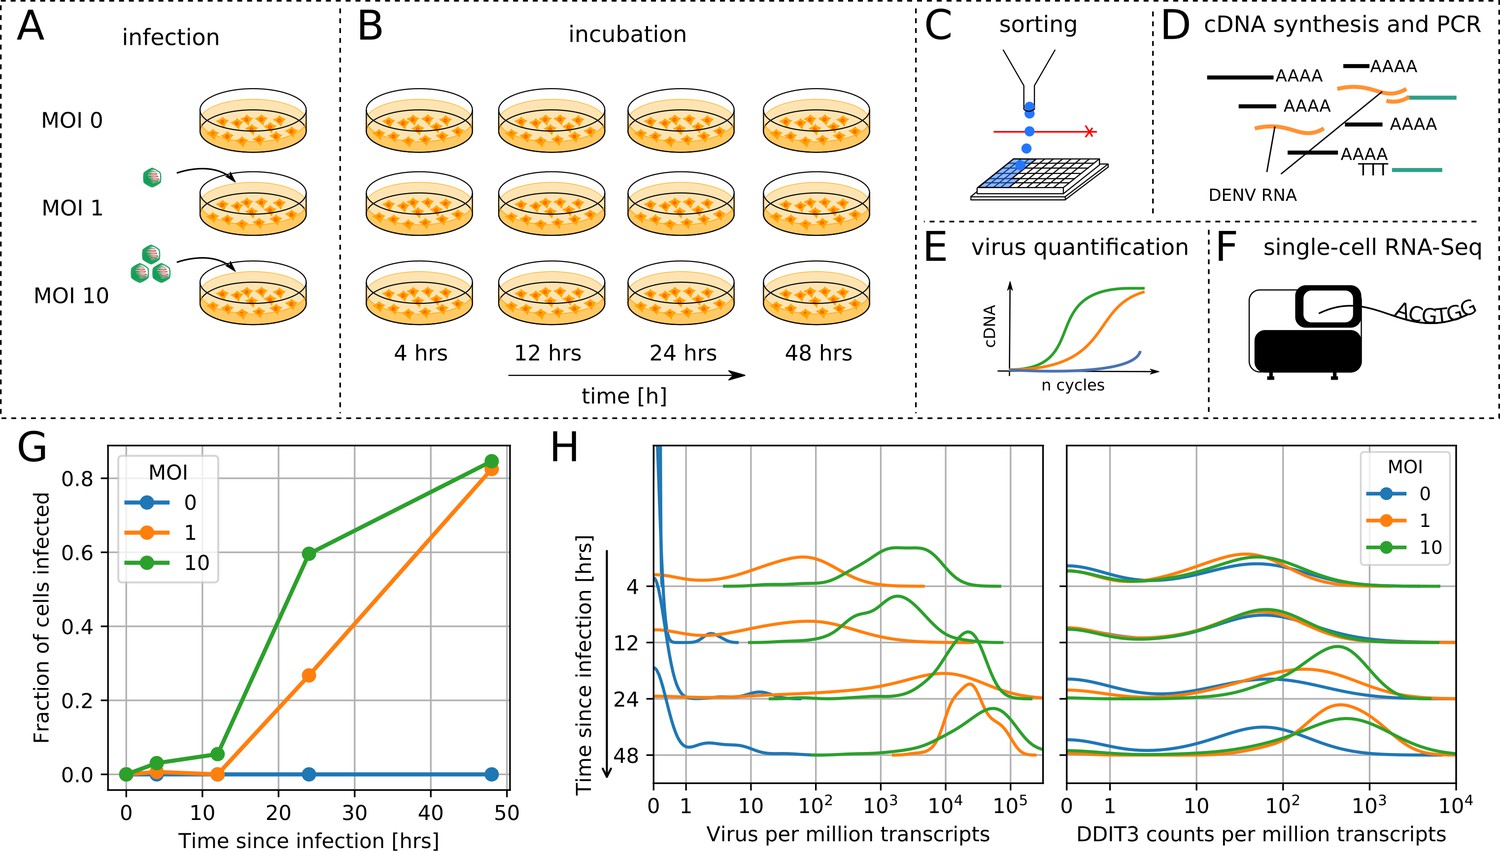
viscRNA-Seq quantifies gene expression and virus RNA from the same cell.
. (A to F) Experimental design: (A) human hepatoma (Huh7) cells are infected with dengue or Zika virus at time 0 at multiplicity of infection (MOI) 0 (control), 1, or 10, then (B) harvested at different time points, (C) sorted and lysed into single wells. (D) Both mRNA and viral RNA (vRNA) are reverse transcribed and amplified from each cell, then (E) cells are screened for virus infection by qPCR. (F) Libraries are made and sequenced on an illumina NextSeq 500 with a coverage of ~400,000 reads per cell. (G) The fraction of cells with more than 10 virus reads increases with MOI and time, saturating at 48 hr post infection. (H) Distributions of number of virus reads (left) and expression of an example stress response gene (right) inside single cells, showing the different dynamics of pathogen replication and host response. Whereas virus content can increase 1000 fold and shows no saturation, expression of DDIT3/CHOP saturates after a 10 fold increase.
Figure 1—figure supplement 1

Quality Controls of the viscRNA-Seq approach.
. (A) ERCC spike-ins abundance distributions in single cells. (B) Number of genes detected above four reads in the sequenced cells. (C) Expression of some housekeeping genes. (D) comparison of qPCR and sequencing for vRNA content. (E) Coverage of the dengue genome for all experimental conditions during the DENV infection.
Figure 2 with 6 supplements

Correlation between dengue vRNA and gene expression reveals cellular processes involved in dengue virus infection.
(A) Distribution of Spearman correlation coefficients between dengue vRNA and mRNA from the same cell across all human genes. The insets list the top correlated (right) and anticorrelated (left) genes. Response to ER stress and apoptosis is activated as infection proceeds, whereas actin and microtubules pathways are downregulated. (B–E) Examples of correlation patterns observed across the transcriptome, as a scatter plot of vRNA amount versus gene expression. Each dot is a single cell and the green shades indicate the density of cells. Dashed lines indicate least-square piecewise-linear fits in log-log space (see Materials and methods): (B) Anticorrelation at high vRNA content, (C) correlation at medium to high vRNA content, (D) no correlation, and (E) time-dependent correlation dynamics. (F) Expression versus vRNA content for gene COPE, as shown in panel E but splitting cells by time after infection. Correlation at each time is shown in the top left corner of each plot, and switches from strongly negative to strongly positive as infection proceeds. (G) Correlation between expression and dengue vRNA content switches from negative to positive (< −0.3 to >+0.3) for six genes (left panel) and in the opposite direction for 11 genes (right panel), highlighting potential multiple roles of these genes during dengue virus infection. Error bars and numbers in parentheses are standard deviations of 100 bootstraps over cells (the latter indicates uncertainties on the last digit).
Figure 2—figure supplement 1
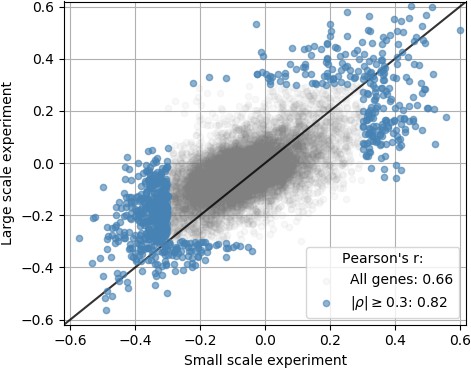
An independent smaller scale, time course DENV infection experiment shows consistent results across replicates in terms of genes that are correlated and anticorrelated with intracellulal virus abundance.
Each dot is a gene; x coordinate is the correlation of gene expression with virus reads per million transcripts in the small-scale experiment, y coordinate is the same in the large-scale experiment of Figure 2; genes with a correlation coefficient of 0.3 or more in magnitude are highlighted in blue. The legend indicates Pearson’s r coefficients for all genes and the highlighted ones.
Figure 2—figure supplement 2
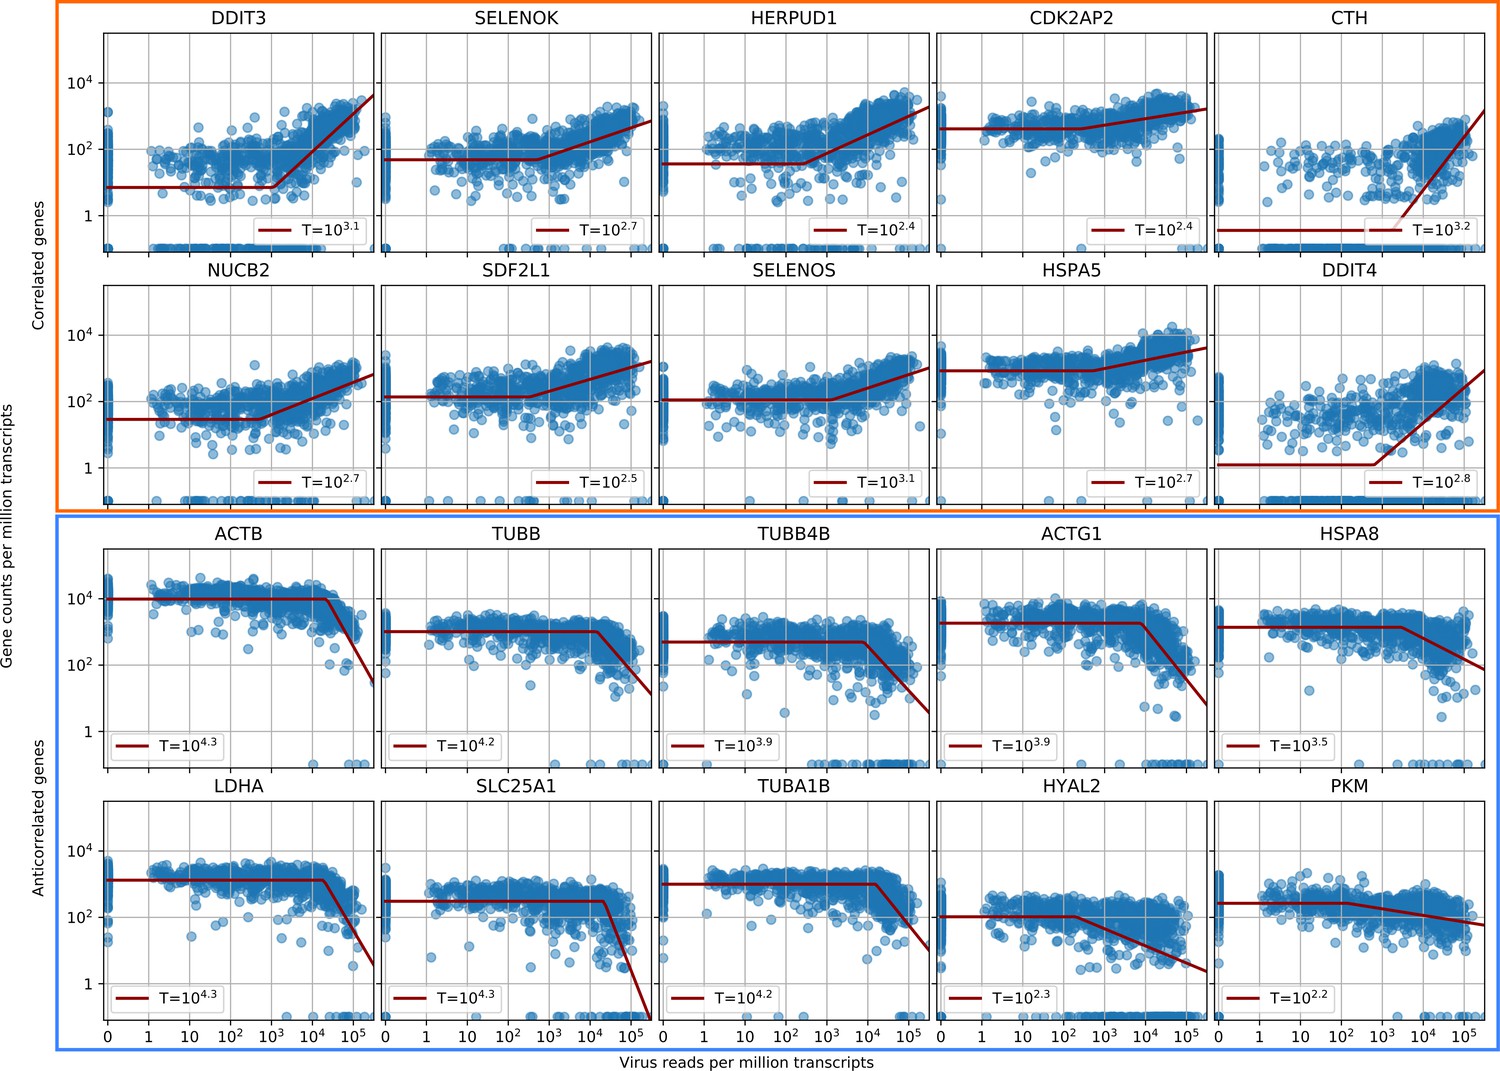
Parametric fitting of piecewise-linear gene expression versus intracellular virus amount infers reaction thresholds for infected cells.
The top rows show the most positively correlated genes, the two bottom rows the most anticorrelated genes (see Figure 2A, insets).
Figure 2—figure supplement 3
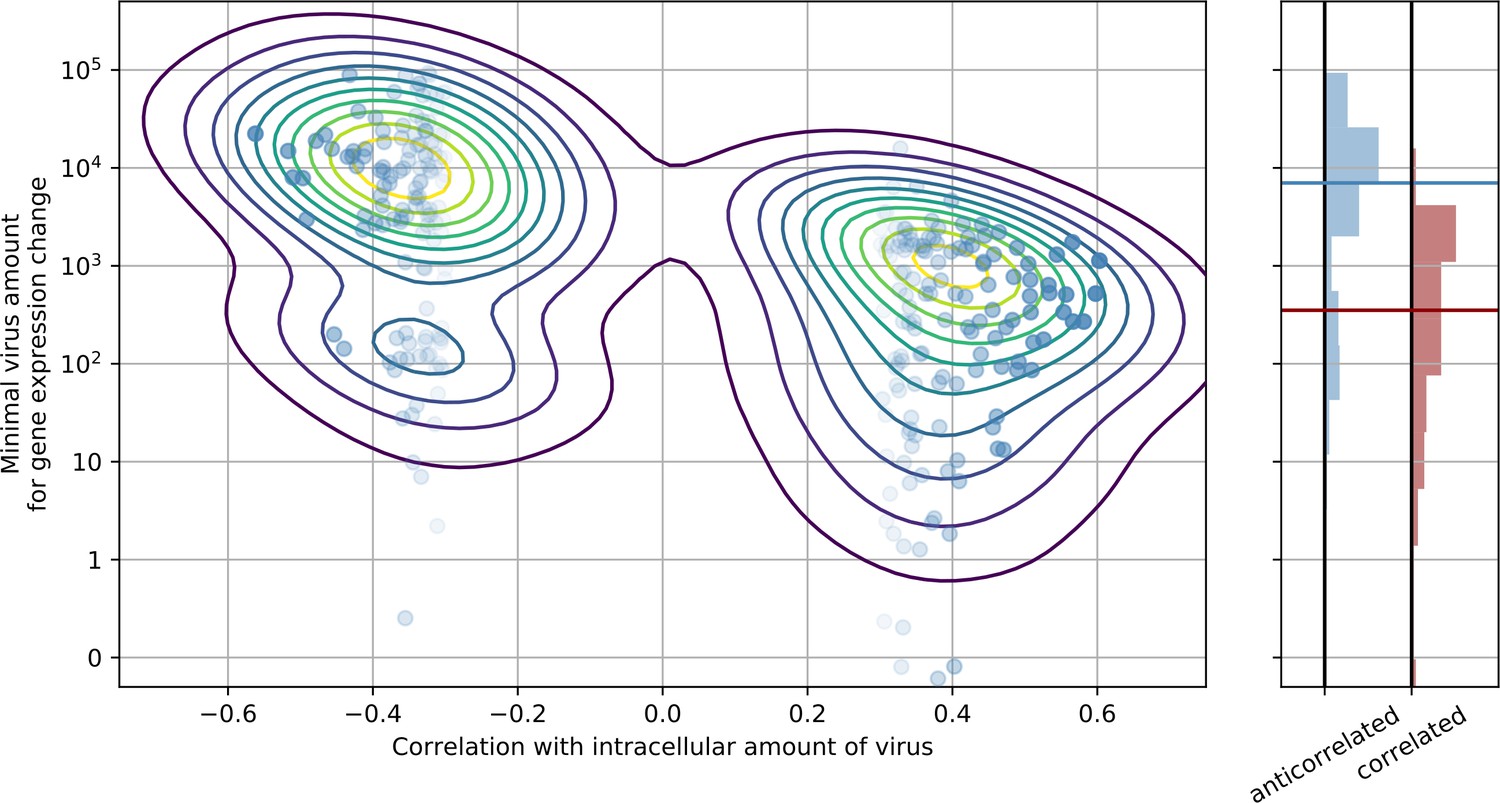
Genes that are anticorrelated with intracellular virus amount change expression at a higher threshold than genes that are positive correlated.
This result is indicative that underexpression of cytoskeleton and metabolic genes mostly follows increased expression of ER stress response genes, and not vice versa. In the left panel, threshold is scattered against correlation with virus amount (each dot is a gene), limited to strongly anticorrelated or correlated genes. A gaussian kernel density estimate is overlayed as contour lines. In the right panel, histograms of thresholds (see Methods) and their medians for anticorrelated or correlated genes are shown, respectively.
Figure 2—figure supplement 4
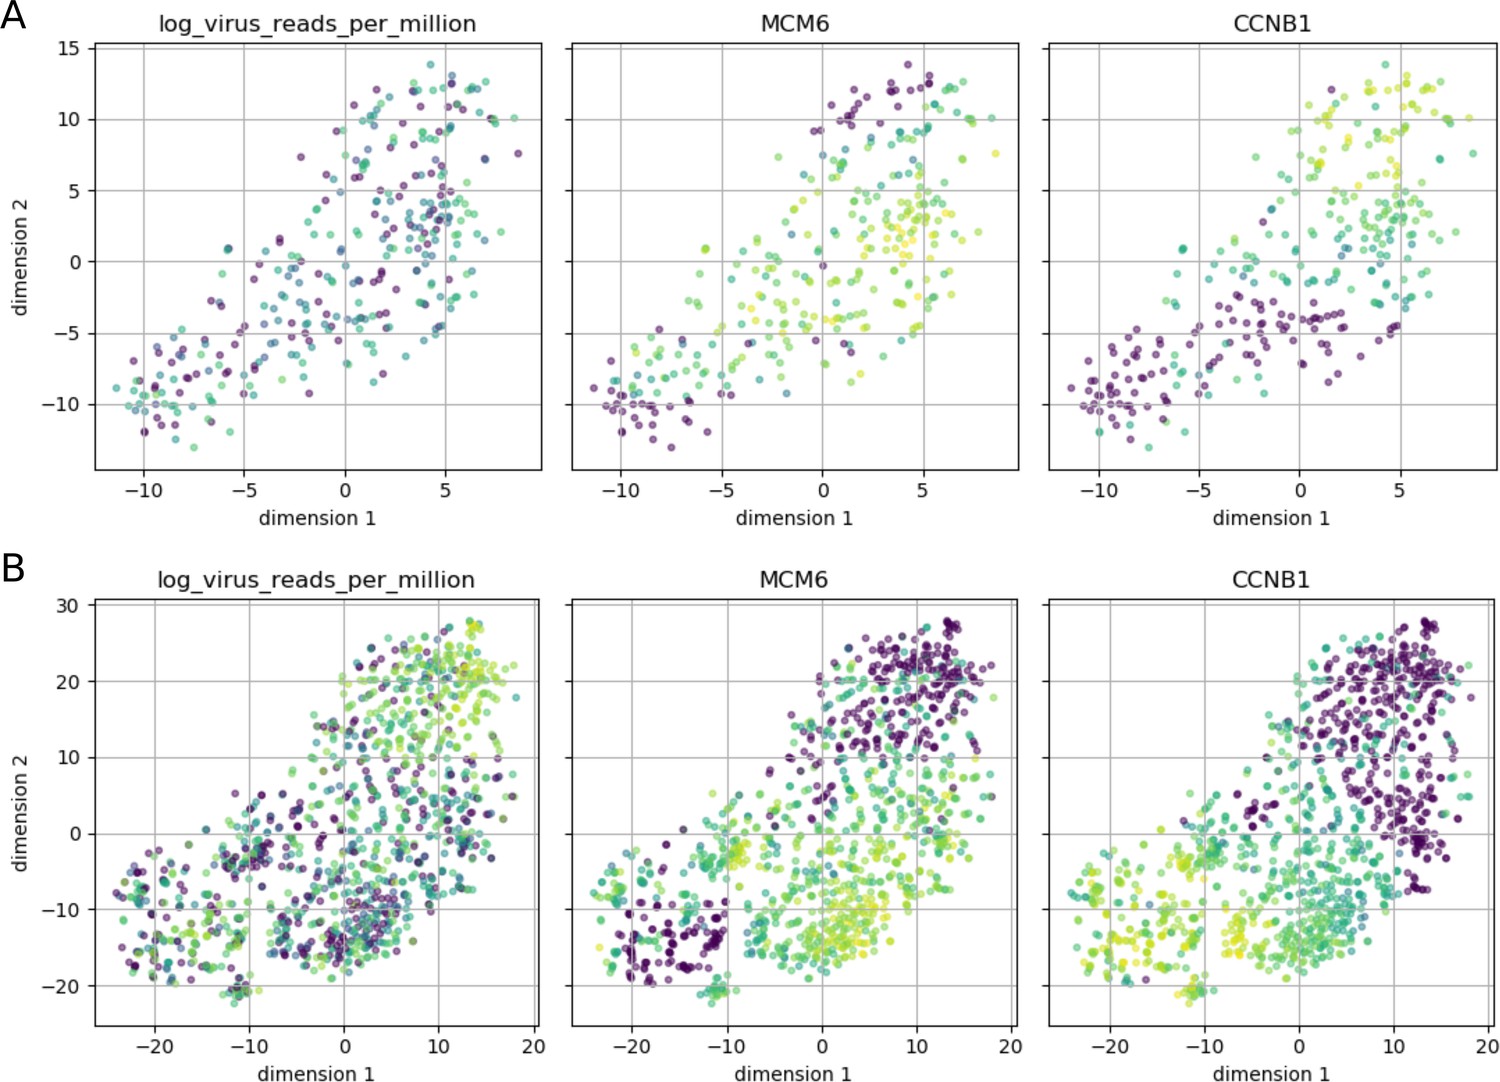
Cell cycle phase does not appear to affect intracellular DENV abundance.
Intracellular DENV abundance and the expression of two marker genes for G1-S versus G2-M are shown on top of a t-SNE representation of 23 marker genes (MCM2, UNG, CDC6, SLBP, PCNA, MCM6, RFC4, UBE2C, HMGB2, NUSAP1, BUB3, KIF22, ADGRG6, CCNB1, CKS2, KPNA2, UBE2S, CDC20, CENPF, HMGB3, PTTG1, BIRC5, SFPQ). Low expression/virus abundance is dark blue, intermediate expression/virus abundance is green, highest expression/virus abundance is yellow. Panel A is restricted to cells from the earliest time point (4 hr post-infection) and shows a clear separation of the two cell cycle phases, but cells from both can contain DENV RNA in similar amounts. Panel B includes all cells and highlights late infection; cells with high intracellular DENV abundance are negative for both cell cycle markers, indicating breakdown of normal cycling processes.
Figure 2—figure supplement 5
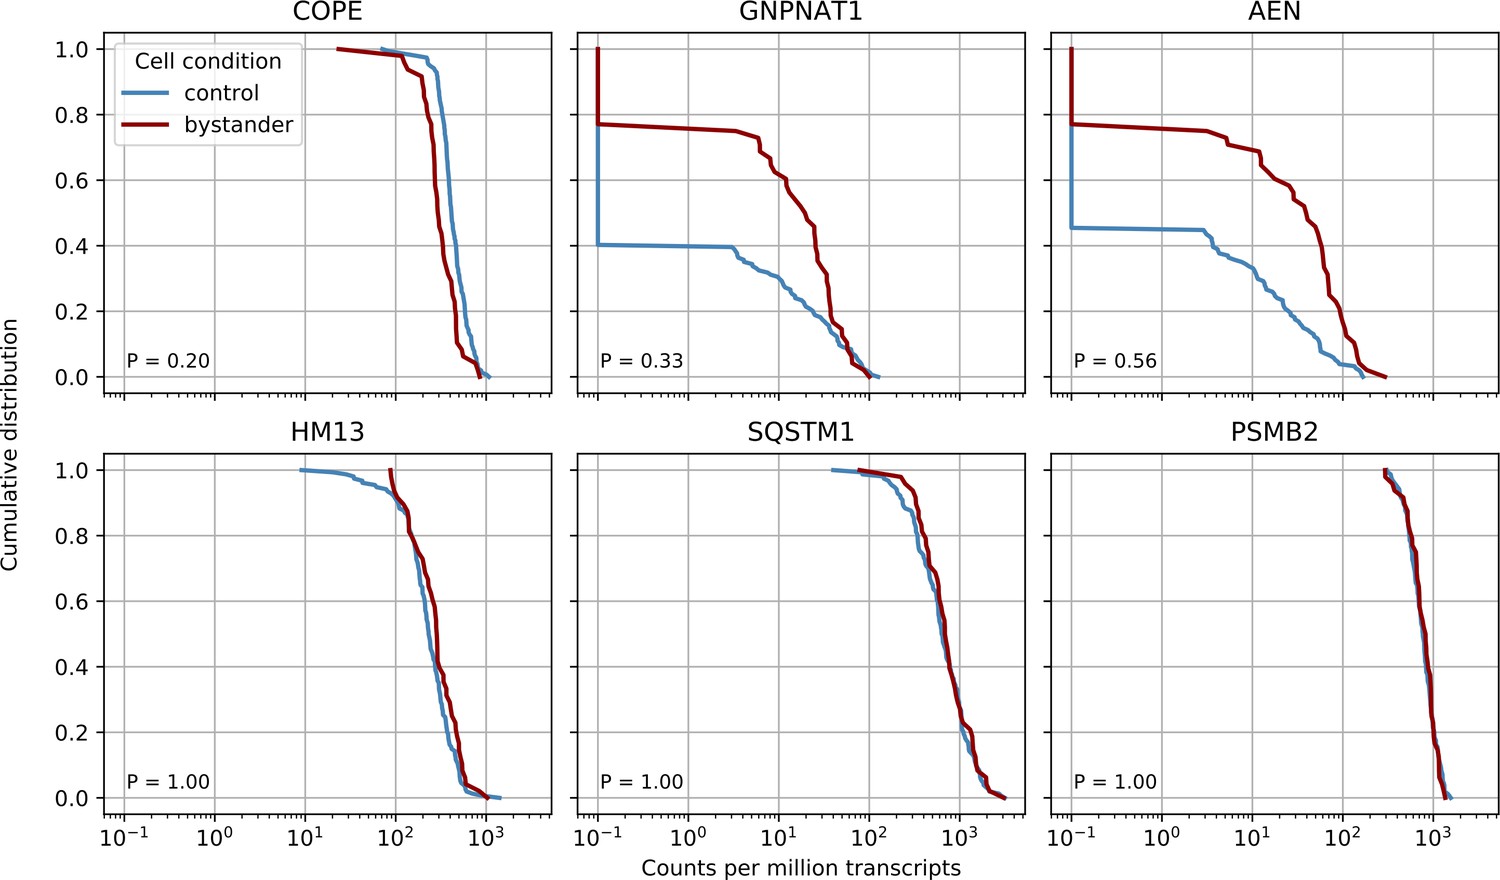
Bystander effects are not significant but suggestive for the COPE gene.
We compared control cells with cells from infected cultures but which had zero viral reads themselves (‘bystander cells’), from the earliest two time points (4 and 12 hr post-infection - in later cultures almost all cells had virus reads). We performed nonparametric Kolmogorov-Smirnov test on gene expression to detect differentially expressed genes in bystanders and found no significant result after Bonferroni correction, however the three most significant genes are plotted together with two ‘time switchers’ (HM13 and SQSTM1) and one control gene. The P value of the statistical test is shown in the bottom left corner of each plot. Whereas the other two time switchers show no difference, COPE may to be downregulated in bystander cells.
Figure 2—figure supplement 6

Gene expression versus vRNA level across all time points and MOIs during DENV infection for members of the translocon (SEC61), TRAP complex, signal recognition particle (SRP), signal peptidase complex (SPCS), oligosaccharide transfer complex (OST), plus two ribosomal proteins and two more proteins involved in ER translocation (HM13 and TRAM1).
https://doi.org/10.7554/eLife.32942.010
Figure 3 with 2 supplements
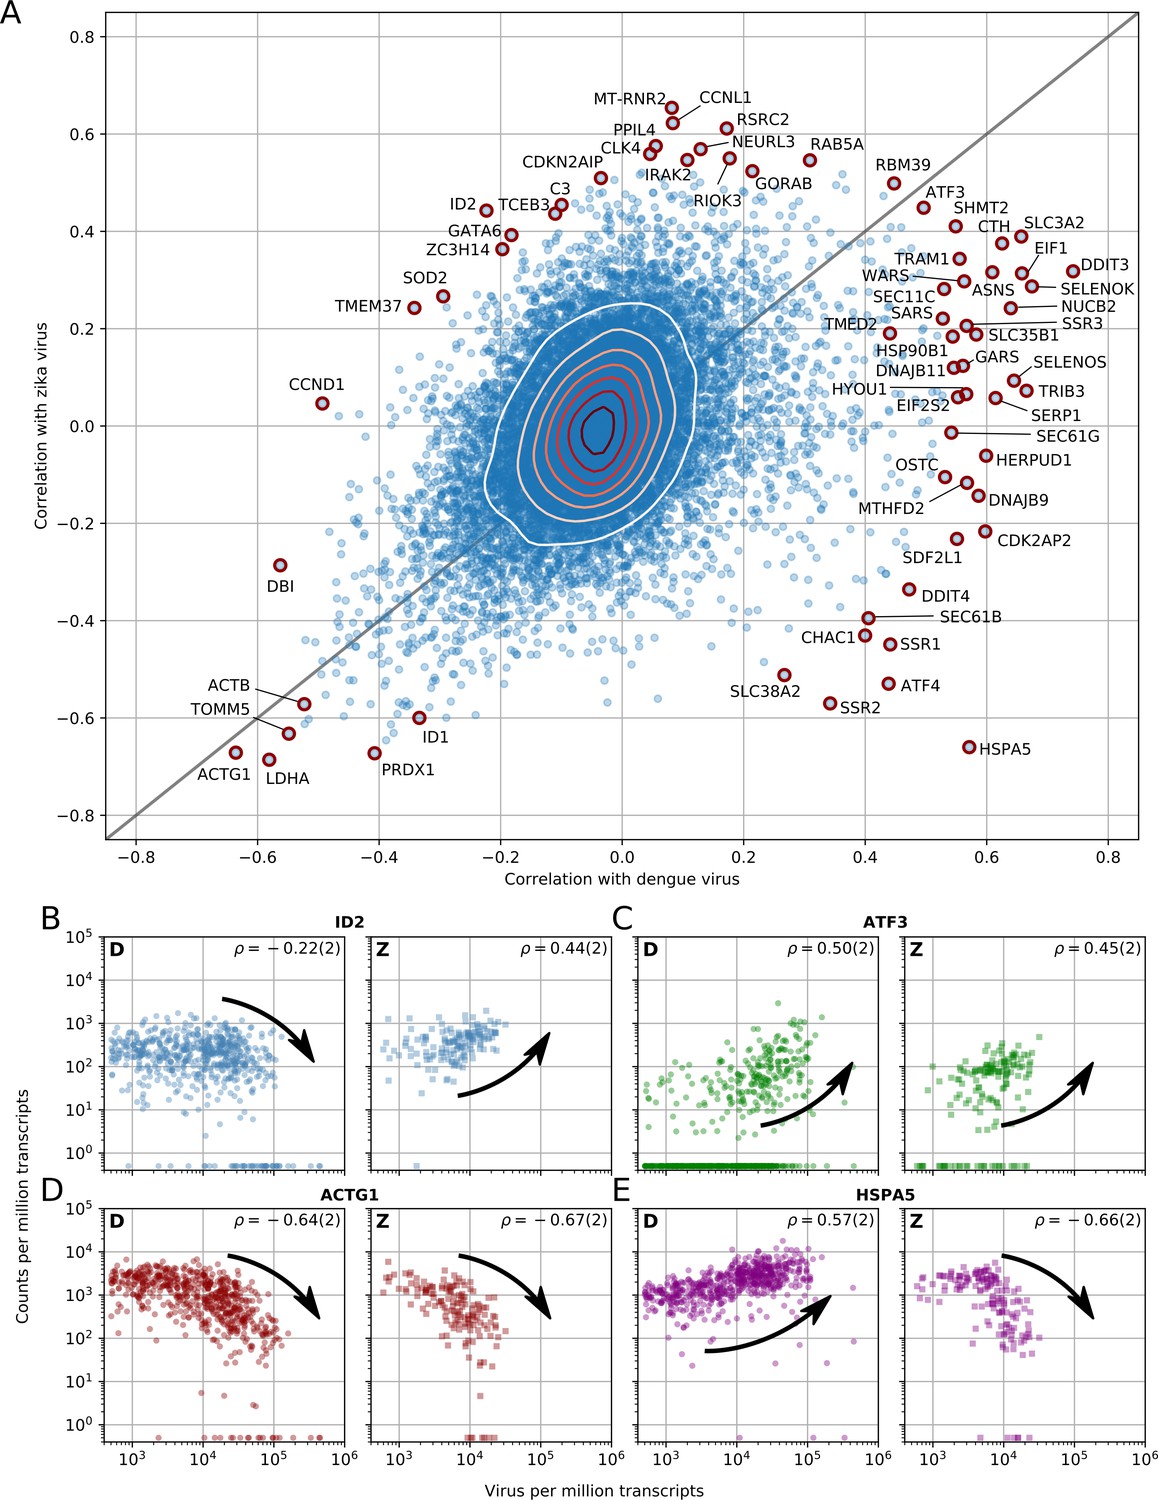
Dengue and Zika virus induce partially overlapping cellular responses.
(A) Correlation between gene expression and vRNA during Dengue virus versus Zika virus infection. Each dot is a gene and the contour lines indicate the an estimate of the density of genes. Most genes do not correlate with either virus, but some genes correlate strongly with different degrees of virus specificities. Only cells with 500 or more virus reads per million transcripts are used for this analysis (see main text). (B–E) Examples of genes with different behavior across the two viruses, as a scatter plot of gene expression versus vRNA content. Each dot is a single cell. Dengue plots are indicated by a D, Zika plots by a Z in the top left corner. Numbers in parentheses are standard deviations of 100 bootstraps over cells (uncertainties on the last digit).
Figure 3—figure supplement 1
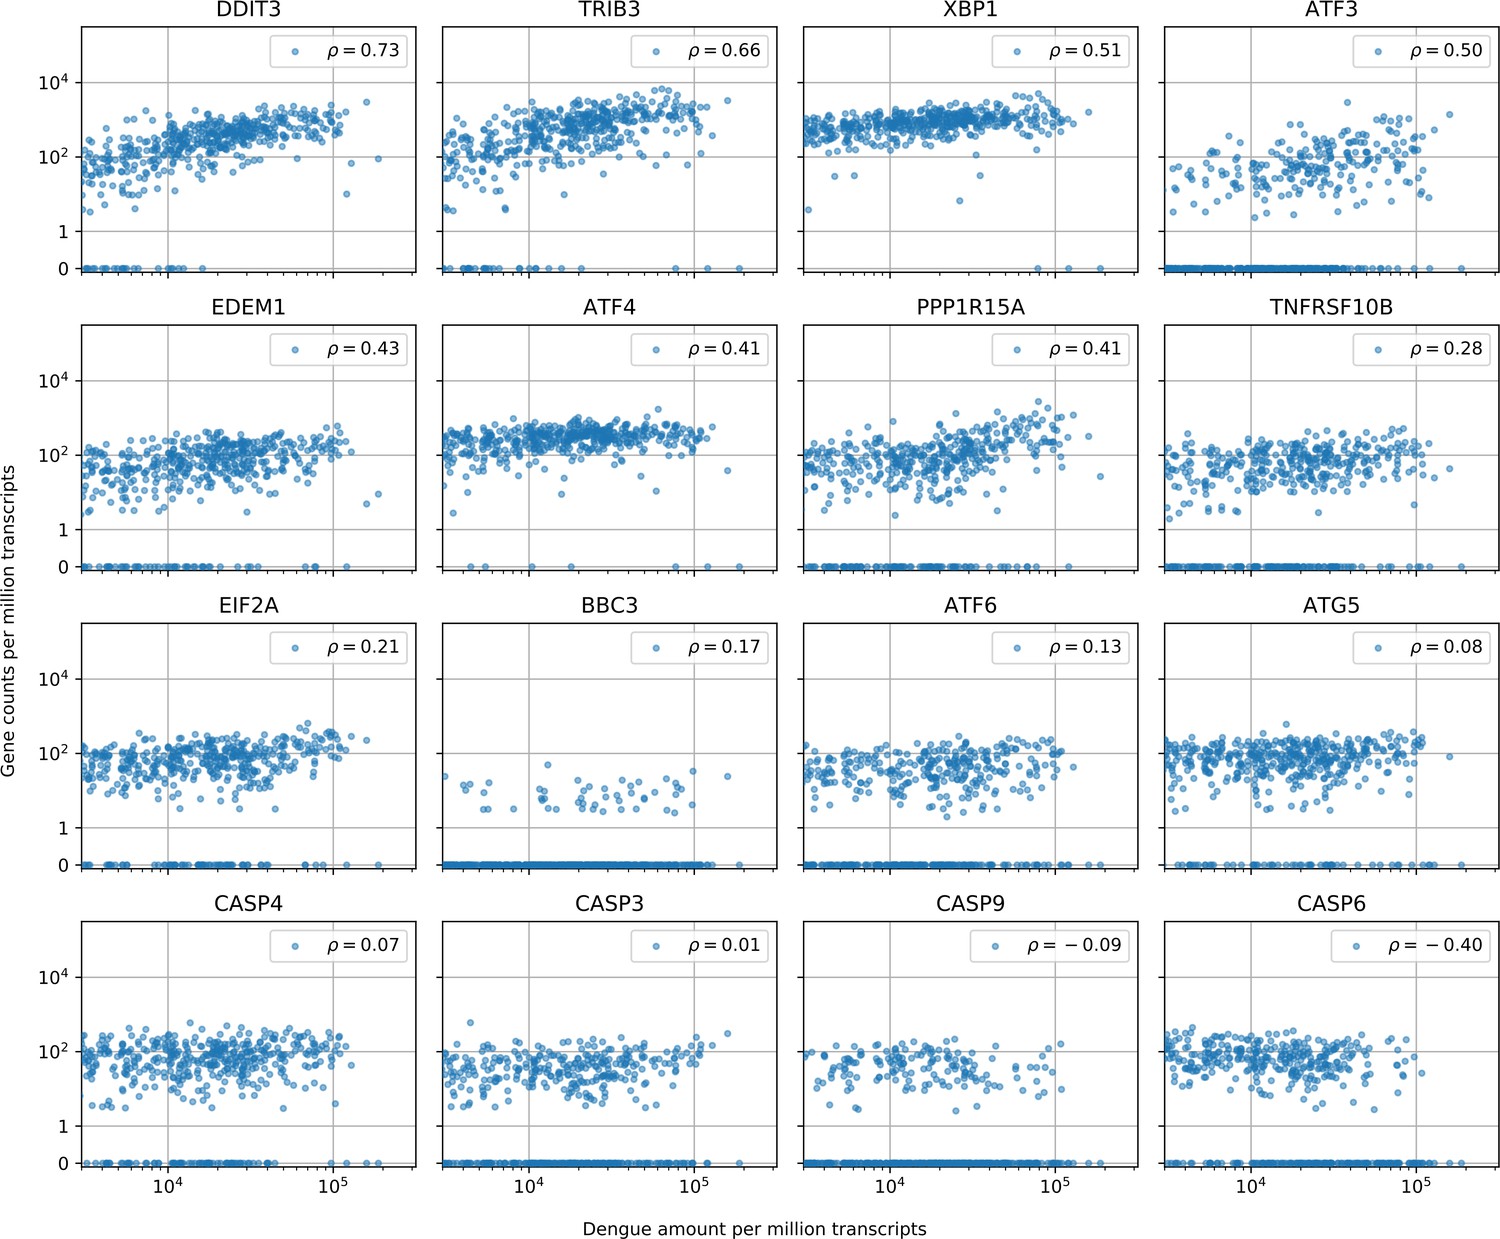
Cells with the highest intracellular DENV amounts show clear signs of prolonged ER stress response but no obvious sign of increased apoptosis.
In cells with more than 1000 virus reads per million transcripts, expression of clear effectors of apoptosis (e.g. caspases) does not show a strong correlation with virus amounts - CASP6 actually shows a negative correlation -, but DDIT3/CHOP and its downstream targets TRIB3 and PPP1R15A/GADD34, which are usually assumed as mediator of apoptosis, all show distinctive upregulation in cells with large intracellular virus amounts (Sano and Reed, 2013; Szegezdi et al., 2006). Positive regulator of apoptosis BBC3/PUMA shows a modest correlation of 0.17. Genes are sorted by correlation with intracellular DENV amount.
Figure 3—figure supplement 2
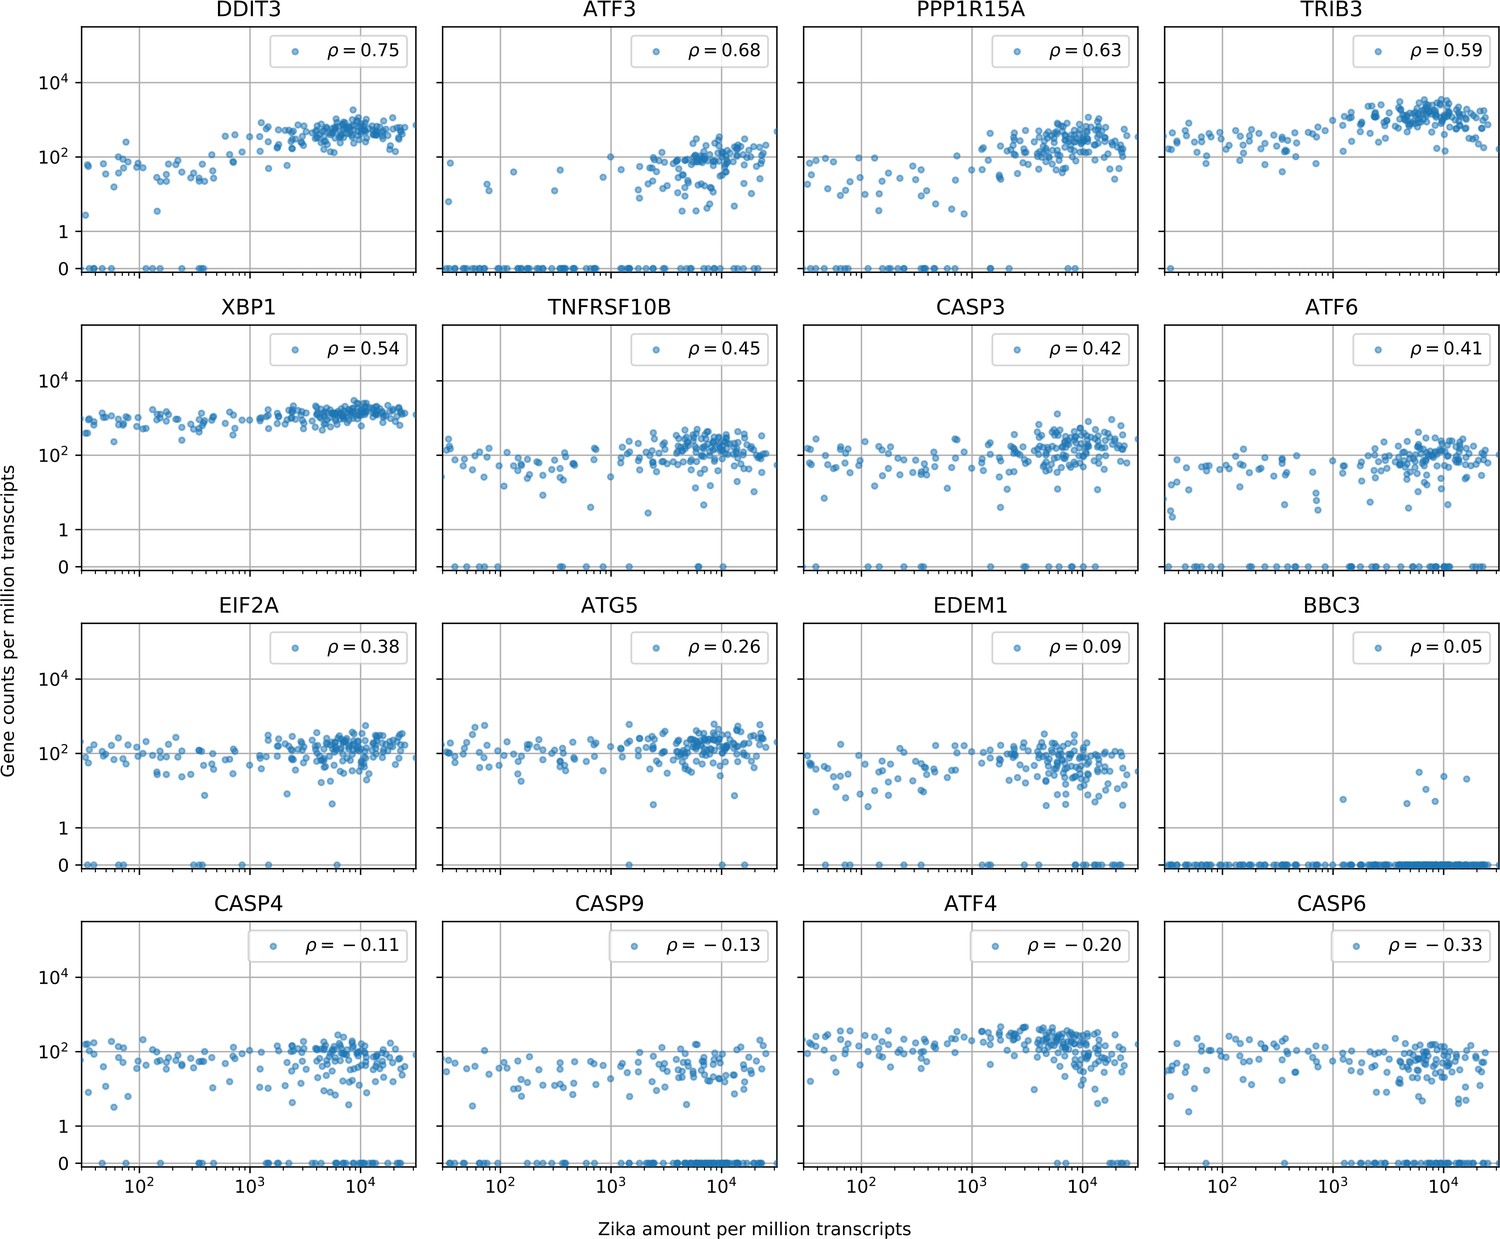
Cells with the highest intracellular ZIKV amounts show ER stress response, increased CASP3 and reduced ATF4 expression.
Similar to Figure 3—figure supplement 1 (which is for DENV). In cells with more than 10 Zika virus reads per million transcripts, expression of caspases is not correlated with intracellular virus amount with the exception of CASP3 (positive correlation, unlike for DENV) and CASP6 (negative correlation, like for DENV). A major difference between the two viruses is the expression of ATF4 and EDEM1, the other ER stress response genes behaving in a similar manner for both viruses. Genes are sorted by correlation with intracellular ZIKV amount.
Figure 4
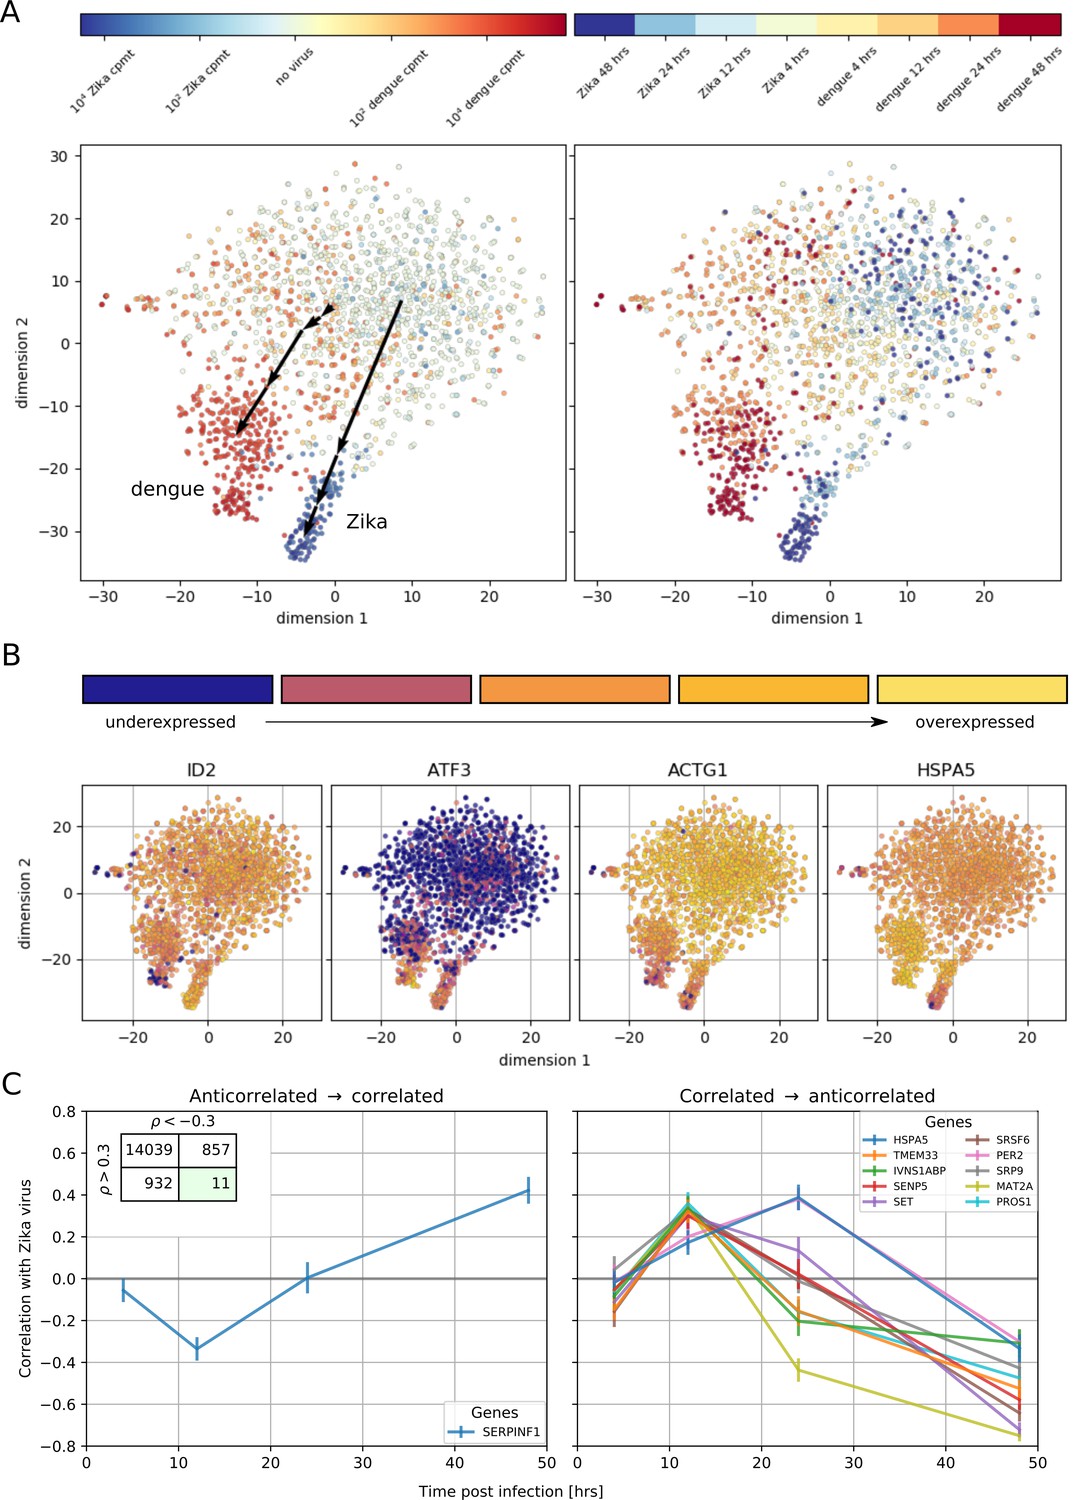
Temporally complex expression patterns during dengue and Zika infection.
(A) t-SNE dimensionality reduction using all genes that correlate with at least one virus (<−0.4 or >0.4). Each dot is a cell and is colored by intracellular virus abundance (left panel) and time post-infection (right panel). Colors are shades of red for the dengue experiment, shades of blue for the Zika one. Arrows in the left panel indicate the average position of cells at increasing intracellular virus abundance. (B) Expression of four example genes as in Figure 3B–E on top of the t-SNE visualization. (C) Correlation between expression and Zika vRNA content switches from negative to positive (< −0.3 to >+0.3) for one gene (left panel) and in the opposite direction for 10 genes (right panel). Error bars are standard deviations of 100 bootstraps over cells. Unlike in dengue virus infection (Figure 2G), the temporal traces of Zika infection do not show a simple increase or decrease but rather complex dynamics.
Figure 5 with 2 supplements
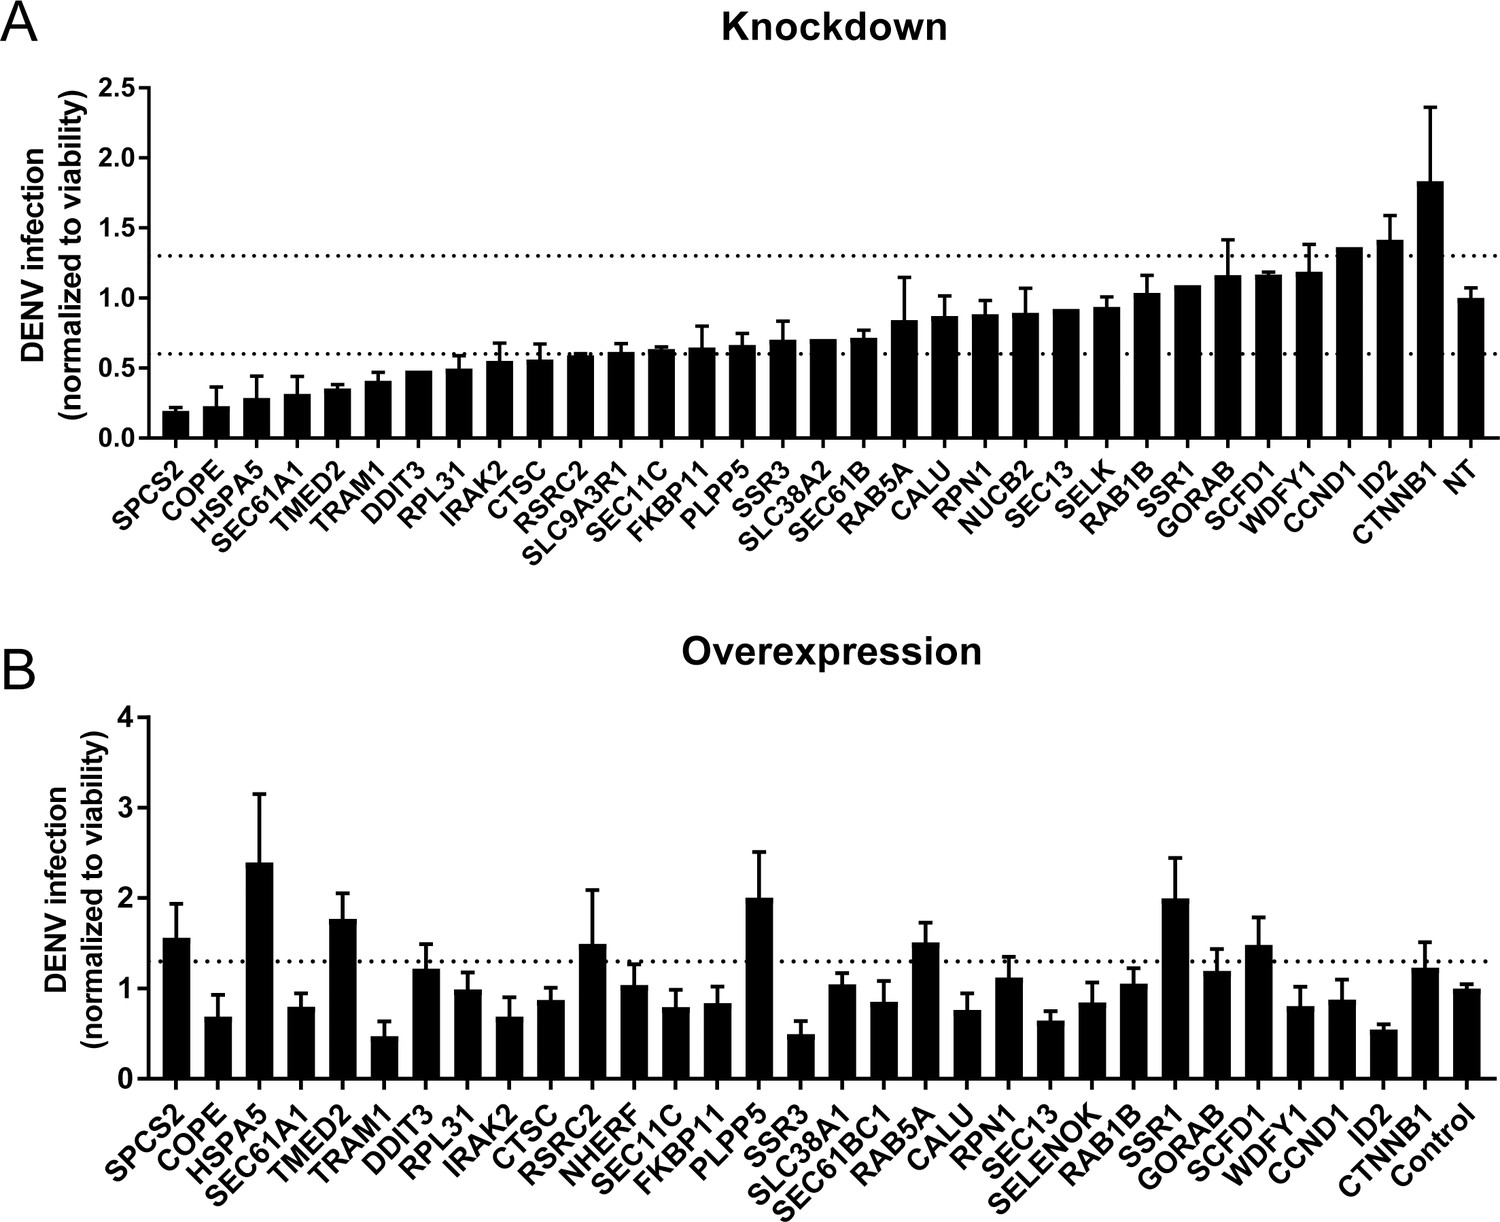
Validation of DENV proviral and antiviral candidate genes via siRNA-mediated knockdown and ectopic expression.
DENV infection relative to NT siRNA (A) or empty plasmid (B) controls following siRNA-mediated knockdown (A) or overexpression (B) of the indicated host factors measured by luciferase assays at 48 hr post-infection of Huh7 cells and normalized to cell viability. Both data sets are pooled from two independent experiments with three replicates each. The dotted lines represent the cutoffs for positivity. Cellular viability measurements are shown in Figure 2—figure supplement 2.
Figure 5—figure supplement 1

siRNA (A) and ectopic expression (B) screens testing the involvement of the indicated host factors in DENV infection.
Overall DENV infection (black) measured by luciferase assays and relative cell viability (grey) measured by alamarBlue assays at 48 hr post-infection of siRNA-transfected or ectopically expressing Huh7 cells. Data are expressed relative to NT siRNA (A) or empty plasmid control (B). Data are an average of two independent screens with three replicates each. The dotted lines represent the cutoffs for positivity.
Figure 5—figure supplement 2
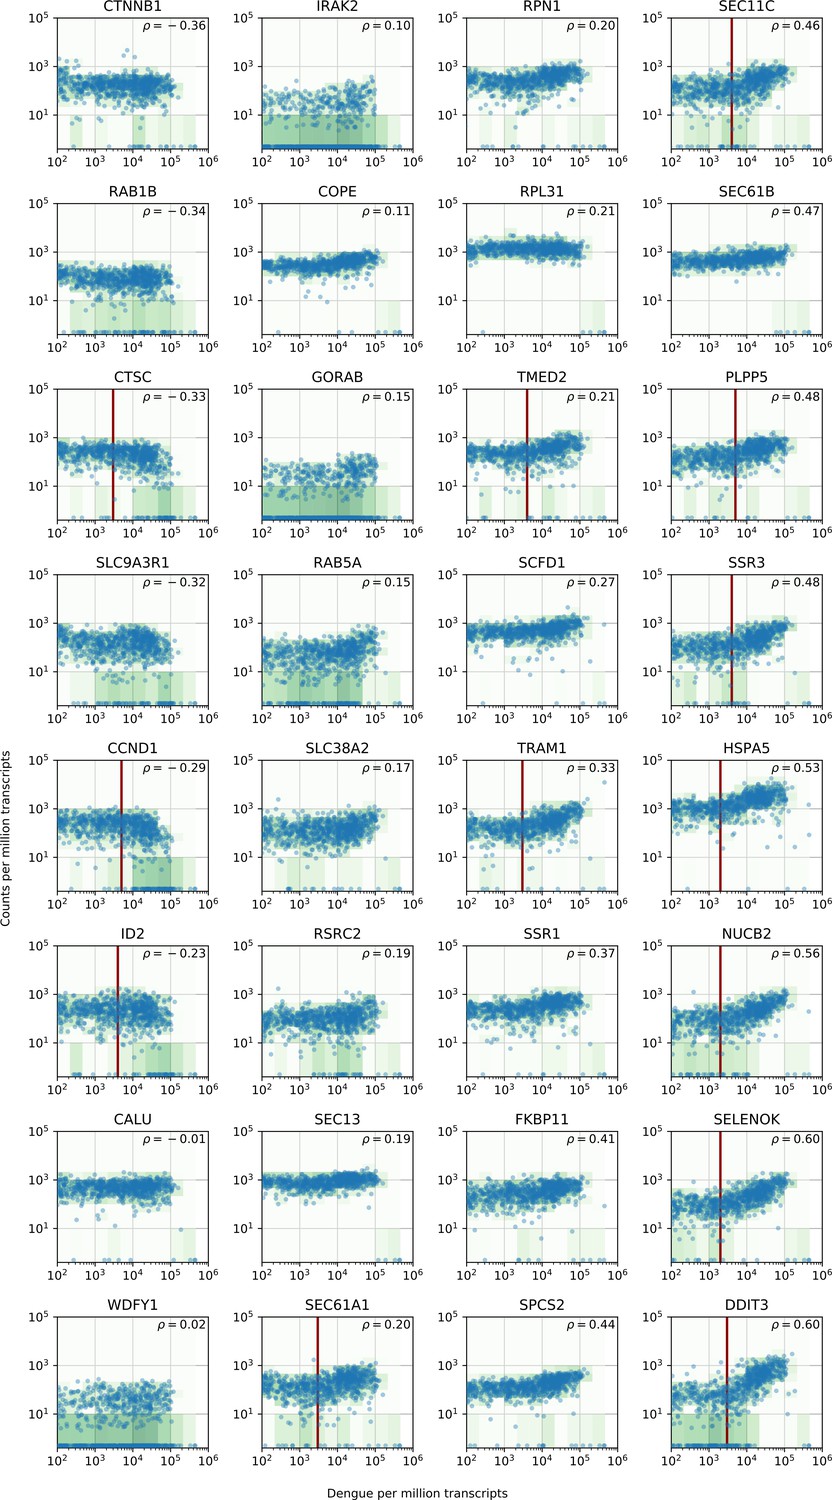
vRNA level versus gene expression across all time points and MOIs during DENV infection for 32 genes with interesting dynamics that were picked for validation via loss-of-function and gain-of-function experiments.
https://doi.org/10.7554/eLife.32942.017Additional files
-
Supplementary file 1
Number of cells processed and sequenced for each of the conditions - virus, time, MOI.
Having around 100 high-quality cells within each experiment (2127 cells in total) allows for great statistical power compared to bulk assays which usually provide only a handful of replicates.
- https://doi.org/10.7554/eLife.32942.018
-
Supplementary file 2
Gene Ontology (GO) enrichment analysis for genes that are positively correlated (>=0.3) with intracellular virus abundance for both dengue and Zika virus highlights response to ER stress via the unfolded protein response (UPR), especially the PERK branch.
- https://doi.org/10.7554/eLife.32942.019
-
Supplementary file 3
Gene Ontology (GO) enrichment analysis for genes that are negatively correlated (<=−0.3) with intracellular virus abundance for both dengue and Zika virus indicates enrichment of metabolic processes including nucleotide biosynthesis and mitochondrial electron transport.
- https://doi.org/10.7554/eLife.32942.020
-
Supplementary file 4
Catalogue numbers, sequences, and other details on the siRNA probes used for the loss-of-function validation.
- https://doi.org/10.7554/eLife.32942.021
-
Supplementary file 5
ORFeome clones used for constructing overexpression plasmids.
Genes without BC number means they are not available in Orfeome library and one of us (SYP) cloned their entries manually.
- https://doi.org/10.7554/eLife.32942.022
-
Supplementary file 6
i5 illumina-compatible index sequences for high plexity sequencing.
- https://doi.org/10.7554/eLife.32942.023
-
Supplementary file 7
Gene counts and metadata for all cells.
This file is the recommended starting point for secondary analyses.
- https://doi.org/10.7554/eLife.32942.024
-
Transparent reporting form
- https://doi.org/10.7554/eLife.32942.025
Download links
A two-part list of links to download the article, or parts of the article, in various formats.
Downloads (link to download the article as PDF)
Open citations (links to open the citations from this article in various online reference manager services)
Cite this article (links to download the citations from this article in formats compatible with various reference manager tools)
Single-cell transcriptional dynamics of flavivirus infection
eLife 7:e32942.
https://doi.org/10.7554/eLife.32942


