BK channel inhibition by strong extracellular acidification
- Washington University School of Medicine, United States
Figures
Figure 1 with 1 supplement
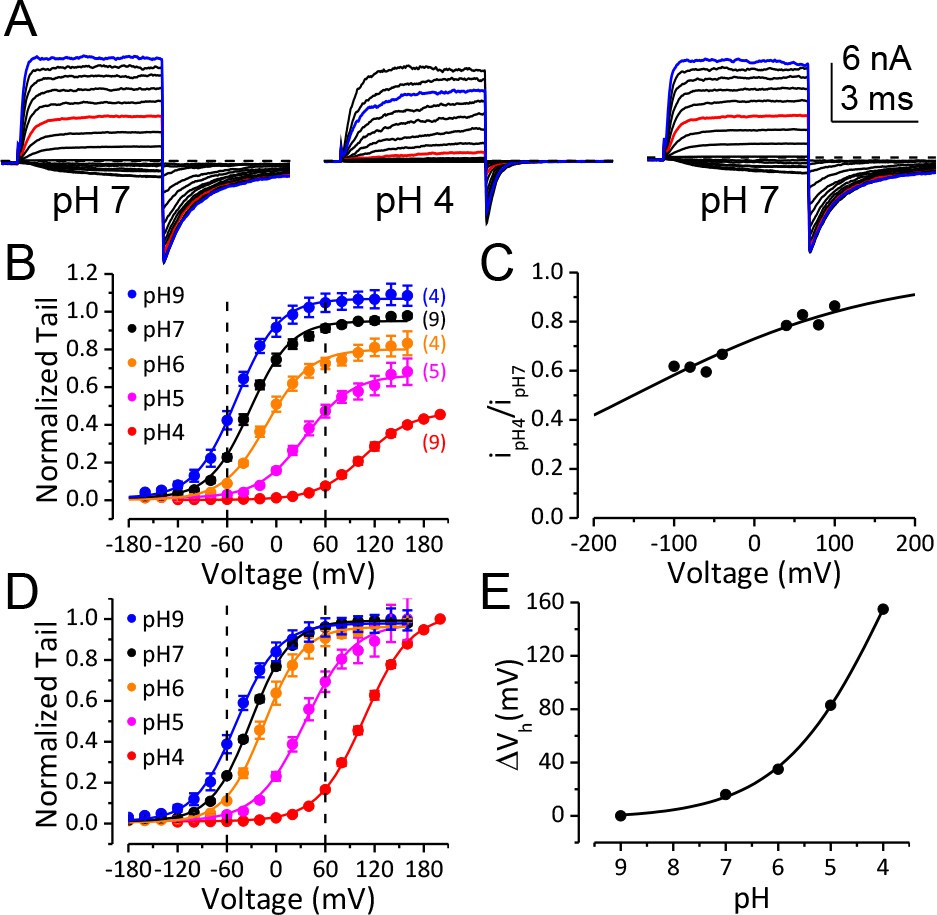
BK channel activation is strongly inhibited when pHO is lower than 5.
(A) Macroscopic BK currents recorded from an outside-out patch perfused with extracellular solutions at pH 7 (left), pH 4 (middle), and back to pH 7. Currents were evoked by steps from −160 to +160 mV at pHO 7 and by steps from −160 mV to +200 mV at pHO 4 (20 mV increments). The pre- and post-test pulse voltages were −140 and −120 mV, respectively. 300 μM Ca2+ was included in pipette (intracellular) solution. The red traces were evoked by +60 mV pulses to highlight the much larger fractional reduction in outward current at this voltage compared to that at +160 mV (blue traces). (B) G-V curves of BK channel generated from tail currents recorded at various pHOs with values normalized to the maximum value at pHO 7. Physiologically relevant voltage range (±60 mV) is marked by two vertical dotted lines here and in panel D. Boltzmann fit results (solid lines) are Gmax = 1.06 ± 0.01, z = 0.97 ± 0.03 e, Vh = −48.8 ± 1.0 mV (pH 9), Gmax = 0.95 ± 0.01, z = 1.00 ± 0.04 e, Vh = −32.4 ± 1.2 mV (pH 7), Gmax = 0.80 ± 0.01, z = 0.97 ± 0.06 e, Vh = −11.7 ± 1.8 mV (pH 6), Gmax = 0.66 ± 0.01, z = 0.86 ± 0.05 e, Vh =+34.8 ± 2.3 mV (pH 5), Gmax = 0.46 ± 0.02, z = 0.90 ± 0.09 e, Vh =+107 ± 3.7 mV (pH 4). The number in parentheses is the number of experiments contributing to each G-V relationship. (C) Voltage-dependent change of BK single channel current induced by extracellular acidification. The filled dots are fractional BK single channel current amplitude determined over the voltage range of ±100 mV when pHO changed from 7 to 4. The Woodhull model (refer to Materials and methods) fit results (solid line) are: kd0 = 0.27 ± 0.02 mM (pH 3.6) and δ = 0.17 e ± 0.02. The prediction of fractional BK single channel current amplitude by the Woodhull model is extended to ±200 mV. Note that the residual single channel current at −120 mV at pHO 4.0 is predicted to be 0.55 of that at pHO 7.0, which is comparable to the Gmax at pHO 4 in panel B. (D) BK G-V curves as those shown in panel B, but with the values at each pHO normalized to the maximum value within that pHO. Boltzmann fit results (solid lines) are Gmax = 0.97 ± 0.01, z = 0.98 ± 0.04 e, Vh = −48.3 ± 1.1 mV (pH 9), Gmax = 0.98 ± 0.01, z = 1.05 ± 0.04 e, Vh = −30.5 ± 1.1 mV (pH 7), Gmax = 0.96 ± 0.01, z = 1.04 ± 0.05 e, Vh = −14.5 ± 1.2 mV (pH 6), Gmax = 0.97 ± 0.01, z = 0.86 ± 0.04 e, Vh =+35.0 ± 1.6 mV (pH 5), Gmax = 1.01 ± 0.02, z = 0.90 ± 0.04 e, Vh =+107.6 ± 1.8 mV (pH 4). The Vh and z values are virtually identical to those determined from the G-Vs in Figure 1B. (E) Dose-response curve of BK gating shift (ΔVh) induced by extracellular H+. Hill equation (ΔVh=ΔVmax/(1+(IC50/[H+])n)) fit result (solid line) is: IC50 = 0.17 ± 0.28 mM (pH 3.8), n = 0.41 ± 0.07.
Figure 1—figure supplement 1
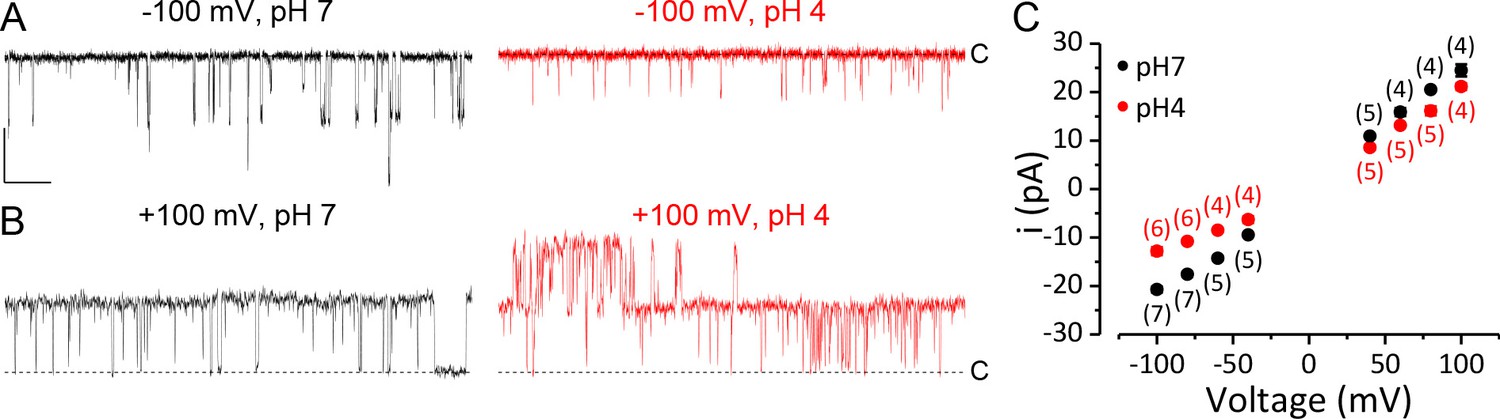
BK channel single channel current at various voltages and pHOs.
(A–B) Representative current traces for determining BK single channel current amplitude at different conditions. These traces were recorded from different outside-out patches due the large change in PO induced by the change of voltages and pHOs. [Ca2+]in was 300 μM for all these experiments. Closed level is marked by dotted line. All four traces are displayed at same scale for comparison. Scale bar: 20 pA vertical, 20 ms horizontal. (A) Single channel activity of BK channels at −100 mV at pHO 7 (left) or 4 (right). (B) Single channel activity of BK channels at +100 mV at pHO 7 (left) or 4 (right). (C) BK single channel i-V plot at pHO 7 (black dots) and 4 (red dots) over the voltage range of ±100 mV. The number in parentheses is the number of recordings for each data point and the error bars are smaller than the data points.
Figure 2
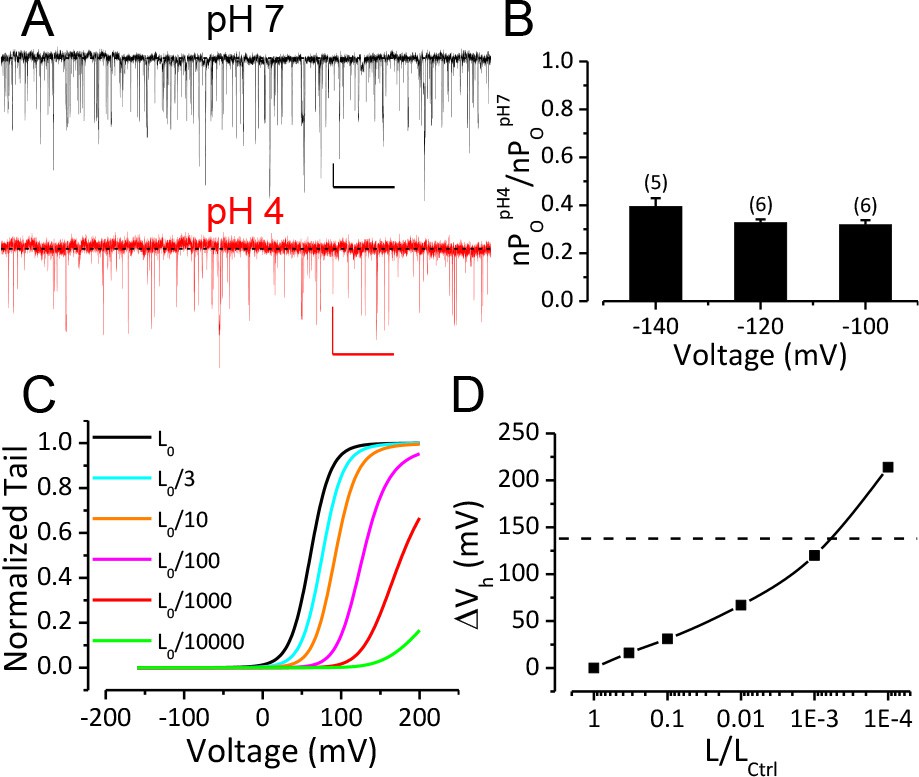
Reduction of BK C-O equilibrium constant L only accounts for a small portion of observed gating shift by extracellular acidification.
(A) BK single channel activity recorded from an outside-out patch held at −100 mV perfusing in solutions at pH 7 or pH 4. 10 μM Ca2+ was included in pipette solution. Opening is downward. The nPO of the trace at pH 7 is 0.067. The nPO of the trace at pH 4 is 0.03. Scale bars: 10 pA vertical, 50 ms horizontal. (B) Fractional nPO of BK channels when pHO is changed from 7 to 4 at three negative holding potentials (−100, −120, −140 mV). The number of patches obtained at each potential is listed above each column. There is no significant difference among values determined at these three holding potentials (p>0.05, one-way ANOVA). (C) G-V curves calculated using the H-A model with published parameters: Kd = 11 μM, C = 8, D = 24, E = 2.4, L0 = 10−6, VhC = 156 mV, zj = 0.58 e, zl = 0.3 e (Horrigan and Aldrich, 2002) to highlight the potential impact of changes in L0 (zero voltage C-O equilibrium constant). L0 is scaled down from the published value of 10−6 (black line, L0ctrl) to shift the G-V toward positive potentials. Vh is shifted by +16 mV when L0 is reduced to 0.33 × 10⁻⁶ (cyan line, L0ctrl/3). (D) Change of Vh plotted against fold-reduction in L0. The data points are connected by a cubic spline line with no physical meaning. Dotted line marks the change of Vh observed in our experiment when pHO was changed from 7 to 4.
Figure 3
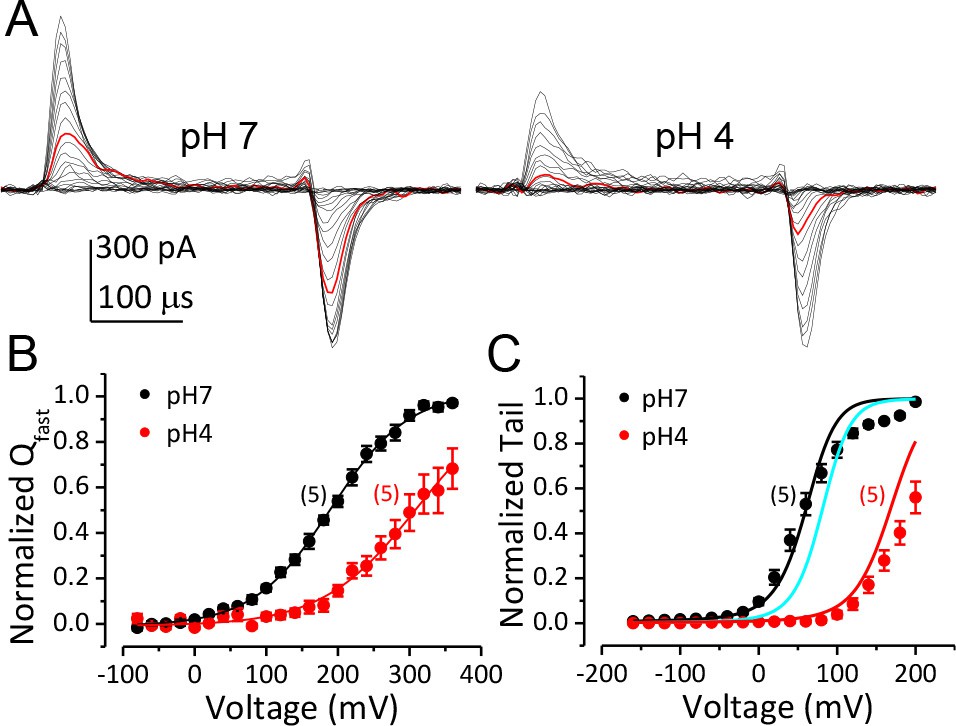
Inhibition of BK VSD activation is the primary mechanism for BK gating shifts induced by extracellular H+.
(A) BK gating currents recorded from a macropatch perfused at pHO 7 (left) or 4 (right). Test pulses were from −80 to +360 mV in 20 mV increments. Red traces were evoked by 200 mV test pulses. (B) Normalized QC-V relationship of BK at pHO 7 and 4 averaged from five experiments. Gray lines are Boltzmann fits (pH7: zj = 0.46 ± 0.02 e, VhC = 190.1 ± 2.7 mV, pH4: zj = 0.38 ± 0.02 e, VhC = 309.5 ± 2.8 mV). (C) BK G-V relationships at pHO 7 or 4 with 10 μM [Ca2+]in (n = 5). The G-V at pH 7 is fit with H-A model using published parameters (Horrigan and Aldrich, 2002) as initial values. zj and VhC are fixed at the values determined from the QC-V relationship at pH 7. The fit results are: Kd = 3 μM, C = 11, D = 24, E = 1, L0 = 2.7 × 10⁻⁶, zl = 0.1 e (black line). The cyan line is a G-V curve calculated using the H-A model with this same set of parameters except that L0 is reduced to 0.9 × 10⁻⁶. The red line is a G-V calculated using the H-A model with VhC and zj from the Boltzmann fit of QC-V at pHO 4 and reduced L0 (0.9 × 10⁻⁶).
Figure 4
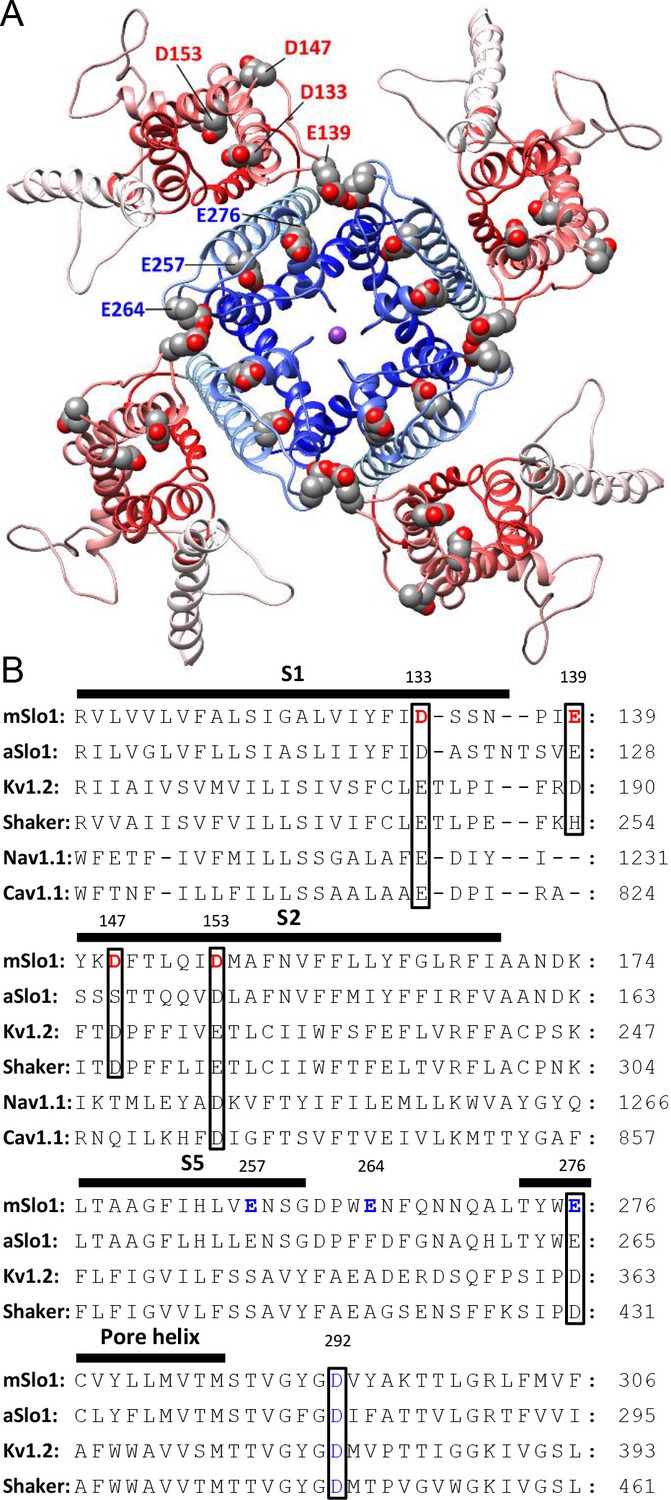
BK acidic residues potentially exposed to extracellular medium.
(A) mSlo1 homology model based on the cryo-EM structure of liganded Aplysia BK channel (PDB: 5tj6) viewed from the extracellular side. Acidic residues potentially exposed to extracellular solution are rendered as spheres with oxygen and carbon colored in red and gray, respectively. The BK VSDs and PGD are colored in red and blue, respectively. The purple dot in the center is K+. (B) Multiple sequence alignment of transmembrane segments containing extracellularly accessible acidic residues from mouse and Aplysia homologues of Slo1 (mSlo1, aSlo1), Kv channels (Kv1.2, Shaker), and human Nav1.1 and Cav1.1 channels. For the latter two channels, only the DIII VSD segments were included in the alignment. Extracellularly accessible acidic residues conserved among these channels are indicated by boxes. Residues examined in the present study are bold.
Figure 5
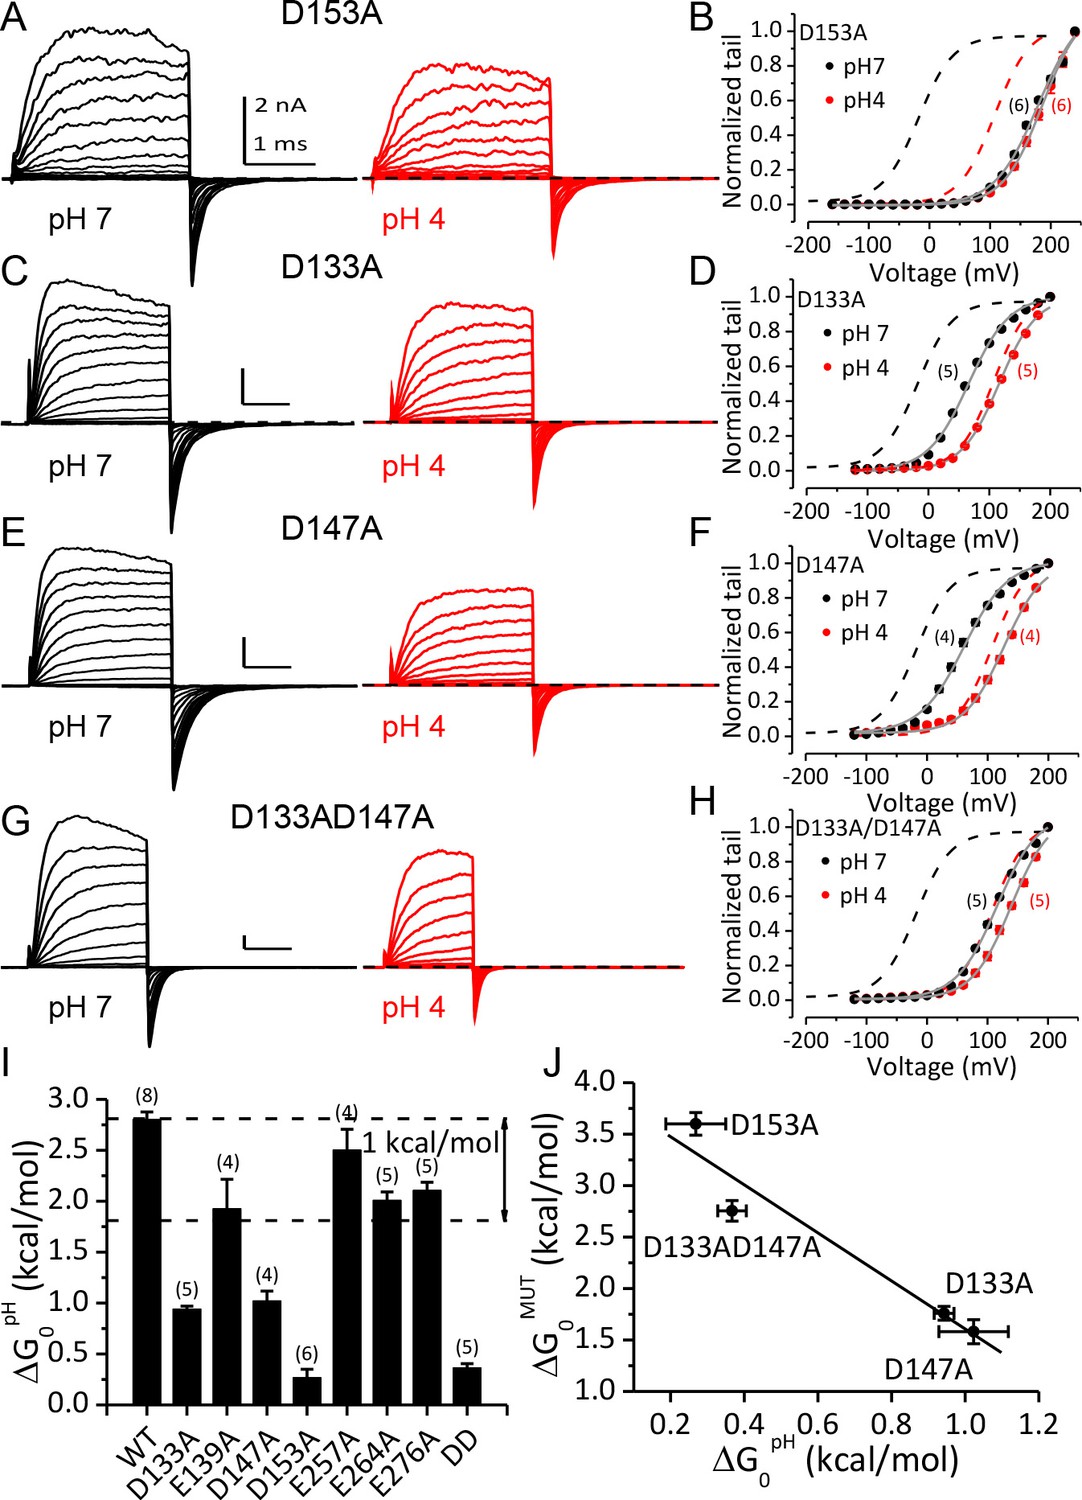
Acidic residues involved in BK inhibition induced by extracellular H+.
(A) Macroscopic currents of mSlo1D153A from an outside-out patch perfused at pHO 7 (left) or pHO 4 (right). The currents of D153A were evoked by steps from −160 to +240 mV with 20 mV increments. All other currents shown in this figure were evoked by steps from −120 to +200 mV (20 mV increments). All pipette (intracellular) solutions contained 300 μM Ca2+. (B) The G-V curves of D153A at pHO 7 or 4. The number of patches contributing to each set of G-V relationship is given in parentheses in this and following G-V plots. Boltzmann fit results (grey lines) are z = 0.70 ± 0.03 e, Vh = 179.4 ± 2.4 mV (pH 7), z = 0.78 ± 0.03 e, Vh = 186.4 ± 2.2 mV (pH 4), Gmax = 1.16 ± 0.03. Dotted lines in this and following G-V plots are the G-V curves of WT channels at pH7 (black) or 4 (red) with 300 μM [Ca2+]in (C) Macroscopic currents of mSlo1D133A at pHO 7 (left) or pH 4 (right). (D) The G-V curves of D133A at pHO 7 or 4. Boltzmann fit results (grey lines) are z = 0.76 ± 0.03 e, Vh = 66.1 ± 1.7 mV (pH 7), z = 0.81 ± 0.03 e, Vh = 116.2 ± 1.6 mV (pH 4), Gmax = 1.00 ± 0.02. (E) Macroscopic currents of mSlo1D147A at pHO 7 (left) or pH 4 (right). (F) The G-V curves of D147A at pHO 7 or 4. Boltzmann fit results (grey lines) are z = 0.70 ± 0.04 e, Vh = 60.8 ± 2.6 mV (pH 7), z = 0.77 ± 0.05 e, Vh = 126.7 ± 2.3 mV (pH 4), Gmax = 0.99 ± 0.02. (G) Macroscopic currents of mSlo1D133A147A at pHO 7 (left) or pH 4 (right). (H) The G-V curves of mSlo1D133AD147A at pHO 7 or 4. Boltzmann fit results (grey lines) are z = 0.74 ± 0.04 e, Vh = 115.6 ± 2.3 mV (pH 7), z = 0.78 ± 0.04 e, Vh = 138.9 ± 2.1 mV (pH 4), Gmax = 1.07 ± 0.03. (I) Change of gating equilibrium free energy by extracellular acidification(ΔG0pH) calculated from the Boltzmann fits of G-V curves. The number of experiments for each construct is listed above each column. (J) The change of gating equilibrium free energy by alanine substitution (ΔG0MUT) plotted against the change of gating equilibrium free energy by extracellular acidification (ΔG0pH). The solid line is a linear fit with R of 0.96. Standard error in ΔG0MUT (αΔG0MUT) is calculated according to: αΔG0MUT = (α2G0WT - α 2G0MUT) 1/2.
Figure 6

Potential interactions involving the three key residues in the BK VSD.
(A) The VSDs of metal-free (red) and liganded (blue) mSlo1 structures with three key acidic residues rendered as ball-and-chain and three conserved S4 arginines (homologous to Shaker R2, R3 and R4) rendered as sticks. The four dark purple dots are K+s in the BK selectivity filter, which are included as a reference for vertical displacement. The two structures are superimposed by the pore-loop. (B) D153 may form a hydrogen bond with R207 in the metal-free mSlo1 structure. The distance between the side chains of D153 and R210 is more than 6 Å, which is too far for hydrogen bonding. (C) D153 may form a hydrogen bond with R210 in the liganded mSlo1 structure. The distance between the side chains of D153 and R207 is more than 4 Å, which is also beyond the limit of effective hydrogen bonding. (D–E) The distances between the side chains of D133 and R207 in both the metal-free (D) and the liganded (E) structures are within 3 Å, allowing potential interaction between D133 and R207 in both conformations.
Additional files
-
Transparent reporting form
- https://doi.org/10.7554/eLife.38060.009
Download links
A two-part list of links to download the article, or parts of the article, in various formats.
Downloads (link to download the article as PDF)
Open citations (links to open the citations from this article in various online reference manager services)
Cite this article (links to download the citations from this article in formats compatible with various reference manager tools)
BK channel inhibition by strong extracellular acidification
eLife 7:e38060.
https://doi.org/10.7554/eLife.38060


