Structure of the human epithelial sodium channel by cryo-electron microscopy
- Oregon Health and Science University, United States
- Vollum Institute, Oregon Health and Science University, United States
- Department of Biomedical Engineering, Oregon Health and Science University, United States
Figures
Figure 1 with 4 supplements
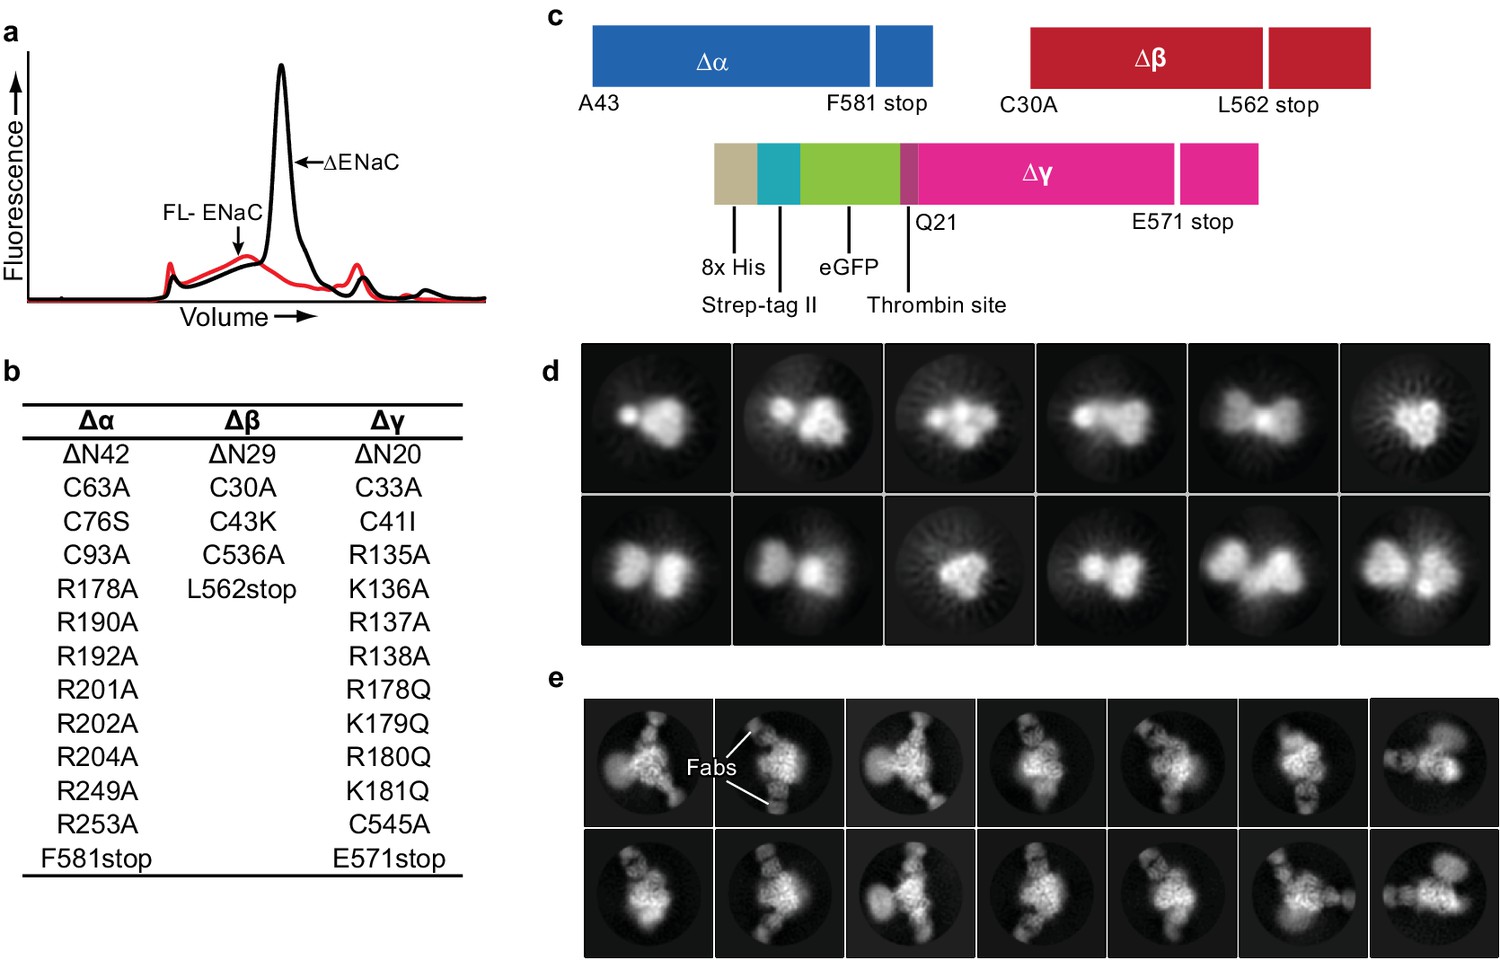
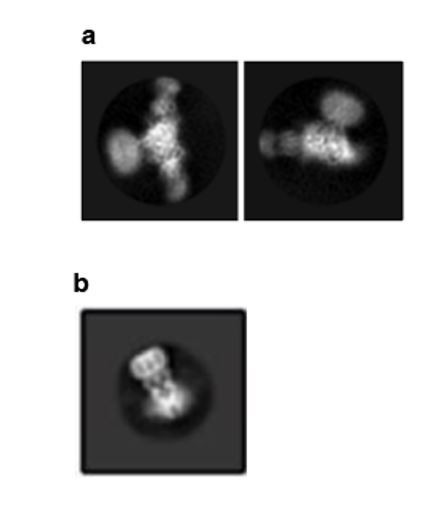
Creation and analysis of ∆ENaC.
(a) Representative FSEC traces of full-lenth ENaC (FL-ENaC, red) and ∆ENaC (black). (b) Summary of mutations in ∆ENaC. (c) Summary of ∆ENaC constructs. (d) Representative 2D class averages of ∆ENaC show that pseudosymmetry inherent in ENaC hampers particle alignment. (e) Representative 2D class averages of ∆ENaC-7B1/10D4 complex showing increased detail due to alignment aid from Fabs.
Figure 1—figure supplement 1
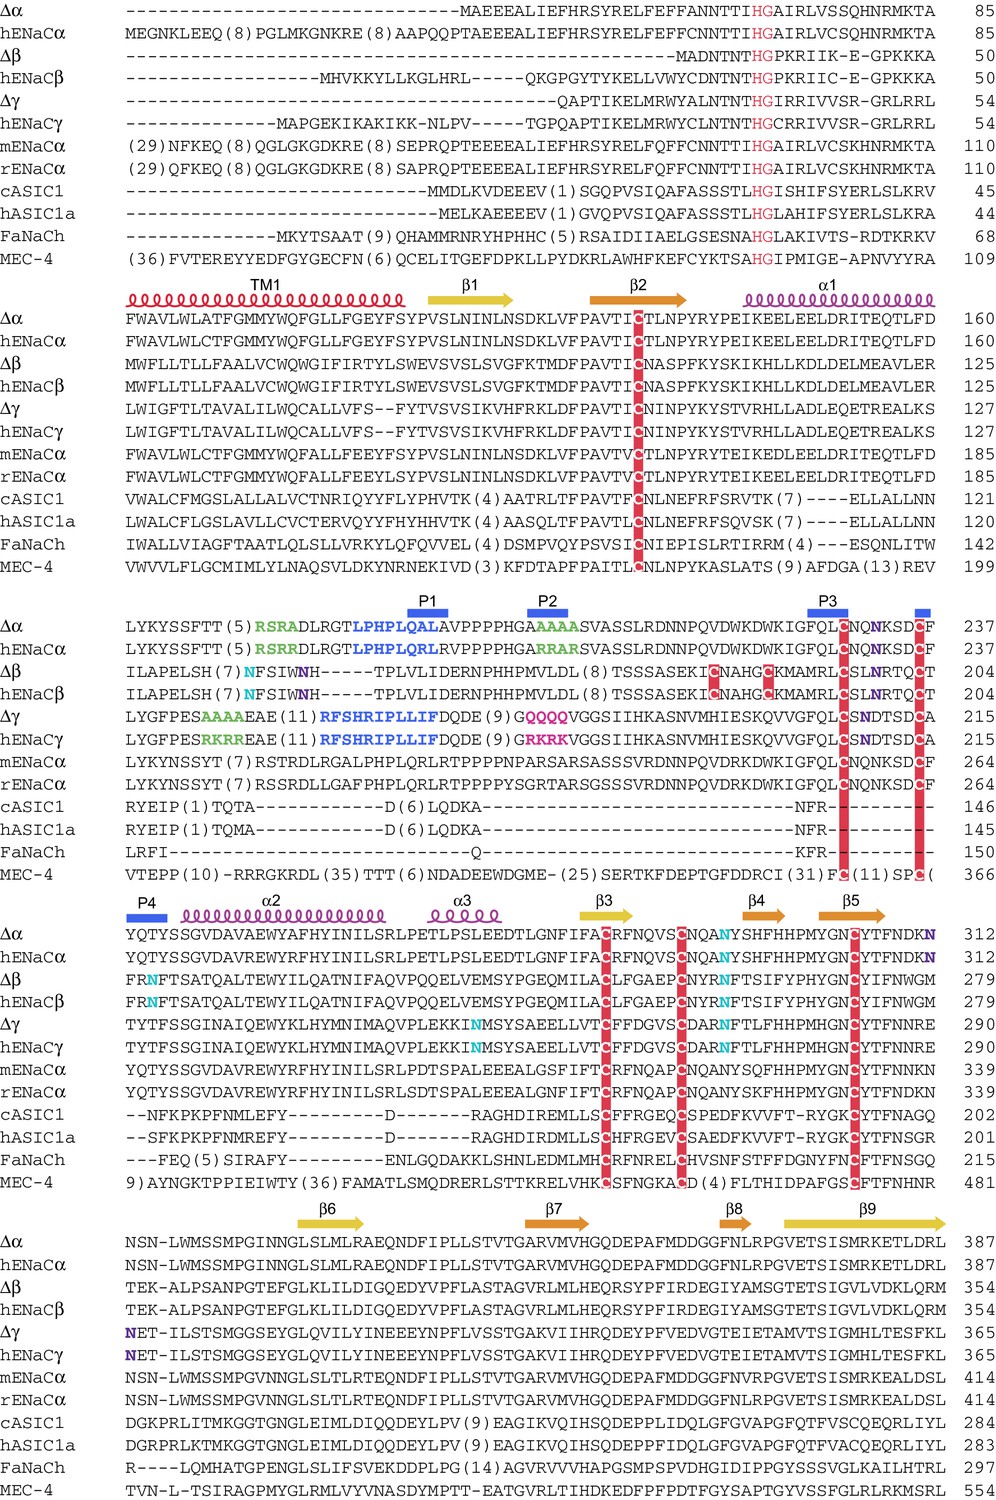
Sequence alignment of ENaC with other members of the ENaC/DEG superfamily (human ENaCα residues 1-387).
Sequence alignment of ∆ENaC with full-length ENaC from human (hENaCα, GenBank ID:4506815; hENaCβ, 124301096; hENaCγ, 42476333), chicken acid sensing ion channel (cASIC1a, 94957761), human (hASIC1a, 21536351), FMRF-amide activated sodium channel (FaNach, 1149511) and degenerin (MEC-4, 1297371). The sequences were aligned with Clustal Omega and manually adjusted. The secondary structure allocation is based on ∆β. Coloring or shading is as follows: HG motif and selectivity filter are in red, cysteines participating in disulfide bonds are in red boxes, glycosylation sites present in cryo-EM map in cyan, while predicted sites not observed in cryo-EM map are in purple, furin sites are in green, prostasin sites are in magenta, and the 8-mer and 11-mer peptides discussed in the main text are in blue.
Figure 1—figure supplement 2
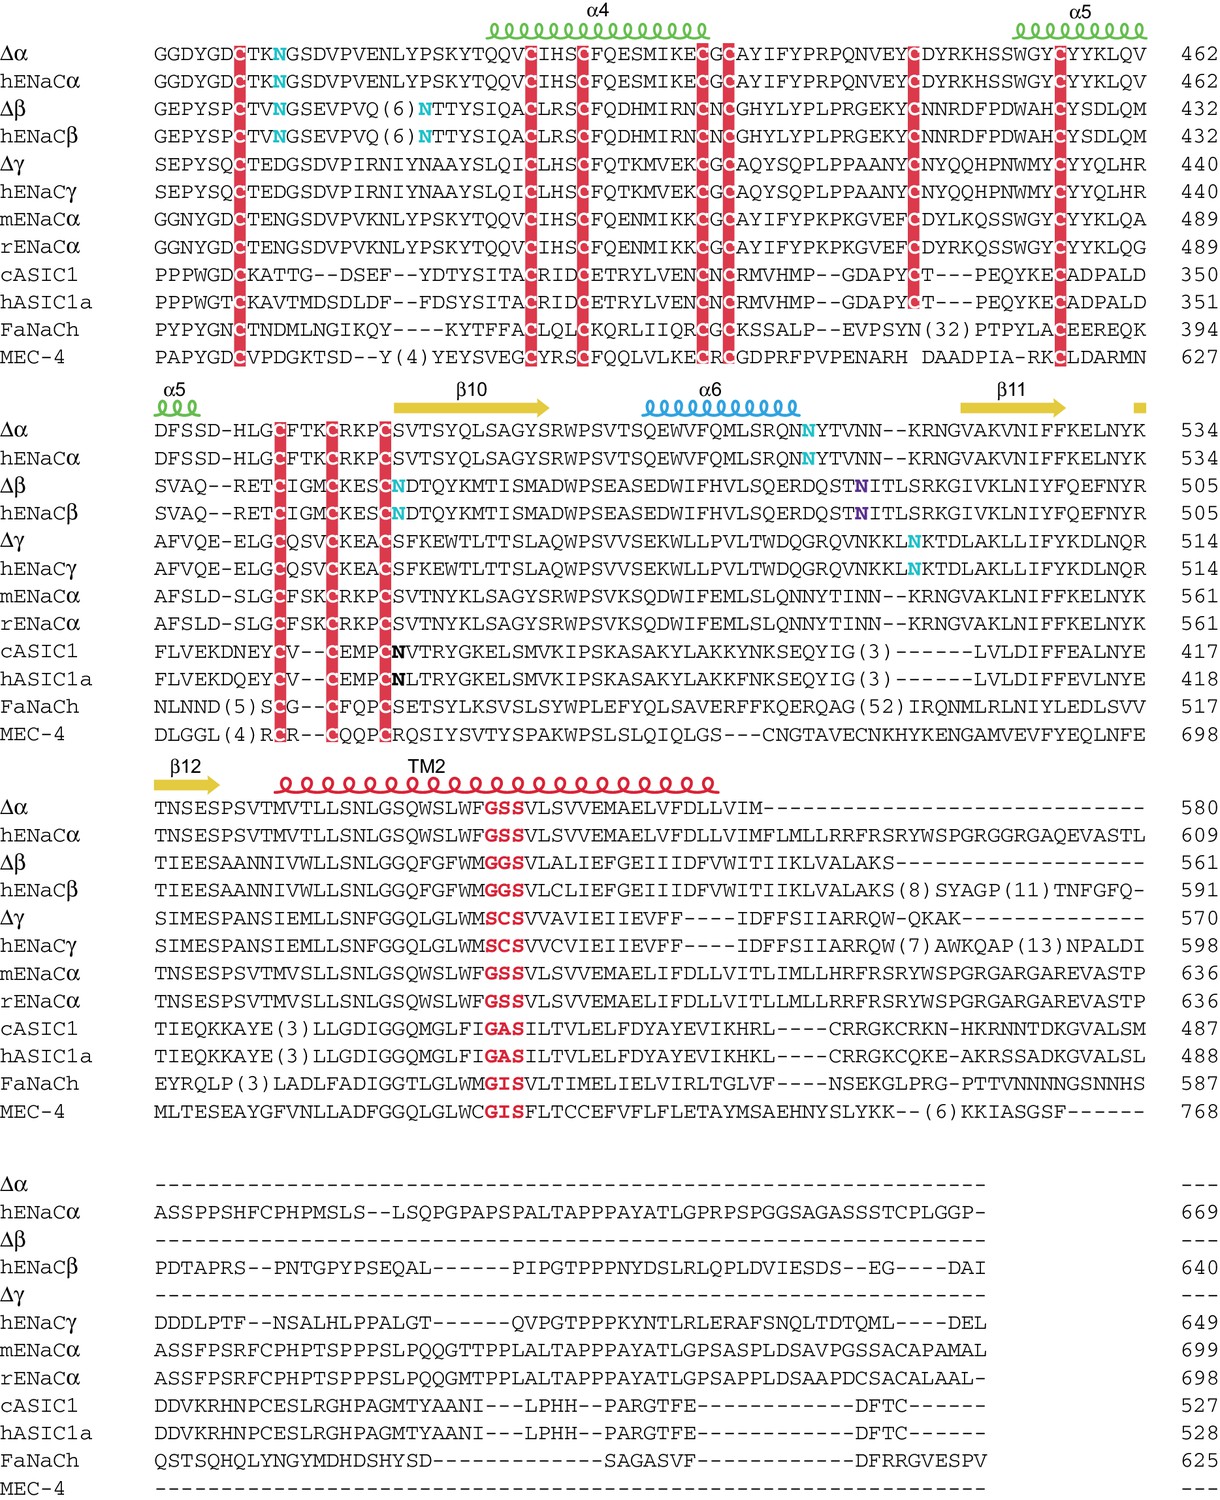
Sequence alignment of ENaC with other members of the ENaC/DEG superfamily (human ENaCα residues 388-669)
https://doi.org/10.7554/eLife.39340.005
Figure 1—figure supplement 3
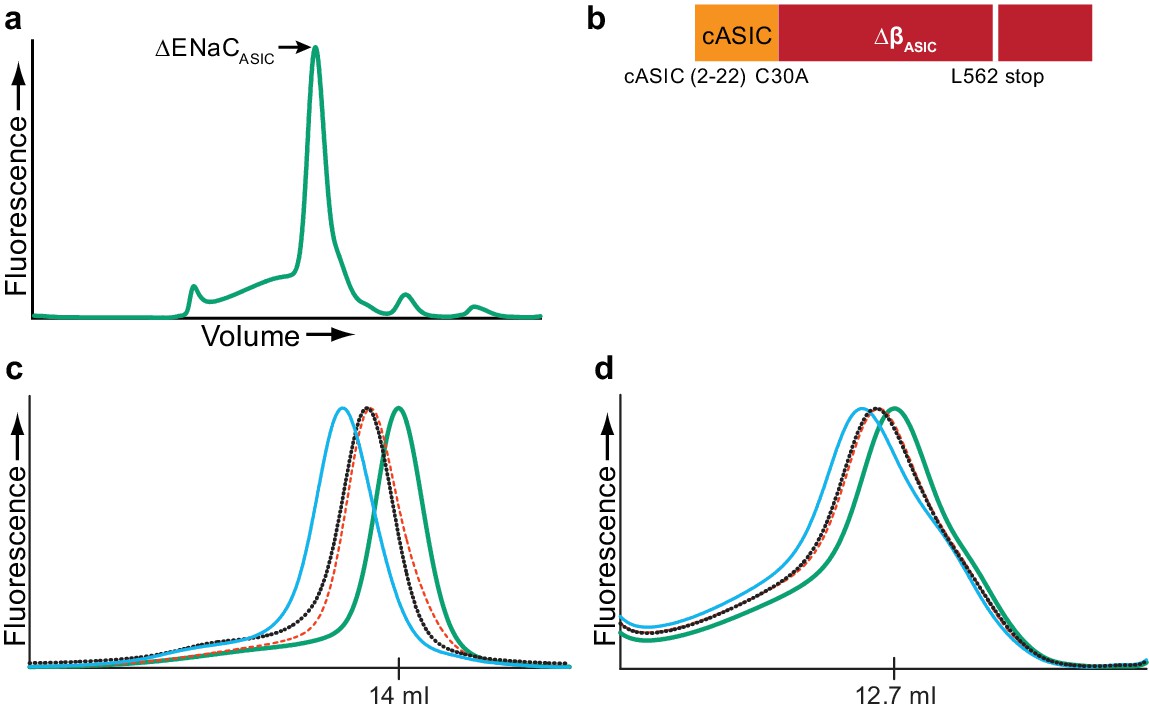
Fab generation.
(a) Representative FSEC trace of ∆ENaCASIC (b), which was used to generate Fabs. (c and d) Representative FSEC traces of ∆ENaC (c) and FL-ENaC (d) in complex with Fabs. The ∆ENaC and FL-ENaC (solid green trace) were expressed in suspension-adapted GnTI- and HEK 293T/17, respectively, using baculovirus. The binding of one (red and black dotted traces) or both (solid blue trace) Fabs incrementally shifts the elution volume to a larger molecular weight, indicating recognition of independent moieties.
Figure 1—figure supplement 4
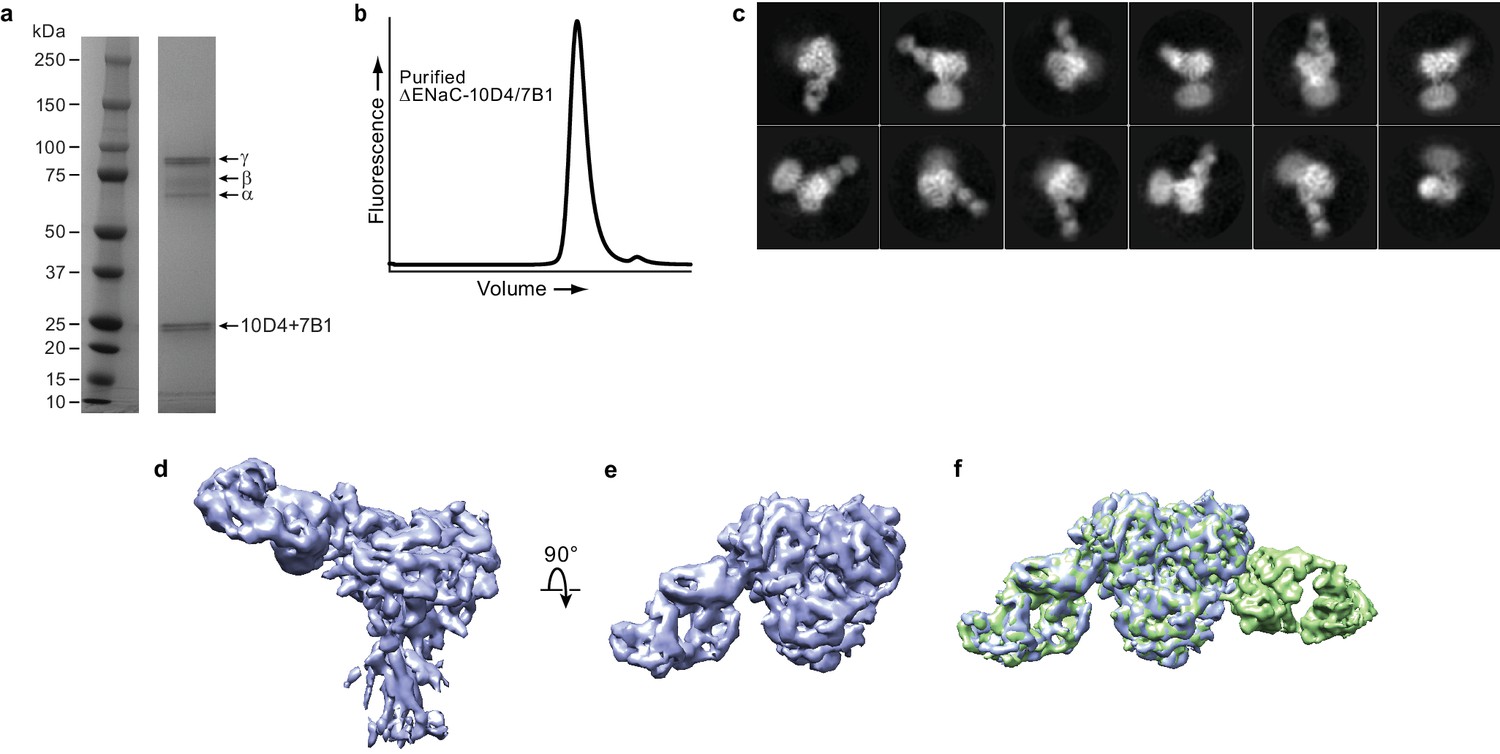
Fab binding properties.
(a) Coommassie-stained SDS-PAGE gel of purified ΔENaC-7B1/10D4 complex. (b) Representative FSEC trace of purified ΔENaC-7B1/10D4. (c) Representative 2D class averages of ΔENaC-10D4 complex show that 10D4 Fab facilitates particle alignment. (d and e) Cryo-EM density of ΔENaC-10D4 viewed parallel (d) and perpendicular (e) to the membrane. (f) Superposition of the ΔENaC-10D4 and ΔENaC-7B1/10D4 maps show subunit-specific binding of the Fabs.
Figure 2 with 6 supplements
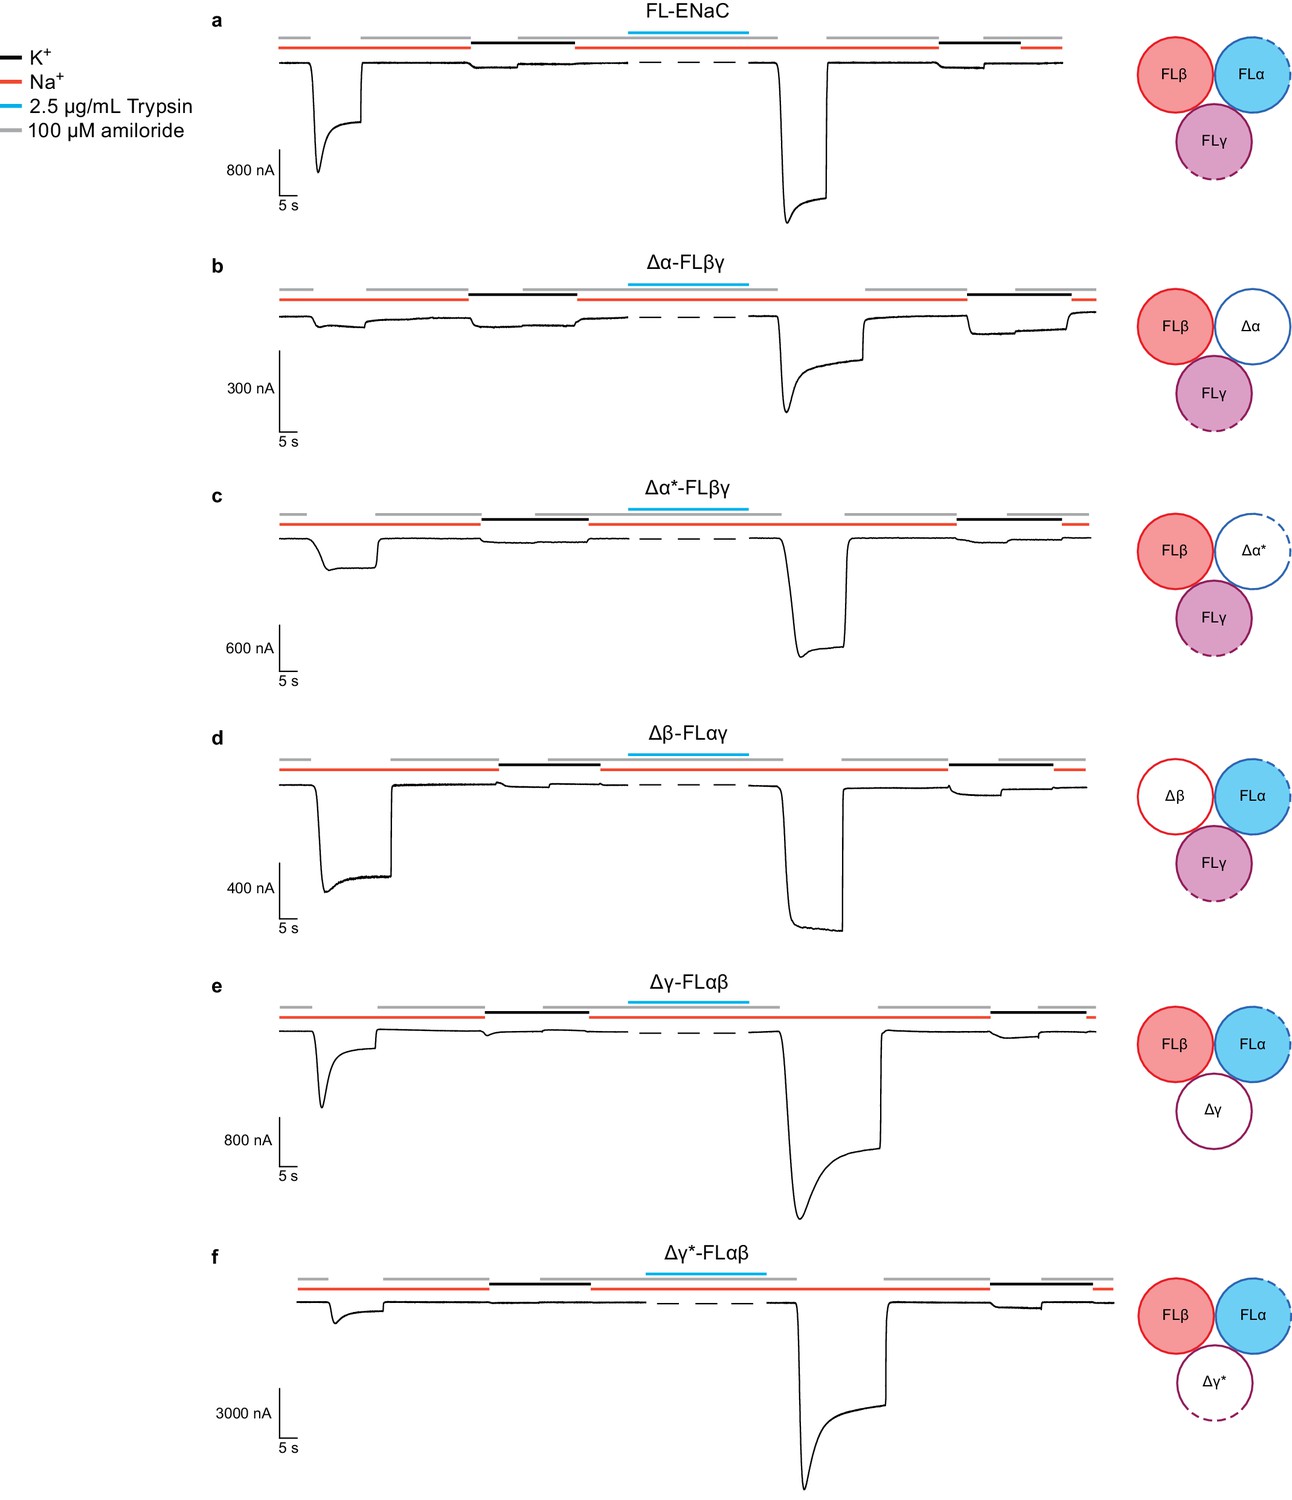
Functional characterization of ∆ENaC by TEVC.
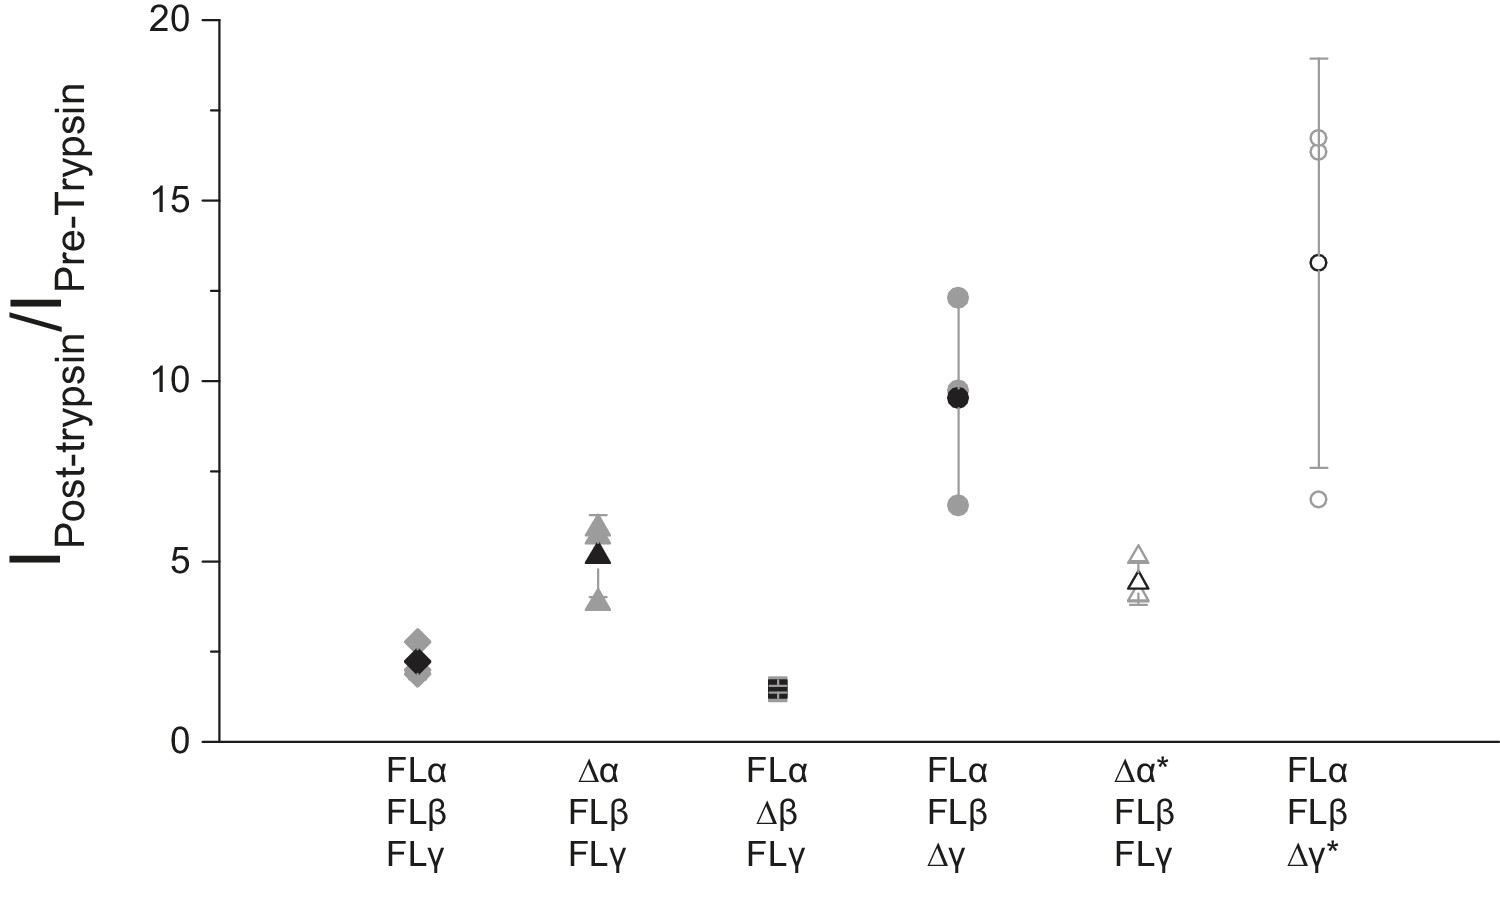
(a) Representative current trace of FL-ENaC shows selectivity of Na+ over K+, block by amiloride and sensitivity to trypsin treatment (2.5 µg/mL for 5 min) by a 2.22 ± 0.49 fold increase in steady state currents post-trypsin treatment (n = 3). The cartoon located on the right side of each current trace represents the combination of subunits injected in the oocytes. Filled circles represent FL-ENaC subunits while open represent the ∆ENaC subunits. Dotted lines represent ENaC subunits that contain the intact protease sites. (b–f) Representative current traces of Δα-FLβγ (b), Δα*-FLβγ (c), Δβ-FLαγ (d), Δγ-FLαβ (e) and Δγ*-FLαβ (f) demonstrate that the ∆ENaC subunits can form a functional channel with two FL-ENaC subunits that are selective for Na+ over K+ and sensitive to amiloride and trypsin treatment. Currents after trypsin treament increased by 5.15 ± 1.13 (b), 4.42 ± 0.61 (c), 1.46 ± 0.1 (d), 9.52 ± 2.88 (e) and 13.26 ± 5.67 (f) fold (n = 3 for all combinations).
-
Figure 2—source data 1
Ratio of measured steady state currents pre- and post trypsin treatment.
- https://doi.org/10.7554/eLife.39340.015
Figure 2—figure supplement 1
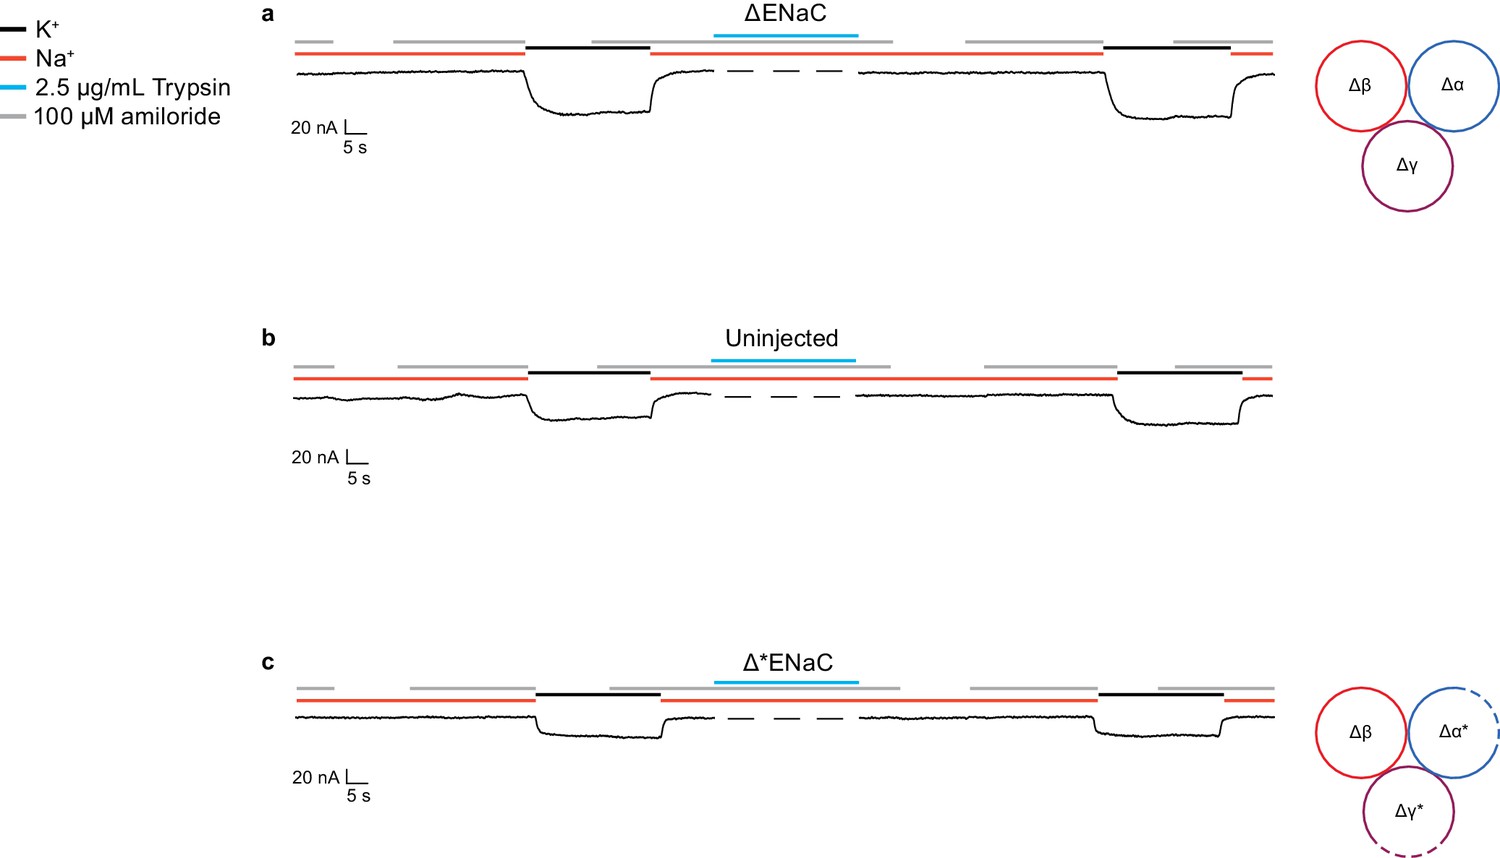
Currents measured in oocytes injected with ∆ENaC resembles currents observed in uninjected oocytes.
(a–c) Representative current traces of ∆ENaC (∆α-∆β-∆γ) (a), uninjected oocytes (b), and ∆*ENaC (∆α*-∆β-∆γ*) (c).
Figure 2—figure supplement 2
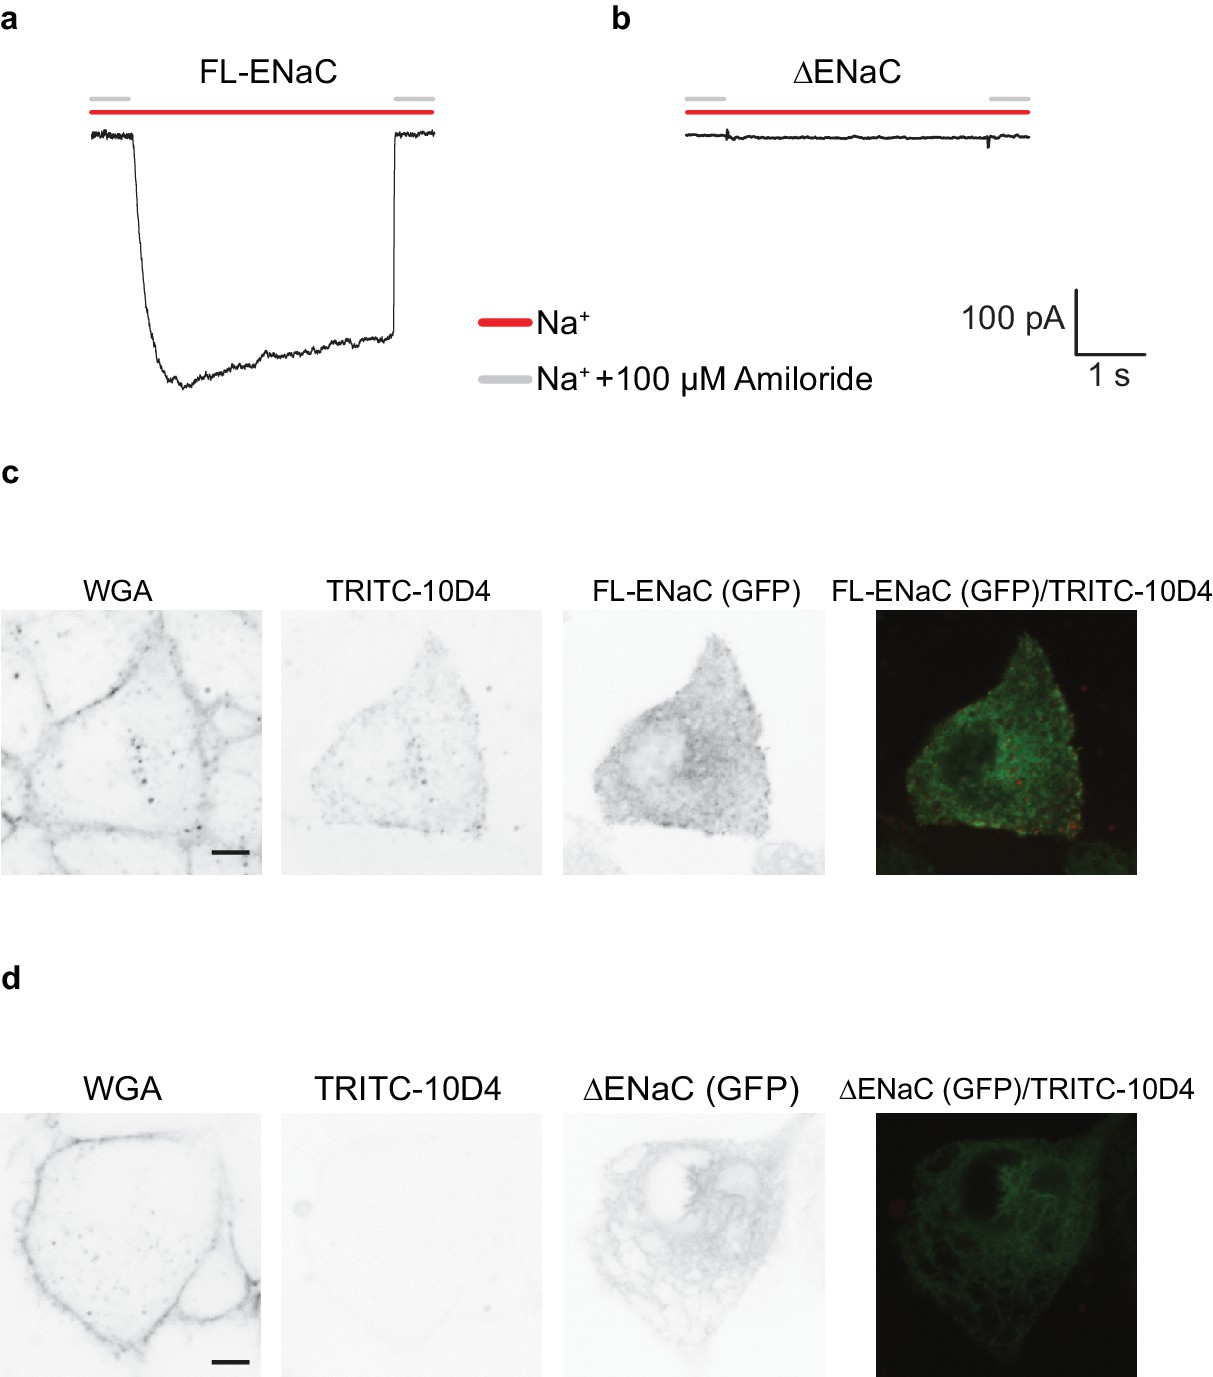
FL-ENaC and ∆ENaC trafficking in HEK 293S GnTI- cells.
Representative current traces of FL-ENaC (a) and ∆ENaC (b) expressed in GnTI- cells. Cells expressing FL-ENaC demonstrated inward Na+ currents that were blocked by 100 µM amiloride. Na+ currents were not detected in cells expressing ∆ENaC. Live confocal microscopy analysis of cells expressing FL-ENaC (c) and ∆ENaC (d) with eGFP fusion (third column) stained with WGA (first column) and TRITC-labeled 10D4 (second column) show that FL-ENaC is expressed on the cell surface while ∆ENaC is not. Overlay of the eGFP and TRITC channels are shown in the fourth column.
Figure 2—figure supplement 3
Functional characterization of ∆ENaC by TEVC.
Oocytes treated with trypsin demonstrated increased current amplitude that were 2.22 ± 0.49, 5.15 ± 1.13, 4.42 ± 0.61, 1.46 ± 0.10, 9.52 ± 2.88 and 13.26 ± 5.67 fold larger than before trypsin application in FL-ENaC, Δα-FLβγ, Δα*-FLβγ, Δβ-FLαγ, Δγ-FLαβ and Δγ*-FLαβ, respectively (n = 3 per subunit combinations).
Figure 2—figure supplement 4
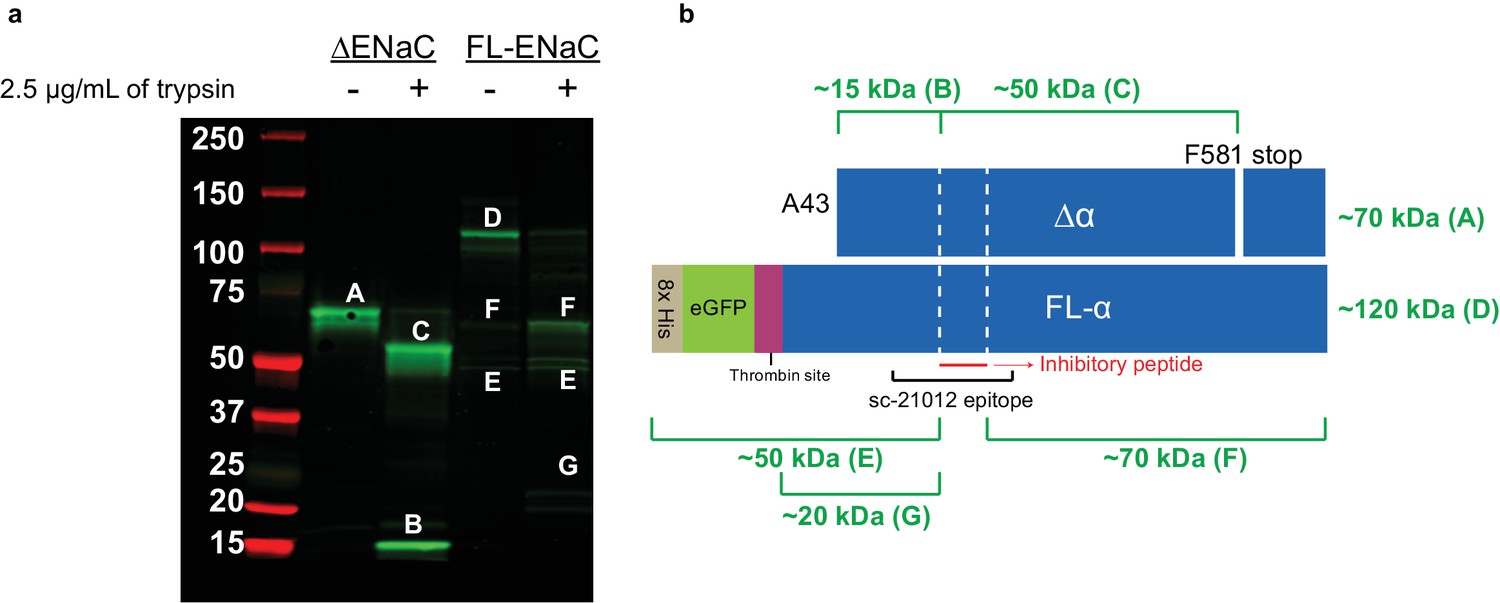
Cleavage of ENaC ∆α and FL-α by trypsin shows expected banding.
(a) Western blot (IB: ENaC α subunit, SC-21012) of purified ENaC ∆α and FL-α subunits treated with trypsin (7 µg ENaC/well; 2.5 µg trypsin/mL; incubated at room temperature for 10 min). The uncut ∆α band (band A) is cut into the fragment N-terminal of the inhibitory peptide (band B) and C-terminal of the inhibitory peptide (band C). The uncut FL-α lane already has some cut ENaC (bands F and E) in addition to uncut (band D). This is expected due to the unperturbed cleavage sites in FL-α. Upon trypsin treatment, we observe stronger intensity for the two fragments, as well as the N-terminal fragment with liberated GFP (band G). (b) Schematic of ENaC band progenitors. White dotted lines, furin sites.
Figure 2—figure supplement 5
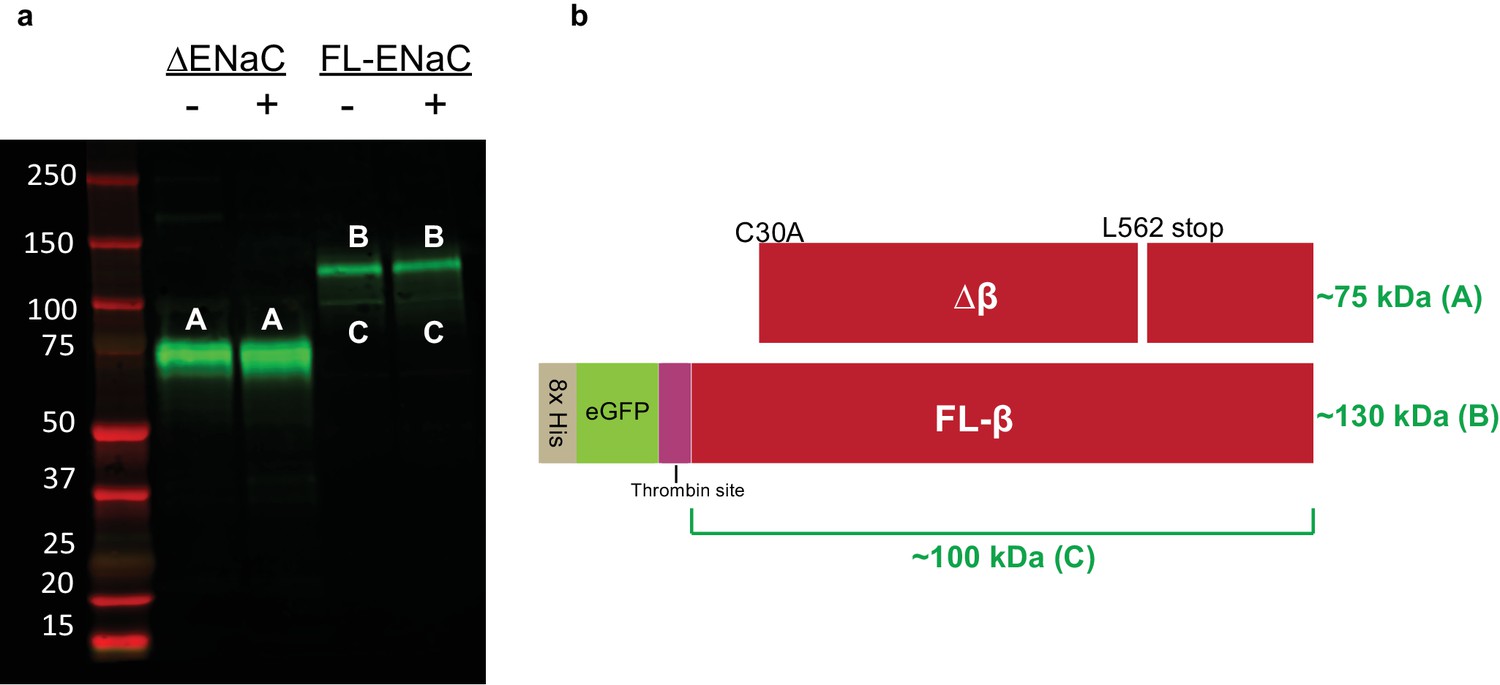
Cleavage of ENaC ∆β and FL-β by trypsin shows expected banding.
(a) Western blot (IB: β subunit, SC-21013) of purified ENaC ∆β and FL-β subunits treated with trypsin as in figure supplement 4. As expected, neither ∆β (band A) nor FL-β (band B) is cleaved by trypsin treatment. Some GFP is liberated from FL-β at the trypsin site, giving rise to a faint band (band C). (b) Schematic of ENaC band progenitors.
Figure 2—figure supplement 6
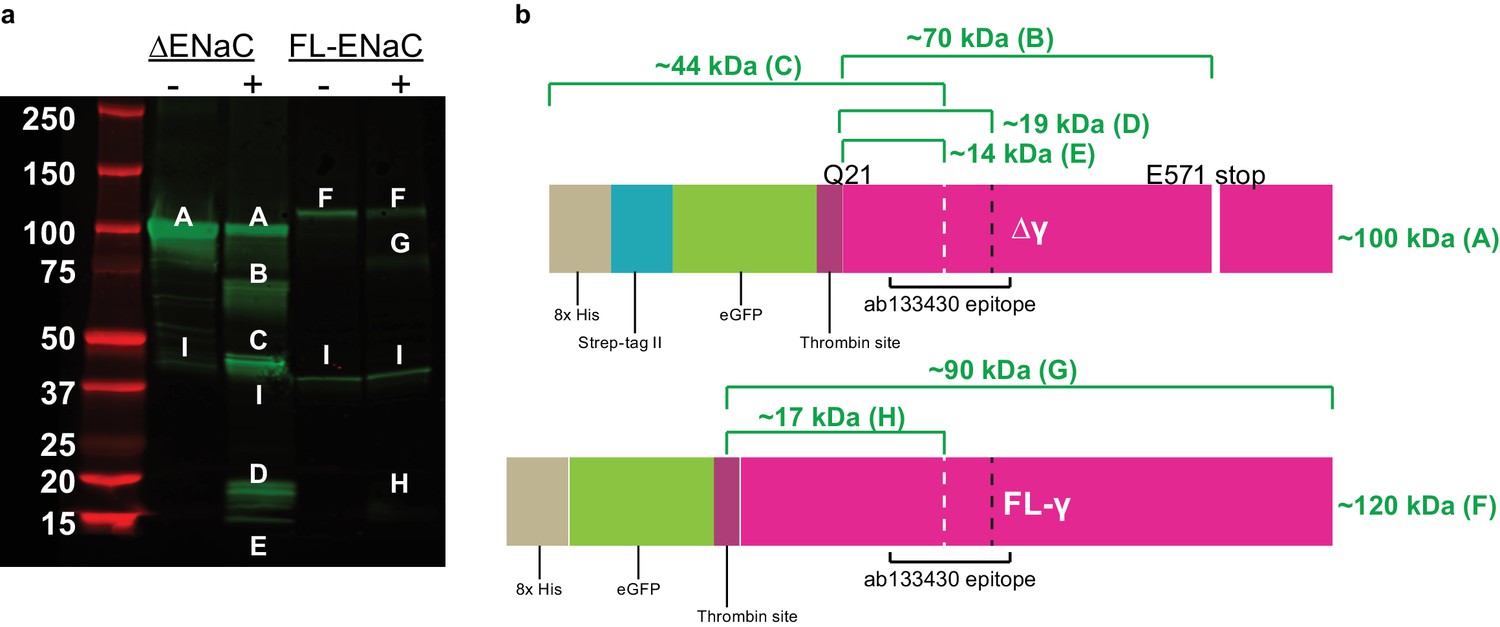
Cleavage of ENaC Δγ and FL-γ by trypsin shows expected bands.
(a) Western blot (IB: ENaC γ subunit, abcam ab133430) of purified ENaC Δγ and FL-γ subunits treated with trypsin as in figure supplement 4. When treated with trypsin, the uncut Δγ band (band A) loses eGFP (band B), is cleaved at or near the N-terminal furin site (band C), at or near the thrombin and prostasin sites (band D), at or near the thrombin and furin sites (band E). FL-γ (band F) is cut at the thrombin site (band G) and at or near the thrombin and furin sites (band H). A nonspecific band is present in all lanes (band I). (b) Schematic of trypsin treated ENaC Δγ and FL-γ. White dashed lines, furin site. Black dashed line, prostasin site.
Figure 3 with 1 supplement
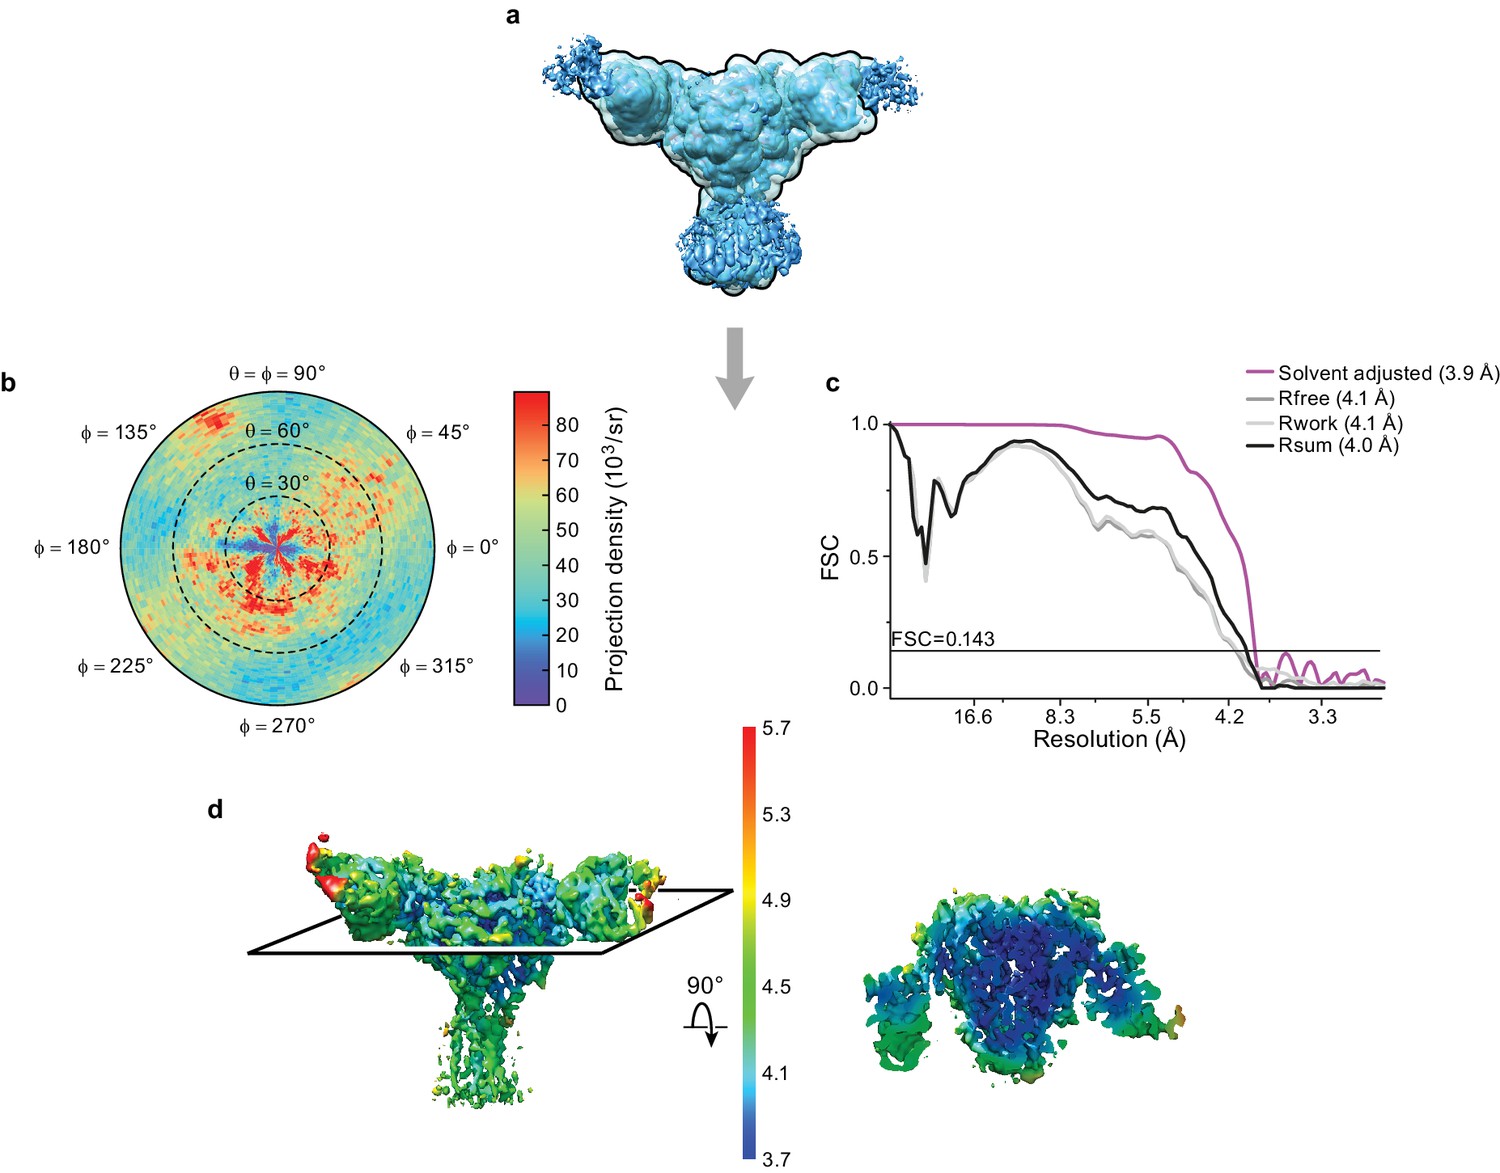
Cryo-EM analysis of final 3D reconstruction map.
(a) Outline of mask used in the final 3D refinement of ΔENaC-7B1/10D4 complex. (b) Angular distribution of particle projections of the ΔENaC-7B1/10D4 complex. (c) Solvent adjusted FSC curve (purple) by cisTEM along with FSC curve between the atomic model of ΔENaC-7B1/10D4 complex and half map 1 (Rfree – dark grey), half map 2 (Rwork – light grey) and final reconstruction map (Rsum – black). The solid line indicates FSC = 0.143. (d) 3D map colored according to local resolution estimation using Bsoft. Blue indicates regions where local resolution is estimated to be ~ 3.7 Å.
-
Figure 3—source data 1
Statistics of data collection, three-dimensional reconstruction and model refinement
- https://doi.org/10.7554/eLife.39340.018
Figure 3—figure supplement 1
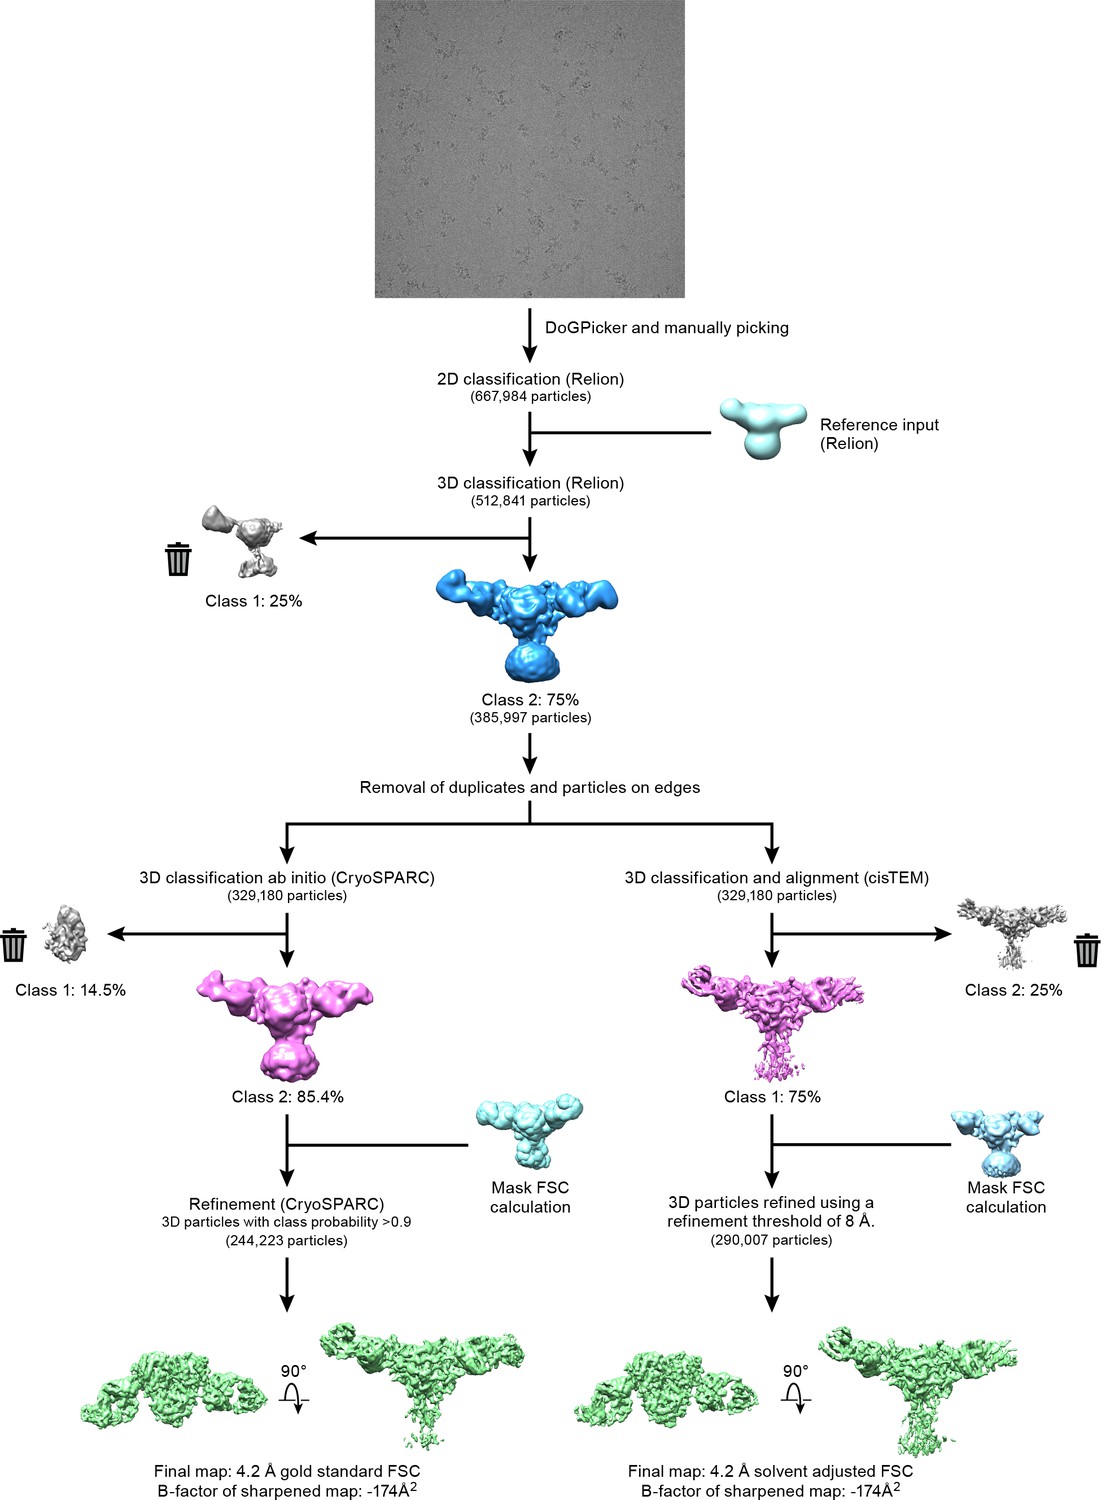
Cryo-EM data processing.
Workflow of three-dimensional reconstruction of ∆ENaC-7B1/10D4 complex using cryoSPARC and cisTEM programs.
Figure 4 with 6 supplements
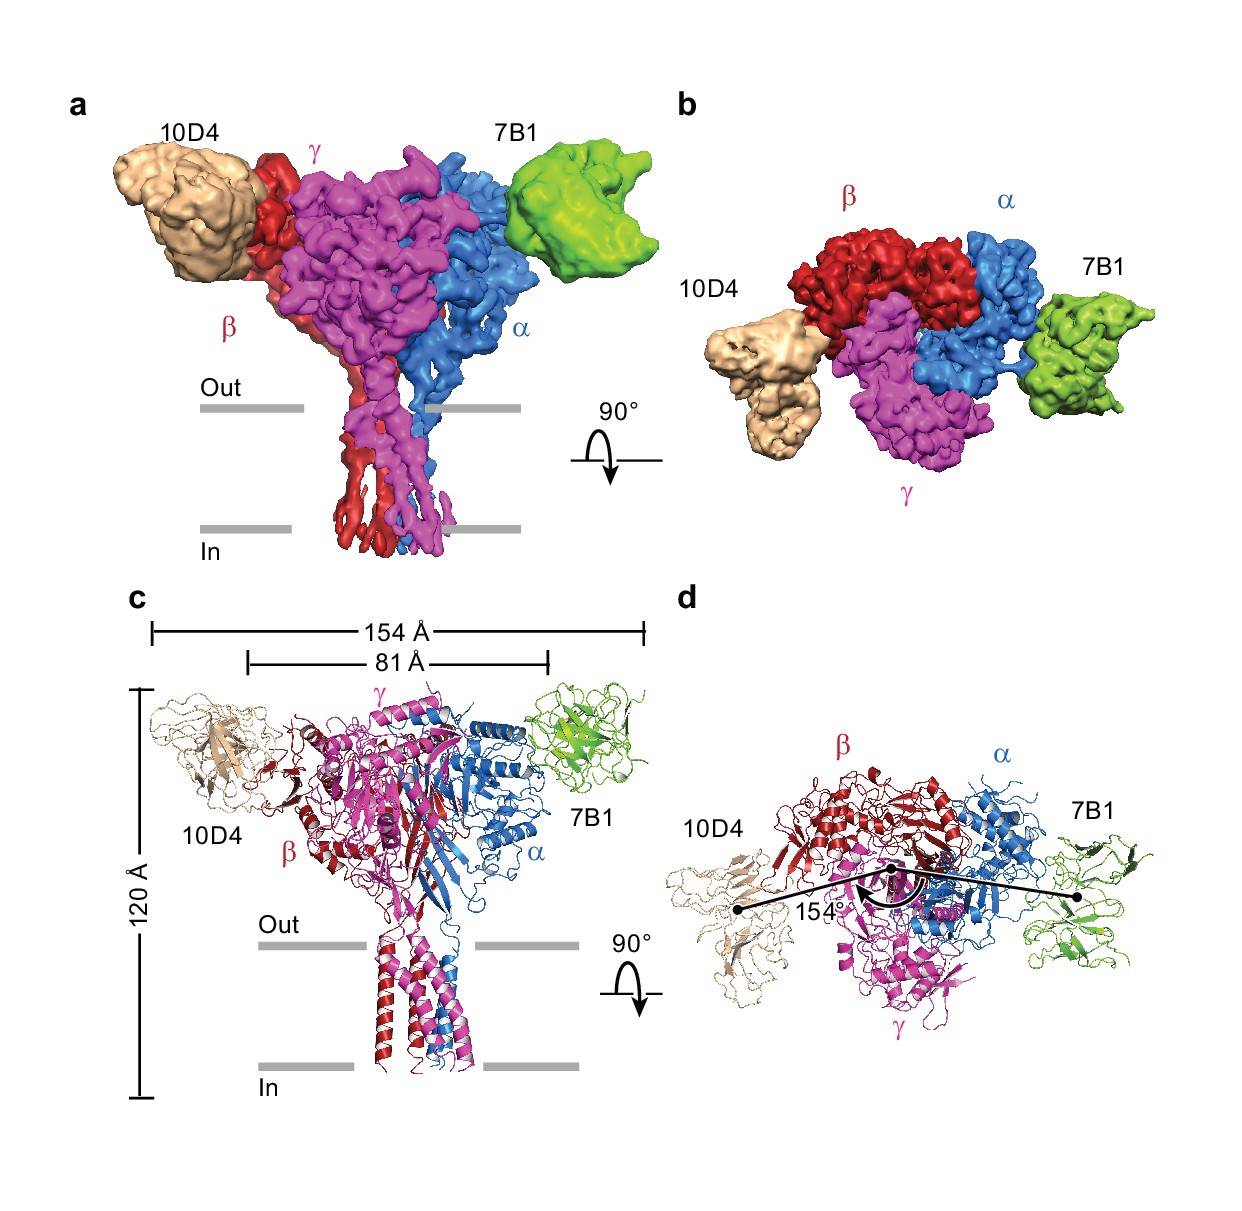
Architecture of the human epithelial sodium channel.
(a) and (b), Cryo-EM map of the ΔENaC-7B1/10D4 complex viewed parallel (a) and perpendicular (b) to the membrane. The α, β, and γ subunits are colored blue, red, and magenta, respectively. The 7B1 and 10D4 Fv densities are colored green and wheat, respectively. (c) and (d), Cartoon representation of the ΔENaC-7B1/10D4 complex viewed and colored as in (a) and (b). The dimensions of the complex and ΔENaC alone are indicated. The centers of mass of the Fv’s make 154° angle.
Figure 4—figure supplement 1
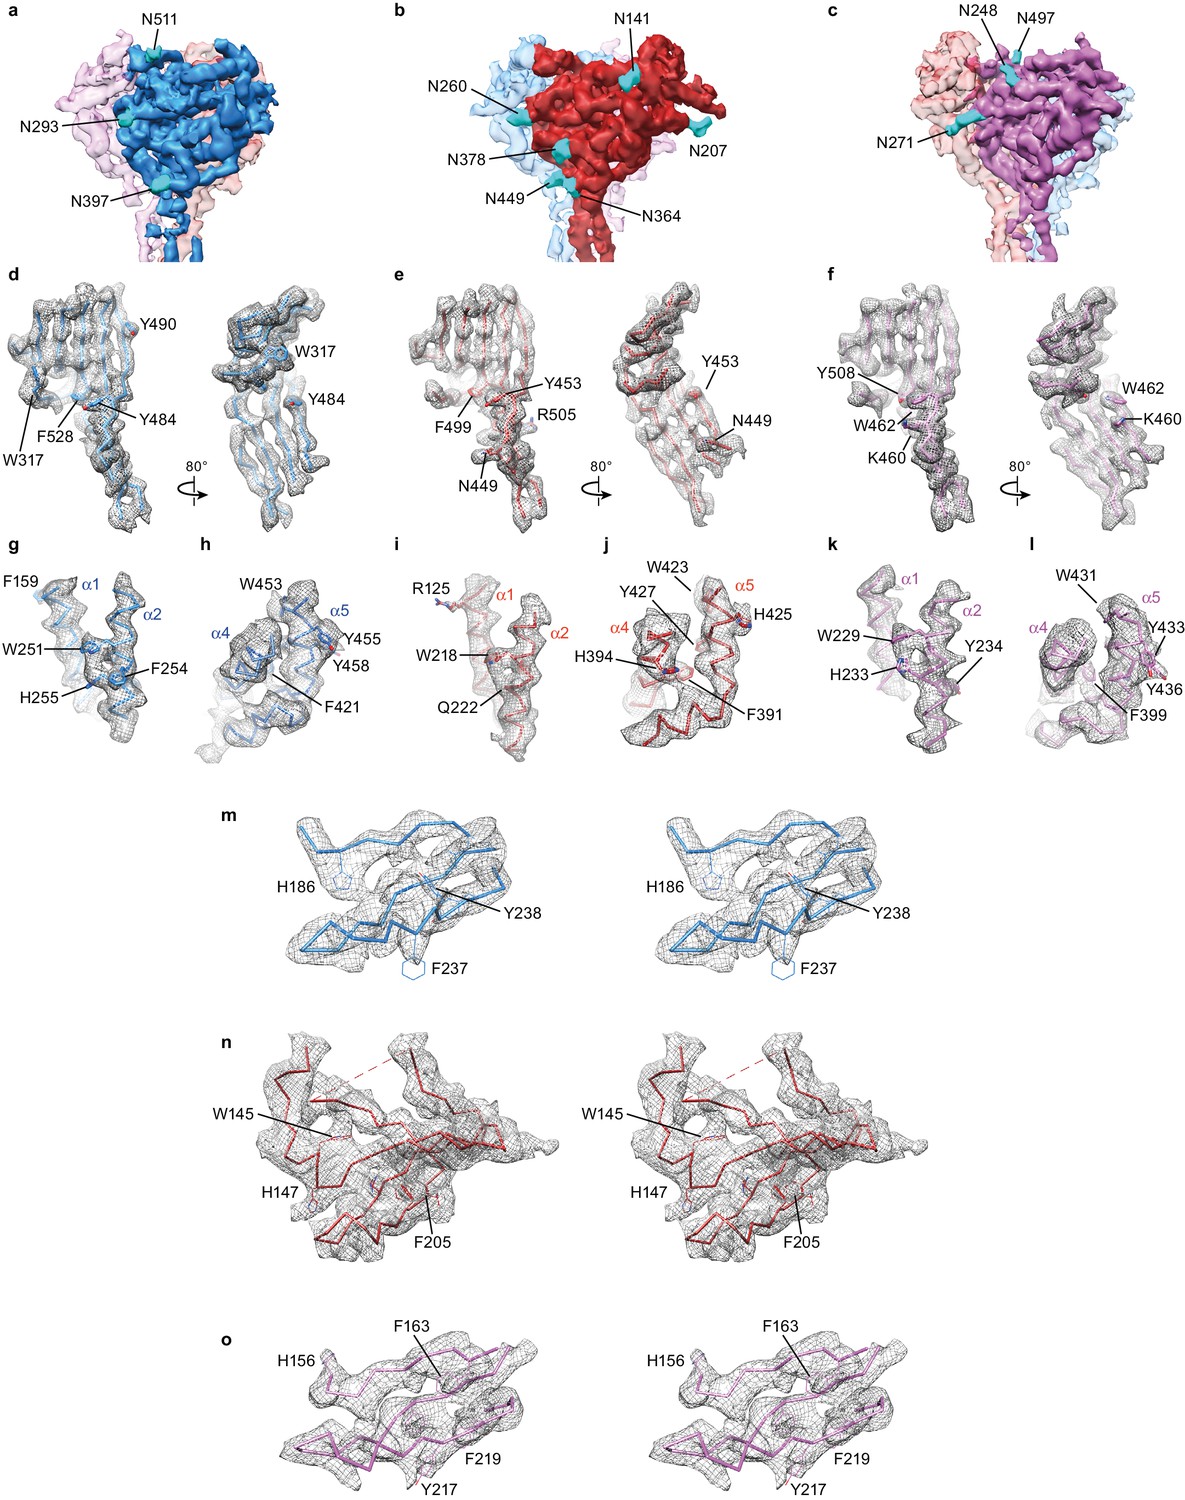
Unique map features facilitated subunit identification and model building.
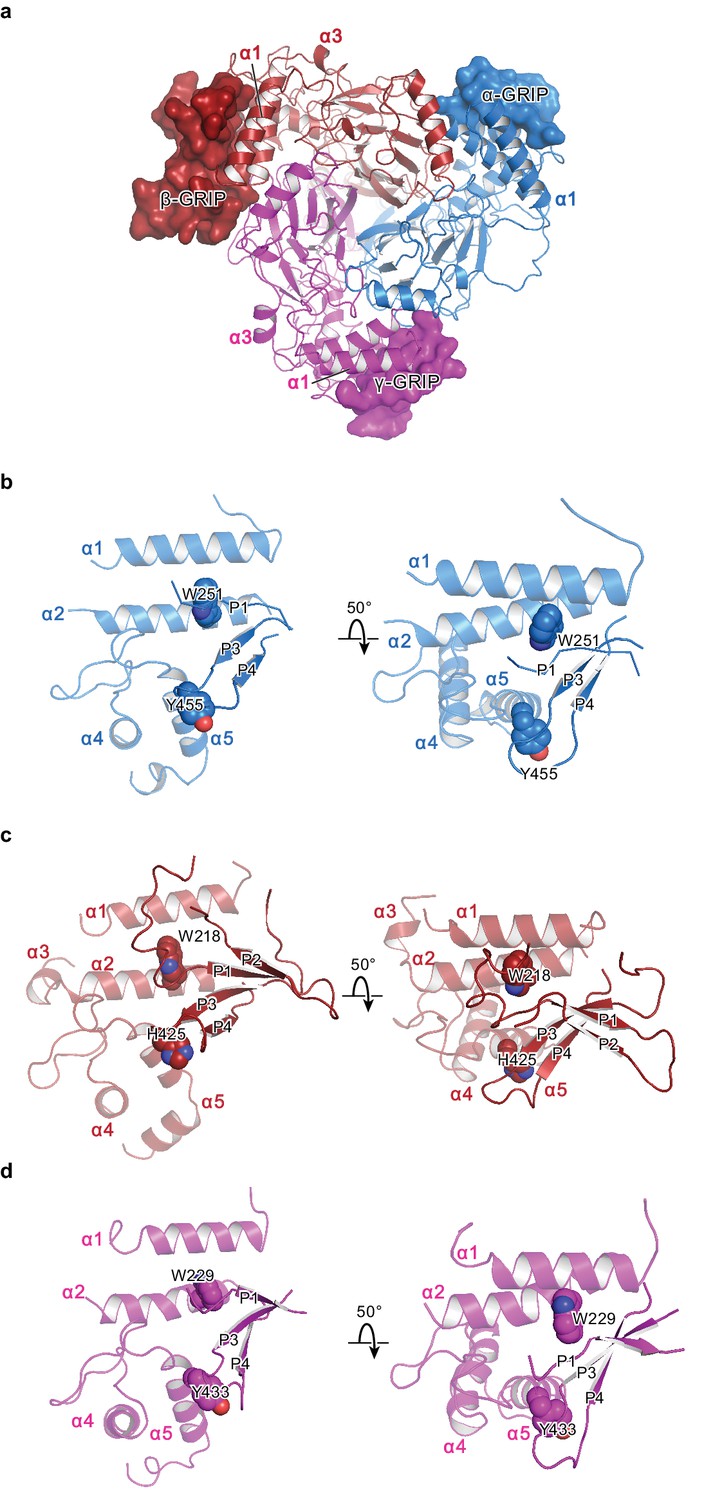
(a–c) Potential map of ∆ENaC highlighting features of glycosylation which are colored cyan. There are three glycosylation sites in α (a), six in β (b), and three in γ (c). The map is sharpened with a lower B-factor (−100 Å2) for better visualization of glycosylation site features. (d–l) Well-ordered aromatic and basic residues found in the palm domain (d–f), finger domain (g,i,k) and thumb domain (h,j,l) provided further validation of subunit identity. The β strands that comprise the palm domain (β1, β3, β6, β9 – 12) are well ordered in all three subunits, α (d), β (e) and γ (f). The α2-helices in the finger domain display potential map features of several aromatic residues including a highly conserved Trp residue, W251 in α (g), W218 in β (i) and W229 in γ (k). The α4 and α5 helices in the thumb domains display potential map features for aromatic residues that are shared, but also distinct between α (h), β (j) and γ (l). Stereo view showing potential map of the GRIP-domains of α (m), β (n) and γ (o).
Figure 4—figure supplement 2
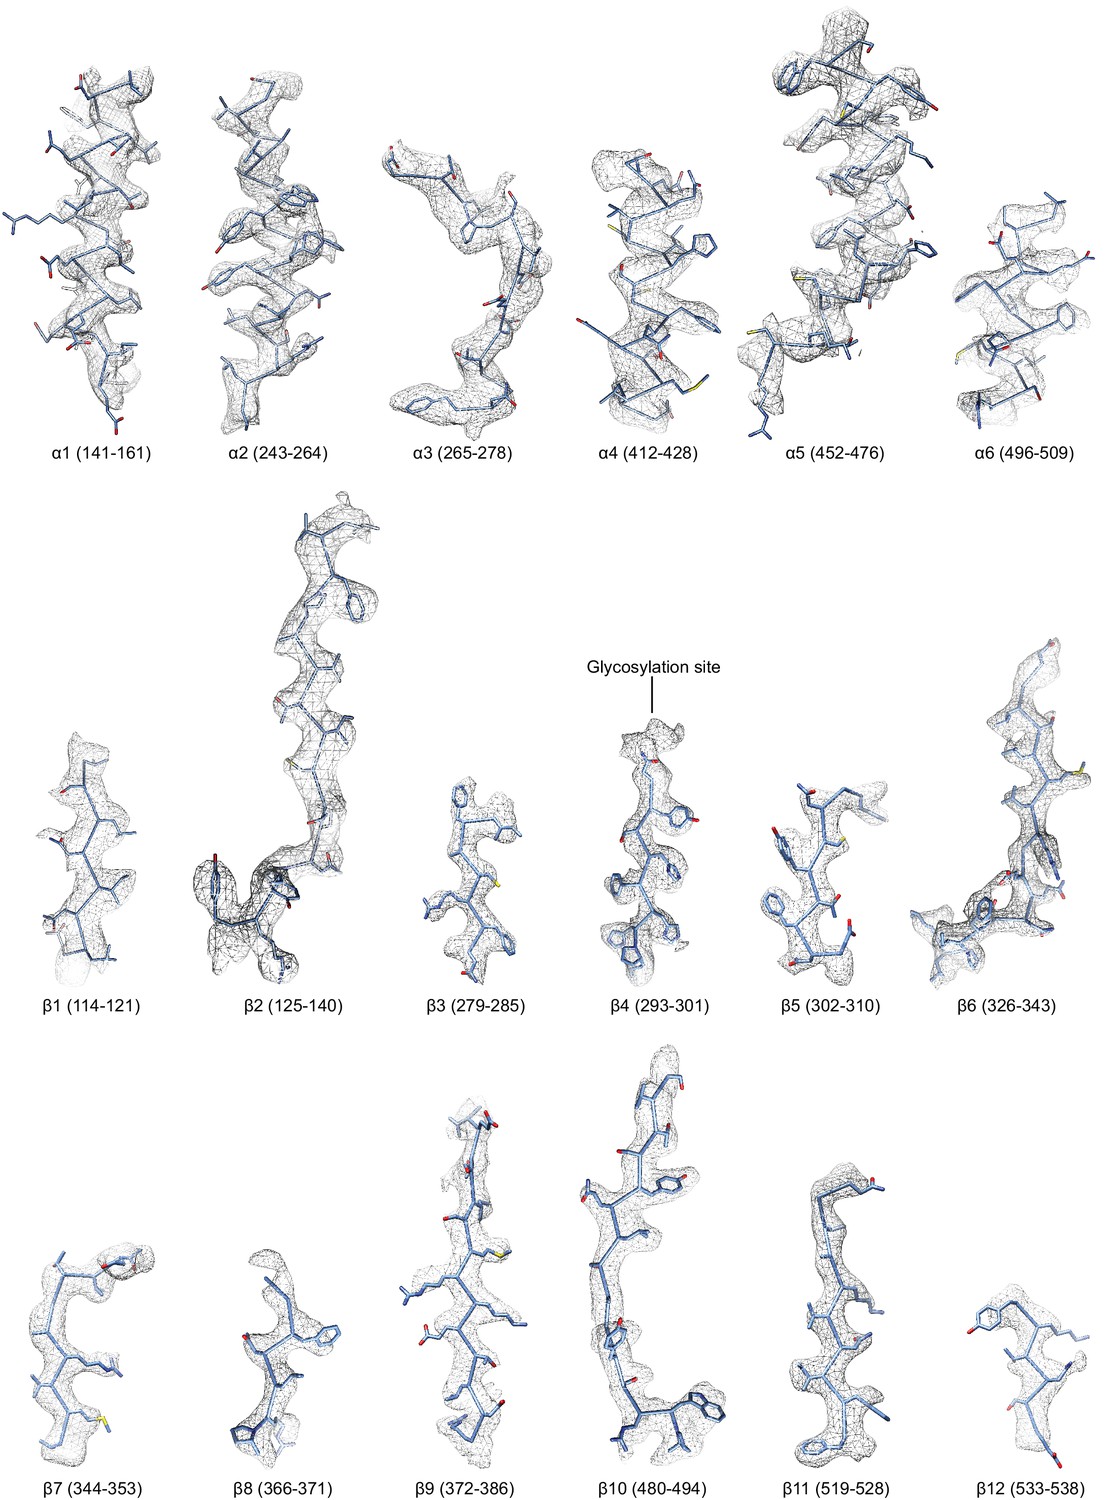
Regions of the ∆α ENaC subunit model shown in stick representation superimposed with the potential map in light grey mesh, contoured between 7.5 and 8.0 σ.
The model is colored as in Figure 4.
Figure 4—figure supplement 3
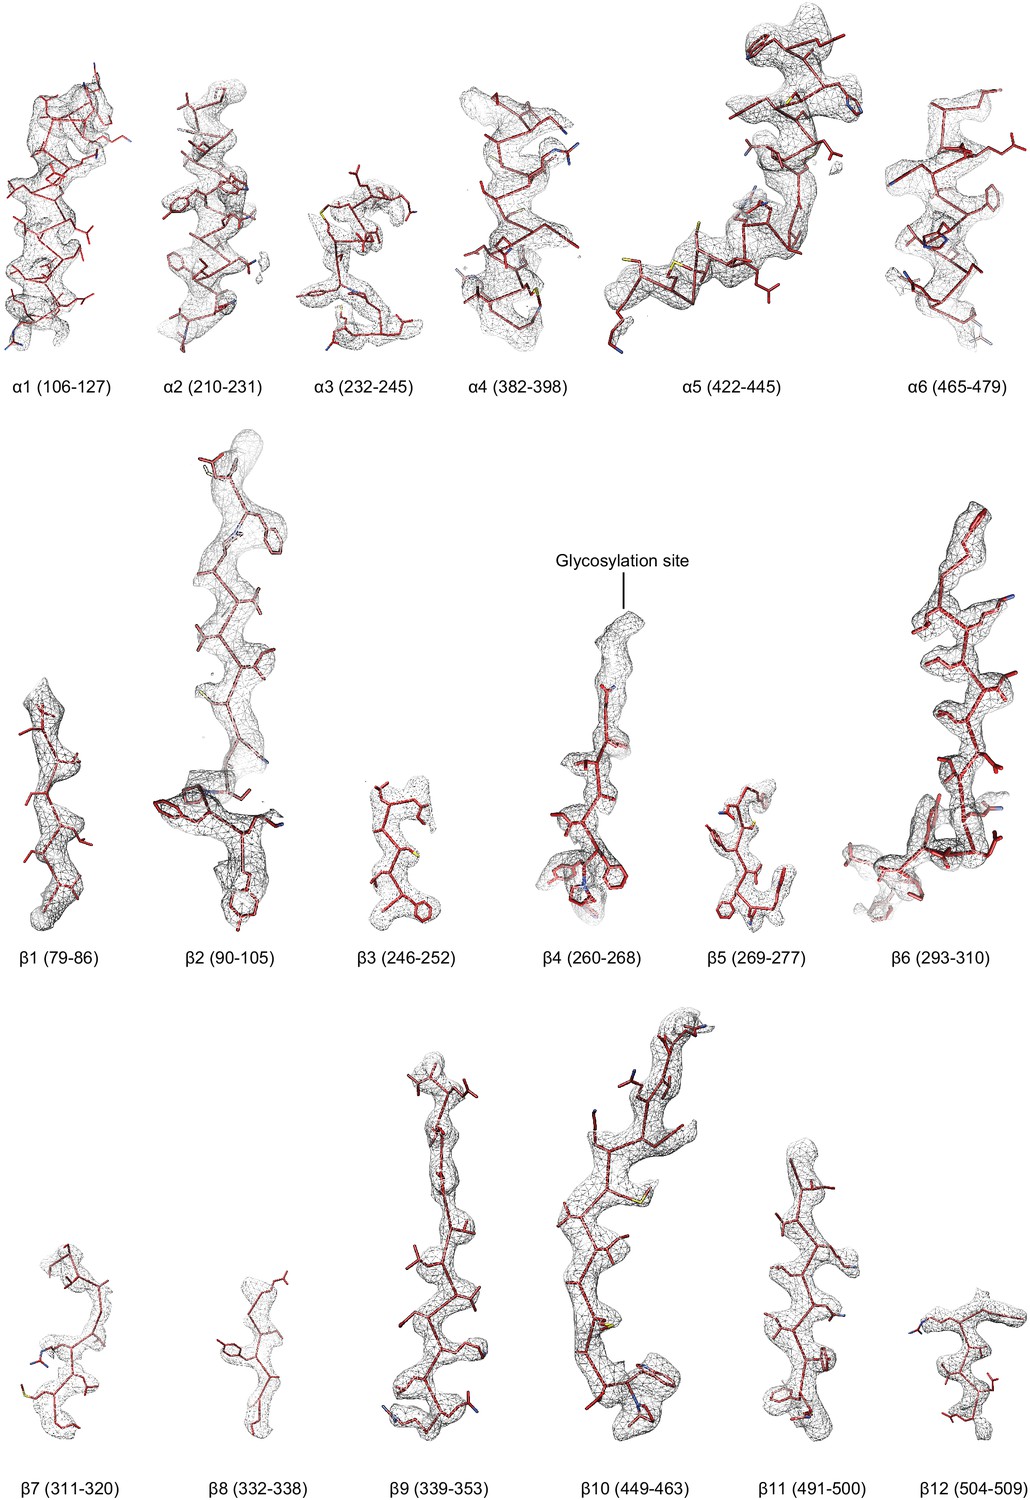
Regions of the ∆β ENaC subunit model shown in stick representation superimposed with the potential map in light grey mesh, contoured between 7.5 and 8.0 σ.
The model is colored as in Figure 4.
Figure 4—figure supplement 4
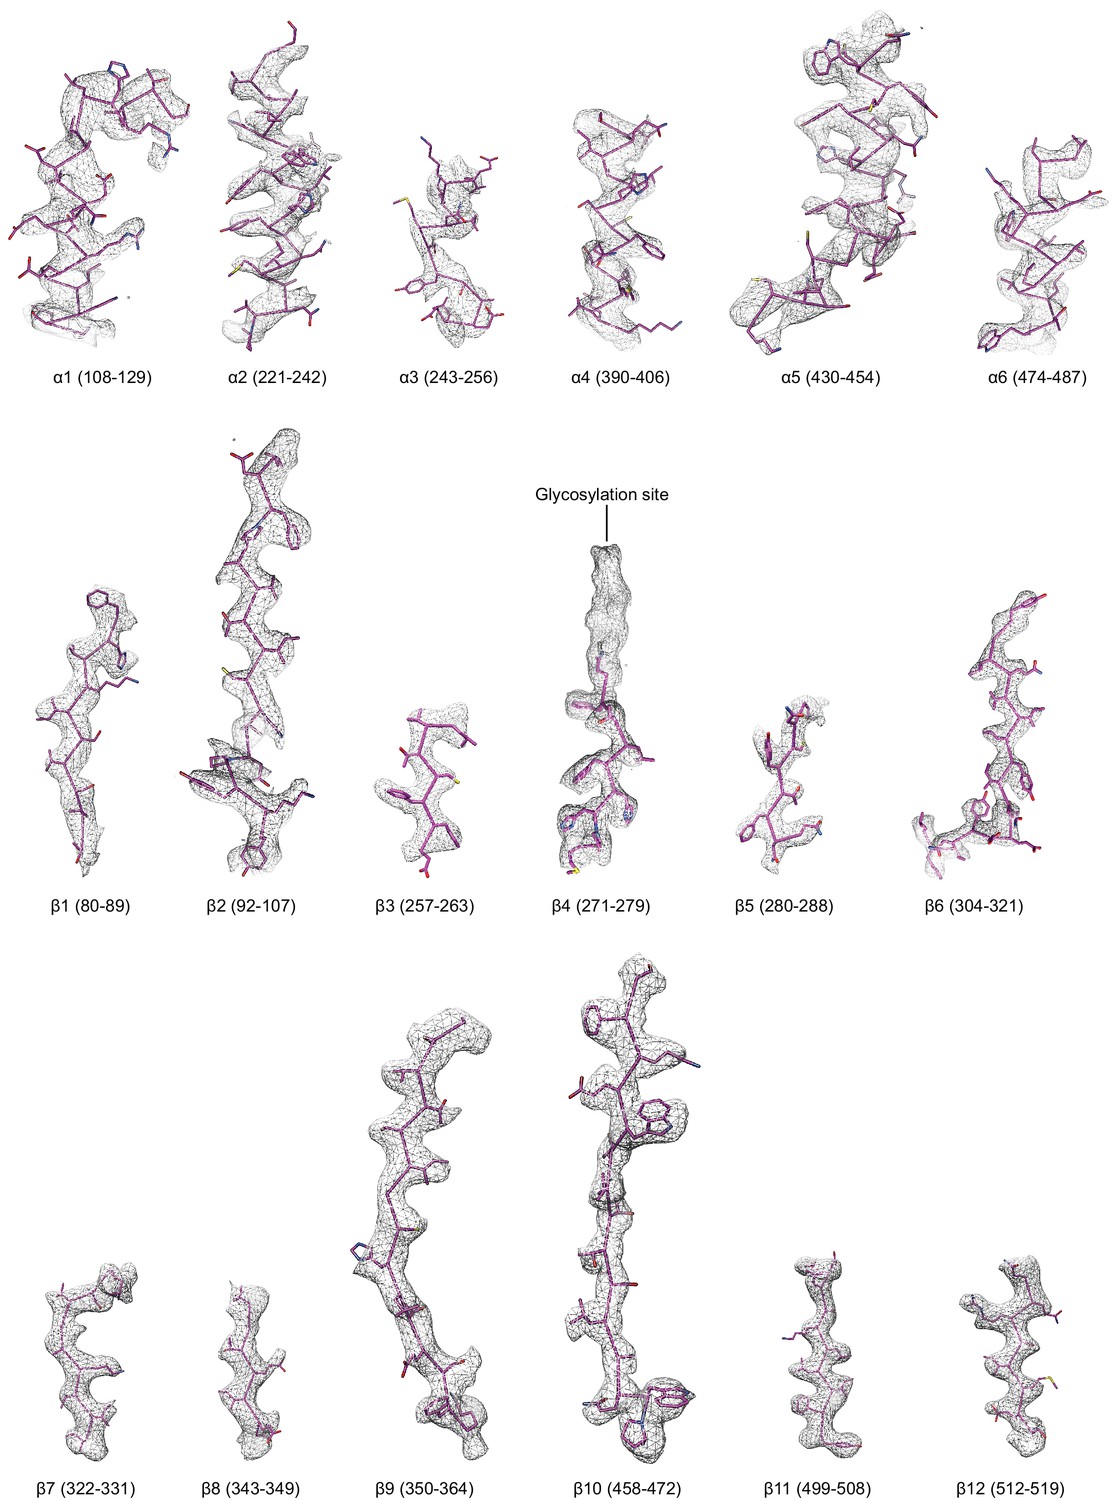
Regions of the ∆γ ENaC subunit model shown in stick representation superimposed with the potential map in light grey mesh, contoured between 7.5 and 8.0 σ.
The model is colored as in Figure 4.
Figure 4—figure supplement 5
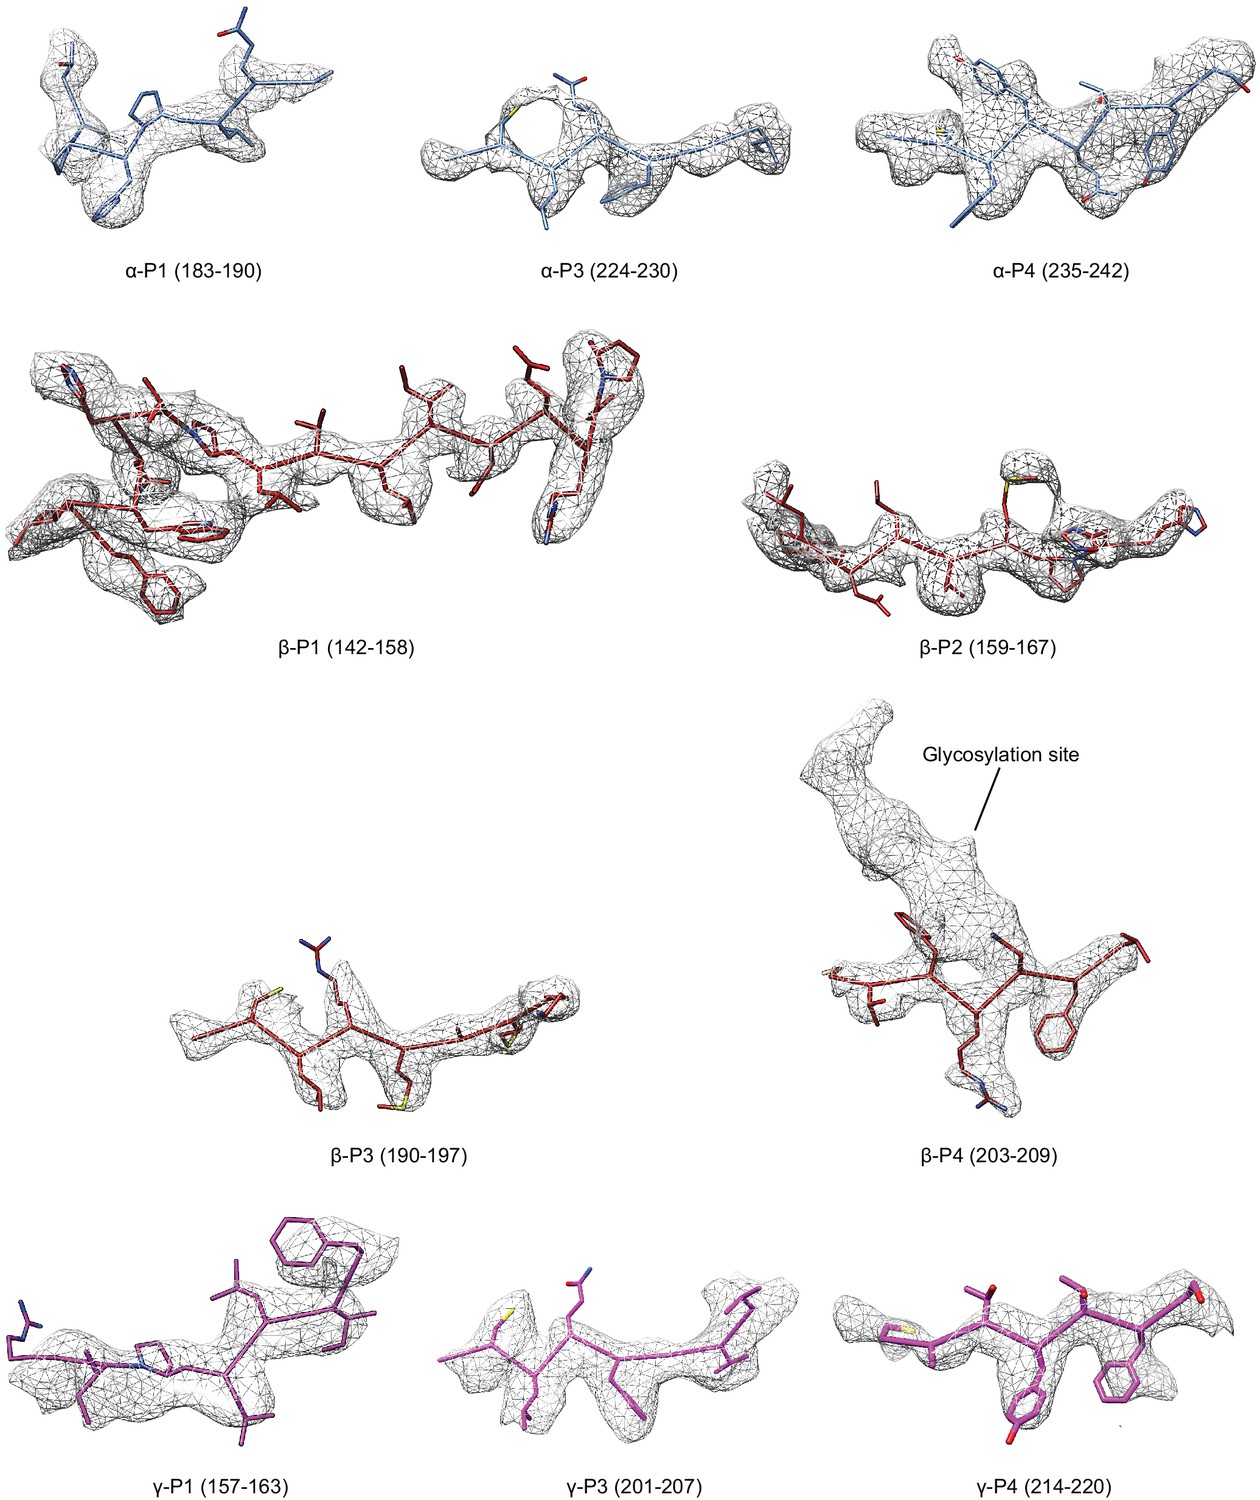
Select regions of the GRIP domain in all three subunits.
Model is colored as in Figure 4, potential map is light grey mesh and is contoured at 6.5 σ.
Figure 4—video 1
Three dimensional architecture of the ENaC subunits.
https://doi.org/10.7554/eLife.39340.025
Figure 5 with 1 supplement
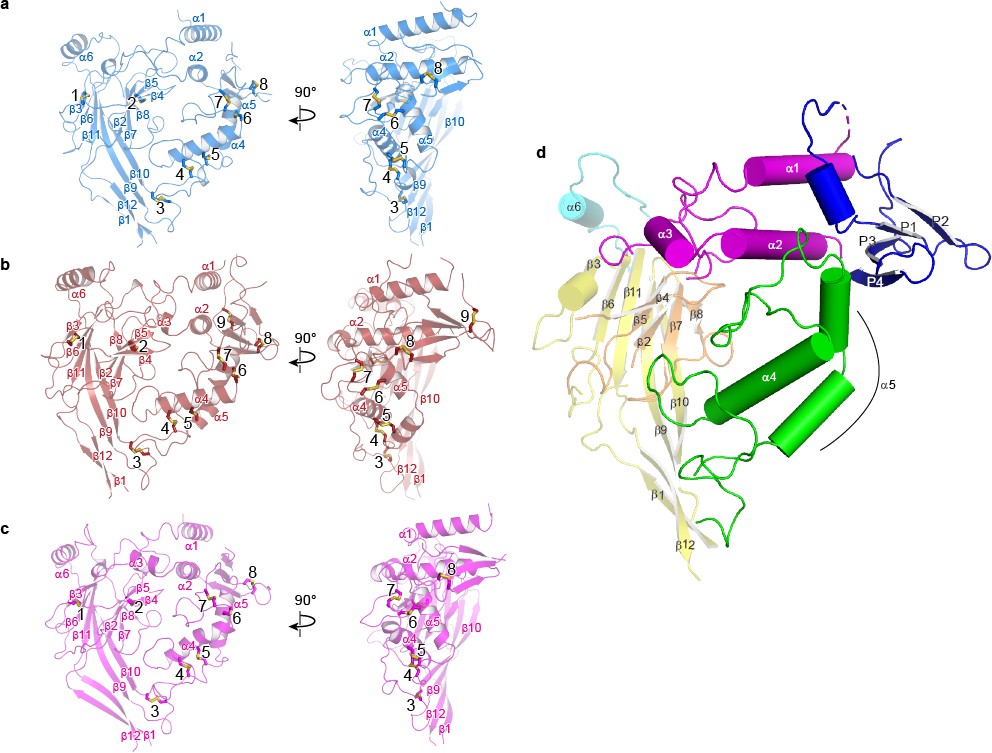
Domain organization in each subunit of ΔENaC resembles a hand clenching a ball.
(a–c) Domain organization of each ENaC subunit and locations of disulfide bridges. Disulfide bridges 1–7 are conserved across ENaC/DEG family while the eighth disulfide bridge is shared by α (a), β (b), and γ (c) and located in the GRIP domain (P1 - P4). The β subunit contains a ninth disulfide bridge that is also located in the GRIP domain. All subunits are in cartoon representation and colored as in Figure 4 and the disulfide bridges are in sticks representation. (d) Schematic diagram of secondary structure elements of ENaC subunits colored as follows: knuckle, cyan; palm, yellow; finger, purple; GRIP, blue; β-ball, orange; thumb, green.
Figure 5—figure supplement 1
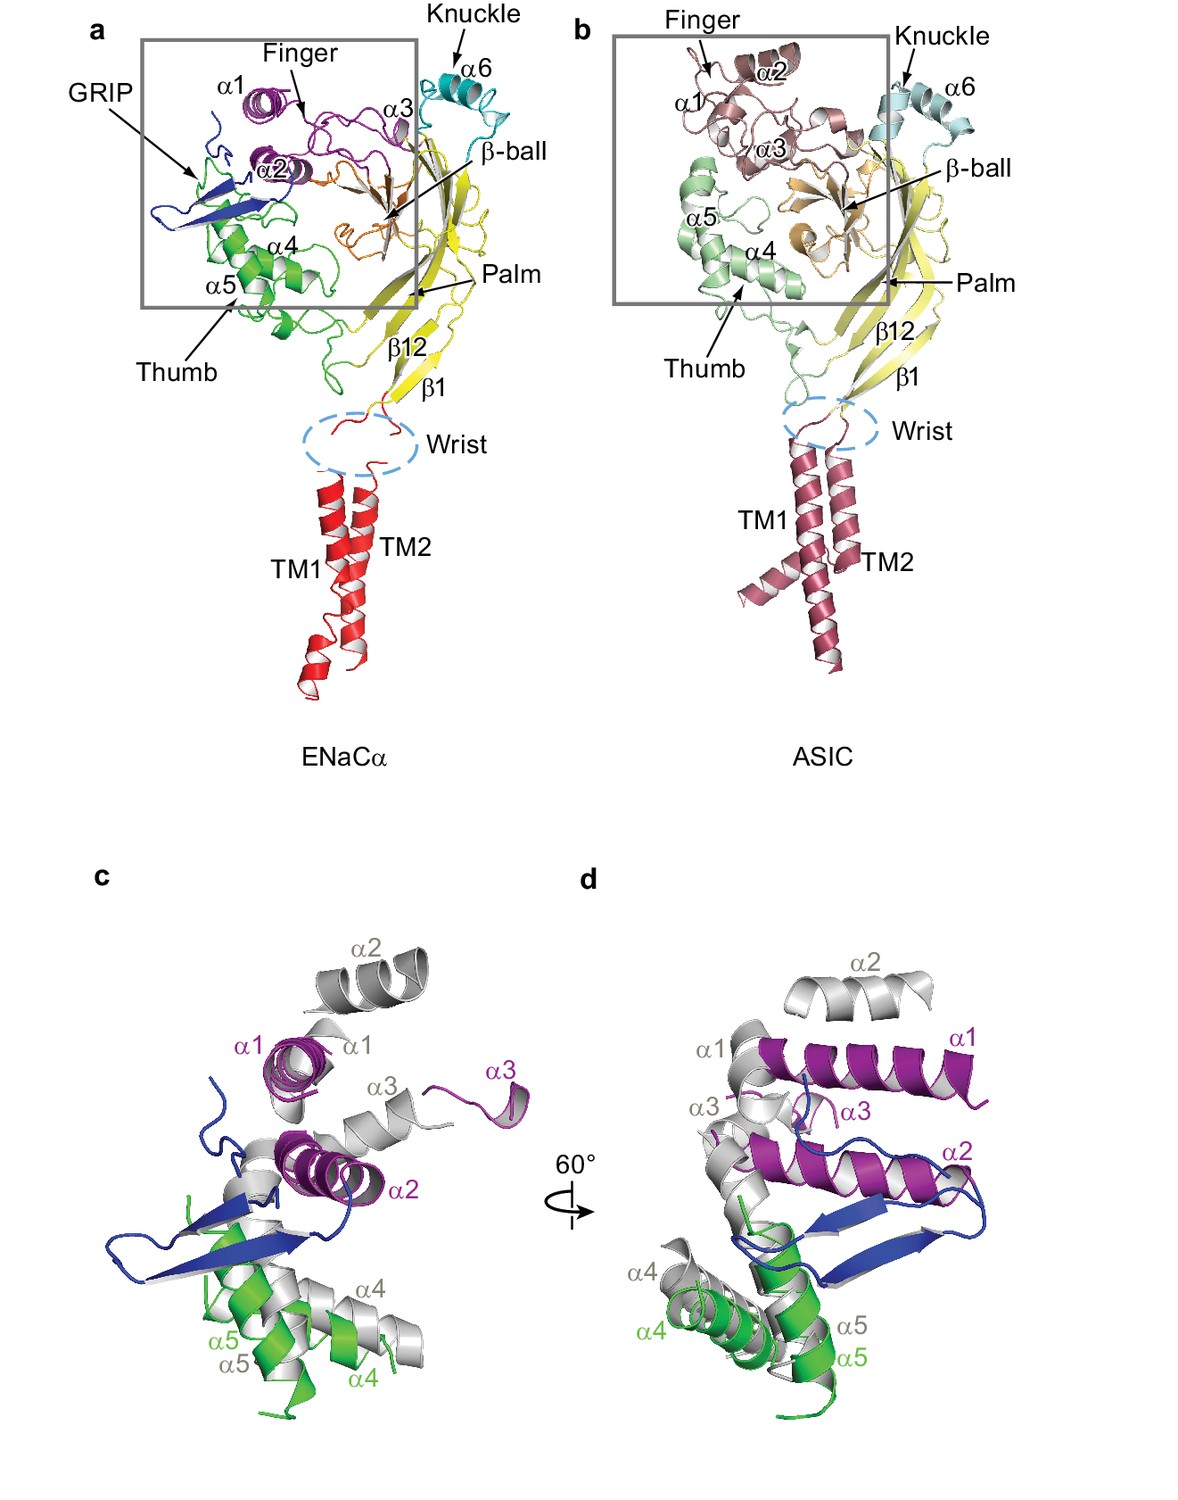
Comparison between ENaC and ASIC subunit structure.
(a) Overall architecture of the ENaC subunit is similar to the subunit architecture of (b) chicken ASIC (PDB: 5WKV). Domains of high-sequence similarity between the two ion channels like the palm (yellow - ENaC, pale yellow - ASIC) and β-ball (orange - ENaC, light orange - ASIC) domains are structurally conserved. Structural differences are observed in the knuckle (cyan - ENaC, pale cyan - ASIC) and finger (purple - ENaC, raspberry - ASIC) domains. (c and d) Superposition of the ENaC (colored) and ASIC (grey) subunits in the upper palm domain illustrates deviations in domain structures. View of the boxed region in (a) and (b). For clarity, loops, β-ball, palm, and knuckle domains are omitted.
Figure 6 with 1 supplement
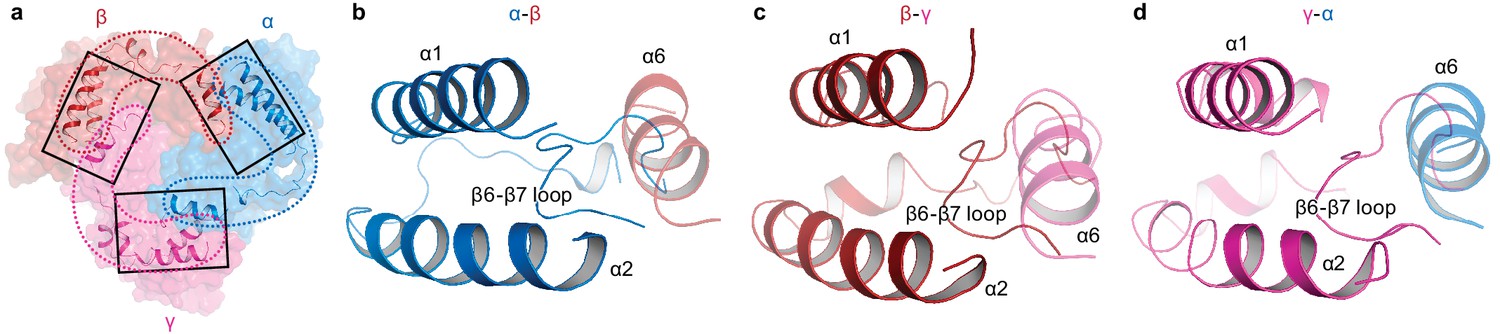
Intersubunit interactions in ΔENaC in the finger and knuckle domains.
(a) The finger and knuckle domains forge intersubunit interactions forming a ‘collar’ at the top of the ECD. Surface representation of ΔENaC viewed perpendicular to the membrane. Subunits are colored as in Figure 4. The finger (α1 – 3) and knuckle domains (α6) are shown in cartoon representation. (b–d), Detailed view of the interfaces boxed in (a). The views are parallel to the membrane and show how the helices from the finger and knuckle domains constitute an enclosure around the β6-β7 loop.
Figure 6—figure supplement 1
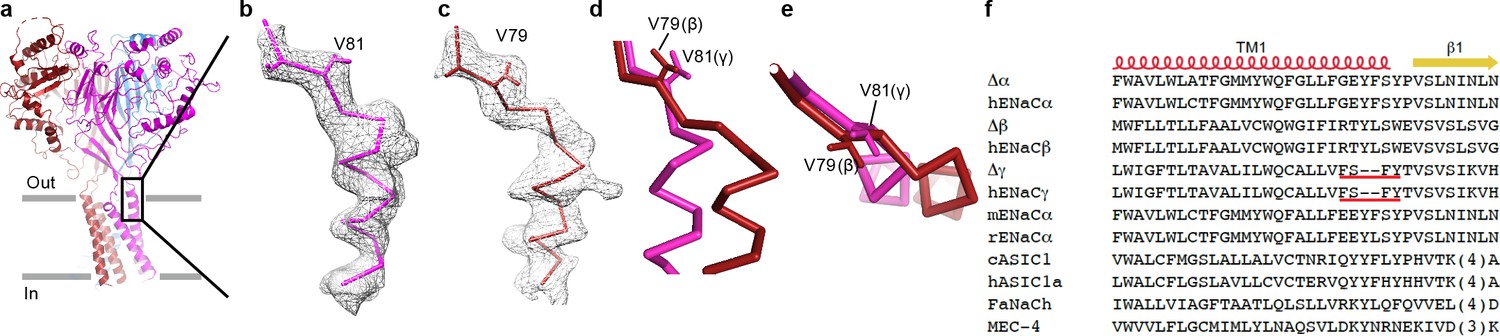
The ΔENaC structure demonstrates asymmetric interactions at the wrist region.
(a) Overall view of ΔENaC as colored in Figure 4 in cartoon representation. (b) View of the boxed region in (a). EM map of TM1 of the γ subunit near the wrist region. The γ subunit is shown in ribbon representation and γ-Val 81 in sticks. (c) EM map of TM1 of the β subunit near the wrist region. The β subunit is shown in ribbon representation and β-Val 89 in sticks representation. (d and e), Superposition of the β1 strands of β and γ subunits viewed parallel (d) and perpendicular (e) to the membrane show that the additional two residues in β extends the linker region between the β1 and TM1 segments. (f) Sequence alignment analysis show that the γ subunit lacks two residues at the TM1/β1 strand interface.
Figure 7 with 1 supplement
The protease-sensitive domain in ENaC is part of the GRIP domain.
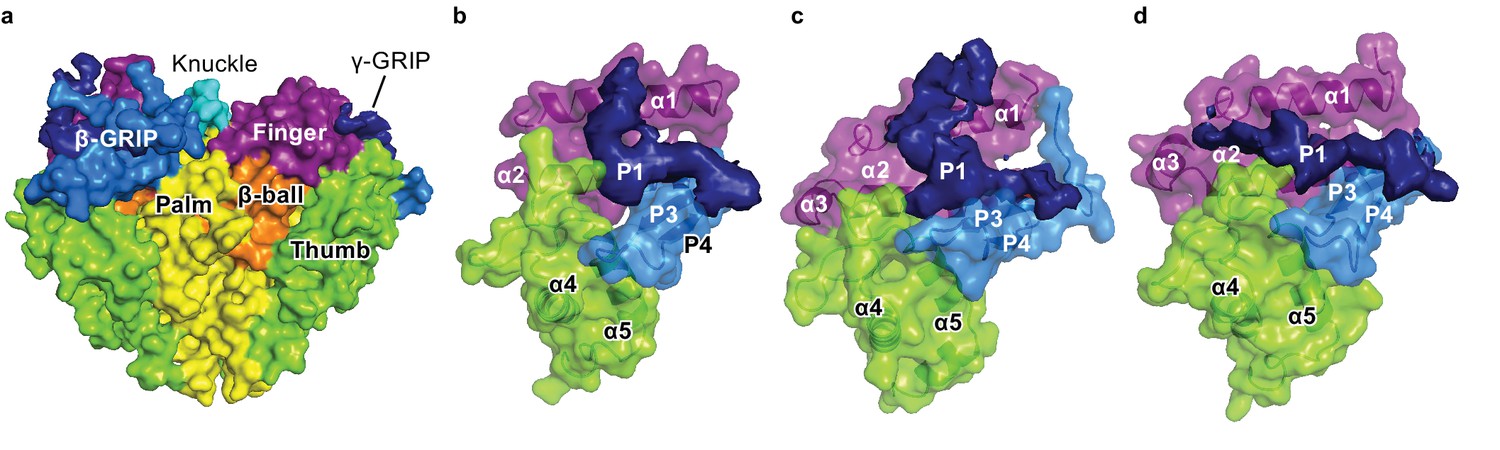
(a) ΔENaC is shown in cartoon representation and colored as in Figure 4. The GRIP domain is shown in surface representation. Close-up view of the cleft formed by the finger and thumb domains and the P3-P4 segments in α (b), β (c), and γ (d). The cleft is occupied by the P1 segment of the GRIP domain. All three subunits contain conserved tryptophans in α2 (αTrp251, βTrp218, and γTrp229), which interacts with the P1 segment. The P3 and P4 strands are stabilized by the α5 of the thumb domain by docking on top of aromatic residues (αTyr455, βHis425, and γTyr433).
Figure 7—figure supplement 1
Cryo-EM map of the P1 segments in α, β, and γ demonstrates critical interactions with the finger and thumb domains.
(a) All the domains in ENaC are represented as the surface derived from the ΔENaC model, except the P1 segments, which are directly reproduced from the potential map. The domains of all three subunits are colored as in Figure 5d. The P3-P4 segments is colored light blue while the potential map of P1 is shown and colored dark blue. (b–d), Close-up view of the finger, thumb, and GRIP domains of each subunit. The finger and thumb domains and P3 and P4 strands of α (b), β (c), and γ (d) are shown in cartoon and surface representations derived from the model of ΔENaC. The potential map of the less-ordered P1 strand of α resembles that of β. The P1 potential map of γ, however, extends toward the α3 helix.
Figure 8
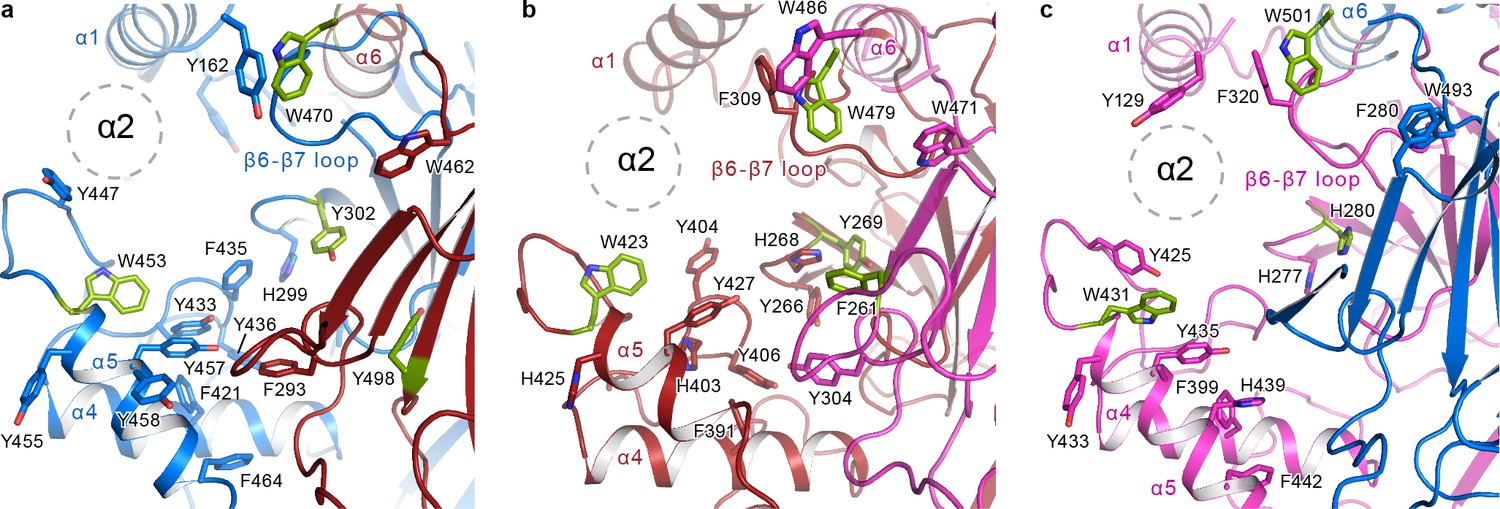
The α2 helix is buried in the aromatic pocket formed by key gating domains in ENaC.
The aromatic pockets at the α-β (a), β-γ (b), and γ-α (c) interfaces are shown in cartoon representation. The aromatic residues are shown in sticks representation. Residues conserved in ASIC are colored green. The α2 helices and the GRIP domains are omitted for clarity. The position of the α2 is shown as dotted circles.
Figure 9
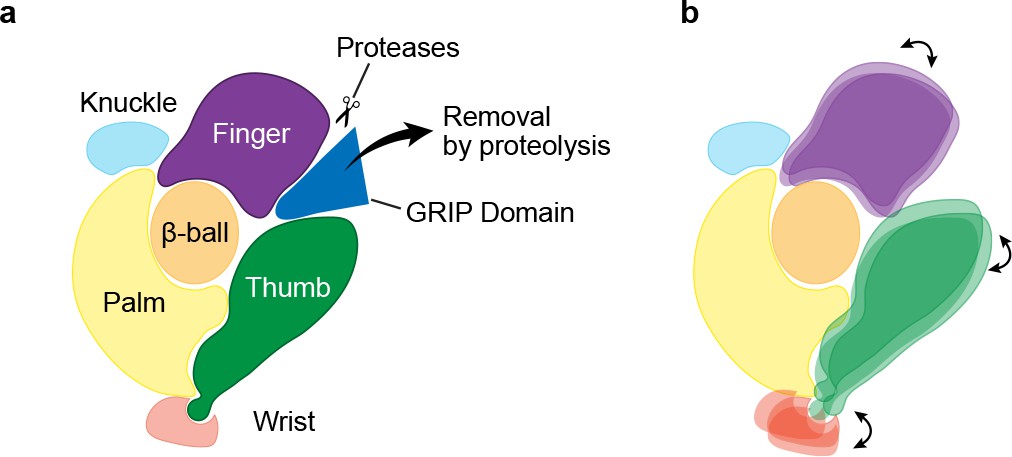
Mechanism of protease-dependent gating in a single ENaC subunit.
Removal of the protease sensitive segments of the GRIP domain (a) induces conformational changes in the finger and thumb domains (b), which is perhaps coupled to ion channel gating through the wrist.
Author response image 1
Selected 2D class averages of ΔENaC.
(a) The 2D class averages of ΔENaC do not show clear and continuous features representative of membrane-spanning domains. (b) Supplementary Figure 4E from Yoo et al. 2018, PMID:29954988.
Author response image 2
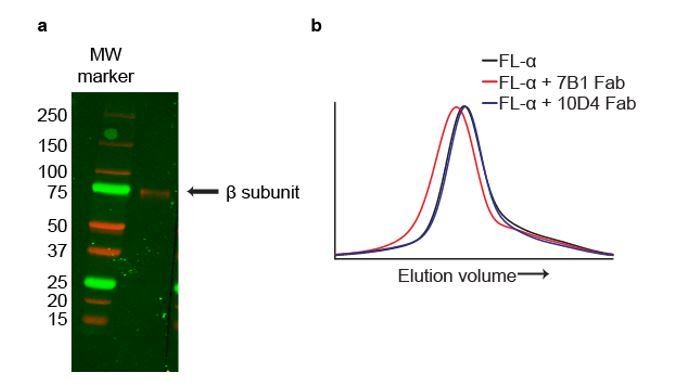
The mAbs 7B1 and 10D4 bind to the α and β subunits, respectively.
(a) Western blot of purified ∆ENaC probed with the 10D4 mAb. The band detected resides near the 75 kDa MW marker indicating that the mAB 10D4 binds to an epitope in the β subunit. (b) Representative traces of FL-α (black) expressed in oocytes. The 7B1 Fab binds to FL-α based on the peak shift to the left (red) while 10D4 Fab does not (blue).
Tables
Key resources table
| Reagent type (species) or resource | Designation | Source or reference | Identifiers | Additional information |
|---|---|---|---|---|
| Gene (Homo sapiens) | amiloride-sensitive sodium channel subunit alpha isoform 1 | Synthetic | NCBI Reference Sequence: NP_001029.1 | Gene sysnthesized by BioBasic |
| Gene (Homo sapiens) | amiloride-sensitive sodium channel subunit beta | Synthetic | NCBI Reference Sequence: NP_000327.2 | Gene sysnthesized by BioBasic |
| Gene (Homo sapiens) | amiloride-sensitive sodium channel subunit gamma | Synthetic | NCBI Reference Sequence: NP_001030.2 | Gene sysnthesized by BioBasic |
| Cell line (Homo sapiens) | HEK293S GnTI- | ATCC | Cat # ATCC CRL-3022 | |
| Cell line (Homo sapiens) | HEK293T/17 | ATCC | Cat # ATCC CRL-11268 | |
| Antibody | 7B1 | OHSU VGTI, Monoclonal Antibody Core | AB_2744525 | Isotype IgG2a, kappa |
| Antibody | 10D4 | OHSU VGTI, Monoclonal Antibody Core | AB_2744526 | Isotype IgG1, kappa |
| Recombinant DNA reagent | pEG BacMam | Gift from Eric Gouaux | doi: 10.1038/nprot.2014.173 | |
| Commercial assay or kit | mMessage mMachine T7 Ultra Transcription | Ambion | AM1345 | |
| Chemical compound, drug | Amiloride hydroschloride hydrate | Sigma | A7410 | |
| Chemical compound, drug | Phenamil mesylate | Tocris | Cat # 3379 | |
| Software, algorithm | Relion-2.0 | doi: 10.1016/j.jsb.2012.09.006 | RRID:SCR_016274 | https://www2.mrc-lmb.cam.ac.uk/relion/index.php?title=Main_Page |
| Software, algorithm | DoG picker | doi: 10.1016/j.jsb.2009.01.004 | OMICS_27772 | https://omictools.com/dog-picker-tool |
| Software, algorithm | MotionCor2 | doi:10.1038/nmeth.4193 | SCR_016499 | http://msg.ucsf.edu/em/software/motioncor2.html |
| Software, algorithm | Gctf | doi:10.1016/j.jsb.2015.11.003 | SCR_016500 | https://www.mrc-lmb.cam.ac.uk/kzhang/Gctf/ |
| Software, algorithm | cryoSparc | doi:10.1038/nmeth.4169 | SCR_016501 | https://cryosparc.com/ |
| Software, algorithm | cisTEM | https://doi.org/10.1038/nmeth.4672 | SCR_016502 | https://cistem.org/ |
| Software, algorithm | Bsoft | doi:10.1006/jsbi.2001.4339 | SCR_016503 | https://lsbr.niams.nih.gov/bsoft/ |
| Software, algorithm | Pymol | PyMOL Molecular Graphics System, Schršdinger, LLC | RRID:SCR_000305 | http://www.pymol.org/ |
| Software, algorithm | UCSF Chimera | doi:10.1002/jcc.20084 | RRID:SCR_004097 | http://plato.cgl.ucsf.edu/chimera/ |
| Software, algorithm | Coot | https://doi.org/10.1107/S0907444904019158 | RRID:SCR_014222 | https://www2.mrc-lmb.cam.ac.uk/personal/pemsley/coot/ |
| Software, algorithm | Rosetta | https://doi.org/10.1371/journal.pone.0020450 | RRID:SCR_015701 | https://www.rosettacommons.org/ |
| Software, algorithm | Phenix | doi:10.1107/S2059798318006551 | RRID:SCR_014224 | https://www.phenix-online.org/ |
| Software, algorithm | Jpred4 | https://doi.org/10.1093/nar/gkn238 | SCR_016504 | www.compbio.dundee.ac.uk/jpred/ |
| Software, algorithm | Psipred v3.3 | https://doi.org/10.1093/bioinformatics/16.4.404 | RRID:SCR_010246 | www.bioinf.cs.ucl.ac.uk/psipred |
| Software, algorithm | QUARK | doi:10.1002/prot.24065 (2012) | OMICS_10835 | https://omictools.com/quark-tool |
| Software, algorithm | Molprobity | doi:10.1107/S0907444909042073 | RRID:SCR_014226 | http://molprobity.biochem.duke.edu |
Additional files
-
Transparent reporting form
- https://doi.org/10.7554/eLife.39340.034
Download links
A two-part list of links to download the article, or parts of the article, in various formats.
Downloads (link to download the article as PDF)
Open citations (links to open the citations from this article in various online reference manager services)
Cite this article (links to download the citations from this article in formats compatible with various reference manager tools)
Structure of the human epithelial sodium channel by cryo-electron microscopy
eLife 7:e39340.
https://doi.org/10.7554/eLife.39340


