Potential herd protection against Plasmodium falciparum infections conferred by mass antimalarial drug administrations
- University of California, United States
- Mahidol University, Thailand
- University of Oxford, United kingdom
- University of Montpellier, France
- Centre Hospitalier Universitaire de Montpellier, France
- Harvard University, United States
Figures
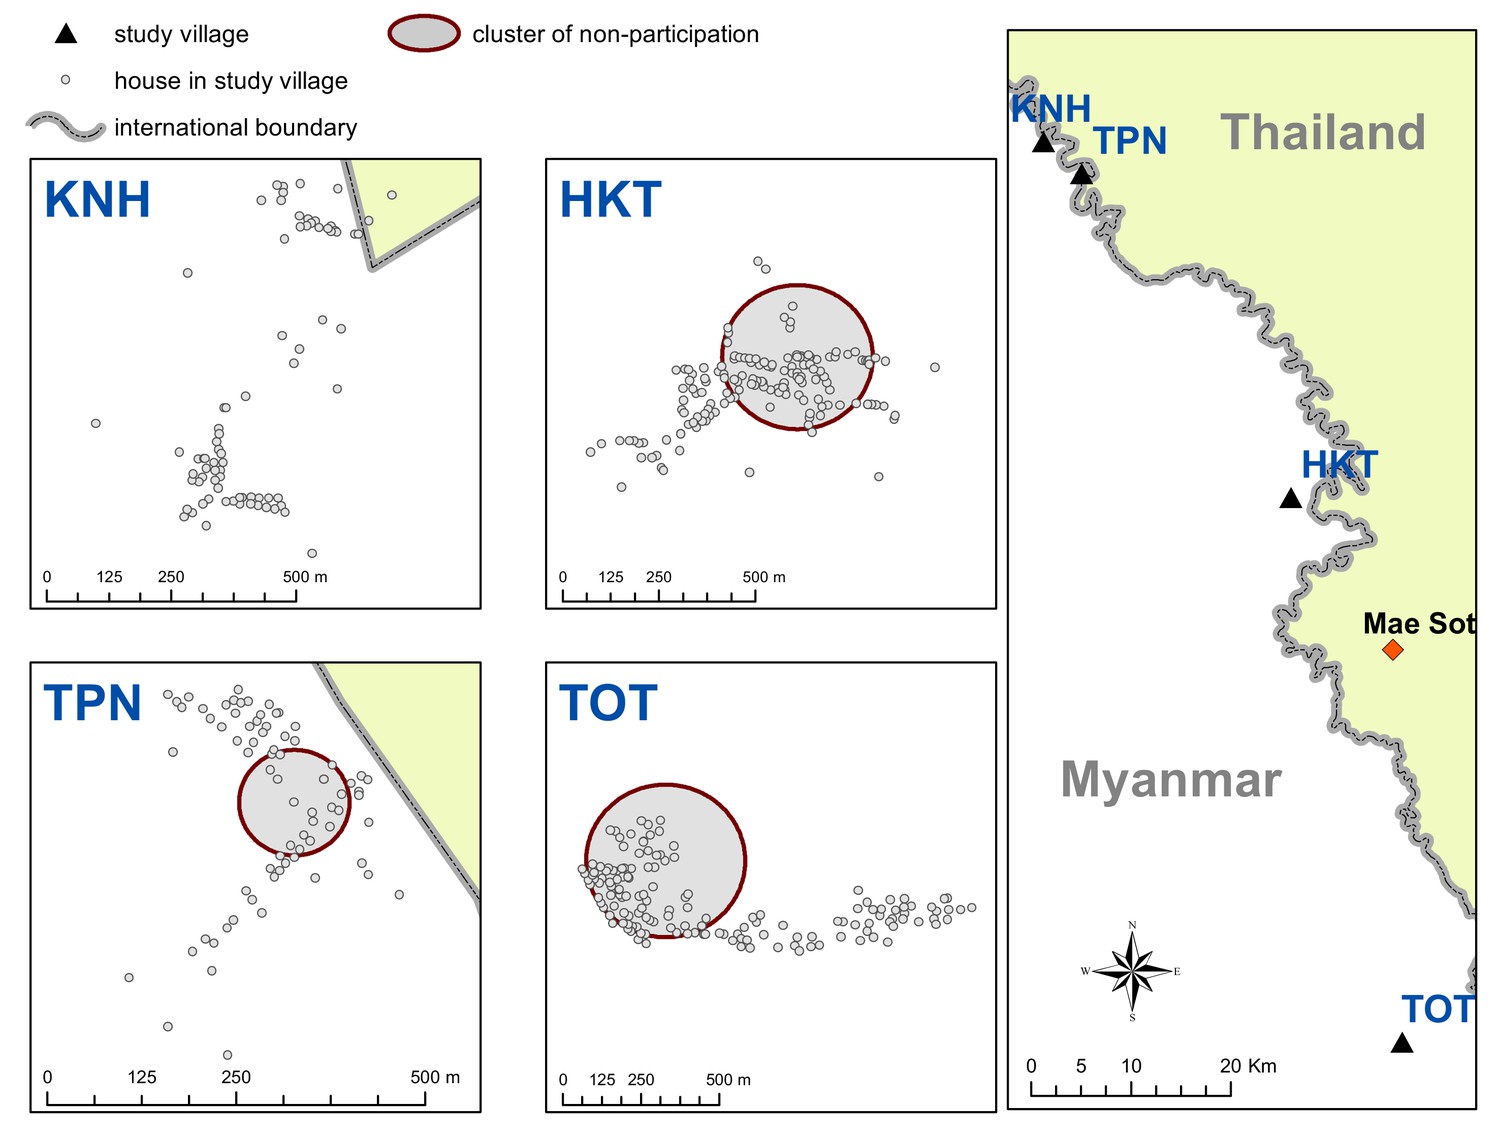
Figure 1

Map indicating the locations of the study villages along the Myanmar-Thailand border; and the distribution of houses, mosquito catch sites and malaria posts within study sites.
https://doi.org/10.7554/eLife.41023.003
Figure 2
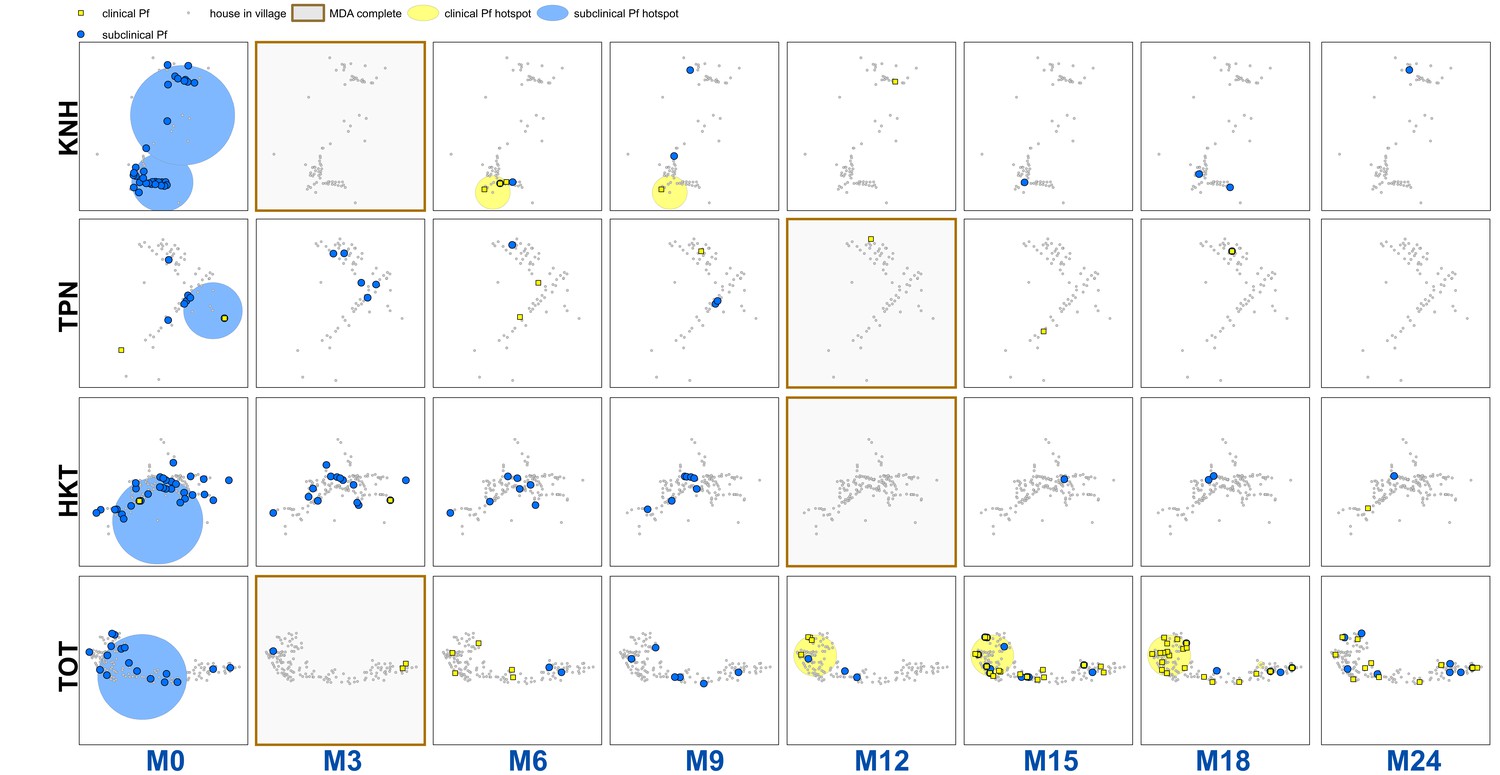
Clinical P.falciparum episodes (yellow square points) and uPCR-detected P. falciparum infections (blue dots) at house level over time (by survey month; month 0 (M0) through month 24 (M24)) for each of the four study villages.
Statistically significant clusters (detected using SaTScan) are indicated for both clinical episodes (underlying yellow circles) and uPCR-detected infections (underlying blue circles). Grey points indicate house locations for houses with no infections or episodes in a given time. In the maps clinical episodes are aggregated to align with surveys (i.e. M1, M2 and M3 aggregated into M3), though they were recorded and analyzed by individual month. The study was conducted from May 2013 through June 2015 (KNH began in June; TPN in May; HKT in July; and TOT in May of 2013).
Figure 3
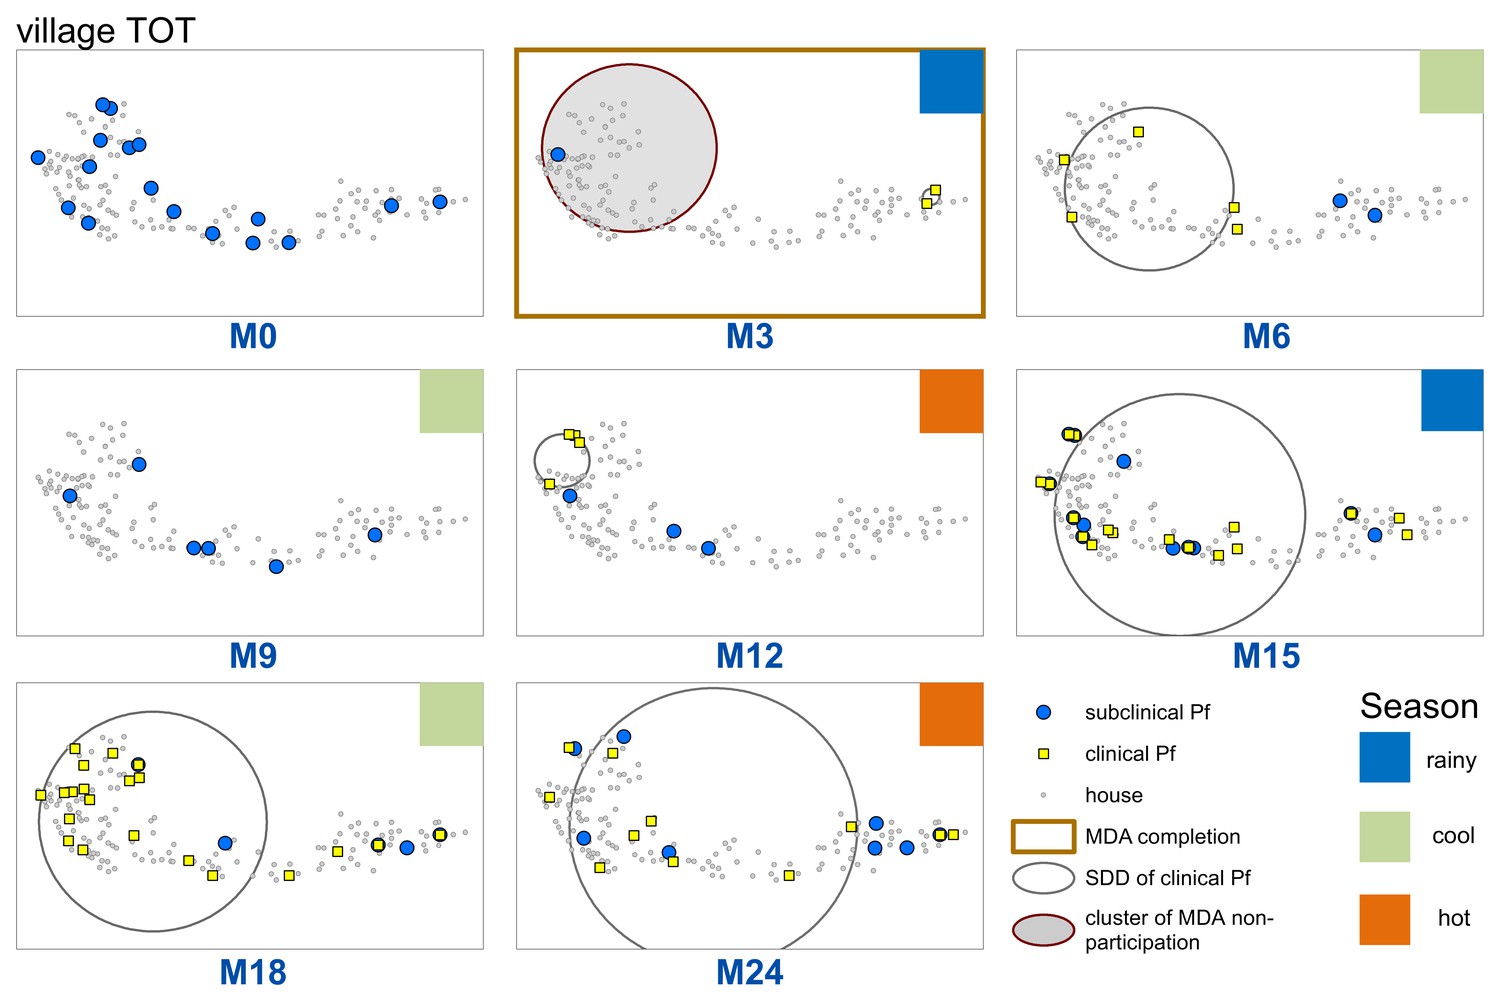
Spatiotemporal distribution of clinical P.falciparum episodes (yellow square points), uPCR-detected P. falciparum infections (blue dots), and a cluster of non-participation in MDA (grey circle/ochre border, detected using SatScan) in TOT village.
Season is indicated by colored squares in the top right corner of each map. A measure of the spread of clinical P. falciparum cases is given by the standard distance deviation (‘SDD’), indicated by the hollow circle with dark grey outline. One standard deviation is shown, indicating that roughly 68% of all cases lie inside of the circle. After MDA (M3), clinical episodes began occurring in the westernmost portion of the village. By month 15 (M15), clinical episodes were occurring throughout the village.
Figure 4
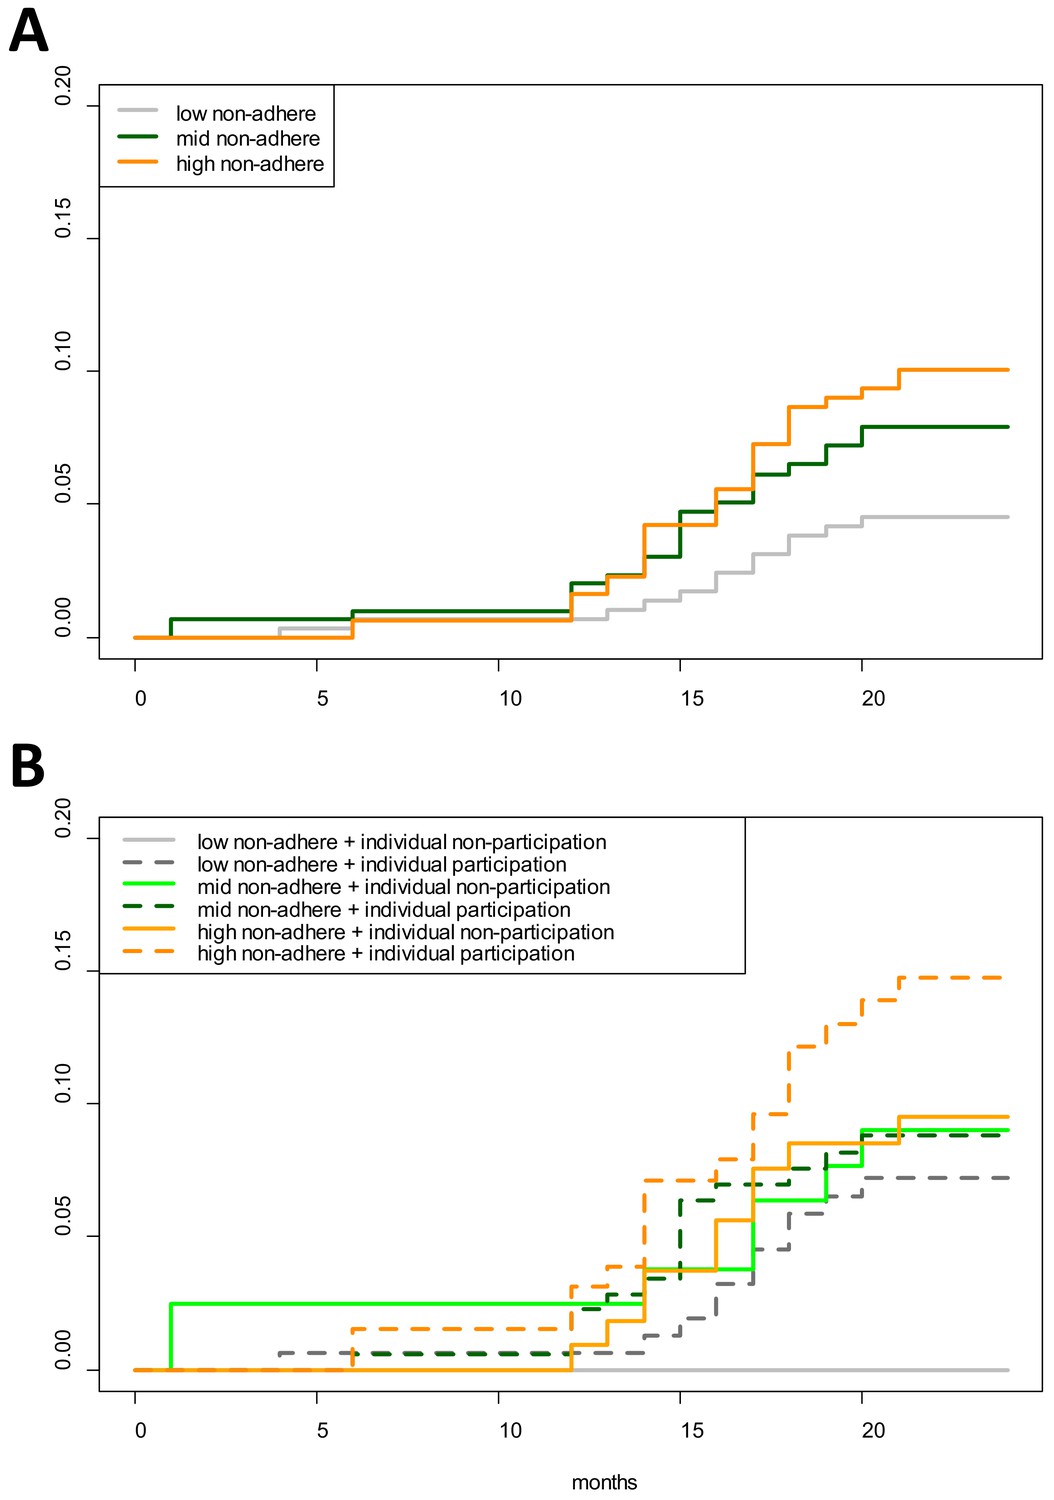
Cumulative hazard of having a clinical P. falciparum episode by MDA adherence.
Cumulative hazard for clinical P. falciparum episodes in village TOT by (A) neighborhood MDA adherence (‘low non-adhere’ is a neighborhood with a low proportion of non-adherents; ‘high non-adhere’ is a neighborhood with a high proportion of non-adherents), (B) neighborhood adherence (same as in A) and individual adherence (‘individual non-participation’ indicates individuals who took no MDA while ‘individual participation’ indicates individuals who took at least 1 round of MDA). Figure 4B indicates that individuals who participated in MDA and lived in a neighborhood with low adherence had the highest risk of having a clinical episode post-MDA. Individuals who took no rounds of MDA but lived in a neighborhood with a high proportion of adherents had the lowest risk of acquiring a clinical episode post-MDA.
Appendix 1—figure 1

Clinical P.vivax episodes (yellow square points) and uPCR-detected P. vivax infections (blue dots) at house level over time for each of the four study villages.
Statistically significant clusters (detected using SaTScan) are indicated for both clinical episodes (underlying yellow circles) and PCR-detected infections (underlying blue circles). MDA completion is indicated by the dark brown box bordering the survey time period (months 0 through 24, indicated as M0 – M24 along the x-axis). Blood stage P. vivax parasites were largely cleared following MDA. Since no accurate field diagnostic for glucose-6-phosphate dehydrogenase (G6PD) deficiency existed at the time, it was deemed unsafe to provide 7 or 14 days of the hypnozoitocidal drug primaquine. Many of the subsequent infections and clinical episodes are likely a result of re-emergence of hypnozoite-stage parasites rather than new P. vivax infections.
Appendix 1— figure 2
Spatial clusters (detecting using SatScan) of non-participation in MDA.
https://doi.org/10.7554/eLife.41023.015
Appendix 1— figure 3
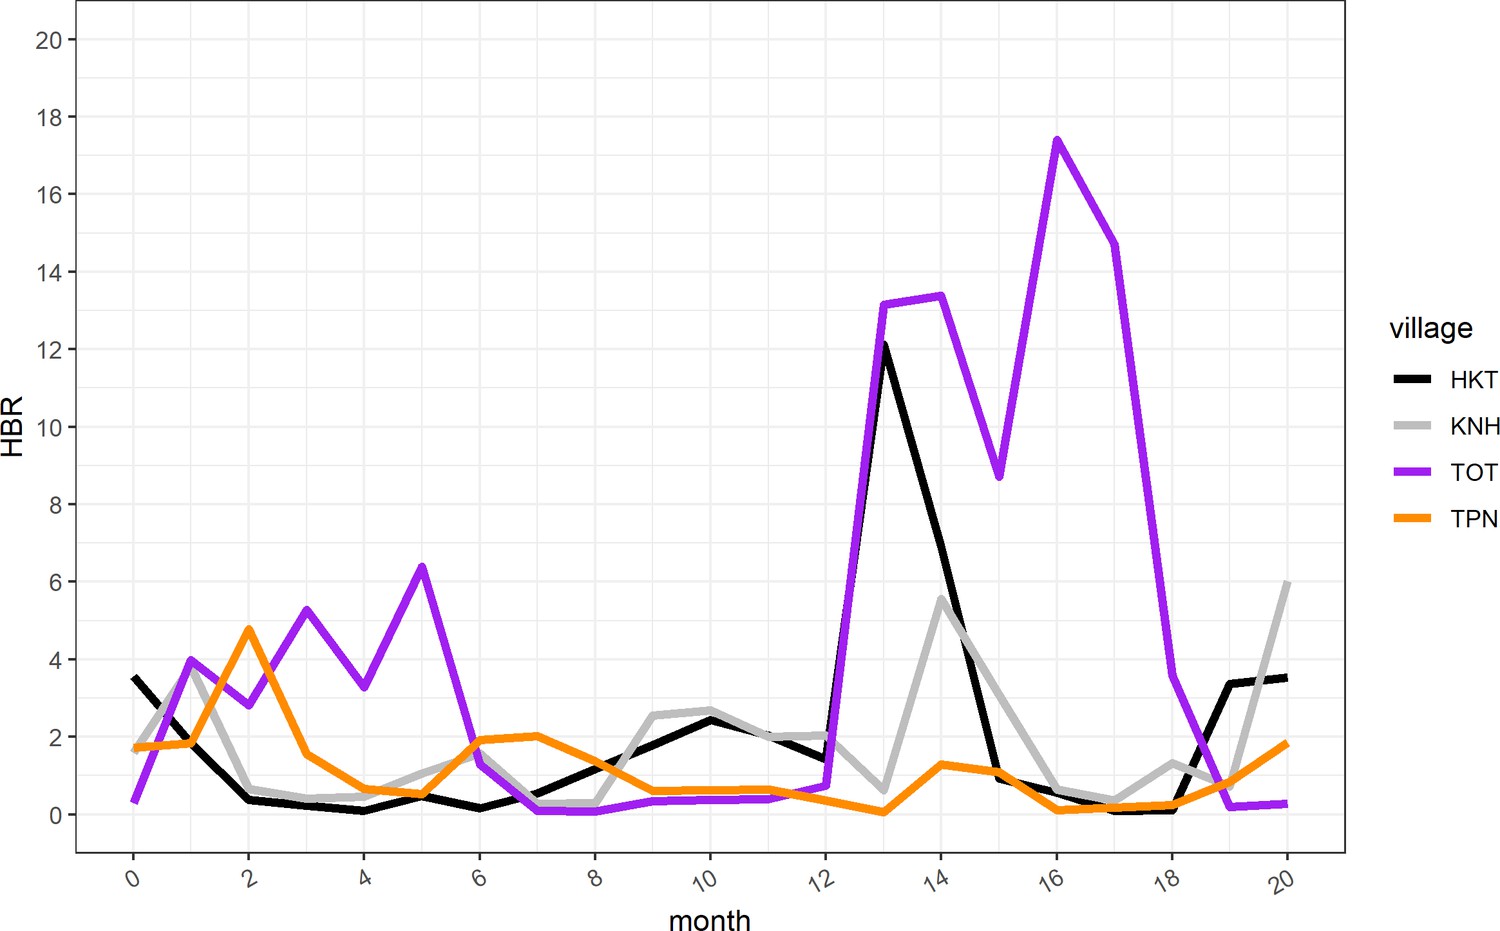
Human biting rate (HBR) for primary vectors by study month.
https://doi.org/10.7554/eLife.41023.016
Appendix 1— figure 4
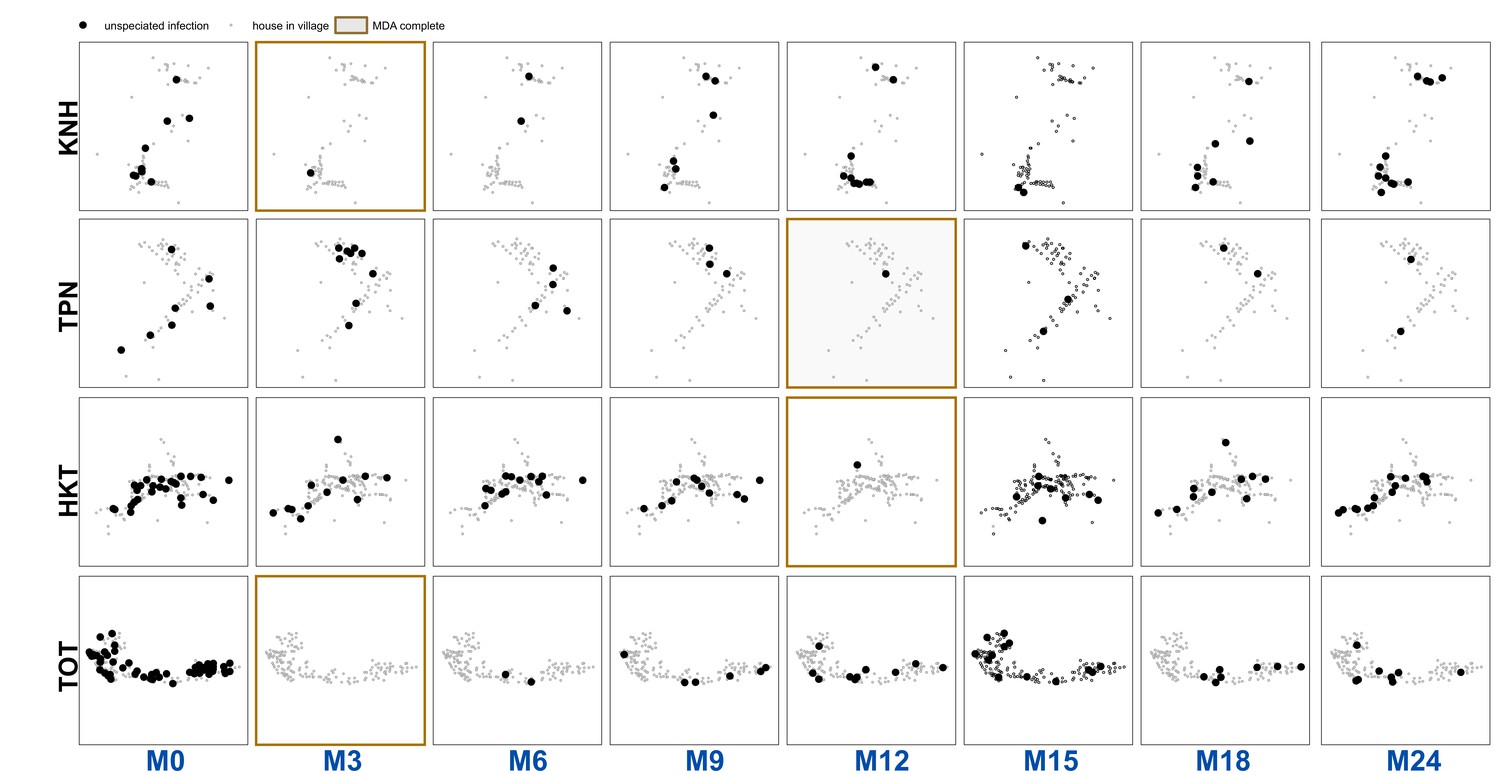
Unspeciated uPCR-detected infection for each village and survey.
https://doi.org/10.7554/eLife.41023.017
Author response image 1
Tables
Table 1
Multivariable mixed effects logistic regression for odds of having a clinical P. falciparum episode (village TOT only).
The model includes a random intercept for individual participants, with repeat observations occurring within individuals over the study period.
| Covariate | AOR | p-Value |
|---|---|---|
| Age 0 to 4 | Comparison | |
| Age 5 to 14 | 3.41 (1.33–8.77) | 0.0104 |
| Age 15 plus | 2.17 (0.86–5.46) | 0.1053 |
| Female | Comparison | |
| Male | 1.19 (0.66–2.11) | 0.5612 |
| Participated in no rounds of MDA | Comparison | |
| Participated in MDA (at least one round) | 1.43 (0.73–2.78) | 0.2994 |
| No house member with clinical episode | comparison | |
| House member with clinical episode | 3.43 (1.52–7.72) | 0.0004 |
| Low neighborhood non-adherence to MDA | comparison | |
| Mid neighborhood non-adherence to MDA | 2.00 (0.87–4.60) | 0.0879 |
| High neighborhood non-adherence to MDA | 2.85 (1.28–6.37) | 0.0098 |
| Mean village HBR | 1.09 (1.05–1.13) | <0.0001 |
| Study month | 1.19 (1.10–1.27) | <0.0001 |
Table 2
Table of predictor variables (covariates) used in regressions.
https://doi.org/10.7554/eLife.41023.007| Covariate | Level | Description |
| Age group | Individual | Ordinal; age groups: 0 to 4; 5 to 14; and 15 and above |
| Gender | Individual | Binary; male or female |
| Individual adherence to MDA | Individual | Binary; whether an individual participated in MDA or not (at least one full round) |
| Household member with clinical episode | Household | Binary; one if another house member had a clinical episode and 0 if not |
| Household member with uPCR-detected infection | Household | Binary; one if another house member had a uPCR-detected infection and 0 if not |
| Neighborhood MDA non-adherence | Household/neighborhood | Ordinal (split into tertiles); proportion of people within 100 m radius who did not complete all three rounds of MDA |
| Human biting rate (HBR) | Village | Continuous; average number of bites per person per night |
| Study month | Village | Continuous; 1–26 (from May 2013 through June 2015); included as a control |
Appendix 1—table 1
Terciles (lower, middle and upper 1/3) of MDA non-adherence (% taking no rounds of MDA) in TOT
https://doi.org/10.7554/eLife.41023.011| High non-adherence | >0.294 |
| Mid non-adherence | >0.20 and <0.294 |
| Low non-adherence | <0.20 |
Appendix 1—table 2
Multivariable mixed effects logistic regression for odds of having a clinical P. falciparum episode.
The model includes a random intercept for individual participants, with repeat observations occurring within individuals over the study period. Unlike the model in the main text (Table 1) neighborhood non-adherence to MDA and individual adherence to MDA are continuous covariates. Study month was included as a control (a linear specification was used, but polynomial specifications were also tested). The covariates for human biting rate (HBR) and having a house member with a clinical episode in the same month were specified as time-varying covariates.
| Covariate | AOR | p-value |
|---|---|---|
| Age 0 to 4 | comparison | |
| Age 5 to 14 | 3.5 (1.3–9.0) | 0.0112 |
| Age 15 plus | 2.2 (0.9–5.6) | 0.1014 |
| female | comparison | |
| Male | 1.2 (0.7–2.2) | 0.5147 |
| no house member with clinical episode | comparison | |
| house member with clinical episode | 3.8 (1.8–7.7) | 0.0003 |
| proportion of MDA doses complete | 1.0 (1.0–1.1) | 0.4488 |
| proportion of non-adherers in neighborhood | 1.4 (1.0–1.8) | 0.0380 |
| mean village HBR | 1.1 (1.1–1.1) | <0.0001 |
| study month | 1.2 (1.1–1.3) | <0.0001 |
Appendix 1—table 3
Logistic regression for the odds of having a uPCR-detected P. falciparum infection after MDA.
Individuals in the data were coded as having an infection if they were ever determined by uPCR to have an infection through blood screenings in full village blood surveys after MDA. Almost all P. falciparum episodes occurred in a single village (TOT) and the analysis for P. falciparum was only conducted on data from that village. HBR is not included in this regression as it varies across time.
| Covariate | AOR | p-value |
|---|---|---|
| 0 to 4 | comparison | |
| five to 14 | 6.1 (1.1–113.9) | 0.0877 |
| 15 plus | 5.5 (1.1–99.3) | 0.1017 |
| female | comparison | |
| male | 1.3 (0.6–2.7) | 0.5217 |
| participated in no rounds of MDA | comparison | |
| participated in MDA (at least one round) | 0.4 (0.2–1.1) | 0.0955 |
| no house member with uPCR infection | comparison | |
| house member with uPCR infection | 1.1 (0.4–2.7) | 0.8039 |
| no house member with clinical episode | comparison | |
| house member with clinical episode | 1.7 (0.7–3.8) | 0.2029 |
| low neighborhood non-adherence to MDA | comparison | |
| mid neighborhood non-adherence to MDA | 1.1 (0.4–3.2) | 0.8743 |
| high neighborhood non-adherence to MDA | 2.6 (1.0–7.1) | 0.0488 |
| number of surveys attended | 1.3 (1.1–1.6) | 0.0075 |
Appendix 1—table 4
Multivariable mixed effects logistic regression for odds of having a clinical P. vivax episode.
The model includes a random intercept for individual participants, with repeat observations occurring within individuals over the study period. Study month was included as a control (a linear specification was used, but polynomial specifications were also tested). The covariates for human biting rate (HBR) and having a house member with a clinical episode in the same month were specified as time-varying covariates.
| Covariate | AOR | p-value |
|---|---|---|
| Age 0 to 4 | comparison | |
| Age 5 to 14 | 1.0 (0.4–2.4) | 0.9945 |
| Age 15 plus | 0.4 (0.2–0.9) | 0.0358 |
| female | comparison | |
| male | 0.8 (0.4–1.5) | 0.4687 |
| participated in no rounds of MDA | comparison | |
| participated in MDA (at least one round) | 1.7 (0.7–4.3) | 0.2678 |
| no house member with clinical episode | comparison | |
| house member with clinical episode | 5.8 (3.4–9.9) | <0.0001 |
| low neighborhood non-adherence to MDA | comparison | |
| mid neighborhood non-adherence to MDA | 1.6 (0.3–7.6) | 0.5546 |
| high neighborhood non-adherence to MDA | 1.8 (0.3–9.8) | 0.5205 |
| mean village HBR | 1.0 (1.0–1.1) | 0.1447 |
| village KNH | comparison | |
| village TPN | 0.6 (0.2–1.8) | 0.3666 |
| village HKT | 0.3 (0.1–1.5) | 0.1329 |
| village TOT | 0.6 (0.1–3.4) | 0.6074 |
| study month | 1.0 (1.0–1.1) | 0.0126 |
Appendix 1—table 5
Multivariable logistic regression for the odds of having a uPCR detected P. vivax infection after MDA.
Individuals in the data were coded as having an infection of either species if they were ever determined by uPCR to have an infection through blood screenings in full village blood surveys after MDA.
| Covariate | AOR | p-value |
|---|---|---|
| 0 to 4 | comparison | |
| five to 14 | 2.6 (1.7–3.9) | <0.0001 |
| 15 plus | 2.1 (1.4–3.2) | 0.0002 |
| female | comparison | |
| male | 1.8 (1.4–2.2) | <0.0001 |
| participated in no rounds of MDA | comparison | |
| participated in MDA (at least one round) | 0.6 (0.4–0.8) | 0.0027 |
| no house member with uPCR infection | comparison | |
| house member with uPCR infection | 1.5 (1.2–1.9) | 0.0022 |
| no house member with clinical episode | comparison | |
| house member with clinical episode | 1.3 (1.0–1.7) | 0.0284 |
| low neighborhood non-adherence to MDA | comparison | |
| mid neighborhood non-adherence to MDA | 0.6 (0.4–1.1) | 0.0994 |
| high neighborhood non-adherence to MDA | 0.6 (0.4–1.1) | 0.0945 |
| KNH | comparison | |
| TPN | 1.0 (0.7–1.5) | 0.8617 |
| HKT | 1.4 (0.8–2.5) | 0.2614 |
| TOT | 5.4 (2.9–9.8) | <0.0001 |
| number of surveys attended | 1.4 (1.3–1.5) | <0.0001 |
Appendix 1—table 6
Household and population counts for study villages
Data used in this analysis are available following the Mahidol-Oxford Tropical Medicine Research Unit data access policy. Both the policy and application form are available at: http://www.tropmedres.ac/data-sharing.
| Village | Households | Population |
|---|---|---|
| KNH | 86 | 504 |
| TPN | 75 | 468 |
| HKT | 176 | 1338 |
| TOT | 149 | 919 |
| total | 486 | 3229 |
Additional files
-
Transparent reporting form
- https://doi.org/10.7554/eLife.41023.009
Download links
A two-part list of links to download the article, or parts of the article, in various formats.
Downloads (link to download the article as PDF)
Open citations (links to open the citations from this article in various online reference manager services)
Cite this article (links to download the citations from this article in formats compatible with various reference manager tools)
Potential herd protection against Plasmodium falciparum infections conferred by mass antimalarial drug administrations
eLife 8:e41023.
https://doi.org/10.7554/eLife.41023


