A florigen paralog is required for short-day vernalization in a pooid grass
- University of Wisconsin, United States
- University of Wisconsin-Madison, United states
- University of Wisconsin, United states
- College of Horticulture, Northwest A&F University, China
Figures
Figure 1 with 2 supplements
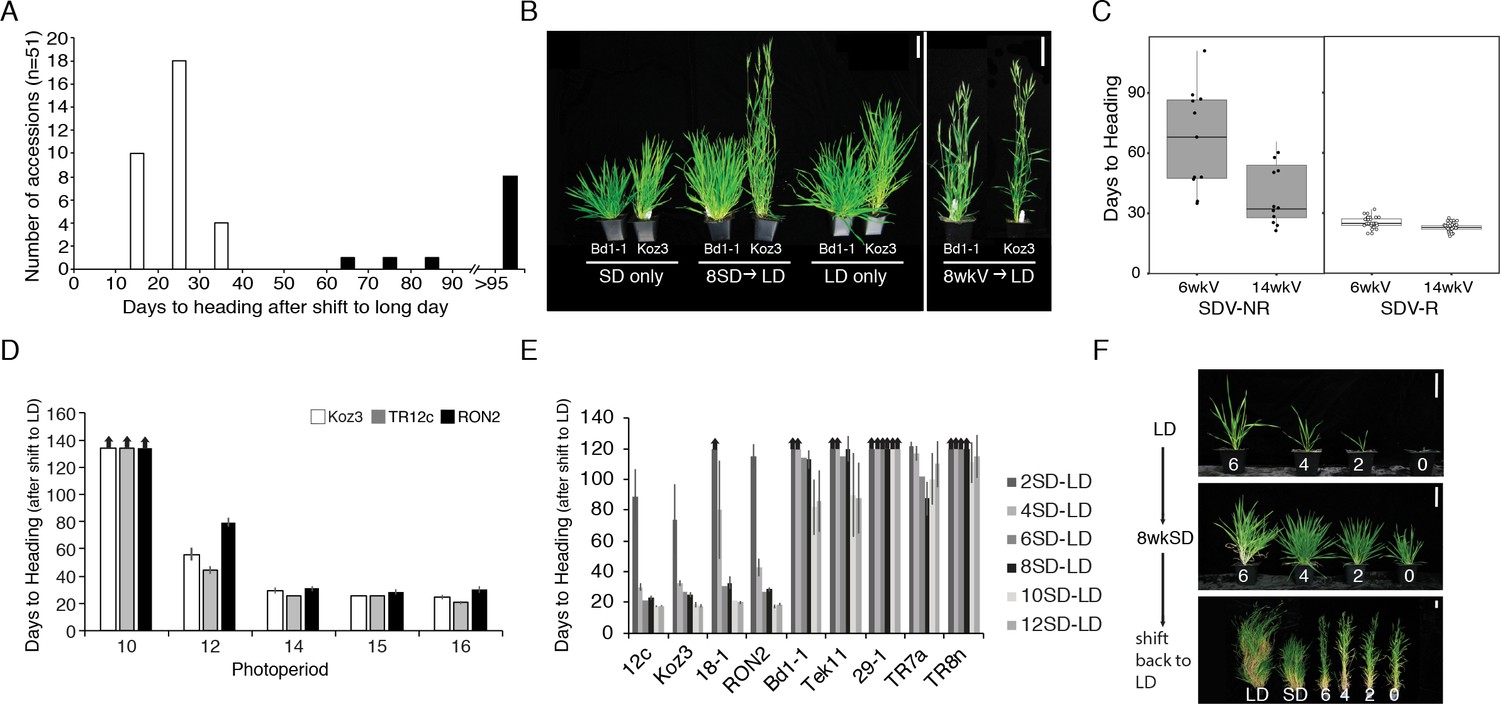
Natural variation in the short-day (SD) vernalization response in B.distachyon.
(A) SD vernalization response in 51 accessions that require cold mediated vernalization. Plants were grown for 56 days in 8 hr SD before the shift into long days (LD) of 14 hr (eight rapid flowering accessions when grown in 16 hr or 20 hr, see also Figure 1—figure supplement 1) or 16 hr (43 delayed flowering accessions). Day temperature of 21°C and night temperature of 18°C. SD vernalization is equally effective when day and night temperatures are constant (see Materials and methods for details). White bars indicate accessions that are SD vernalization responsive and black bars accessions that are SD vernalization non-responsive. (B) Image of a representative SD vernalization responsive accession Koz3 and a SD vernalization non-responsive accession Bd1-1 taken after 100 days of growth. Only Koz3 flowers after the SD to LD shift whereas both accessions flower rapidly if exposed to 8 weeks of cold (8wkV) prior to growth in 16 hr LD. (C) Box plot illustrating that SD vernalization non-responsive accessions (SDV-NR, black dots) require longer periods of cold exposure to flower rapidly in 16 hr LD relative to SD vernalization responsive (SDV-R, white dots) accessions. The difference between SDV-NR and SDV-R flowering after vernalization is statistically significant. See supplemental Table S1-2 for days to heading, leaf count and standard deviation data for SD vernalization and Table S3 for days to heading data for 6 and 14 weeks of vernalization (6wkV and 14wkV). Bar = 5 cm (D) Short day vernalization response in three delayed-flowering accessions Koz3, TR12c and RON2 when shifted into 10, 12, 14, 15, and 16 h days. In this experiment, LD only and SD only control plants flowered similar to those in Table S1-2 (data not shown). Arrows indicate treatments in which plants did not flower within the experiment. Bars represent the average days to heading of 12 plants for each treatment. (E) SD vernalization time course. See Figure 1—figure supplement 1B for SD and LD only controls and Figure 1—figure supplement 1C for representative photo of plants at the end of the experiment. (F) The SD vernalization response is effective at multiple developmental stages. Koz3 and Tr12c were grown for 6, 4, 2, 0 weeks under 16 hr LD before shifting into 8 weeks of 8 hr SD (8wkSD). After the SD treatment plants were shifted back into LD. Representative photo of Koz3 taken after 40 days. See Figure 1—figure supplement 1D,E and Supplemental Table 1 and 2 for days to heading and leaf count data.
Figure 1—figure supplement 1
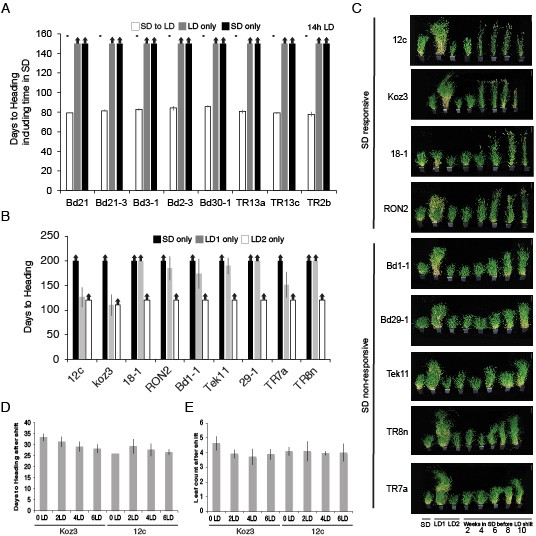
Natural variation in the short day vernalization response.
(A) Short day vernalization response in eight accessions which flower rapidly in 20 hr or 16 hr daylengths, but which require vernalization when grown in a 14 hr daylength. White bars represent plants grown in 8 hr short days for 8 weeks before shifting into 14 hr long days (14 hr LD). Grey bars represent control plants grown solely in 14 hr LD (LD only) for the duration of the 150 day experiment and black bars represent control plants grown solely in 8 hr short days (SD only) for the duration of the experiment. Asterisks indicate statistically significant differences between SD to LD and LD only control plants (p < 0.05). Arrows indicate treatments in which plants did not flower within the 150-d experiment. Bars represent the average days to heading of 12 plants for each treatment. (B) Days to heading of SD and LD only controls for the multiple developmental stages experiment. LD1, 20 h days for the full duration of the experiment. LD2, 20 h days but planted once all SD treated plants were shifted into LD. (C) Representative photographs of plants at the end of SD exposure time course experiment. LD1, 20 h days only for the full duration of the experiment. LD2, 20 h days but planted once all SD treated plants were shifted into LD. Bar = 12 cm. (D) Days to heading after shift into LD (E) Number of leaves formed on the parent culm after plants shifted into LD and flowered.
Figure 1—figure supplement 2

Geographical distribution of B.distachyon accessions used in this study.
(A) Black dots represent SD vernalization-non-responsive accessions and white dots represent SD vernalization-responsive accessions. (B) Box plot indicating latitudinal distribution of SD vernalization non-responsive (SDV-NR; gray bar) and SD vernalization responsive (SDV-R; white bar) accessions. The difference is significant (p < 0.05). (C) Photoperiod throughout a year for each accession used in this study in their native habitat.
Figure 2 with 6 supplements

FTL9 is necessary for the SD vernalization response and sufficient to confer competence to flower.
(A) amiFTL9 knockdown prevents SD vernalization. Koz3 wild-type and amiFTL9 knockdown plants grown in 8 hr SD for 9 weeks (9wk SD) before shifting into 20 hr LD. Bar= 5 cm. (B) amiFTL9 knockdown has no effect on cold-mediated vernalization. Plants were vernalized as imbibed seed at 5°C for 6 weeks (6wkV) before outgrowth in 20 hr LD. Bar = 5 cm. See Figure 2—figure supplement 1 for amiFTL9 details. All experiments were repeated with similar results. (C) Constitutive expression of dominant FTL9 alleles permits flowering in LD. Representative photo of Bd21-3 wild-type, UBI:FTL9 Bd21 (FTL9 from Bd21), UBI:FTL9 Koz3 (FTL9 from Koz3), UBI:FTL9 Bd1-1 (FTL9 from Bd1-1), UBI:FT1, and UBI:VRN1 grown in a 16 hr photoperiod (LD) without cold or short day vernalization. All over expression lines are in the Bd21-3 background. Bar = 5 cm. See Figure 2—figure supplement 3 for UBI:FTL9 details including days to heading, leaf count data as well as mRNA expression analyses.
-
Figure 2—source data 1
Koz3 X Bd1-1 F2 QTL information.
- https://doi.org/10.7554/eLife.42153.012
-
Figure 2—source data 2
VCF summary of variants in mapped interval.
- https://doi.org/10.7554/eLife.42153.013
Figure 2—figure supplement 1
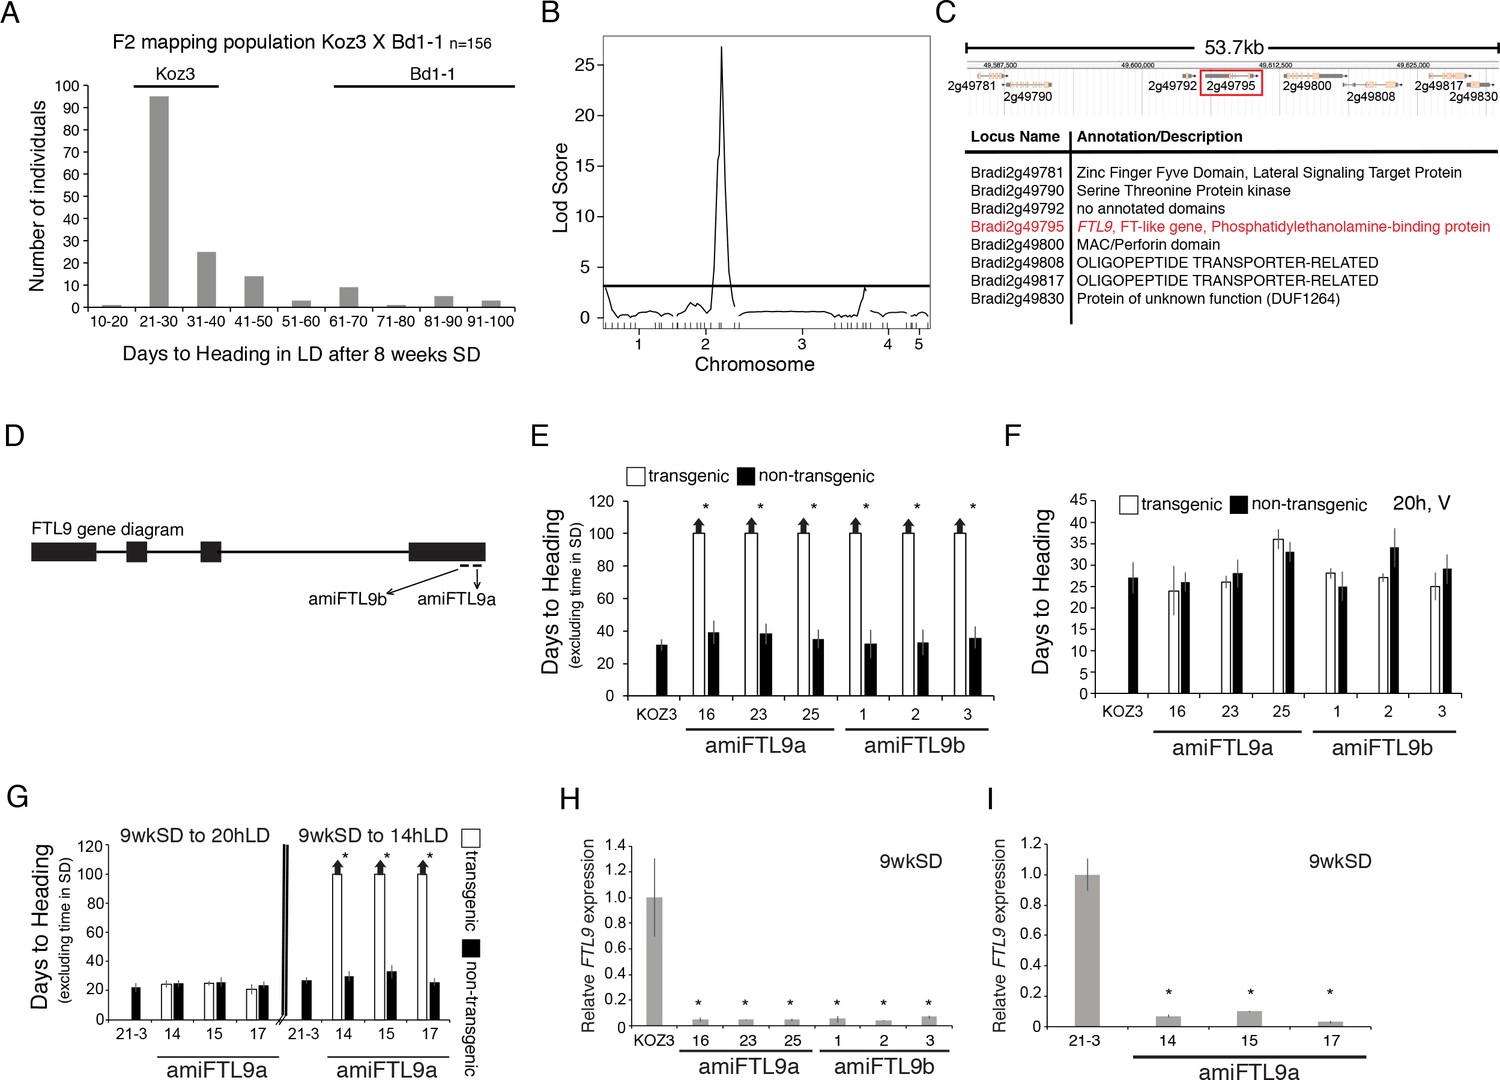
Identification of the FT-like paralog FTL9 as essential for SD vernalization.
(A) Koz3 X Bd1-1 F2 mapping population. The F2 population was grown in 8 hr SD for 8 weeks before shifting into 20 hr LD. Days to heading does not include the time the population was in SD. Koz3 and Bd1-1 controls (grown in LD only) flowered as indicated above bars. (B) To identify regions of the B. distachyon genome contributing to the flowering variation in the F2 mapping population from (A), we performed a QTL analysis. Phenotypic data were correlated to genotypic data using 38 indel markers (see Table S4 for primer information and Data S1 for the phenotypic and genotypic data sets). A single, large-effect peak was detected at the bottom of chromosome 2. (C) Diagram of the 53.7 kb interval containing the QTL using version 3.1 of the B. distachyon genome indicating eight annotated genes within the interval. (D) Gene structure of FTL9 showing the location of two amiRNA (amiFTL9a and amiFTL9b) targets in the 3’ region of the gene. We targeted two different areas within the FTL9 gene to control for off-target microRNA effects. (E) Days to heading of Koz3, three independent T1 amiFTL9 transgenics (black bars), and non-transgenic sibling plants (white bars) grown in 20 h days after exposure to 9 weeks of 8 hr SD. (F) Days to heading of Koz3, amiFTL9 transgenics, and the non-transgenic sibling plants vernalized as imbibed seed for 4 weeks at 5°C before outgrowth in 20 hr. (G) Days to heading of Bd21-3, three independent T1 amiFTL9 transgenics (black bars), and non-transgenic sibling plants (white bars) grown in 20 hr and 14 hr. Bd21-3 does not have a vernalization requirement when grown under 20 hr light but does under 14 hr. For E,F, and G arrows above bars indicate that none of the plants flowered at the end of the experiment. (H–I) qRT-PCR of FTL9 expression in amiFTL9 confirming the knock down of FTL9 expression in 8 hr SD. The newly formed ninth leaves on the parent culm were harvested either when the plants were at the ninth leaf stage or after 9 weeks of growth in 8 hr SD (9wkSD). Note the expression of the closely related paralog of FTL9, FTL10 was not affected by the amiRNA nor was VRN2 expression (data not shown). Asterisks above bars indicate statistically significant differences between amiFTL9 transgenic and either wildtype or non-transgenic sibling plants (*p < 0.05).
Figure 2—figure supplement 2

Coding variant summary within the SD vernalization mapped interval between SD vernalization responsive and non-responsive accessions.
(A) List of non-synonymous variants (non-syn) or frameshifts that occur in the coding (CDS) region of all annotated genes within the 53.7 kb mapped interval between Koz3 and Bd1-1 and the remaining 49 B.distachyon accessions that have been sequenced (Gordon et al., 2017). In parentheses is the prevalence of that variant across the 40 SD responsive accessions or the 11 SD non-responsive accessions. For a complete list of all variants (intronic, UTR, and intergenic) in the genes within the mapped interval see Data S2. The putative causative variant is in red. Variants within the full genomic sequence of FTL9 were confirmed in all 51 sequenced accessions by Sanger sequencing. (B) Alignment of part of the phosphatidylethanolamine-binding domain in FT-like genes including the ligand-binding motif. The red boxes denote the two non-synonymous variants present in Bd1-1 not found in SD vernalization responsive accessions such as Koz3. The N to H change (1 st variant) is not found across all SD non-responsive accessions and the amino acids at that position are highly variable across FT-like genes. In contrast, the T to K change (2nd variant, causative) in Bd1-1 is present in all SD non-responsive accessions and is in an amino acid that is highly conserved in other PEBP containing genes spanning plants and animals (Aedes aeygypti, a mosquito species, shown as an animal example). Bd = Brachypodium distachyon, Zm = Zea mays, Ta = Triticum aestivum, At = Arabidopsis thaliana.
Figure 2—figure supplement 3
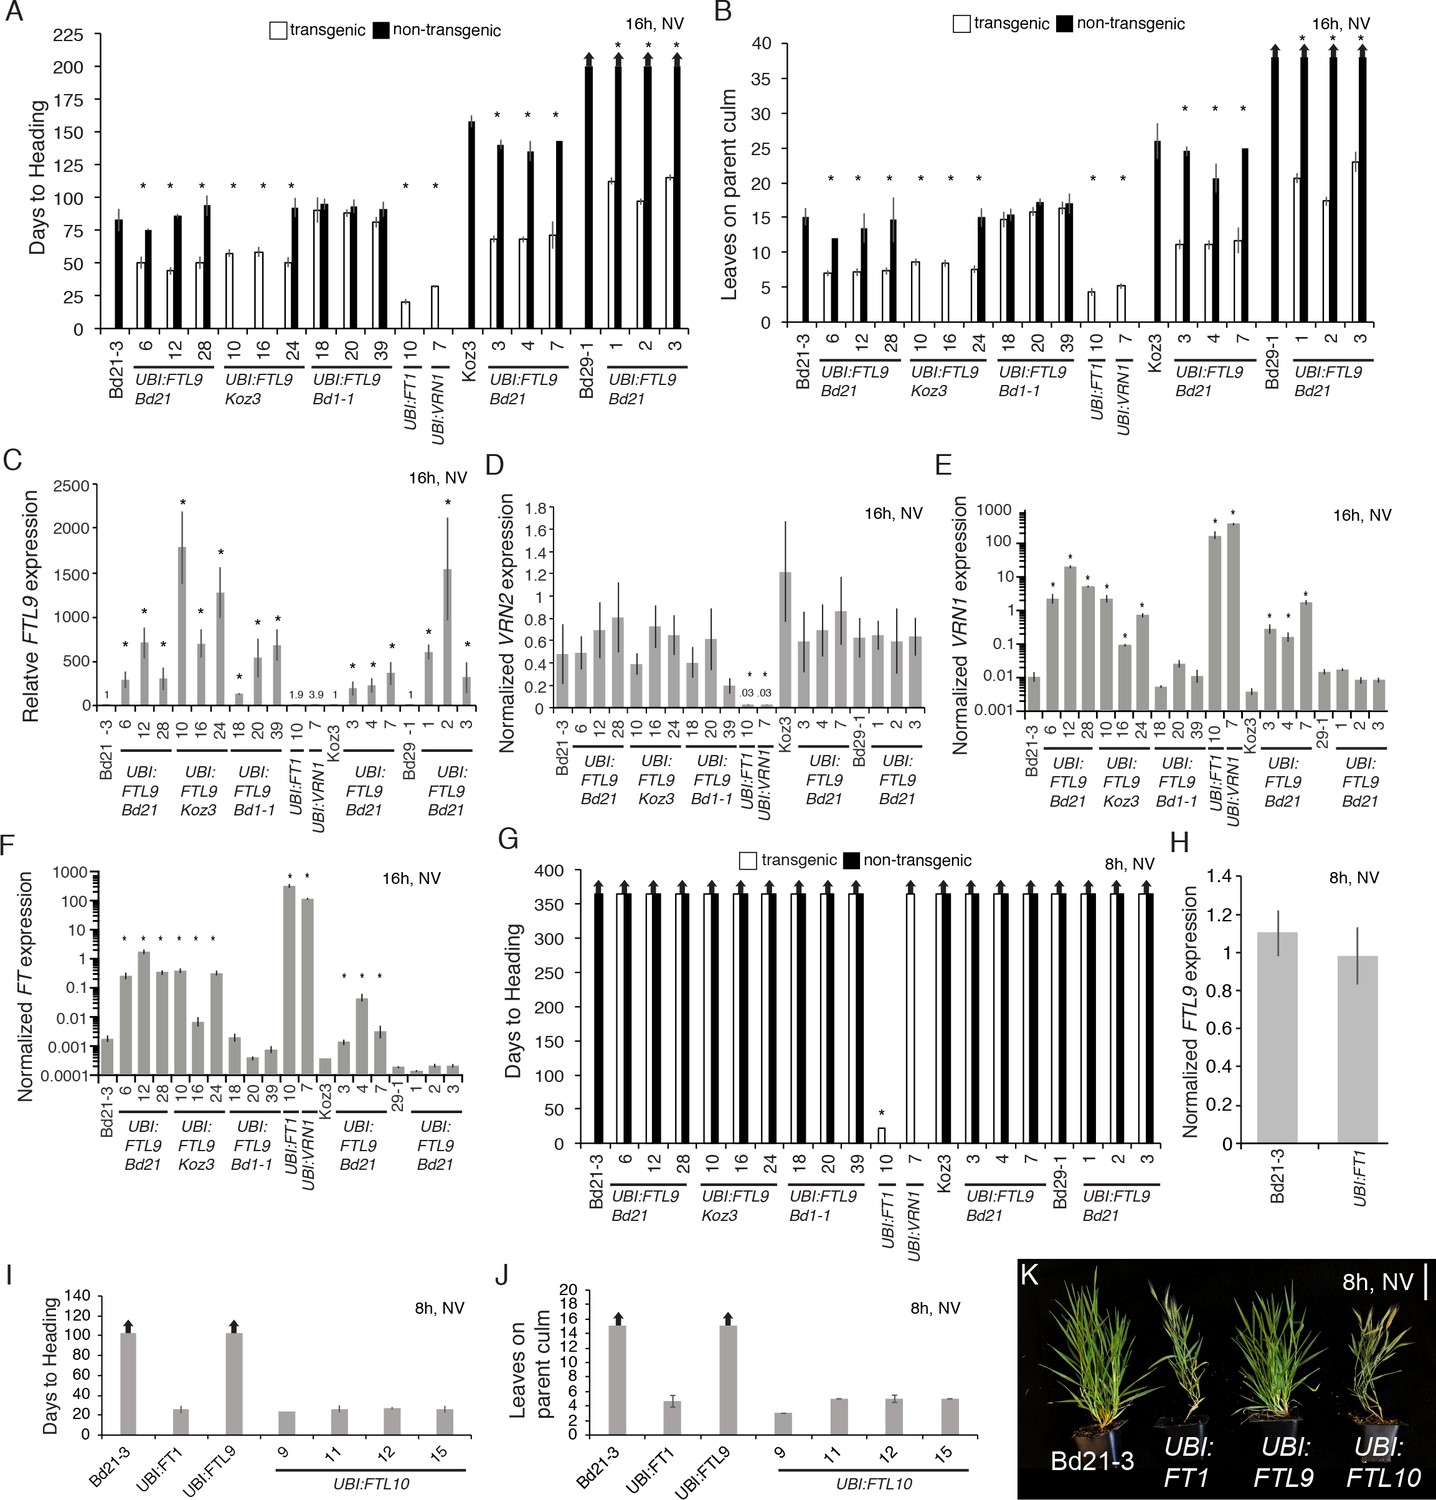
Effects of ubiquitin promoter-mediated constitutive expression of FTL9, FTL10, FT1, and VRN1.
(A–B) Flowering times as days to heading (A) or final leaf count on parent culm at time of flowering (B) of independent UBI:FTL9 transgenic lines (white bars) in Bd21-3, Koz3, and Bd29-1 compared with the respective wild-types and segregating non-transgenics (black bars). Lines with no non-transgenic plants are fixed for the transgene. Bars represent the average of at least six plants ± SD. The experiment was repeated with similar results (data not shown). Arrows above bars indicate that none of the plants flowered at the end of the experiment. (C–F) Quantitative RT-PCR expression data from the upper leaf at the fifth leaf stage grown in a 16 hr photoperiod. Expression data are normalized to UBC18 and represent the average of three biological replicates ±SD. Expression analyses were repeated with similar results. Single asterisks indicate p-values < 0.01. NV, non-vernalized. UBI:FT1 and UBI:VRN1 transgenics are described in Ream et al. (2014). UBI:FTL9 Bd21 cDNA is from Bd21, UBI:FTL9 Koz3 cDNA is from Koz3 and UBI:FTL9 Bd1-1 cDNA is from Bd1-1. (G) Days to heading in 8 hr photoperiod non-vernalized (NV). Dissections on the parent culm revealed that the meristems were still vegetative after 150 days of growth in SD for all lines except UBI:FT1 which flowers rapidly. (H) Quantitative RT-PCR expression data from the upper leaf at the third leaf stage grown in a 8 hr photoperiod in UBI:FT1 and Bd21-3. (I) Flowering times as days to heading (J) or final leaf count on parent culm at time of flowering of 4 independent UBI:FTL10 T1 transgenic lines, UBI:FT1 (T2 generation) and UBI:FTL9 Koz3 line 10 from (A) in this figure (T1 generation). (K) Representative photo of Bd21-3 wild-type, UBI:FT1, UBI:FTL9, and UBI:FTL10 grown in a 8 hr photoperiod (SD). All over expression lines are in the Bd21-3 background. Bar = 5 cm. Photo taken after 80 days of growth.
Figure 2—figure supplement 4

Maximum likelihood phylogenetic relationships among a subset of FT-like genes based on a nucleotide alignment of the PEBP domain.
Maximum likelihood bootstrap support values indicated below branches with bold branches indicating bootstrap values of 100. ‘G’ above branch indicates a grass-specific duplication. Scale bar indicates substitutions per site. Focal genes are labeled in large bold font. Note clades FTL9, 10, 12 and 13 contain only monocot species. Abbreviated species names: Bd, Brachypodium distachyon; Os, Oryza sativa; Ta, Triticum aestivum; Hv, Hordeum vulgare; Sb, Sorghum bicolor, Zm, Zea mays; Si, Setaria italica; Ph, Panicum hallii; Pd, Phoenix dactylifera; Ma, Musa acuminata; Z marina, Zostera marina; Ac, Ananas comosus; At, Arabidopsis thaliana. Sequence data were obtained from Phytozome v12 except sequence data for P. dactylifera was obtained from the KEGG database.
Figure 2—figure supplement 5
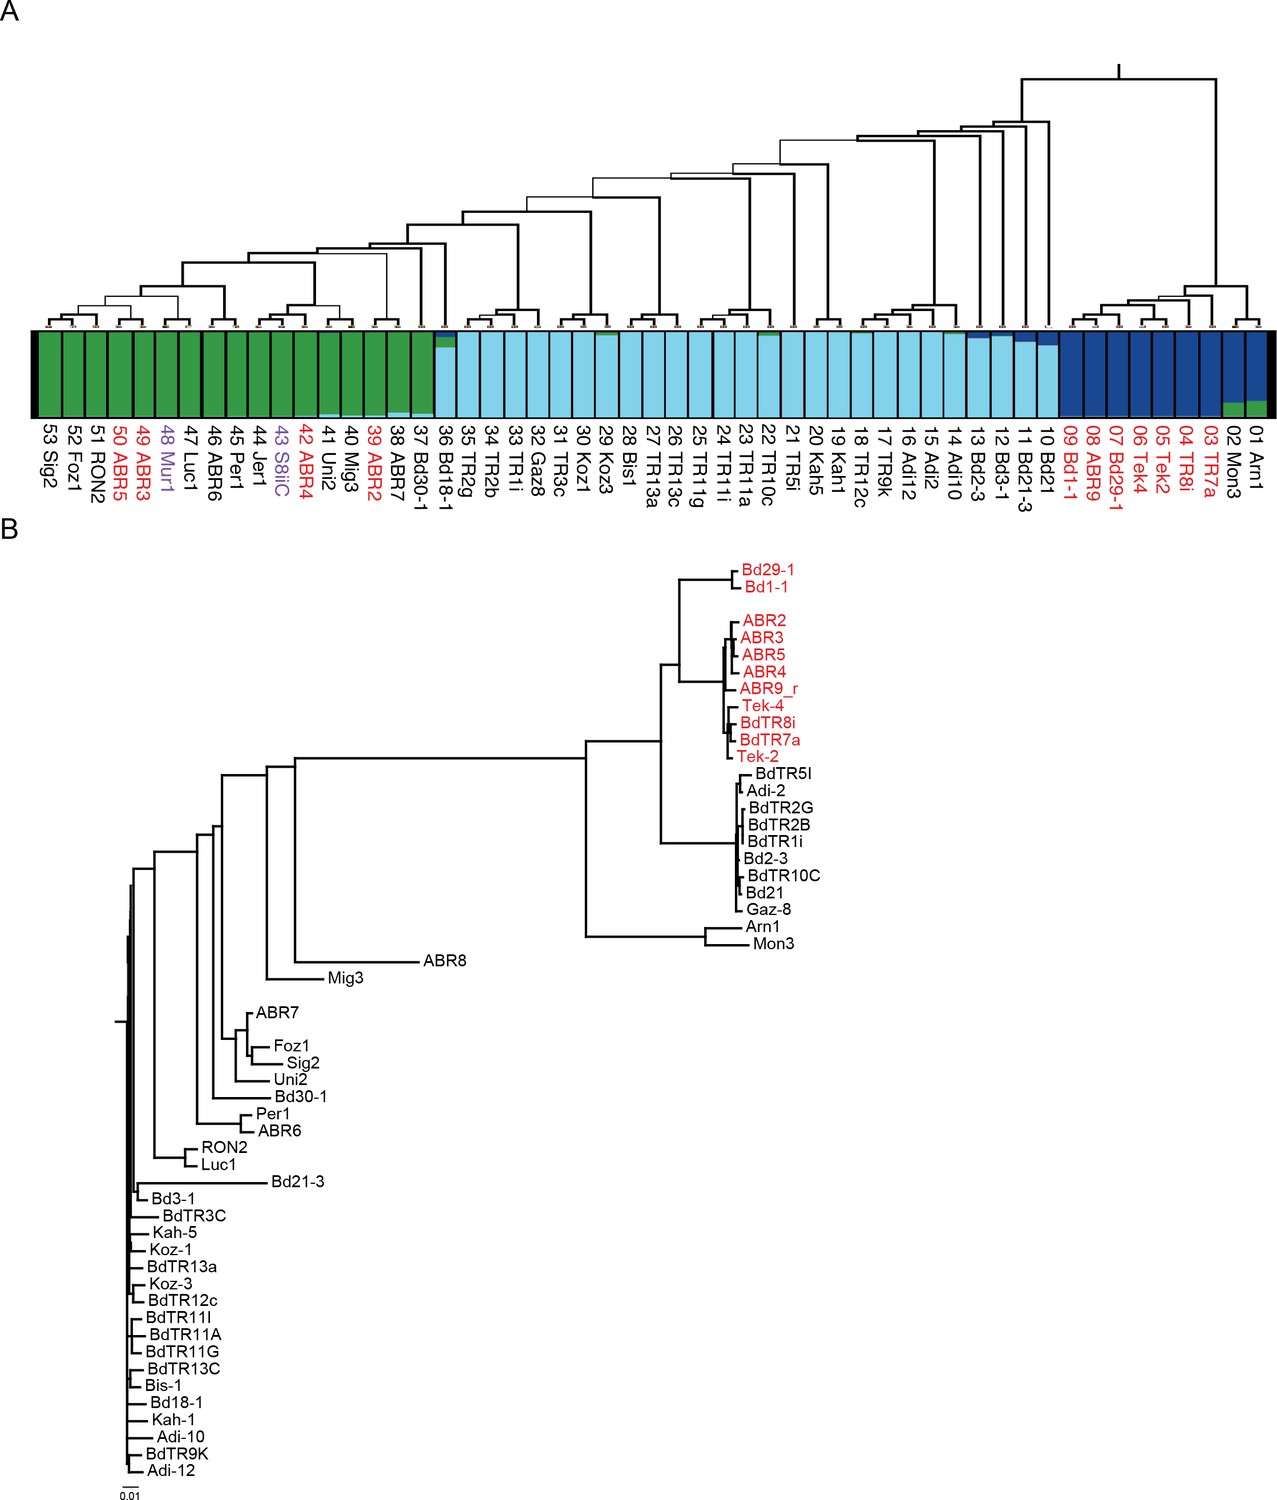
Population analysis.
(A) Maximum likelihood phylogenetic tree based on 3,933,264 SNPs spanning the genomes of 53 B. distachyon accessions, modified from (Gordon et al., 2017). Thickness of branches indicates bootstrap support: thick branches, 100%; intermediate, 70–99%; and thin, 50–69%. Red text indicates SD vernalization non-responsive accession, black text indicates SD vernalization responsive accessions, and purple text indicates accessions in which physiological experiments have not yet been conducted. Below the tree is a plot of individual membership (SNP profiles) to optimal K = 3 Bayesian STRUCTURE groups: EDF +miscellaneous (blue), middle eastern (light blue) and western European (green). (B) Phylogenetic analysis based on 940 SNPs spanning a 65 kb mapped interval in which FTL9 resides. Color of text same as (A). Scale bar indicates substitutions per site.
Figure 2—figure supplement 6
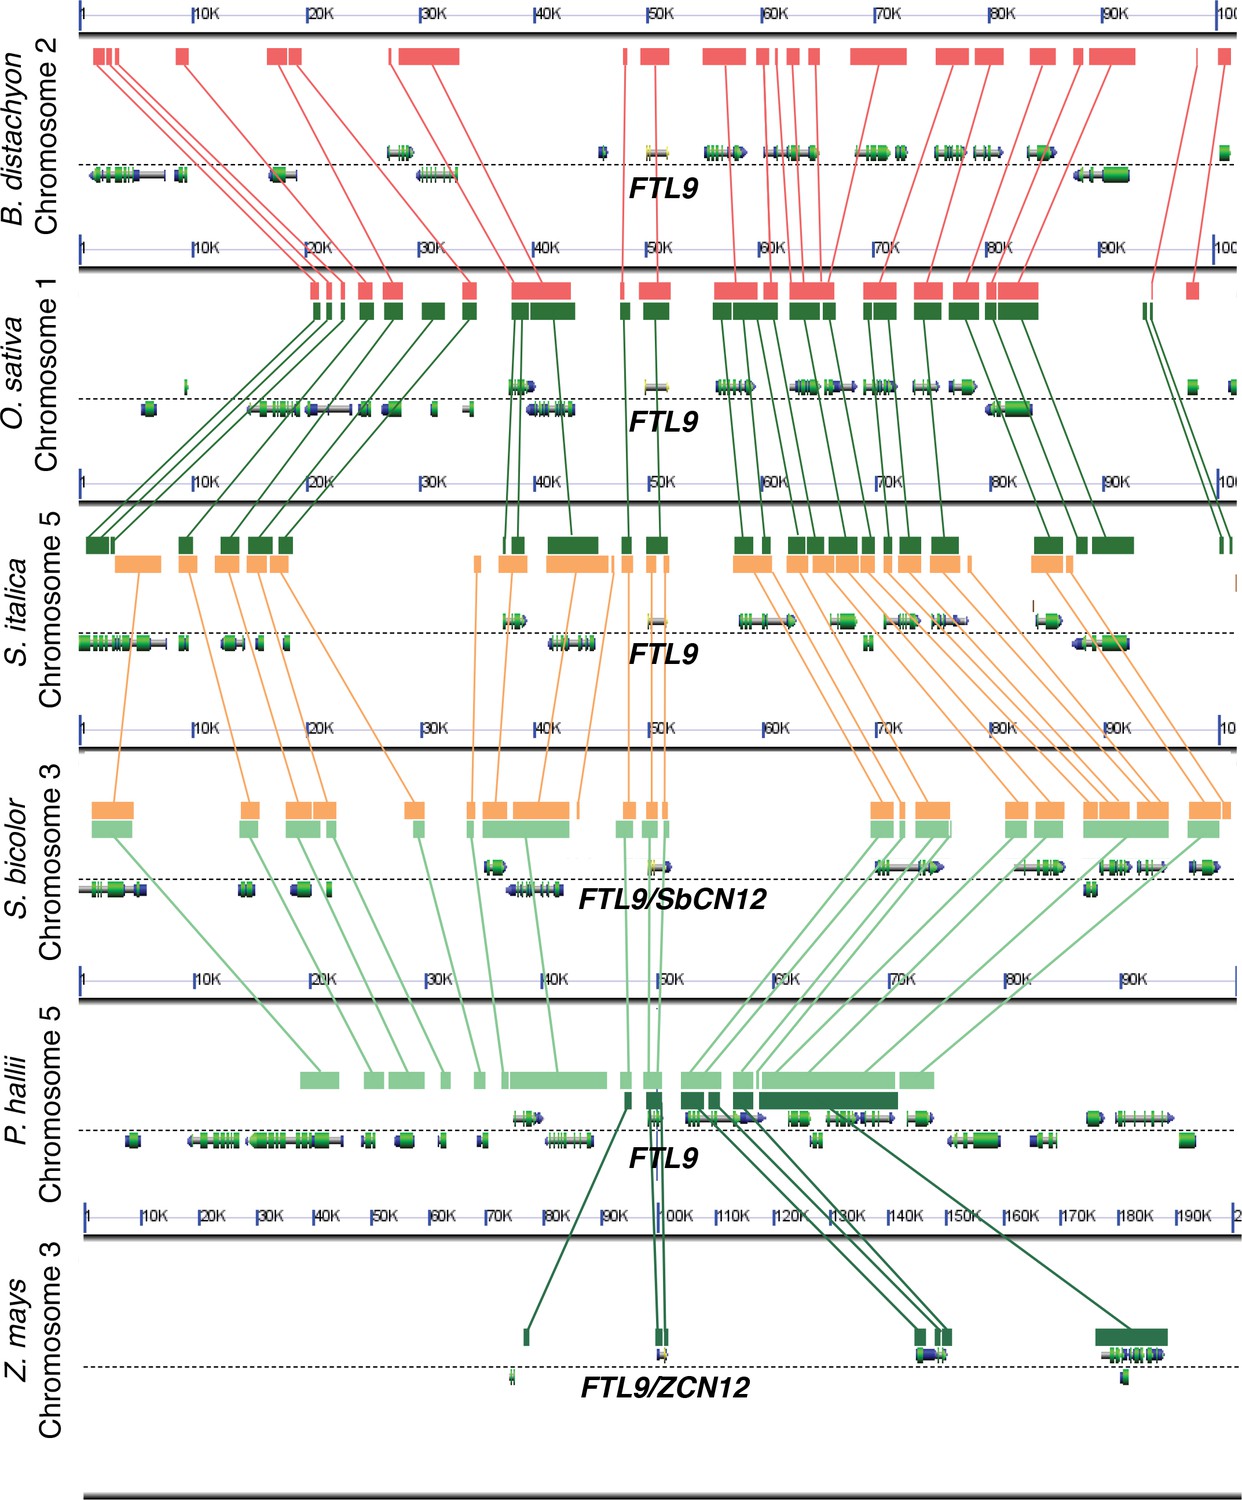
Analysis of syntenic chromosomal regions containing FTL9 orthologs in grasses.
Comparative analyses reveal conservation of gene order in an ~100 kb genomic region around FTL9 which supports the designations of FTL9 orthologs throughout the grass family in the FT-like phylogenetic analysis in Figure 2—figure supplement 4 (Lyons and Freeling, 2008).
Figure 3 with 1 supplement
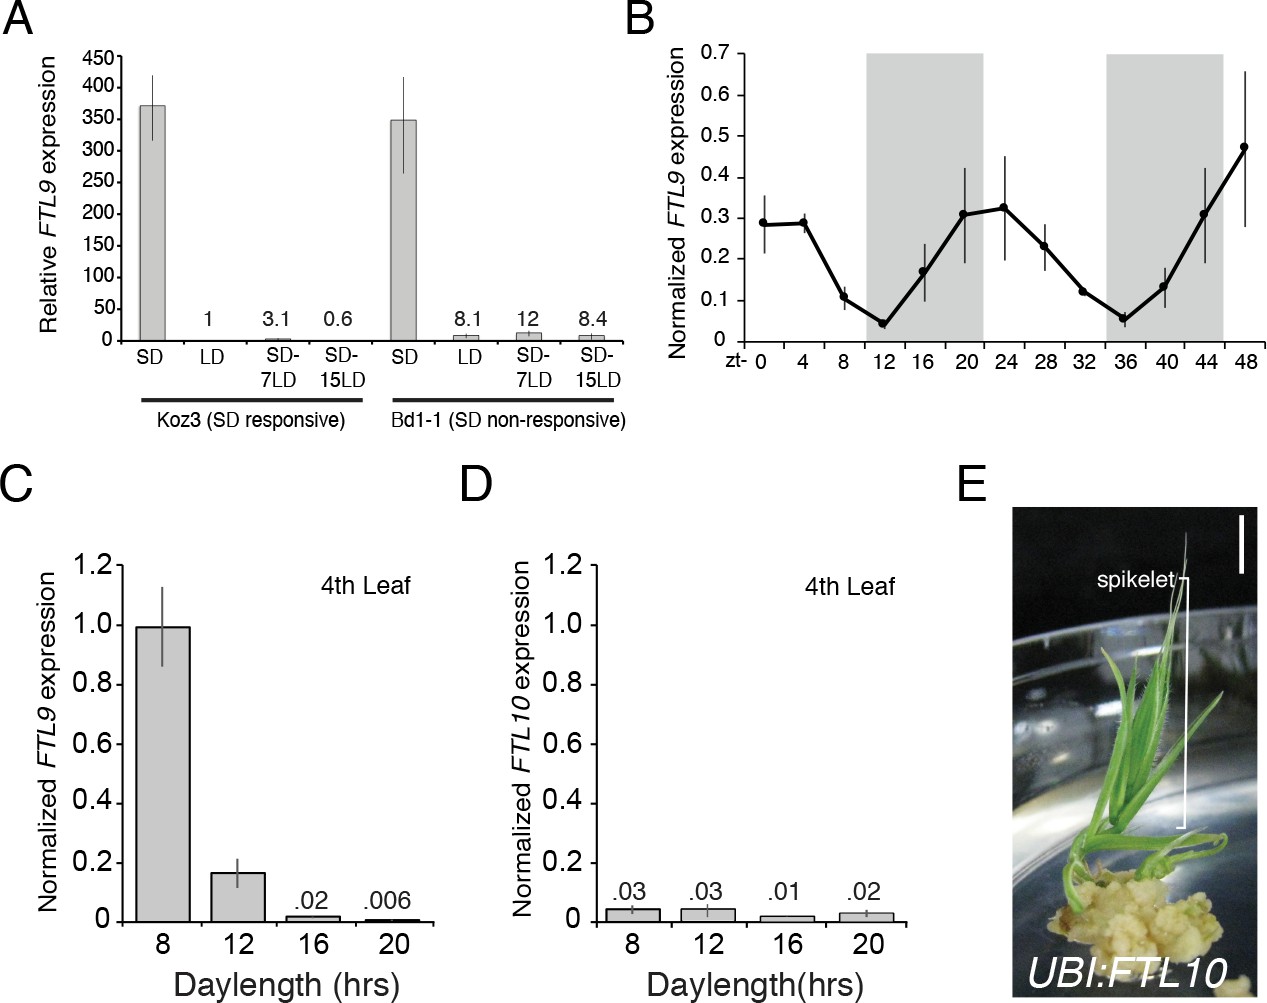
FTL9 expression is SD specific and diurnally fluctuating whereas FTL10 expression is not influenced by day-length and encodes a florigenic protein.
(A) FTL9 mRNA levels in Koz3 and Bd1-1 grown solely in 8 hr SD, solely in 20 hr LD, or 7 or 15 days after a shift from 8 weeks in SD to LD. Dissection of meristems on the parent culm revealed that all remained meristems vegetative in both Koz3 (12 dissected meristems) and Bd1-1 (12 meristems) in SD and LD grown plants. After a shift from SD to LD at day 7 all of the meristems were vegetative in Koz3 and Bd1-1 (12 meristems for each accession), however by day 15 in LD all of the meristems had converted to floral meristems in Koz3 (12 meristems) whereas they remained vegetative in Bd1-1 (12 meristems). RNA was prepared from newly expanded leaves on the parent culm. (B) Diurnal FTL9 mRNA fluctuations in 8 hr SD. Plants were grown in SD until the fourth-leaf stage was reached at which point newly expanded leaves were harvested every 4 hr throughout a 48 hr diurnal cycle. Shaded boxes represent dark periods. (C) FTL9 and (D) FTL10 mRNA levels in 8, 12, 16, and 20 hr photoperiods. Koz3 was grown to the four-leaf stage and newly expanded leaves were harvested in the middle of the photoperiod. (E) Representative image of T0 generation UBI:FTL10 plants showing rapid spikelet formation (bracket) on callus regeneration media. All 15 independent UBI:FTL10 calli flowered rapidly in regeneration media. Those plants without the transgene did not flower rapidly. UBI:FTL10 T1 generation days to heading and leaf count data see Figure 2—figure supplement 3. Bar = 0.5 cm. (A–D) Values represent the average of three biological replicates ± standard deviation (four leaves per replicate). Similar results were obtained in independent experiments. Gene expression was normalized to UBC18 as described in Ream et al. (2014).
Figure 3—figure supplement 1
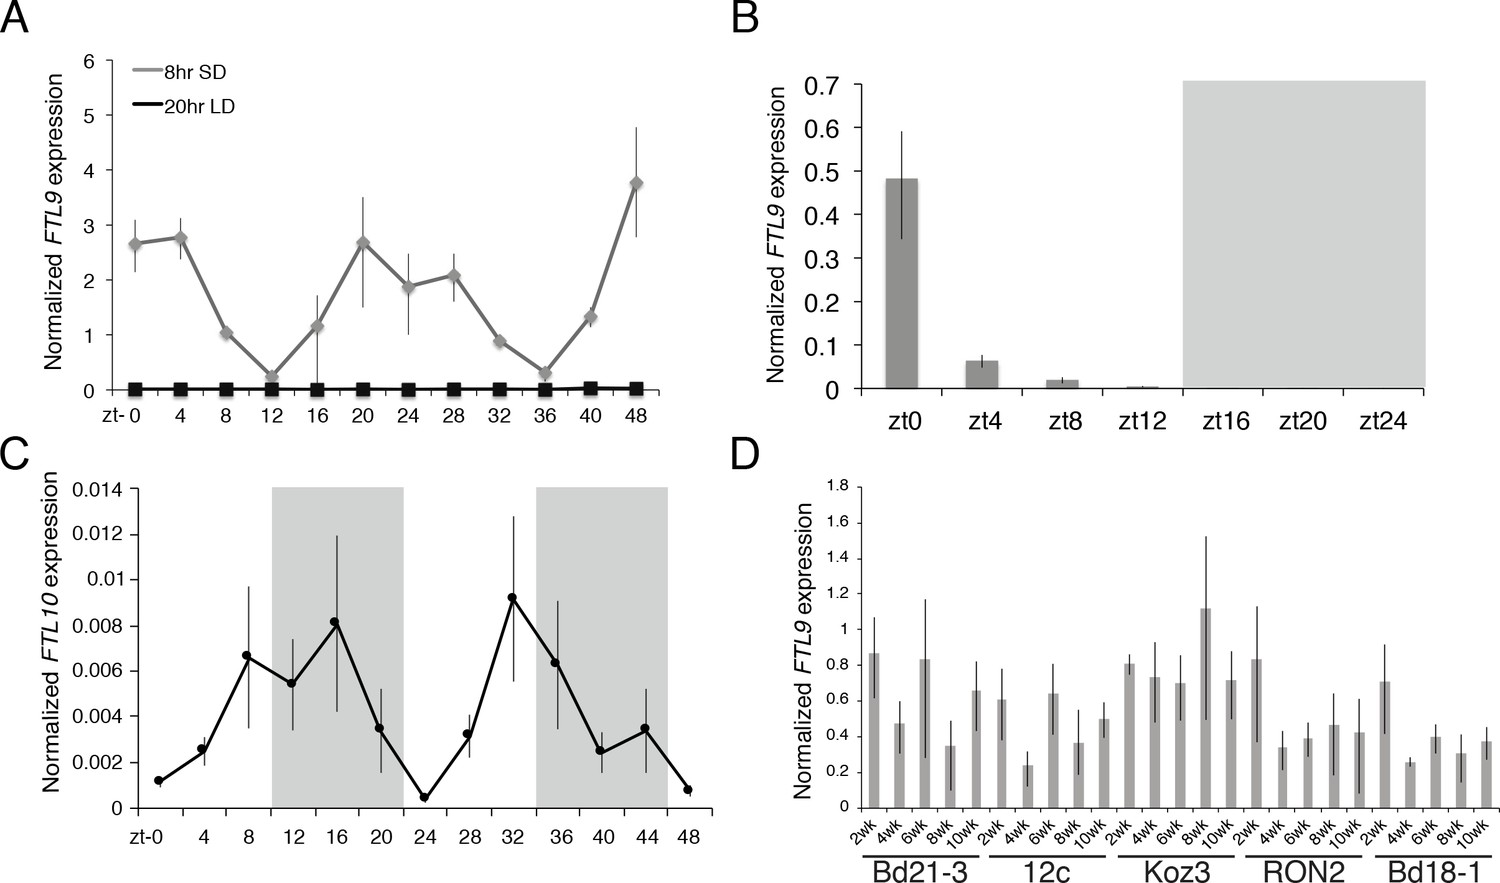
FTL9 and FTL10 diurnal mRNA expression.
(A) Diurnal FTL9 mRNA fluctuation in 8 hr SD versus 20 hr LD. Koz3 plants were grown in SD or LD until the fourth-leaf stage was reached at which point the newly expanded leaf was harvested at several time points throughout a 48 hr diurnal cycle. In SD (8 hr light/16 hr dark) the dark periods were from zt 9–23 and 33–47. In LD (20 hr light/4 hr dark) the dark periods were from zt 20–23 and zt 44–47. (B) Plants were entrained under 8 h days until the fourth leaf stage was reached at which point the plant were grown in continuous darkness and the newly expanded fourth leaf was sampled every 4 hr for 24 hr. Shaded box represents subjective night. (C) Diurnal FTL10 mRNA expression pattern in 8 hr SD. For (A–C) values represent the average of four biological replicates ± standard deviation (four leaves per replicate). Shaded boxes represent dark periods. The experiment was repeated with similar results. Expression is normalized to UBC18 as in Ream et al. (2014). (D) FTL9 mRNA expression in Bd21-3, 12 c, Koz3, RON2 and Bd18-1 after 2–10 weeks of 8 hr SD exposure. The newly expanded leaf on the parent culm was harvested at the end of the given SD treatment in the middle of the photoperiod. FTL9 does not increase over time in SD in the accessions tested.
Figure 4 with 1 supplement
VRN2 represses FTL9 in LD.
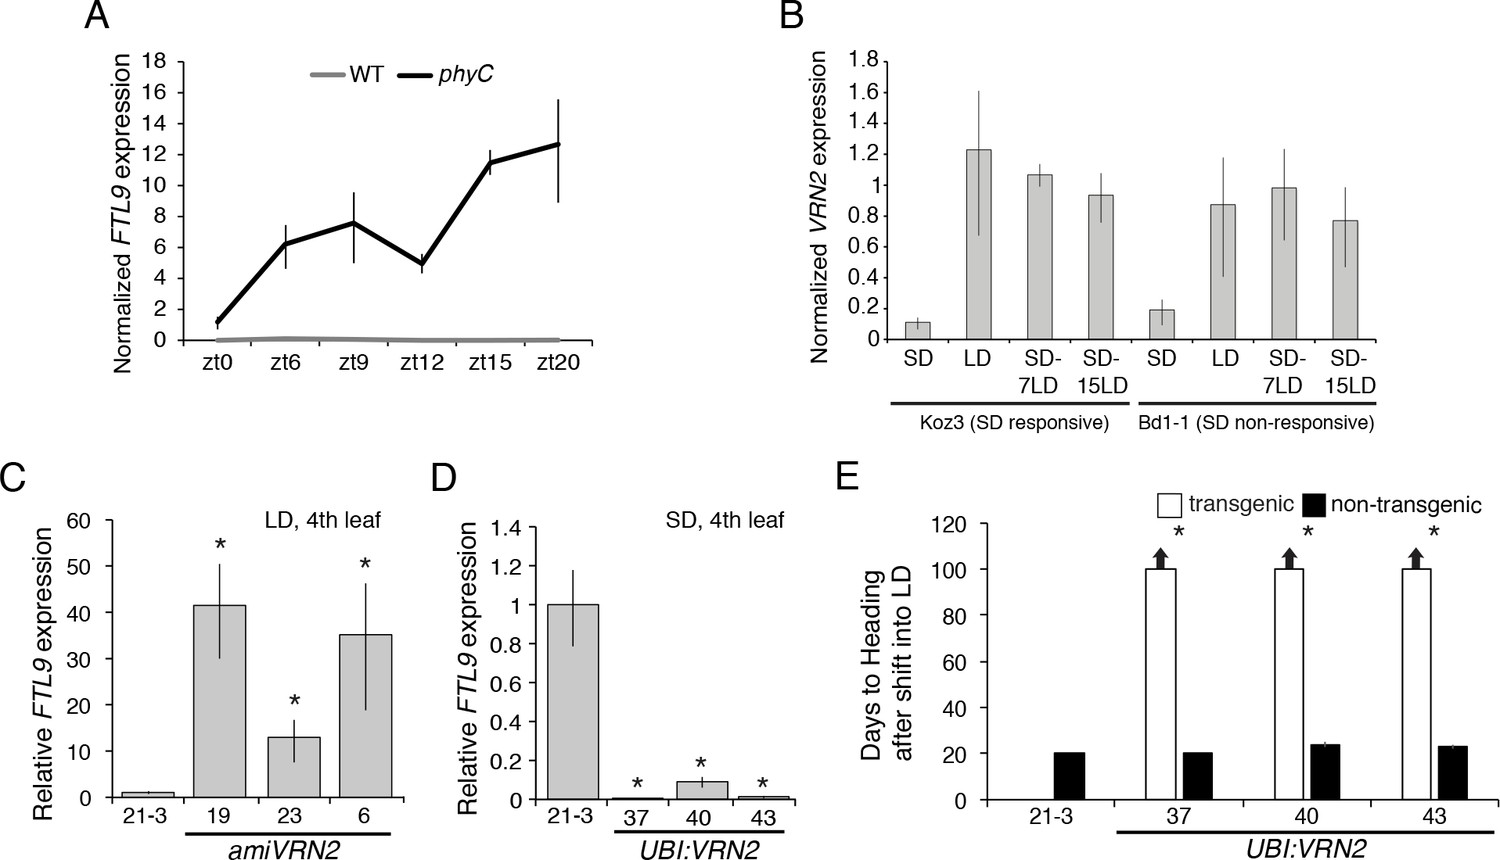
(A) Gene expression of FTL9 in Bd21-3 (grey line) and phyC (black line; phyC-1 allele was used). Plants were grown in LD (20 hr days) until the fourth leaf stage was reached at which point the newly expanded fourth leaf was harvested at zt0, zt6, zt9, zt12, zt15 and zt20. The average of three biological replicates is shown ± standard deviation (three leaves per replicate). (B) VRN2 is most highly expressed in LD. VRN2 mRNA levels in Koz3 and Bd1-1 grown solely in 8 hr SD, solely in 20 hr LD only, or 7 and 15 days after a shift from SD to LD. Samples as described in Figure 3A. See Figure 3A legend for description of the state of the meristem throughout experiment. (C) FTL9 is expressed in LD when VRN2 expression is reduced. FTL9 mRNA levels were assessed by qRT-PCR in samples from a newly expanded leaf of Bd21-3 and amiVRN2 plants at the fourth-leaf stage grown in 16 hr LD. (D) FTL9 expression is reduced in SD if VRN2 is constitutively expressed. FTL9 mRNA levels were determined as in C. (C,D) Average relative FTL9 expression is shown for four biological replicates ± standard deviation (four leaves per replicate). Asterisk indicates a p-value < 0.05. See Figure 4—figure supplement 1 for VRN2 expression. (E) Constitutive VRN2 expression blocks the SD vernalization response. Days to heading for three independent amiVRN2 transgenic lines (white bars) grown in SD for 10 weeks before shifting to 14 hr LD; wt Bd21-3 and segregating non-transgenic plants (black bars) show a normal SD vernalization response. Bars represent the average of 12 plants ± standard deviation.
Figure 4—figure supplement 1
FTL9 and VRN2 expression in different photoperiods and in amiVRN2 and UBI:VRN2 transgenics.
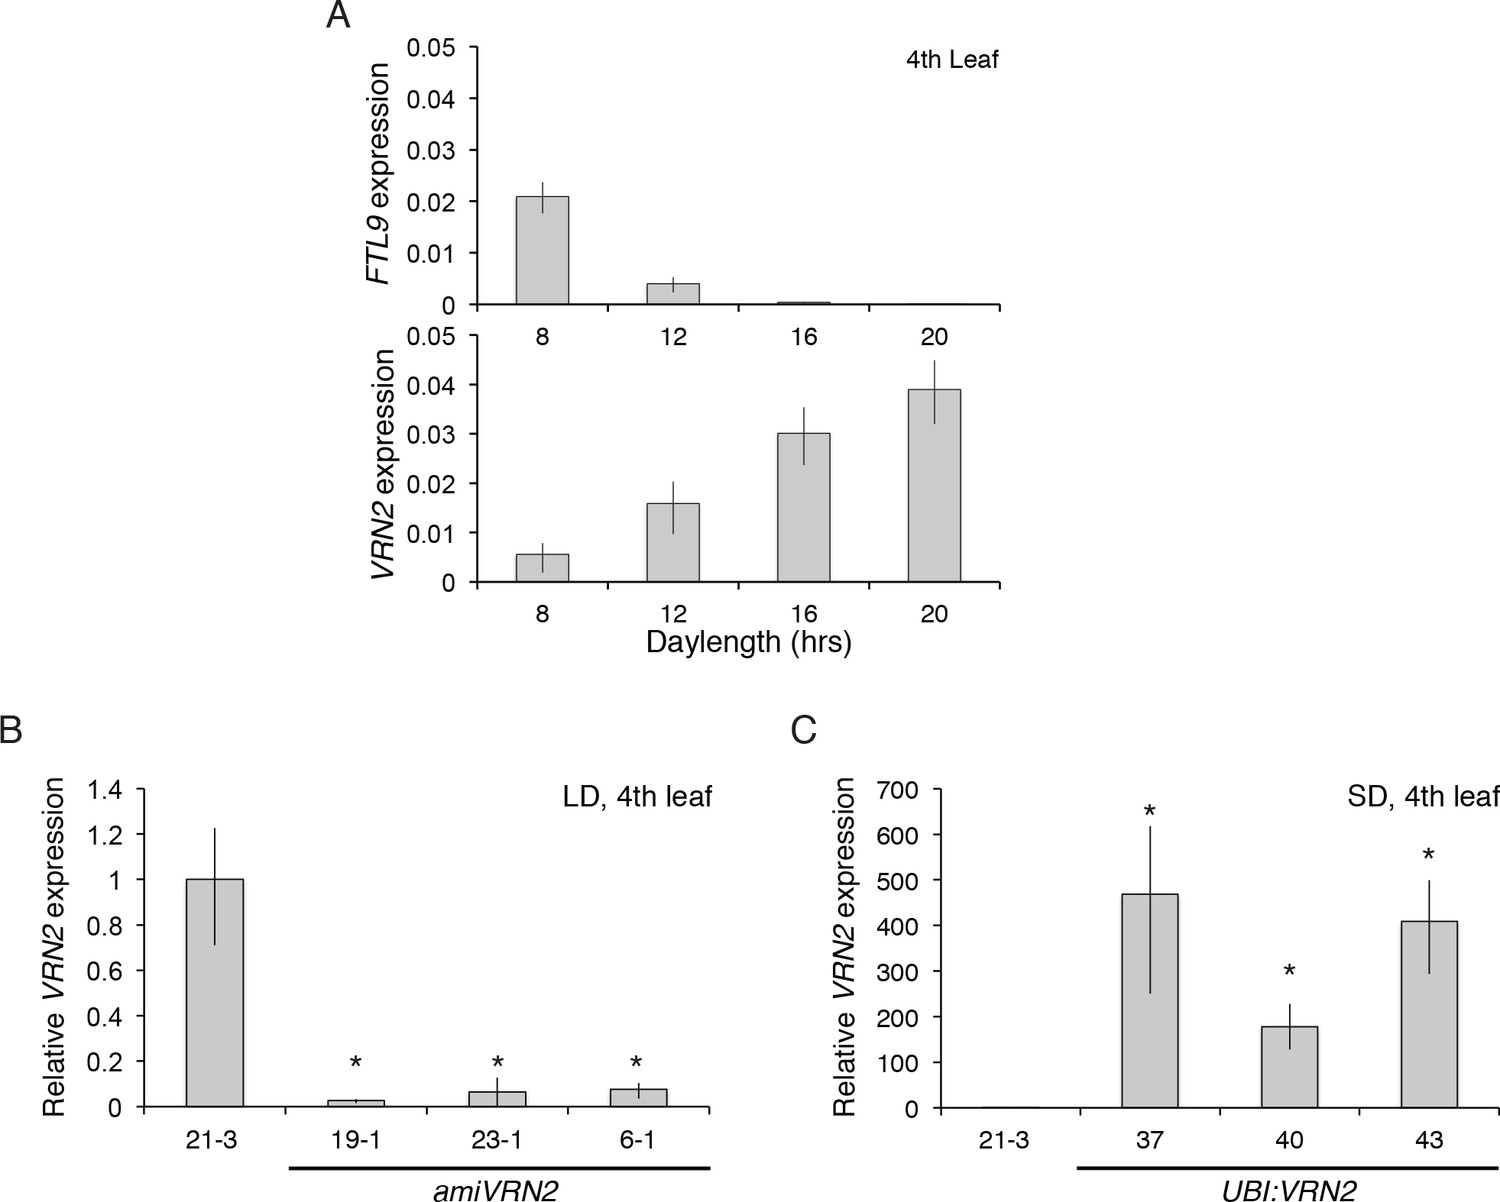
(A) FTL9 (top) and VRN2 (bottom) mRNA levels in 8, 12, 16 and 20 hr photoperiods. Koz3 was grown to the fourth leaf stage and the newly expanded leaf was harvested in the middle of the photoperiod. (B) VRN2 mRNA levels determined by quantitative RT-PCR from the upper leaf of Bd21-3 and amiVRN2 plants at the fourth-leaf stage grown in a 16-hr photoperiod (LD). (C) VRN2 mRNA levels in the upper leaf of Bd21-3 and UBI:VRN2 plants at the fourth-leaf stage grown in a 8-hr photoperiod (SD). (A, B, C) Average relative VRN2 expression is shown for four biological replicates ± standard deviation (four leaves per replicate). Asterisk indicates p-value<0.05.
Figure 5
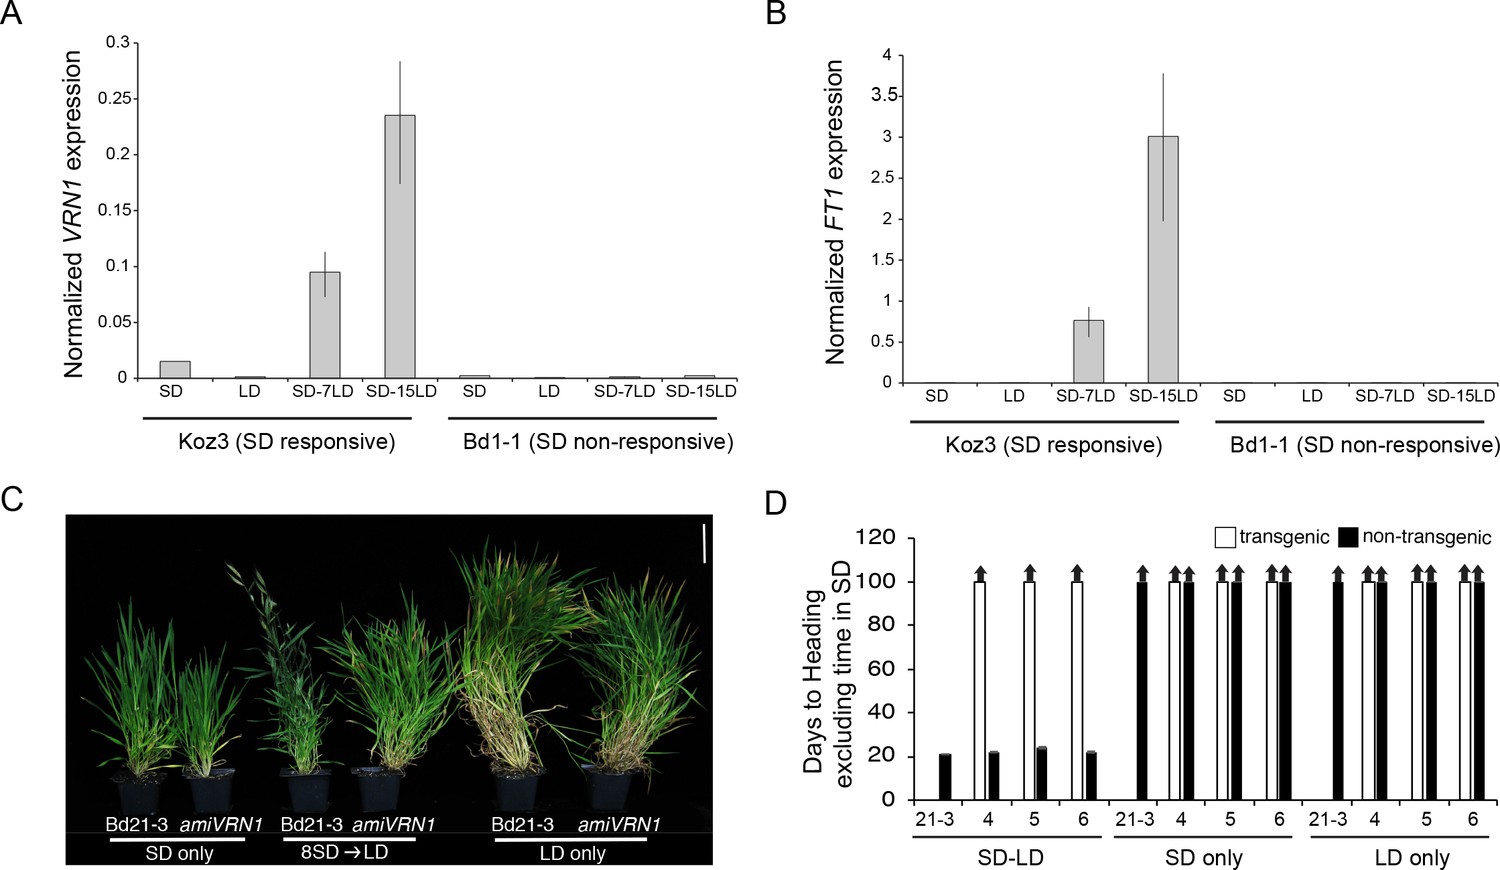
SD vernalization induces the floral promoting genes FT1 and VRN1 in LD and the SD vernalization response depends on VRN1 expression.
(A) VRN1 and (B) FT1 mRNA levels in Koz3 and Bd1-1 grown solely in 8 hr SD, solely in 20 hr LD, or 7 or 15 days after a shift from 8 weeks in SD to LD. See Figure 3A legend for description of the state of the meristem throughout experiment. RNA was prepared from newly expanded leaves on the parent culm. Values represent the average of three biological replicates ± standard deviation (four leaves per replicate). The experiment was repeated with similar results. Expression normalized to UBC18 as in Ream et al. (2014). (C) Knockdown of VRN1 expression blocks the SD vernalization response. Representative photo of Bd21-3 wild-type, and amiVRN1 grown in 8 hr photoperiod (SD) only, 14 hr photoperiod (LD) only and after a shift from 8 weeks in SD to LD. Bar = 5 cm. (D) Days to heading for three independent amiVRN1 transgenic lines (4,5,6; white bars) grown in SD for 10 weeks before shifting to 14 hr LD; wt Bd21-3 and segregating non-transgenic plants (black bars) show a normal SD vernalization response. Bars represent the average of 12 plants ± standard deviation.
Additional files
-
Supplementary file 1
Days to heading in Short days (SD,8h), long days (LD, 16 hr) and SD shifted LD plants (SD-LD).
Also contains number of leaves on parent culm at time of flowering. * asterisk indicates some plants within treatment did not flower after 150 days of growth. >greater than sign indicates none of the plants flowered after 150 days of growth. SD-LD plants were first grown in 8 hr short days (SD) for 8 weeks prior to shifting into 16 hr long days (LD). Days to heading includes the time the plants were grown in SD.
- https://doi.org/10.7554/eLife.42153.019
-
Supplementary file 2
Days to heading in Short days (SD,8h), long days (LD, 20 hr) and SD shifted LD plants (SD-LD).
Also contains number of leaves on parent culm at time of flowering. * asterisk indicates some plants within treatment did not flower after 150 days of growth. >greater than sign indicates none of the plants flowered after 150 days of growth. SD-LD plants were first grown in 8 hr short days (SD) for 8 weeks prior to shifting into 16 hr long days (LD). Days to heading includes the time the plants were grown in SD.
- https://doi.org/10.7554/eLife.42153.020
-
Supplementary file 3
Days to heading in 16-hr days with and without 6 weeks or 14 weeks of vernalization.
>greater than sign indicates plants did not flower after 150 days of growth.
- https://doi.org/10.7554/eLife.42153.021
-
Supplementary file 4
Indel markers for Koz3 X Bd1-1 F2 mapping population.
Precise location differs slightly from location used in primer name due to change in the genome version used, v2.1 versus v3.1, locations will likely continue to change as new versions of the B. distachyon genome are released.
- https://doi.org/10.7554/eLife.42153.022
-
Supplementary file 5
Primers used in amiRNA, qPCR, sanger sequencing FTL9, and cloning.
- https://doi.org/10.7554/eLife.42153.023
Download links
A two-part list of links to download the article, or parts of the article, in various formats.
Downloads (link to download the article as PDF)
Open citations (links to open the citations from this article in various online reference manager services)
Cite this article (links to download the citations from this article in formats compatible with various reference manager tools)
A florigen paralog is required for short-day vernalization in a pooid grass
eLife 8:e42153.
https://doi.org/10.7554/eLife.42153


