Importin-9 wraps around the H2A-H2B core to act as nuclear importer and histone chaperone
- University of Texas Southwestern Medical Center, United States
- University of Texas at Dallas, United States
- Korea Advanced Institute of Science and Technology (KAIST), Korea
- University of California, San Francisco, United States
- University of California, San Francisco, United states
Figures
Figure 1 with 2 supplements
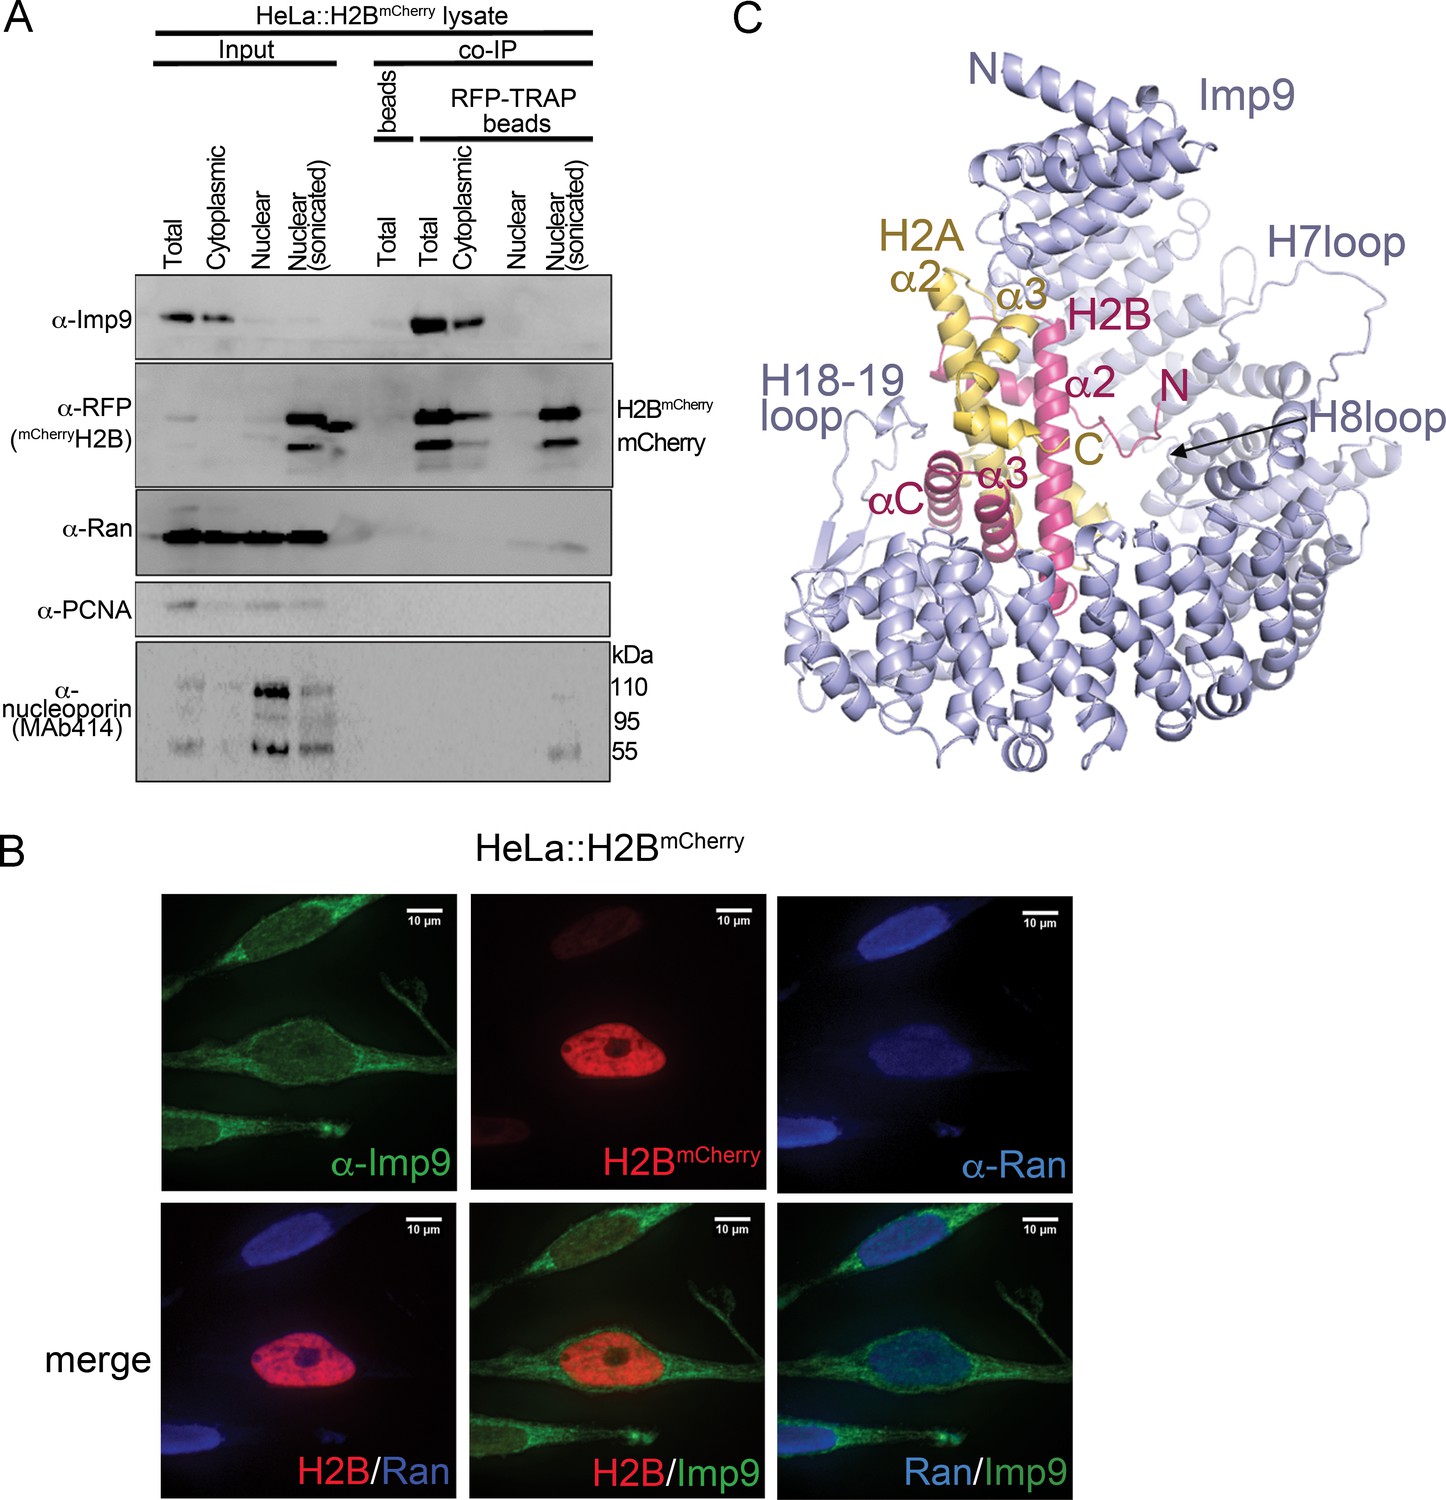
Interactions between Imp9 and H2A-H2B in the cell and crystal structure of the Imp9 •H2A-H2B complex.
(A) Coimmunoprecipitation (CoIP) studies of H2BmCherry from whole cell, cytoplasmic and nuclear fractions of the lysates from HeLa cells stably expressing H2BmCherry, followed by immunoblots with Imp9, Ran, RFP antibodies. PCNA and MAb414 antibodies are used as loading control antibodies. 10 µg of 1.5 mg lysates are analyzed as CoIP input. Blots are representative of three identical experiments. (B) Subcellular localization of Imp9 and Ran in Hela::H2BmCherry cells. HeLa cells were fixed, permeabilized, incubated with affinity-purified rabbit polyclonal Imp9 antibody and mouse monoclonal anti–Ran antibody, and visualized by confocal microscopy. The secondary antibodies were Alexa 488 conjugated anti–rabbit and Alexa 405 conjugated anti-mouse, respectively. The column on the right contains two-color merge images. (C). The crystal structure of human Imp9 (blue) in complex with X. laevis H2A (yellow)-H2B (red).
-
Figure 1—source data 1
Data collection and refinement statistics, Imp9•H2A-H2B structure.
- https://doi.org/10.7554/eLife.43630.006
Figure 1—figure supplement 1
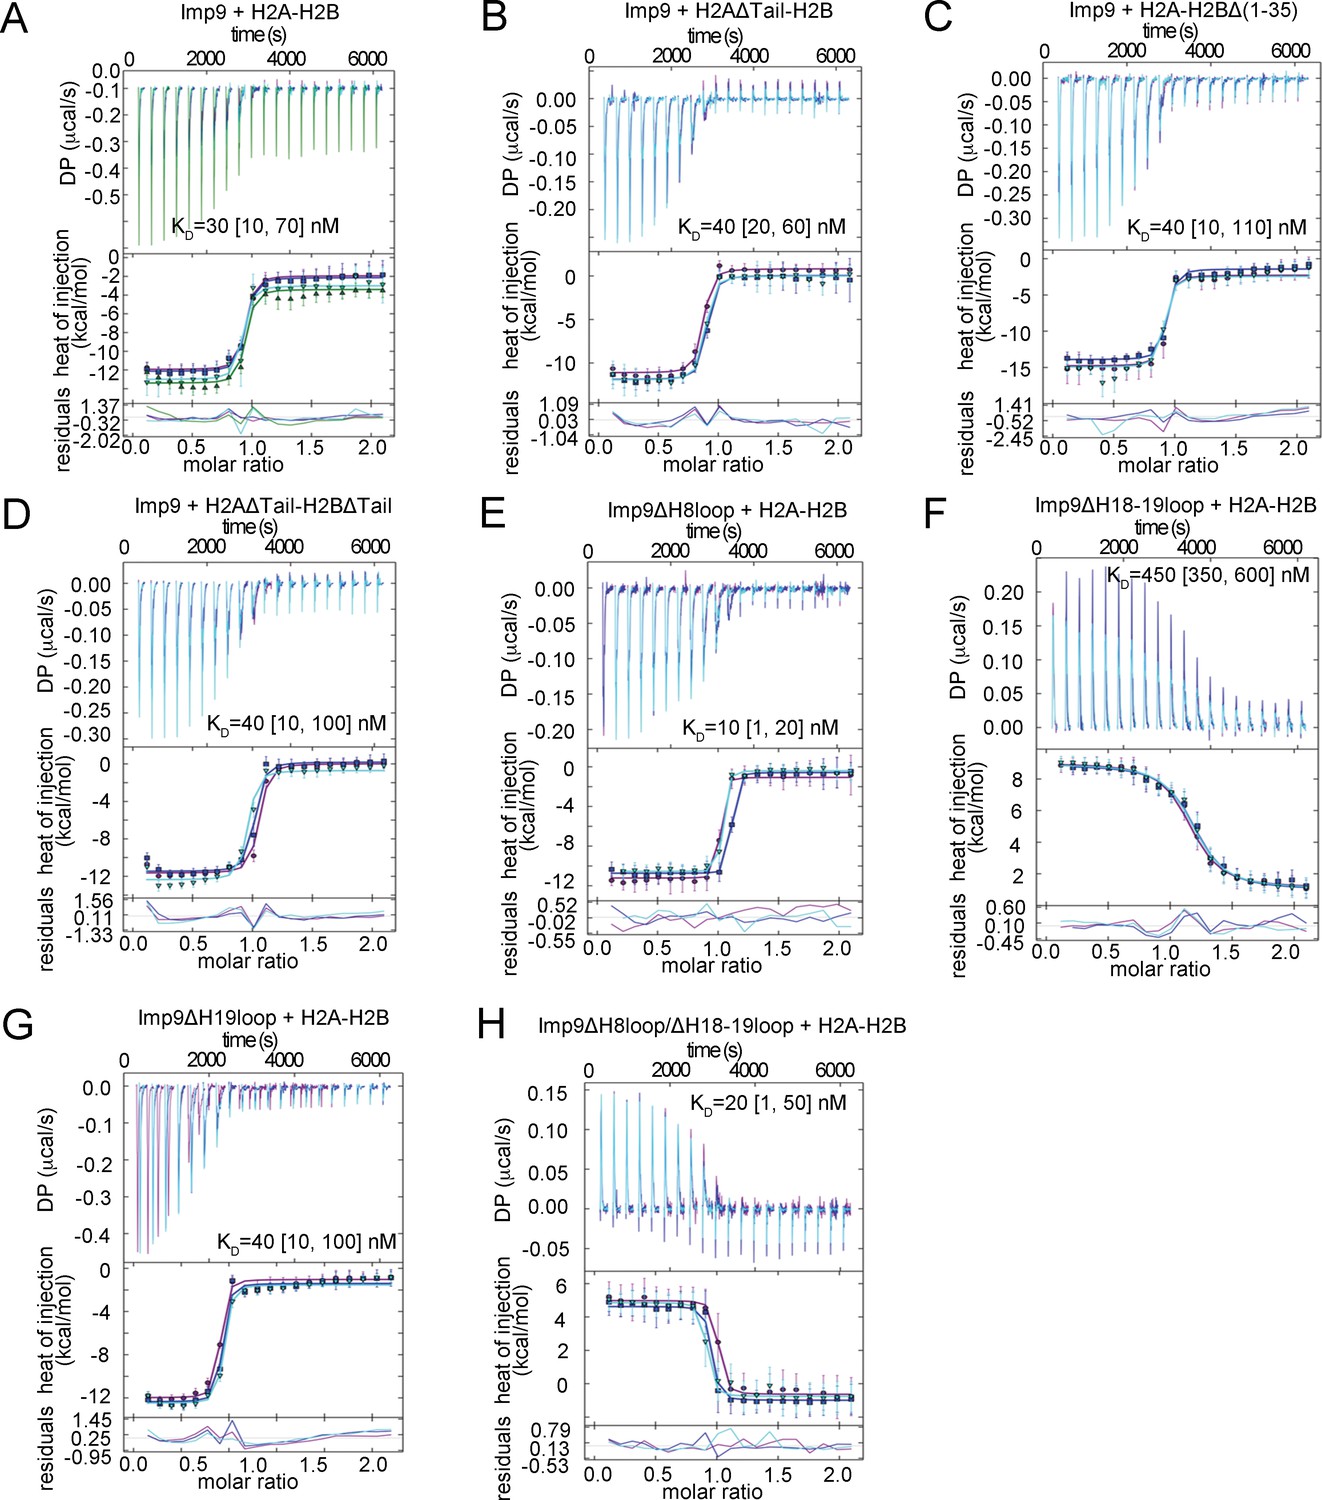
ITC analysis of Imp9 binding to H2A-H2B.
(A-H) The GUSSI output for global analysis of each experiment (binding proteins mentioned above the panel) carried out in triplicates. The top panel shows the SVD-reconstructed thermogram provided by NITPIC, the middle panel shows the isotherms and the bottom panel shows the residuals. Individual experiments in the triplicate sets are differently color-coded. DP - differential power.
Figure 1—figure supplement 2
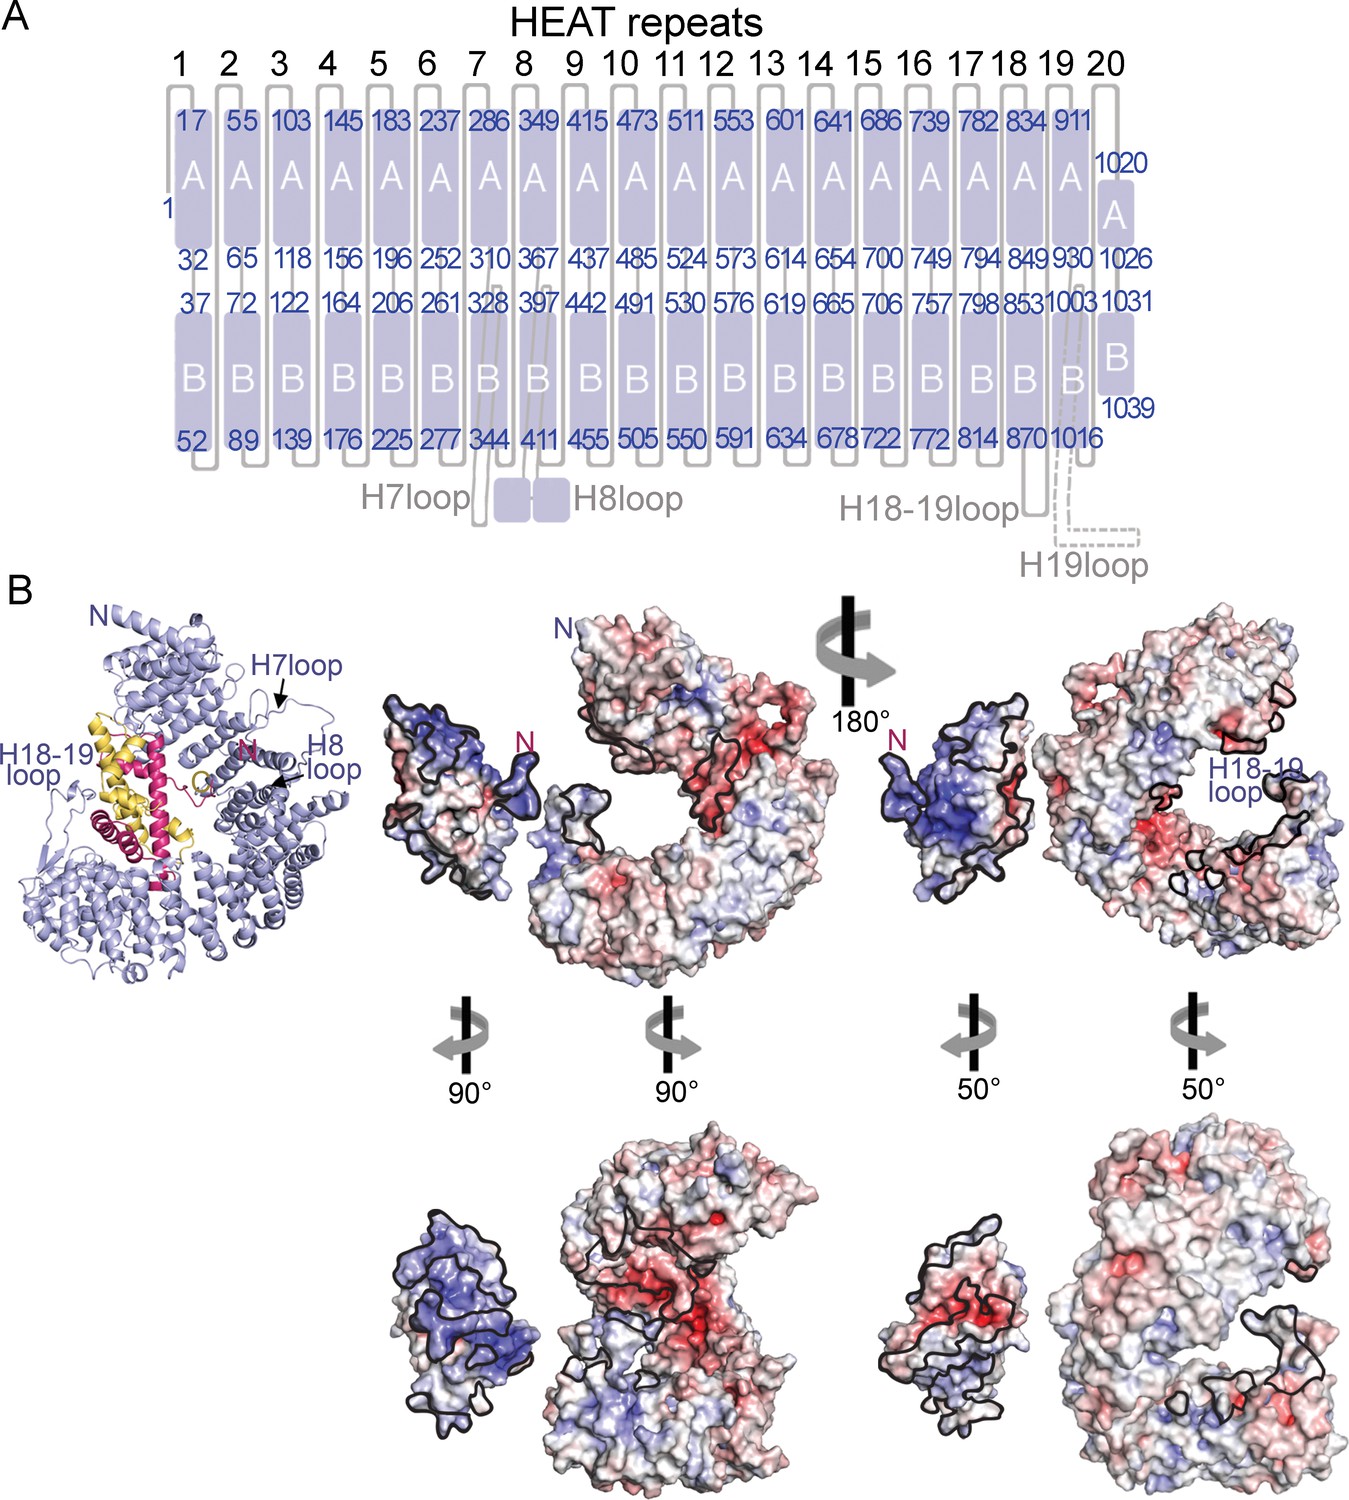
HEAT repeat organization of Imp9 and electrostatic surface potential of Imp9 and H2A-H2B.
(A) Organization of the 20 HEAT repeats of Imp9. The H19loop, which is not modeled, is shown with a dashed line. (B) Structure of the Imp9•H2A-H2B complex shown in cartoon representation, for comparison with the surface representations. Two views (180° rotation about the vertical axis) of the electrostatic surface potential (from −8 kV to +8 kV) of H2A-H2B and Imp9. The left view is the same as the cartoon representation, with the two proteins separated for viewing of the surfaces. The structures in the panel below show approximate open-book views. Interfaces on Imp9 and H2A-H2B are outlined in black. The electrostatic surface was generated in PyMol using APBS plugin (Baker et al., 2001).
Figure 2 with 3 supplements
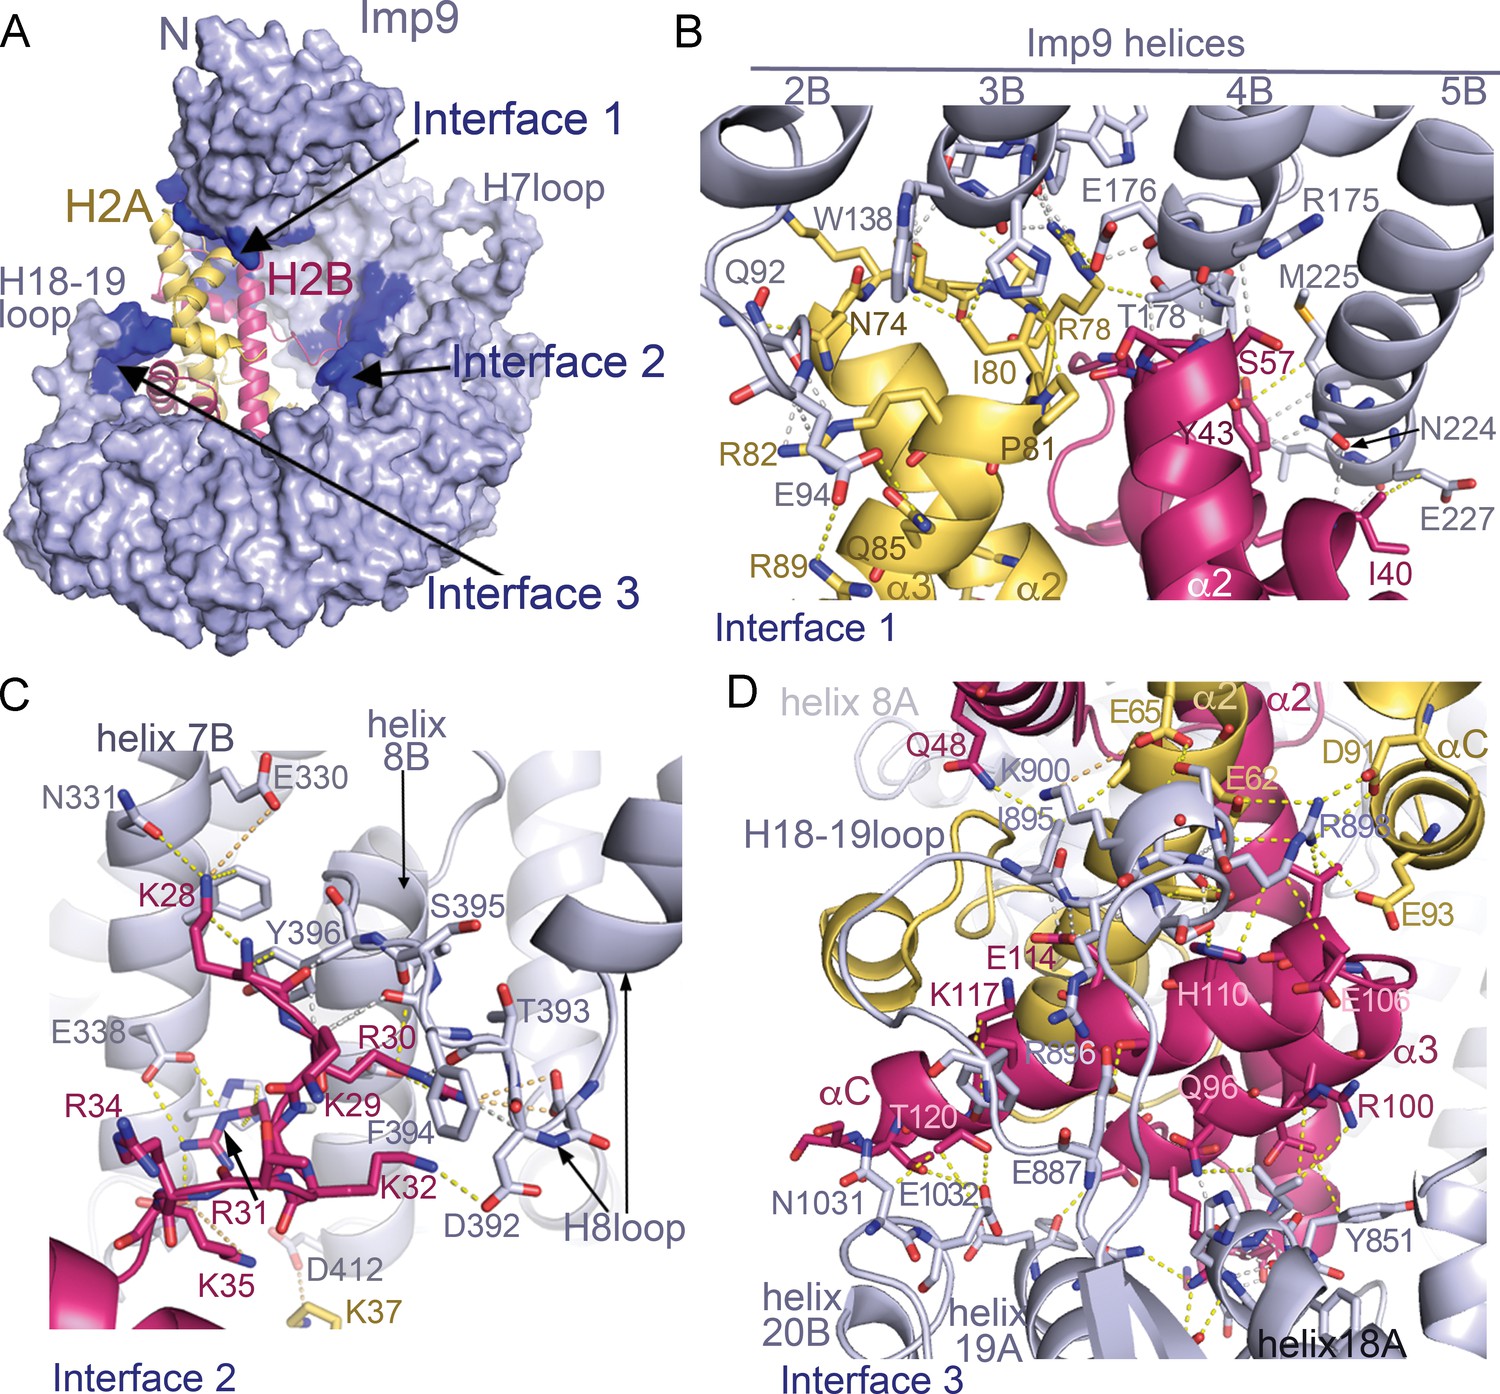
Imp9 •H2A-H2B binding interfaces.
(A) The Imp9•H2A-H2B structure is oriented as in Figure 1C. The histones H2A (yellow)-H2B (red) are drawn as cartoons. Imp9 (blue) is represented as surface showing three distinct H2A-H2B binding interfaces (dark blue). (B–D). Details of Interface 1 (B), Interface 2 (C) and Interface 3 (D). Intermolecular contacts are shown as dashed lines.
Figure 2—figure supplement 1
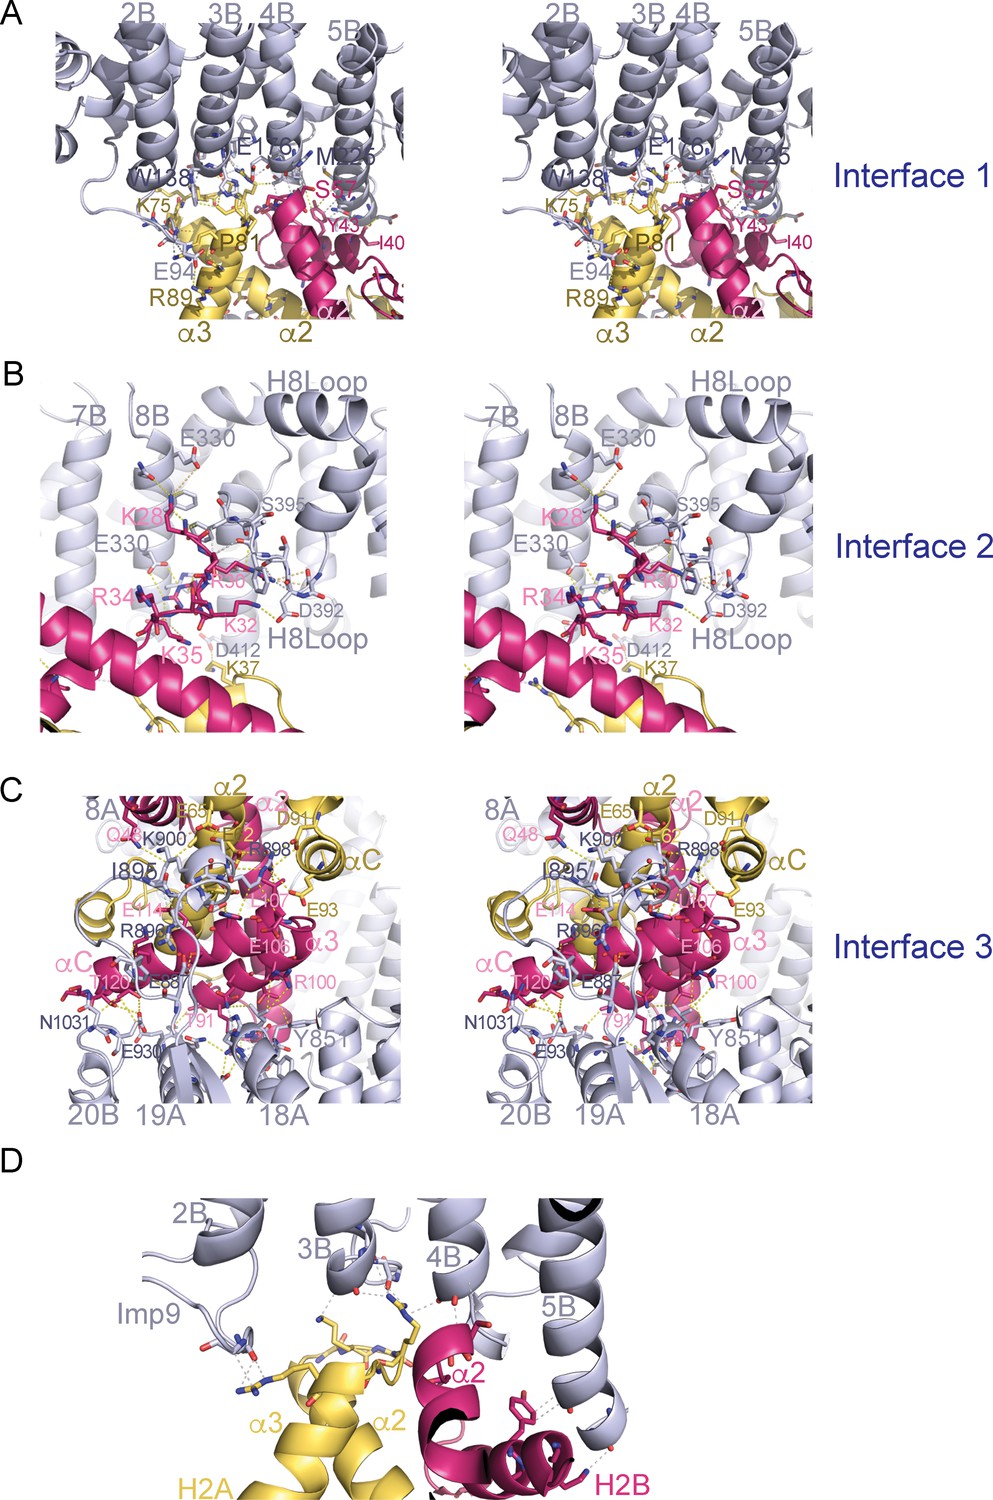
Stereo views of the Imp9•H2A-H2B interfaces.
(A-C) Cross-eyed stereo view of Interface 1 (A), Interface 2 (B) and Interface 3 (C). (D) Interactions between the main chain of Imp9 and H2A-H2B. Interactions between Imp9 (blue) and the histones (H2A is yellow and H2B is red) are shown with dashed lines.
Figure 2—figure supplement 2
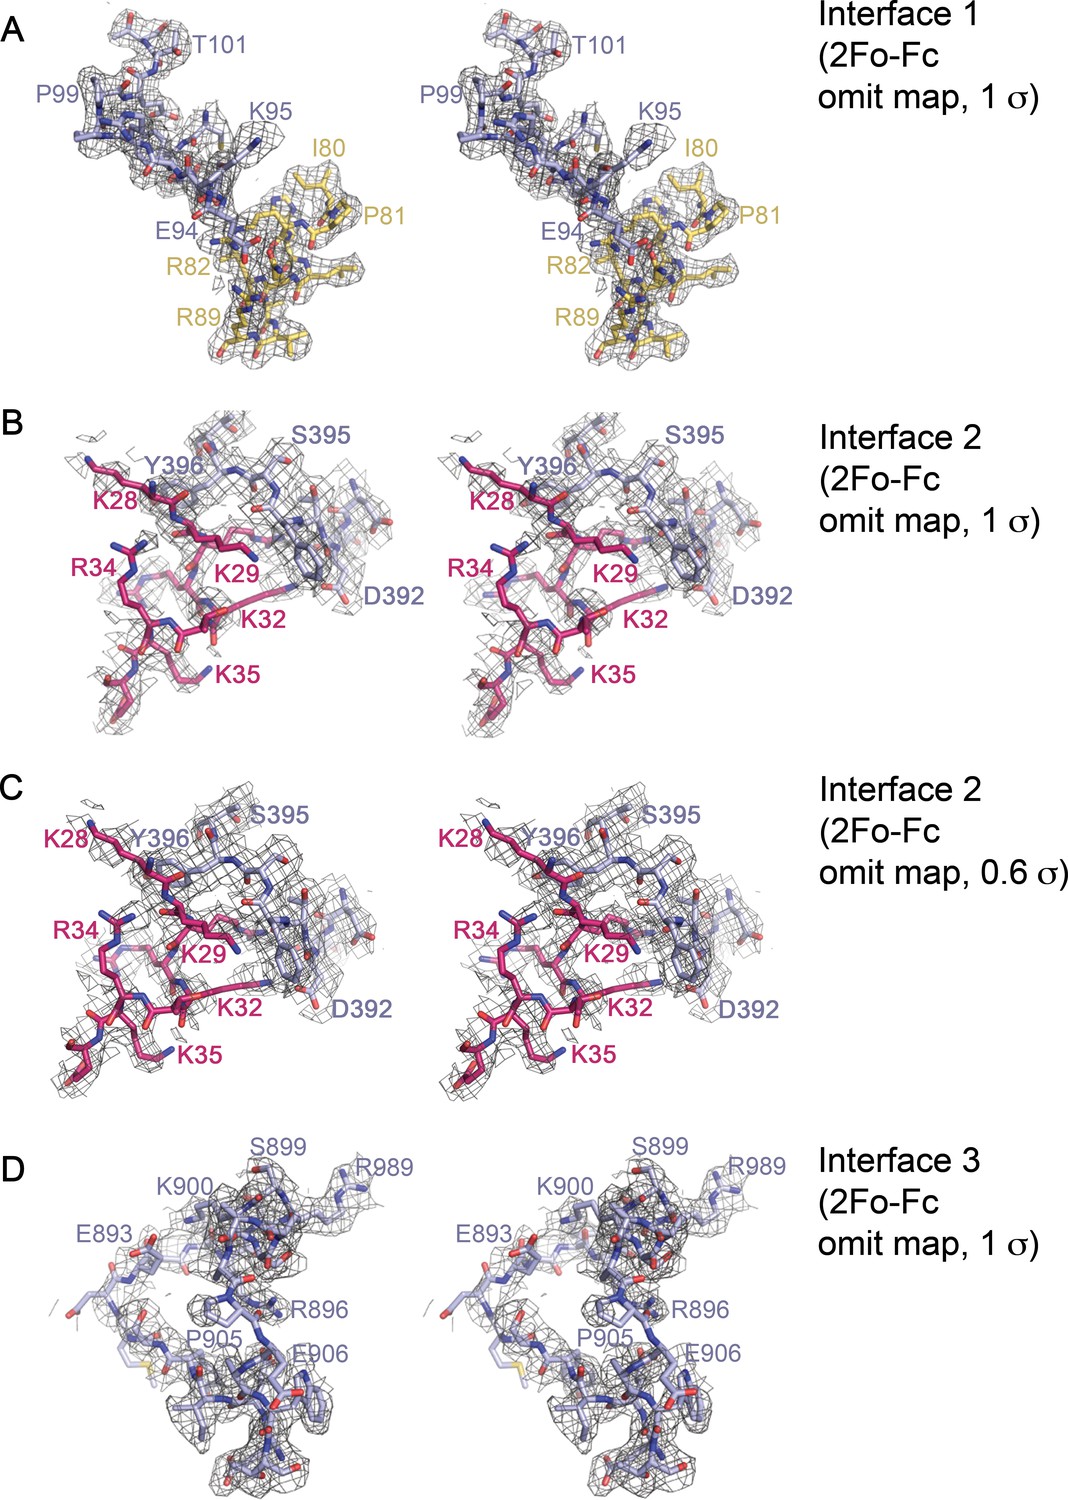
Stereo views of representative electron-density within the Imp9•H2A-H2B interfaces.
(A-D) Cross-eyed stereo views of representative 2Fo-Fc omit map electron density within Interface 1 (contoured at 1σ A); residues 90–102 of Imp9 and residues 80–89 of H2B omitted), Interface 2 (contoured at 1σ in B), and contoured at 0.6σ in C); residues 390-397of Imp9 and residues 28–36 of H2B omitted) and Interface 3 (contoured at 1σ D); residues 886–909 on Imp9 omitted).
Figure 2—figure supplement 3
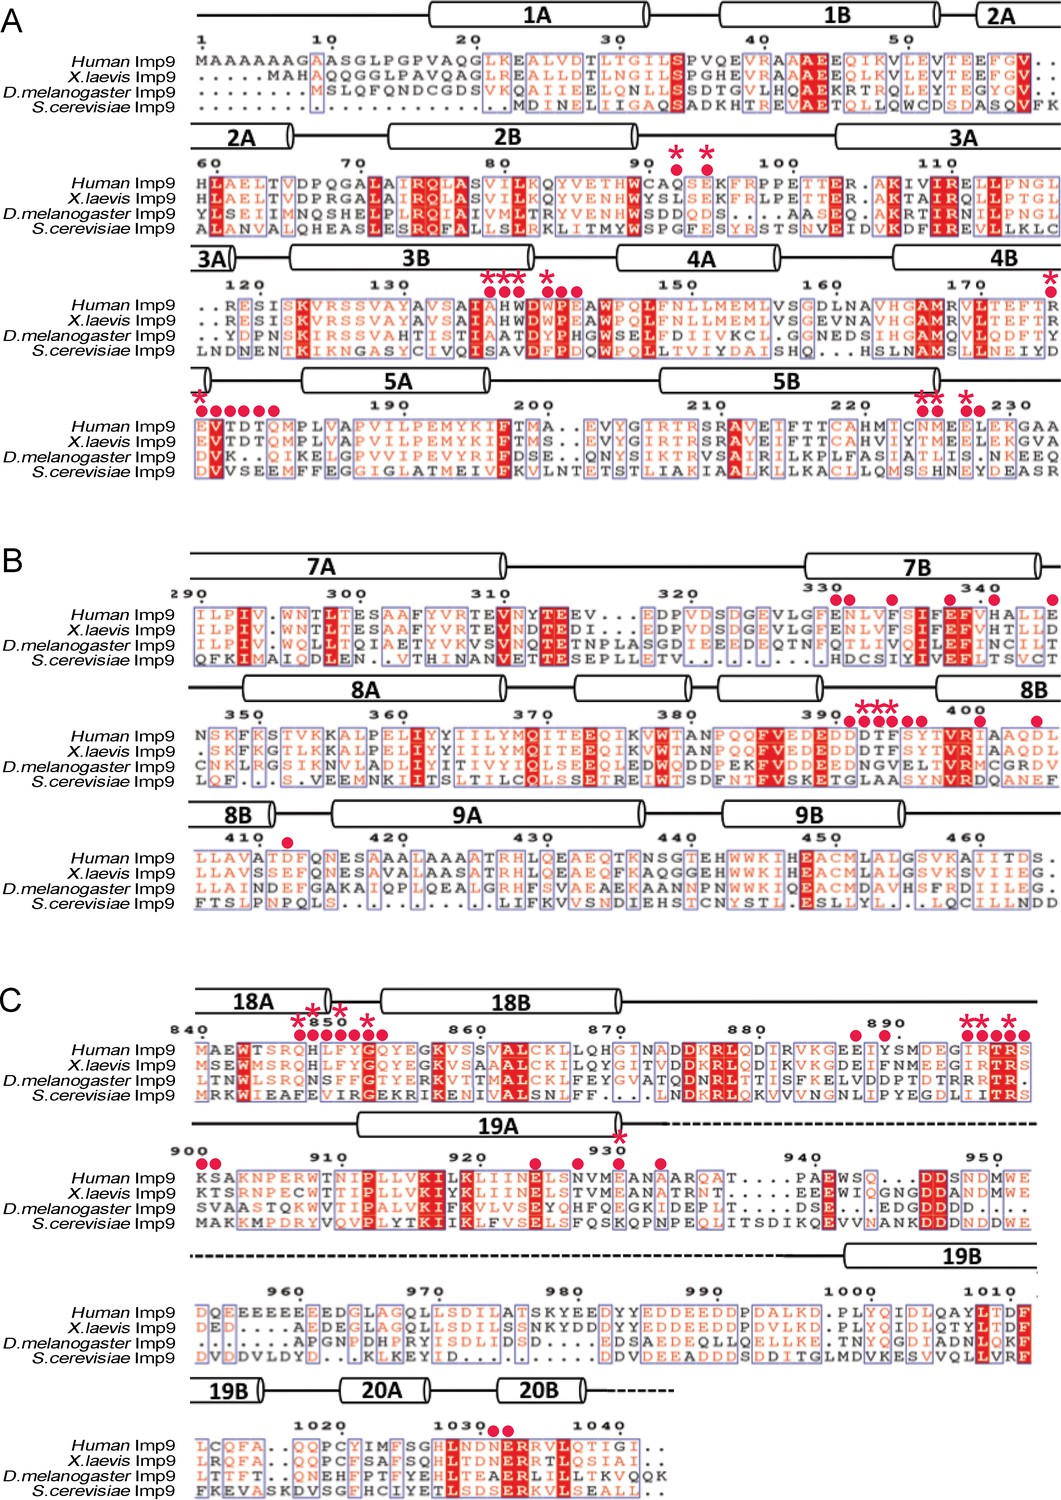
Sequence alignment of regions of Imp9 that interact with H2A-H2B.
(A-C) Sequence alignment of Imp9 sequences (human, X. laevis, D. melanogaster and S. cerevisiae) from the region that forms Interface 1 (A), Interface 2 (B) and Interface 3 (C) in Imp9•H2A-H2B structure. Residues in the three interfaces are mostly conserved, with Interface three being the most conserved. The level of conservation is consistent with many Imp9 residues, especially in Interface 1, using their main chain for interactions with histone residues.
Figure 3
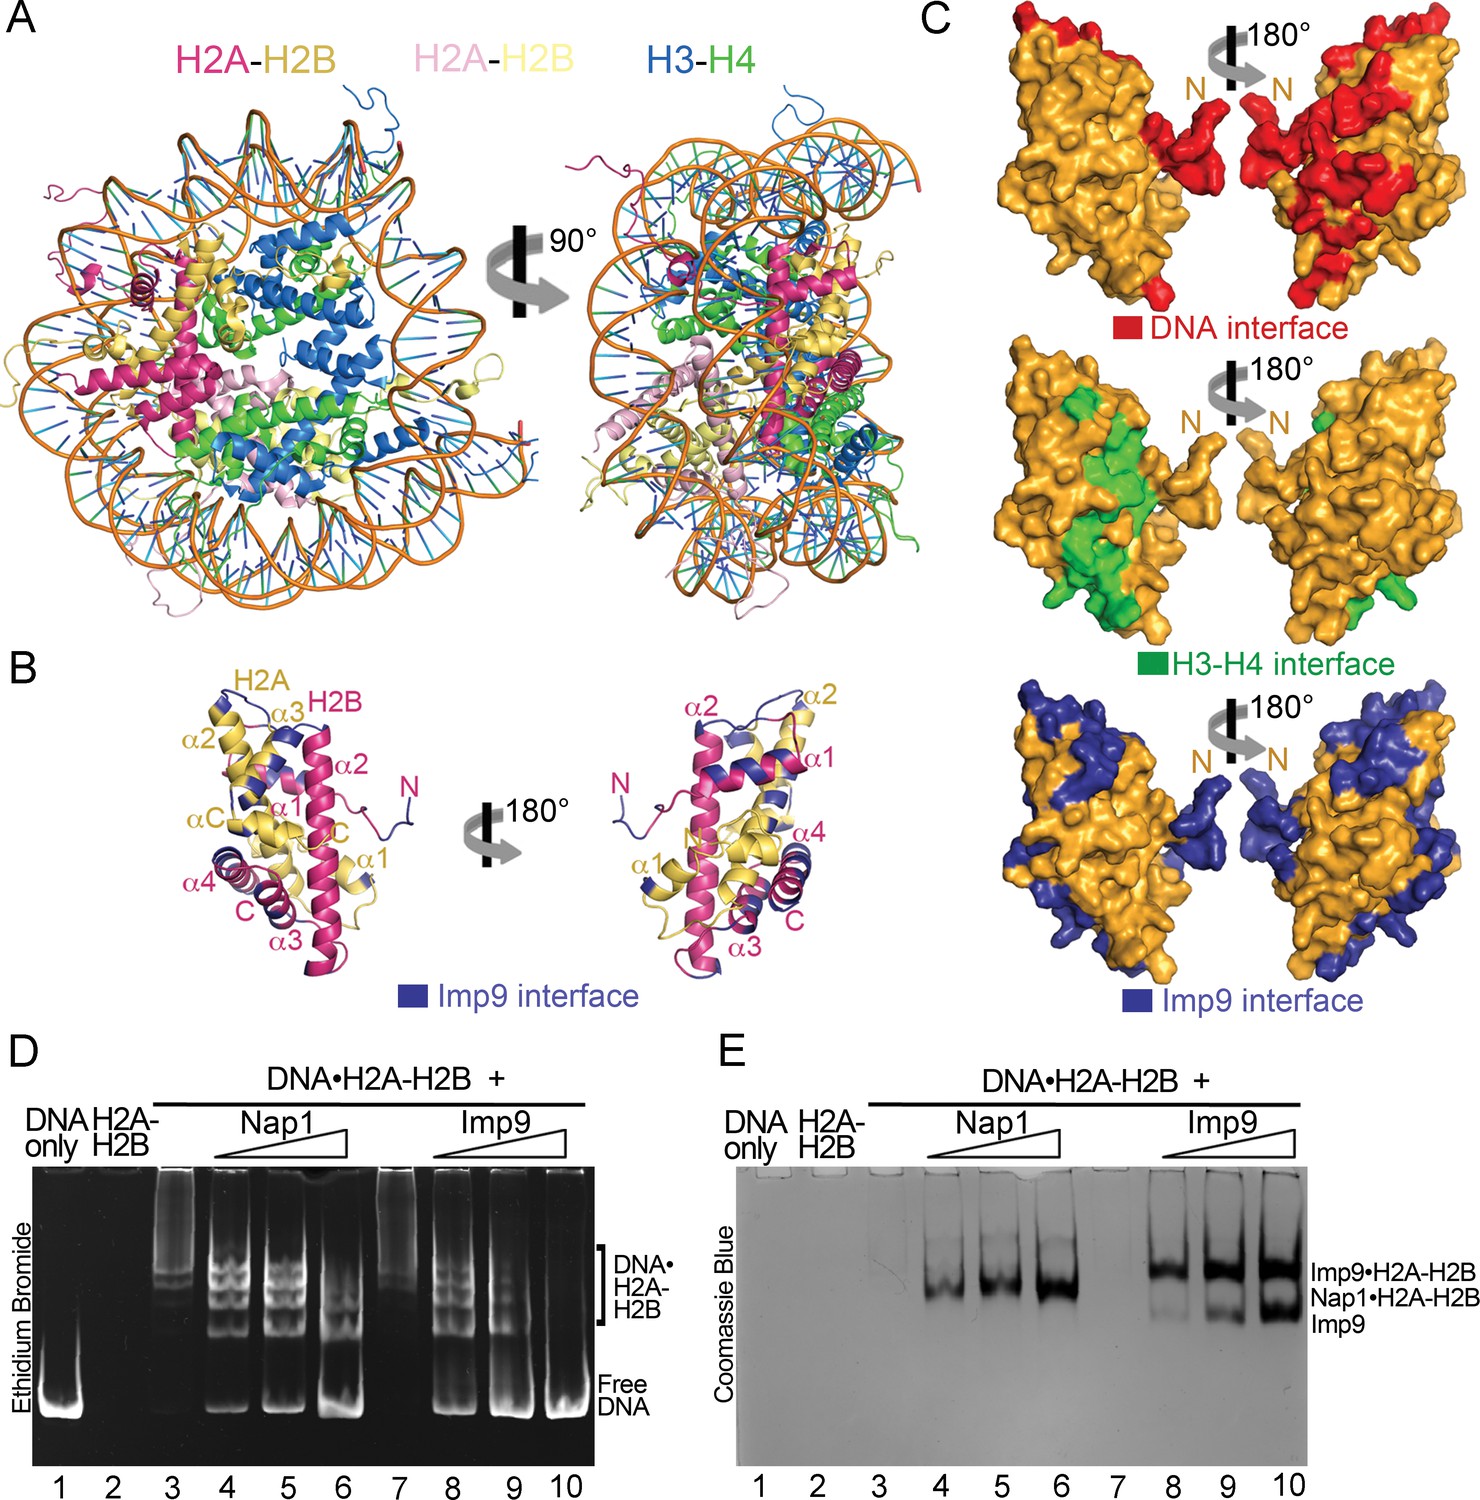
Imp9 has structural and biochemical characteristics of a histone chaperone.
(A) Structure of the nucleosome (1AOI): the orientation on the right shows one of the H2A-H2B dimers (in red and yellow) in the same orientation as H2A-H2B shown in the right panel of B. (B) Imp9-bound H2A-H2B (Imp9 not shown) with its Imp9 interface in dark blue. Orientation of H2A-H2B on the left is the same as in Figures 1C and 2A. (C) Surface representations of the H2A-H2B dimer surface (same orientation as in B) showing nucleosomal DNA (red), nucleosomal H3-H4 (green) and Imp9 (blue) binding interfaces. (D-E) Gel-shift assays to probe chaperone activity of Imp9. Increasing concentrations of Imp9 or Nap1 (0.5, 1.0 and 1.5 molar equivalents of H2A-H2B) were added to pre-formed DNA•H2A-H2B complexes, and the mixtures separated on a native gel stained with ethidium bromide to visualize DNA (D) and with Coomassie Blue to visualize protein (E). The two images of the same gel are horizontally aligned. The histone chaperone Nap1 binds H2A-H2B (E, lanes 4–6) leading to the release of free DNA (D, lanes 4–6). Imp9 also releases free DNA (D, lanes 8–10) as it binds H2A-H2B (E, lanes 8–10).
Figure 4 with 6 supplements
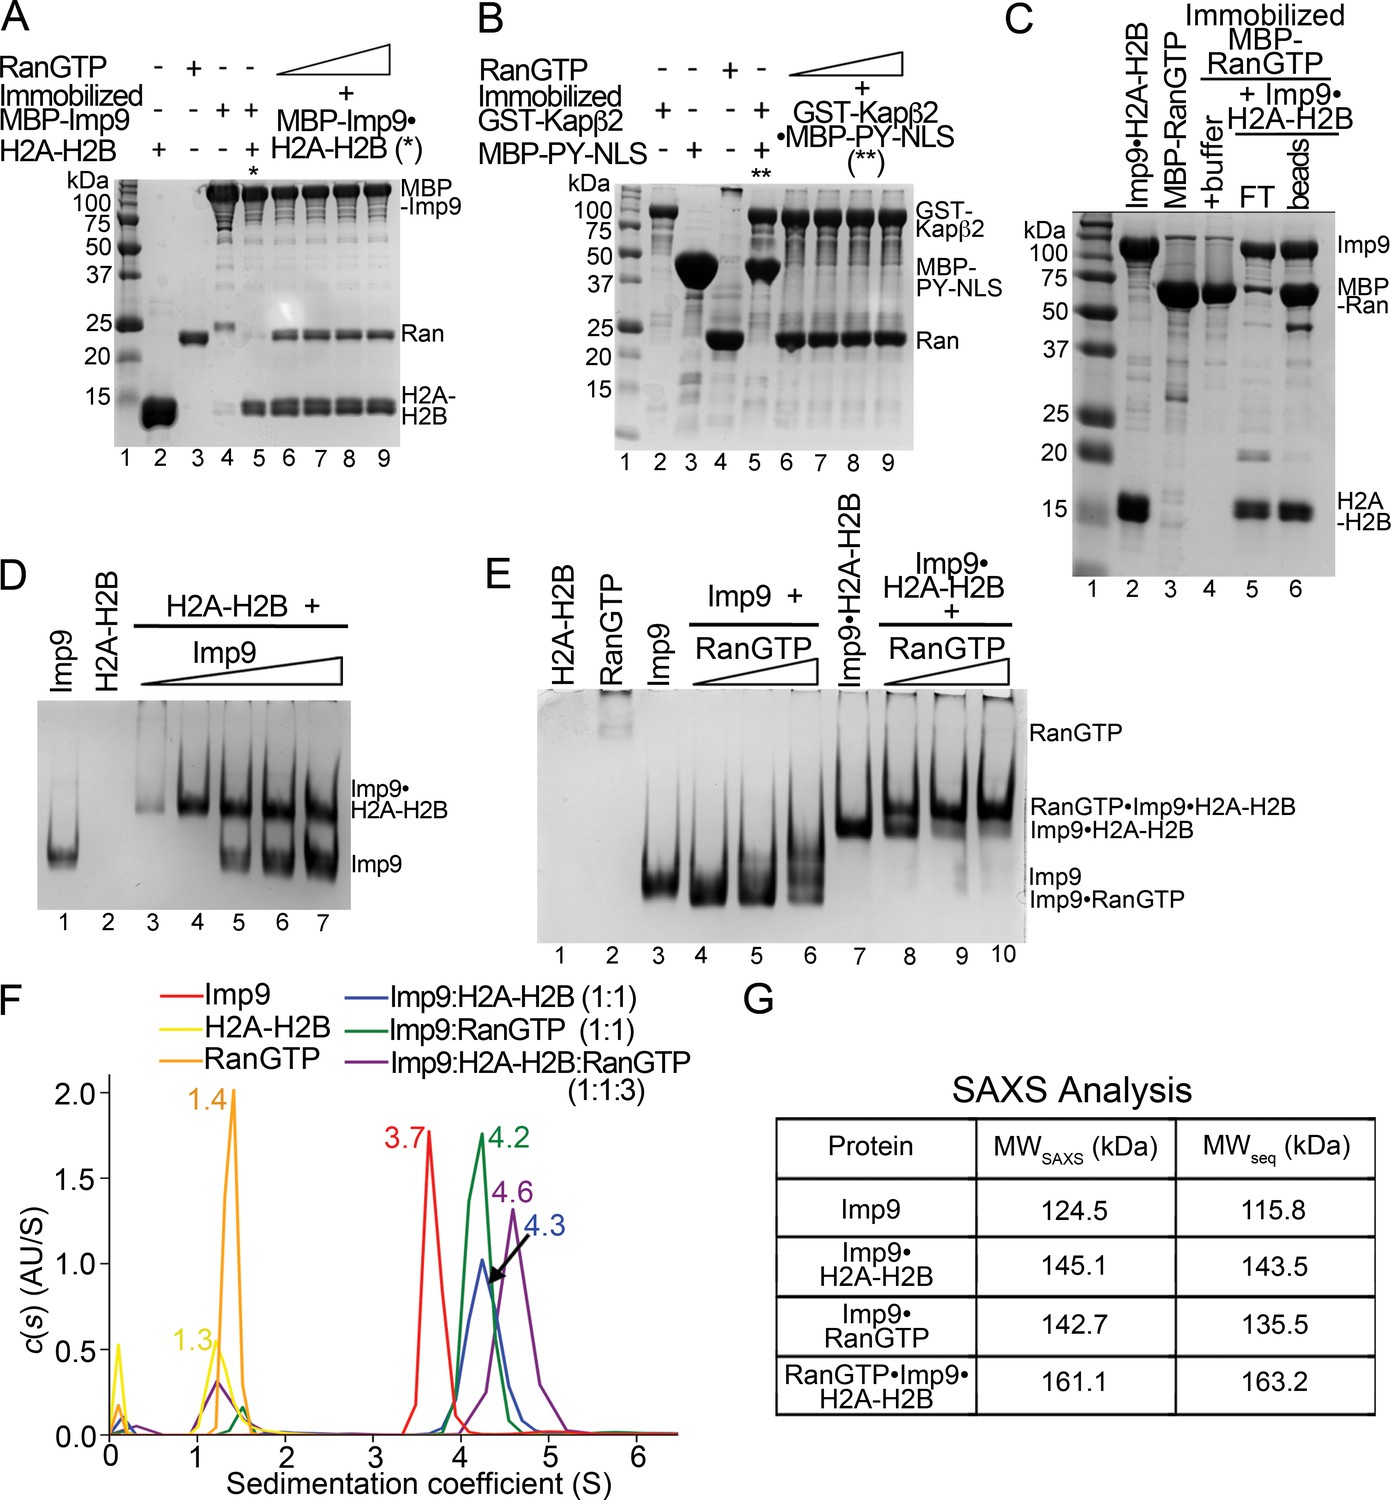
RanGTP does not release H2A-H2B but forms a RanGTP•Imp9•H2A-H2B complex.
(A) Pull-down binding assay to probe RanGTP (S. cerevisiae Ran(1–179/Q71L)) interactions with the Imp9•H2A-H2B complex. Increasing concentrations of RanGTP (12.5 μM, 25 μM, 50 μM or 75 μM) were added to 2.5 μM MBP-Imp9•H2A-H2B that is immobilized on amylose resin. After extensive washing, the bound proteins were visualized by Coomassie-stained SDS-PAGE. Controls are shown in Figure 4—figure supplement 1. (B) Pull-down binding assays to show RanGTP mediated dissociation of the GST-Kapβ2•MBP-PY-NLS complex. Increasing concentrations of RanGTP (12.5 μM, 25 μM, 50 μM or 75 μM) were added to 2.5 μM GST-Kapβ2•MBP-PY-NLS (immobilized). After extensive washing, bound proteins were visualized by Coomassie-stained SDS-PAGE. Controls are shown in Figure 4—figure supplement 1. (C) Pull-down binding assay where preformed Imp9•H2A-H2B was added to immobilized MBP-RanGTP. After washing, the bound proteins were visualized by Coomassie-stained SDS-PAGE. (D) EMSA of Imp9 titrated at 0.5–2.5 molar equivalents to constant H2A-H2B. Upward shift of the Imp9 band shows that Imp9 interacts with H2A-H2B. (E) EMSA of Ran titrated at 1–3 molar equivalents to constant Imp9 (lanes 3–6) or Imp9•H2A-H2B (lanes 7–10). Downward shift of the Imp9 band shows that Imp9 interacts with Ran to form Imp9•RanGTP (compare lanes 4–6 to lane 3), while upward shift of the Imp9•H2A-H2B band shows that a heterotetrameric Ran•Imp9•H2A-H2B complex forms (compare lanes 8–10 to lane 7). No Imp9 or Imp9•RanGTP band is present in lanes 8–10 indicating no dissociation of the Imp9•H2A-H2B complex by RanGTP. Proteins inputs for lanes 1–10 are shown in Figure 4—figure supplement 1D. (F) Analytical ultracentrifugation produced sedimentation profiles for Imp9, H2A-H2B, RanGTP, the 1:1 molar ratio mix of Imp9 and H2A-H2B dimer, the 1:1 molar ratio mix of Imp9 and RanGTP, and the 1:1:3 molar ratio mix of Imp9, H2A-H2B dimer and RanGTP. (G) Molecular weights estimated from merged SAXS profiles (MWSAXS) for Imp9, Imp9•H2A-H2B, Imp9•RanGTP, and RanGTP•Imp9•H2A-H2B, compared with molecular weights from the protein sequences (MWseq).
-
Figure 4—source data 1
Summary of the SAXS experiments and analysis.
- https://doi.org/10.7554/eLife.43630.020
-
Figure 4—source data 2
Summary of the SAXS parameters.
- https://doi.org/10.7554/eLife.43630.021
Figure 4—figure supplement 1
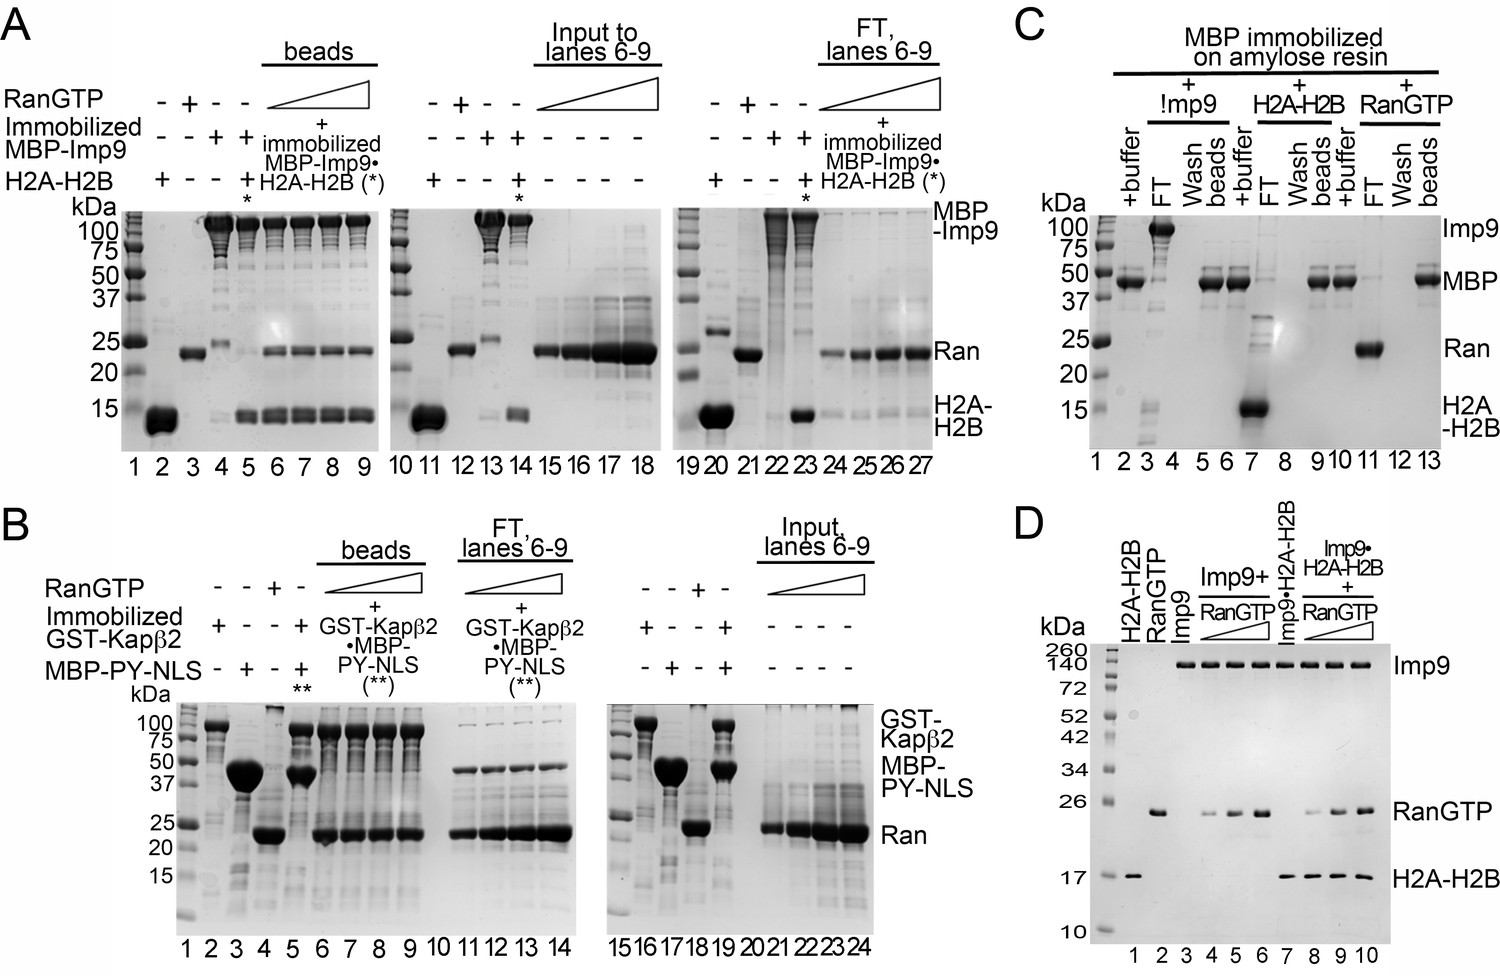
Interactions between RanGTP and the Imp9•H2A-H2B complex.
(A) Pull-down binding assays to probe RanGTP (S. cerevisiae Gsp1 (1–179/Q71L) interactions with the Imp9•H2A-H2B complex. Increasing concentrations of RanGTP (12.5 μM, 25 μM, 50 μM or 75 μM) was added to 2.5 μM MBP-Imp9•H2A-H2B. After washing, bound proteins were visualized by Coomassie-stained SDS-PAGE. 2% of input RanGTP for the corresponding to binding reactions in lanes 6–9 are shown lanes 15–18. 2% of the flow-through from the corresponding to binding reactions in lanes 6–9 are shown lanes 24–27. (B) Pull-down binding assays to probe RanGTP mediated dissociation of MBP-PYNLS from the GST-Kapβ2•MBP-PY-NLS complex. Increasing concentrations of RanGTP (12.5 μM, 25 μM, 50 μM or 75 μM) was added to 2.5 μM GST-Kapβ2•MBP-PY-NLS. After washing, the bound proteins were visualized by Coomassie-stained SDS-PAGE. 2% of input RanGTP for the corresponding binding reactions in lane 6–9 are shown in lanes 21–24. 2% of flow-through from the corresponding binding reactions in lanes 6–9 are shown in lanes 11–14. (C) Controls for pull-down binding assays. Imp9 (lanes 3–5), H2A-H2B (lane 7–9) or RanGTP (lane 11–13) was added to immobilized MBP. The flow-through (FT), the last wash and the proteins that remain bound on beads after washing were visualized by Coomassie-stained SDS-PAGE. (D) Coomassie-stained SDS-PAGE of the protein inputs for the native gel in Figure 4E.
Figure 4—figure supplement 2
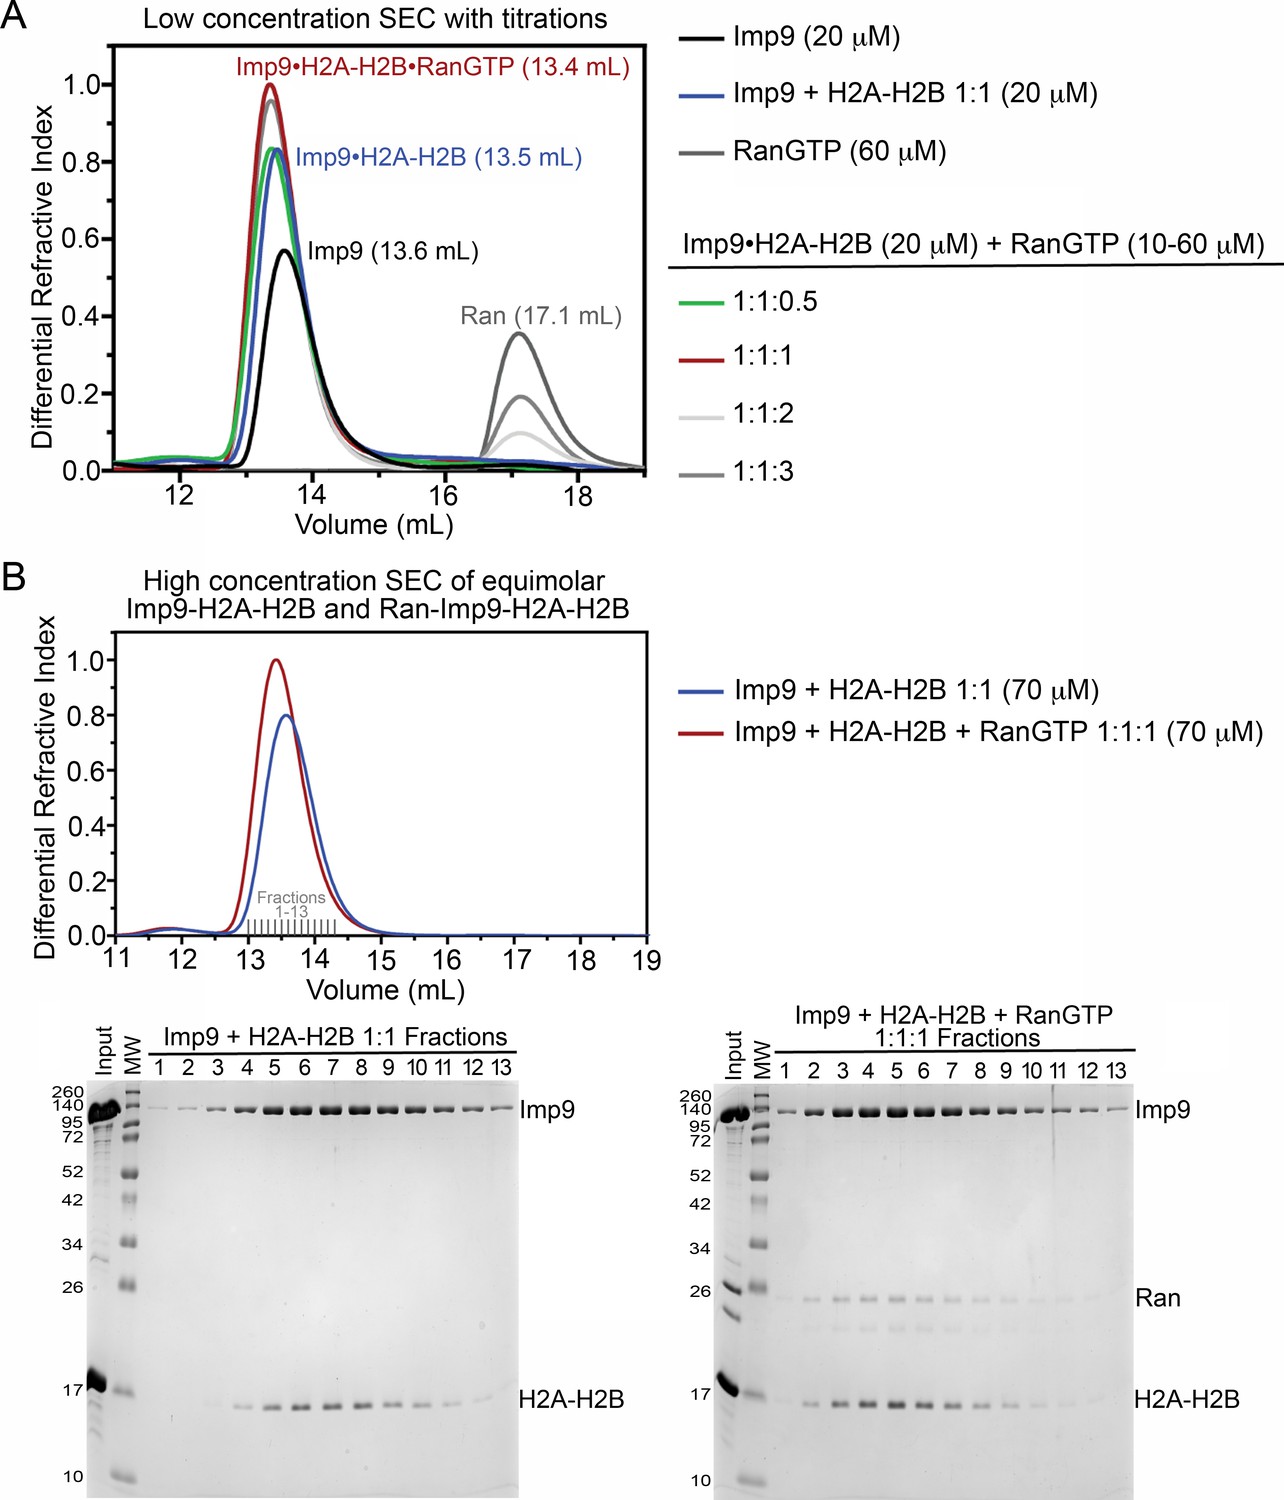
Size exclusion chromatography of Imp9, H2A-H2B and RanGTP complexes.
(A) Size exclusion chromatography (SEC) of 20 μM Imp9 alone (black), 60 μM RanGTP alone (dark grey), Imp9 +H2A-H2B 1:1 (20 μM; blue), and Imp9 +H2A-H2B 1:1 (20 μM) with Ran at 0.5 (10 μM; green), 1 (20 μM; red), 2 (40 μM; light grey) or 3 (60 μM; grey). The buffer was 20 mM HEPES pH 7.4, 200 mM sodium chloride, 2 mM magnesium acetate, 2 mM TCEP and 8% (v/v) glycerol. Column was Superdex S200 Increase 10/300. Imp9 alone elutes at 13.6 mL, while the 1:1 Imp9•H2A-H2B complex elutes at 13.5 mL. We see the formation of a 1:1:1 RanGTP•Imp9•H2A-H2B complex. Addition of an equimolar amount of RanGTP causes the Imp9•H2A-H2B peak to shift from 13.5 mL to 13.4 mL. Continued addition of RanGTP beyond a 1:1:1 mixture, results in the appearance of free RanGTP that elutes at 17.1 mL. Comparison to a Ran only control (60 μM; dark grey) shows that the Imp9•H2A-H2B•Ran complex has a 1:1:1 stoichiometry. Quantitatively, the free RanGTP peak is absent in the 1:1:1 sample, is one-third of the control in a 1:1:2 sample, and two-thirds of the control in a 1:1:3 sample. (B) SEC of 1:1 Imp9 +H2A-H2B (70 μM; blue) and 1:1:1 Imp9, H2A-H2B, and Ran (70 μM; red). The buffer was 20 mM HEPES pH 7.4, 200 mM NaCl, 2 mM magnesium acetate, 2 mM TCEP and 8% (v/v) glycerol. Column was Superdex S200 Increase 10/300. Peak fractions (Fractions 1–13) were analyzed on 15% SDS-PAGE stained with Coomassie blue. As in A), Imp9•H2A-H2B elutes at 13.5 mL and the peak eluting at 13.4 mL contains 1:1:1 RanGTP•Imp9•H2A-H2B. Analysis of peak fractions by SDS-PAGE shows the presence of Imp9, H2A-H2B, and Ran in the peak. Each protein stains in proportion to that seen in the input lane, consistent with the formation of a 1:1:1 complex. Also, in the SEC there is no free H2A-H2B or free Ran.
Figure 4—figure supplement 3
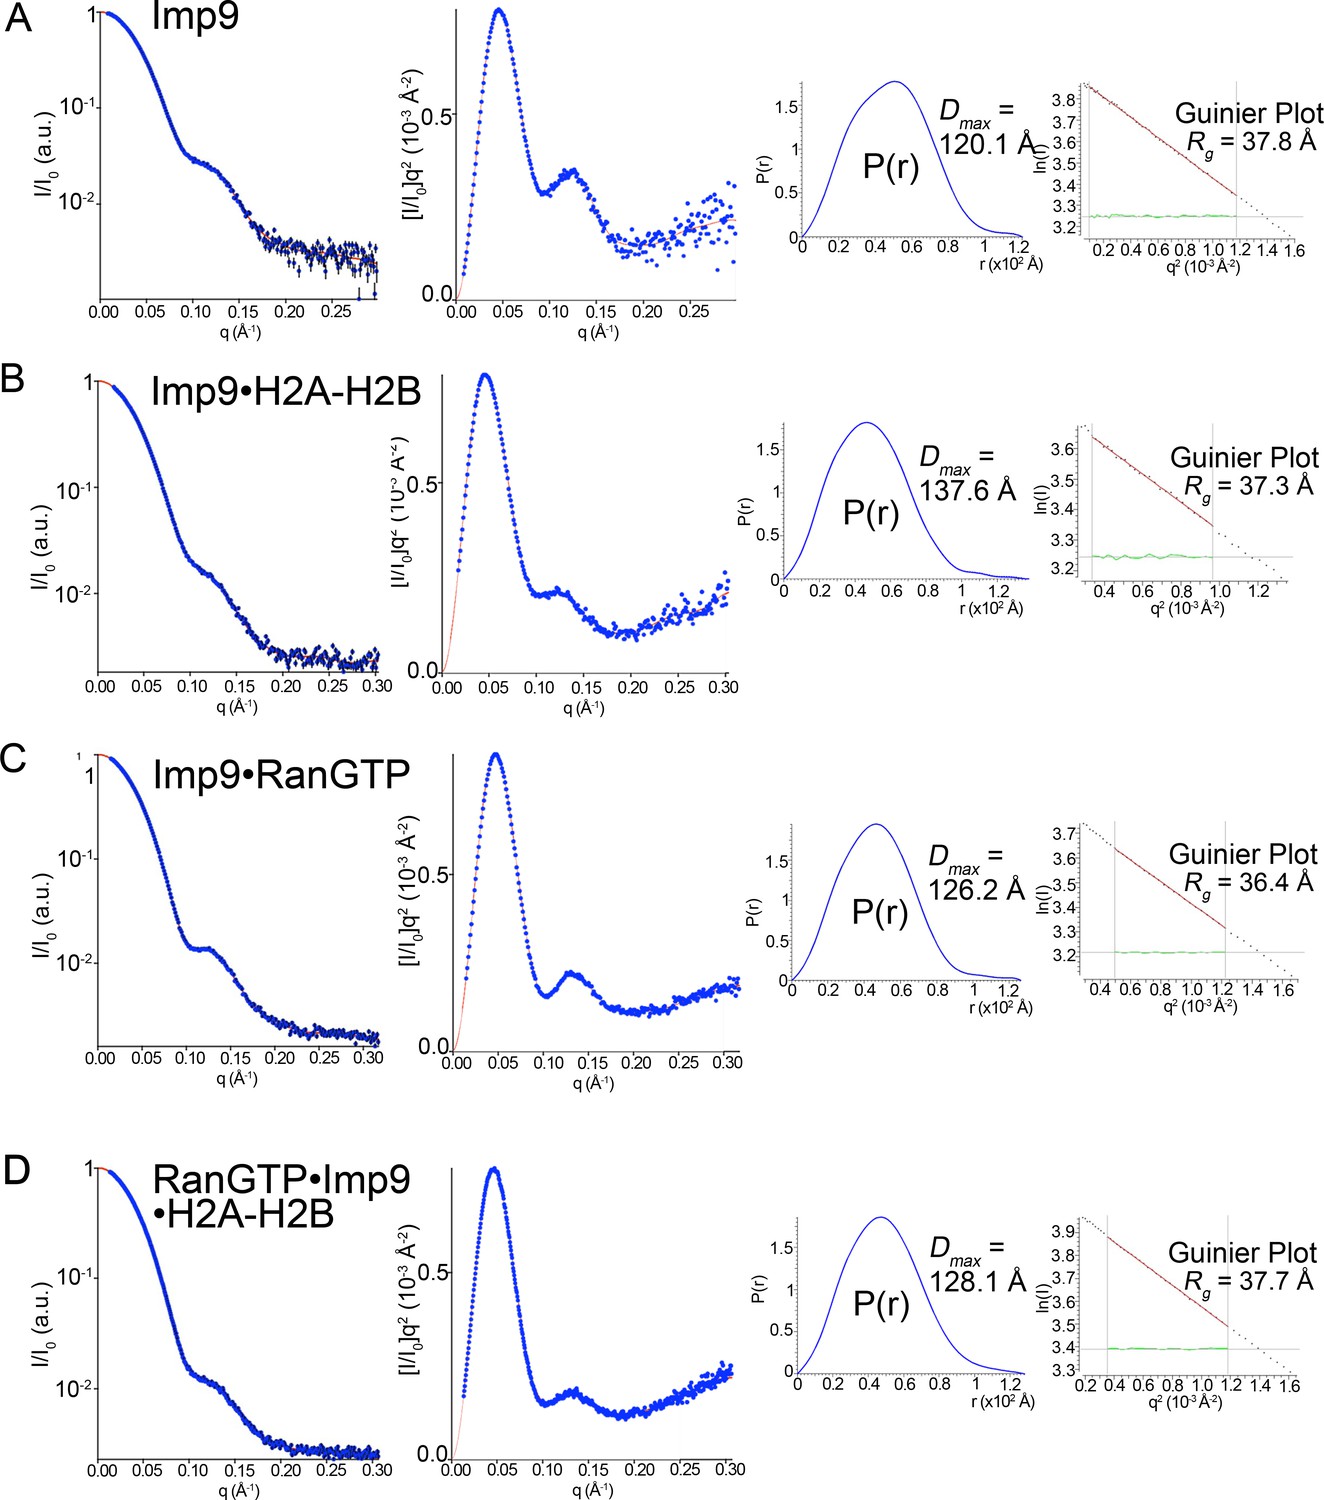
SAXS analysis of Imp9, Imp9•RanGTP, Imp9•H2A-H2B, and RanGTP•Imp9•H2A-H2B.
(A-D) Experimental SAXS profiles of Imp9 (A), Imp9•H2A-H2B (B), Imp9•RanGTP (C), and RanGTP•Imp9•H2A-H2B (D) were used to compute radius of gyration (Rg), maximum particle size (Dmax), pair distribution function (P(r)) and estimated molecular weights (Figure 4G and Figure 4—source datas 1 and 2). Left panels: experimental SAXS profile (blue dots with black error bars) is shown along with the extrapolation curve (red). The corresponding Kratky plot, used to depict the level of flexibility, is also shown in blue dots along with the extrapolation curve (red). Right panels: The left plot shows the pair distribution function, P(r). The maximum particle size (Dmax) was determined as the maximum pair distance in the plot. The right plot shows the corresponding Guinier plot with the calculated Rg fit value in Å. The linearity of the Guinier plots confirms a high degree of homogeneity for each of the SAXS samples.
Figure 4—figure supplement 4
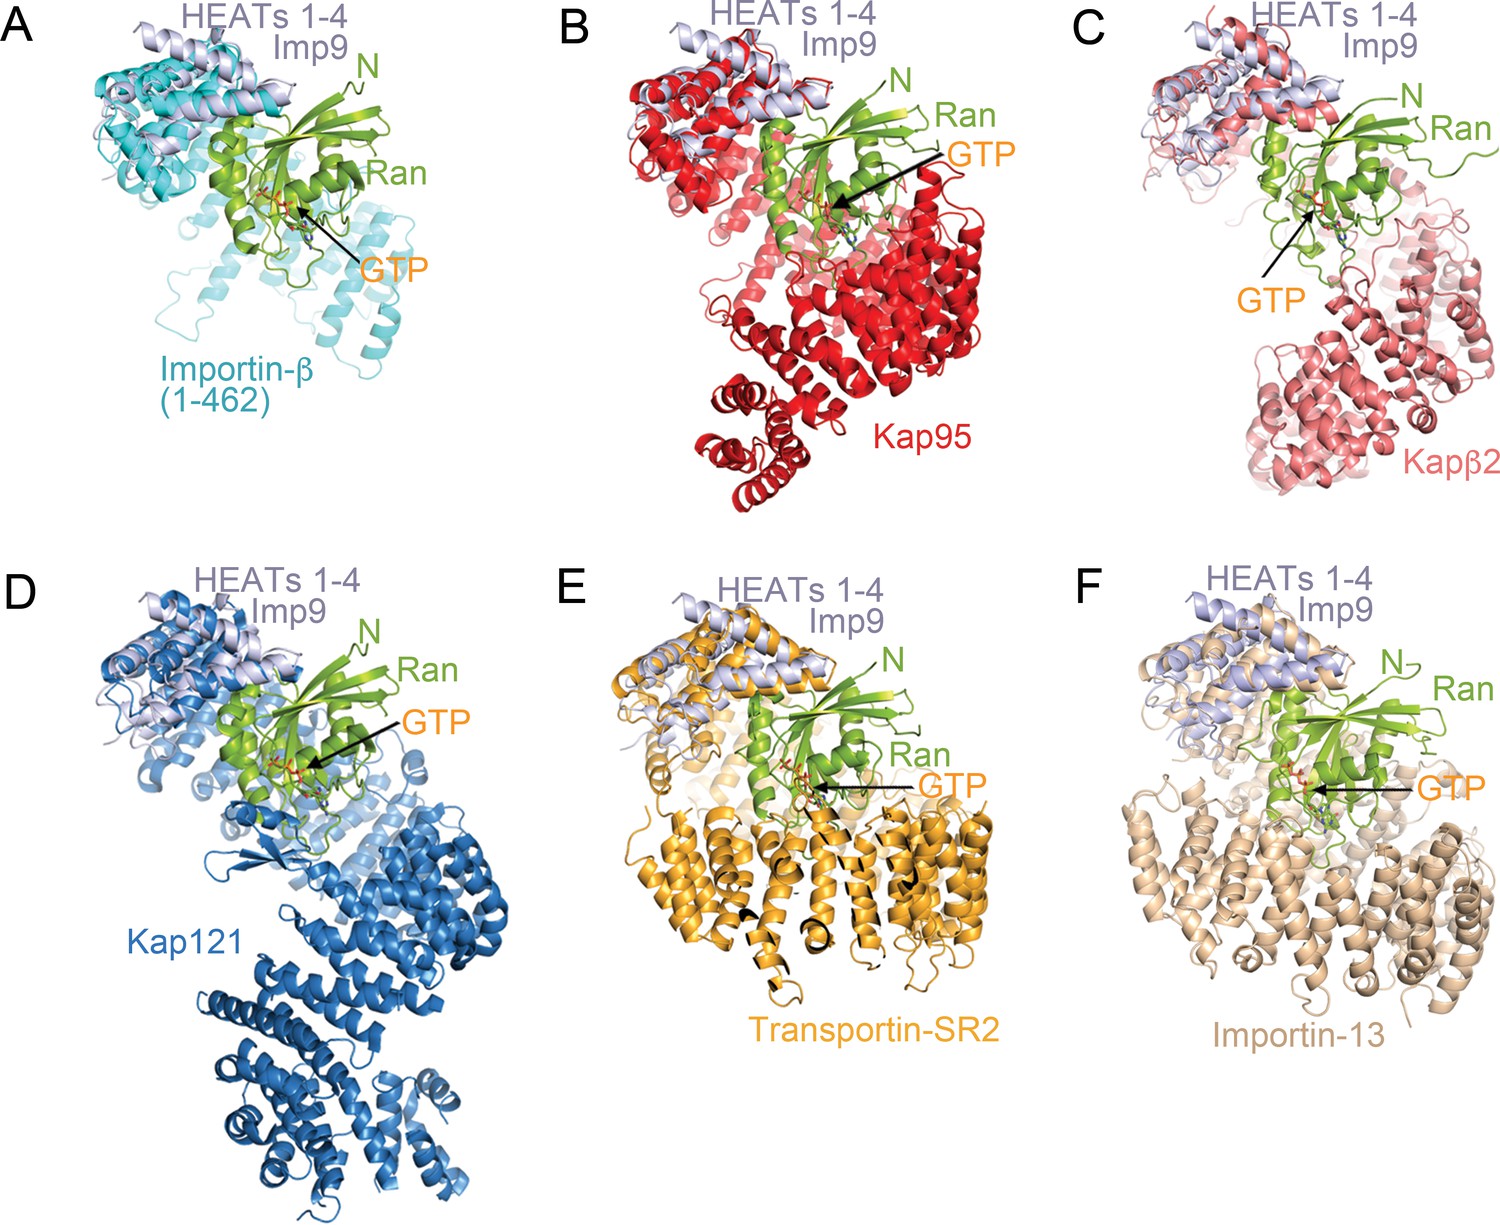
Comparative structural analysis of importin-RanGTP complexes.
(A-F) Structural alignment of HEAT repeats 1–4 of six different importin-RanGTP complexes to HEAT repeats 1–4 of Imp9. The complexes compared are Importin-β(1-462)•RanGTP (A; 1IBR), Kap95•RanGTP (B); 2BKU), Kapβ2•RanGTP (C); 1QBK), Kap121•RanGTP (D); 3W3Z), Transportin-SR2• RanGTP (E); 4C0Q) and Importin-13•RanGTP (F); 2 × 19). The importins are shown with different colors, Ran in green and the aligned N-terminal HEAT repeats of Imp9 are in light blue. All structures are shown with the same orientation of the aligned Imp9 (HEAT repeats 1–4). Ran is oriented very similarly and binds at very similar locations, at the B helices of HEAT repeats 1–4 of the importins, in all six structures. The pitches of the importin superhelices are different, resulting in the second importin-Ran interface (located at the bottom of Ran in A–F) interacting with different central or C-terminal HEAT repeats of the importins.
Figure 4—figure supplement 5
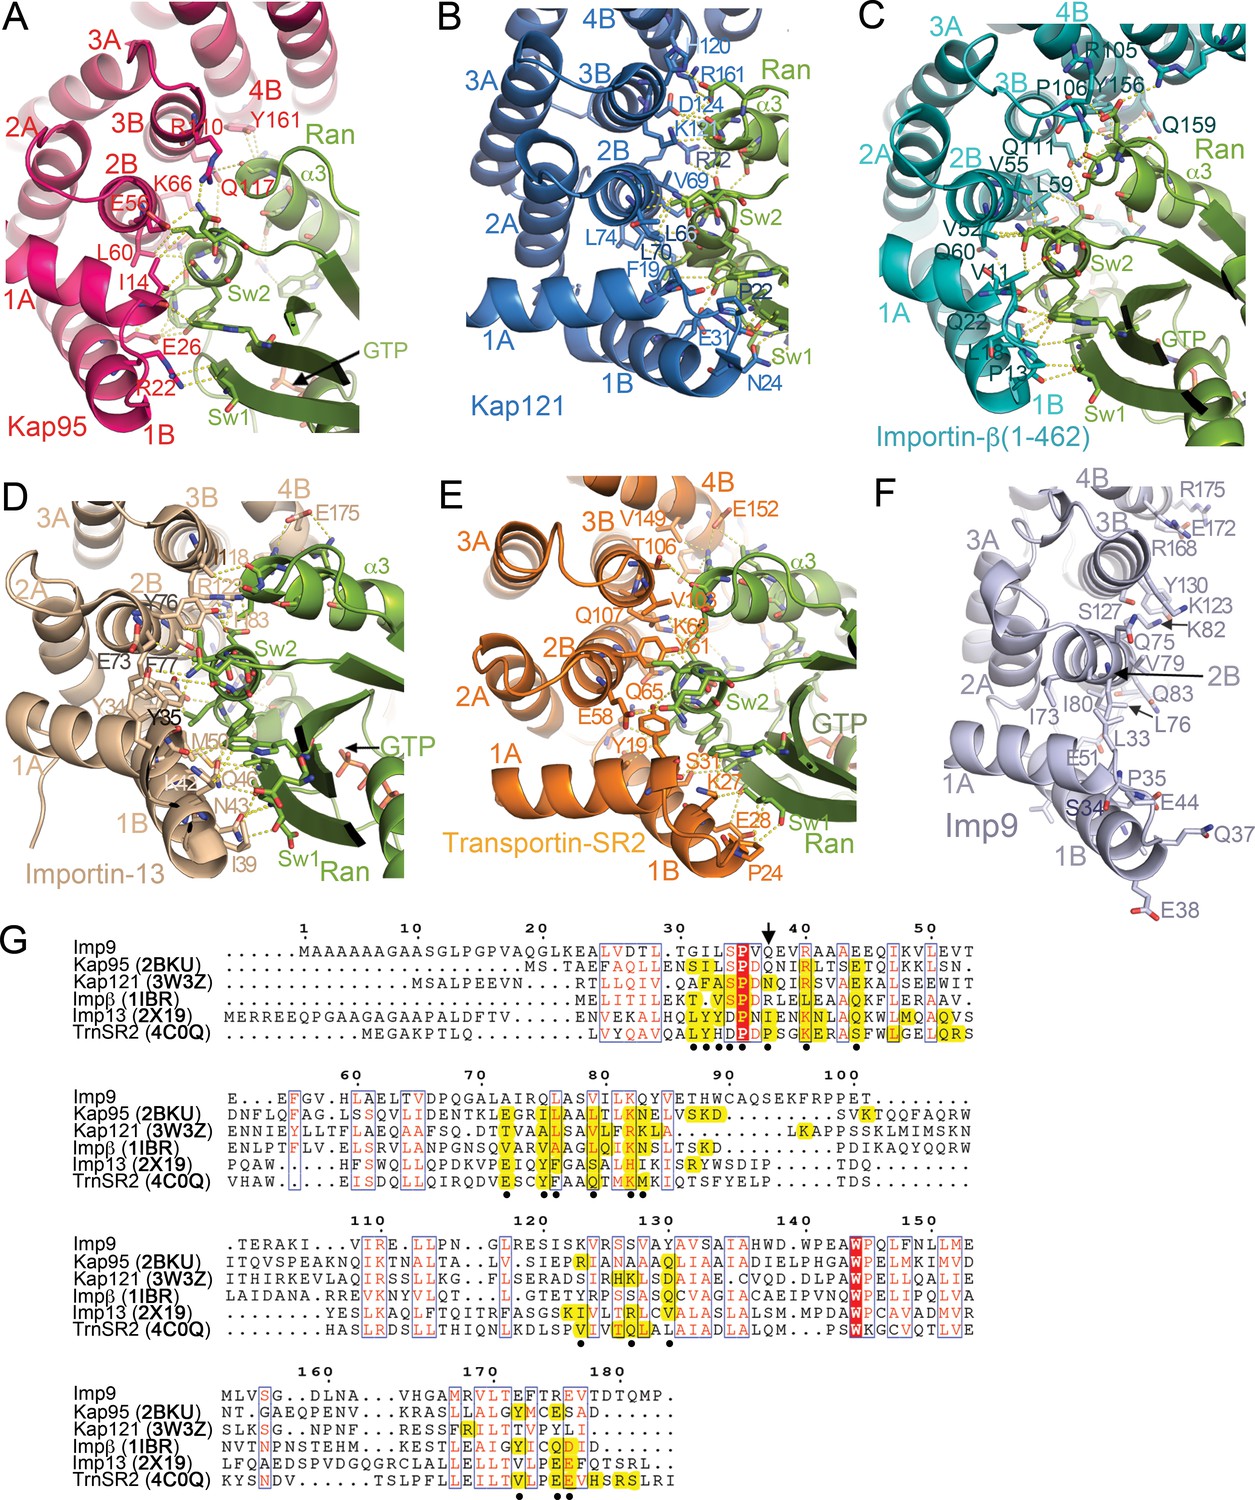
RanGTP binding interfaces at HEAT repeats 1–4 of Kap95, Kap121, Importin-β, Importin-13 and Transportin-SR2.
(A-E) RanGTP binding interfaces- at the N-termini of the importins: Kap95•RanGTP (A); 2BKU), Kap121•RanGTP (B); 3W3Z), Importin-β(1-462)•RanGTP (C; 1IBR), Importin-13•RanGTP (D); 2 × 19) and Transportin-SR2• RanGTP (E); 4C0Q). Interactions are shown with dashed lines and all structures are shown in similar orientations. (F) HEAT repeats 1–4 of Imp9, oriented similarly as importins in A–E), showing side chains on the B helices may contact RanGTP. (G) Sequence alignment of residues in HEAT repeats 1–4 of Imp9, Kap95, Kap121, Importin-β, Importin-13 and Transportin-SR2. Importin positions with identical amino acids are shaded red, and those with conserved amino acids are shown in boxes. There are 18–23 residues/positions in each importin that contact Ran, and they are shaded yellow. Of these, 20 positions contact Ran in ≥3 importins (marked with black circles). The majority of Ran contacts in each of the five importins are among these 20 most commonly used positions but only 8 of the 20 most common Ran contact positions show sequence conservation (marked with black circles and boxed). Flexibility of the HEAT repeat architecture and diversity of importin-Ran interactions at any site within the interface results in structural conservation at the interface between the N-termini of importins and the switch 1, 2 regions of RanGTP even when sequence conservation is not high. For example, the position of Q37 (marked with arrow) in Imp9 is not conserved in sequence but the side chains in Kap121, Importin-13 and Transportin-SR2 (all at the N-terminal end of the B helix of HEAT repeat 1) interact with the N-terminal end of the β2 strand of Ran (part of switch 1). Pro24 of Transportin-SR2 and Ile39 of Importin-13 make hydrophobic interactions with a Val47 side chain of Ran, but Asn24 of Kap121 make polar contacts with the main chain of Ran Val47. The majority of Imp9 side chains in the most common/structurally conserved Ran contact sites (marked with black circles) are the same as or have similar chemical characteristics as at least one of the five other importin side chains in that same position, supporting the prediction that RanGTP will likely contact Imp9 at the same location as shown in A–E), on the B-helices of HEAT repeats 1–4.
Figure 4—figure supplement 6
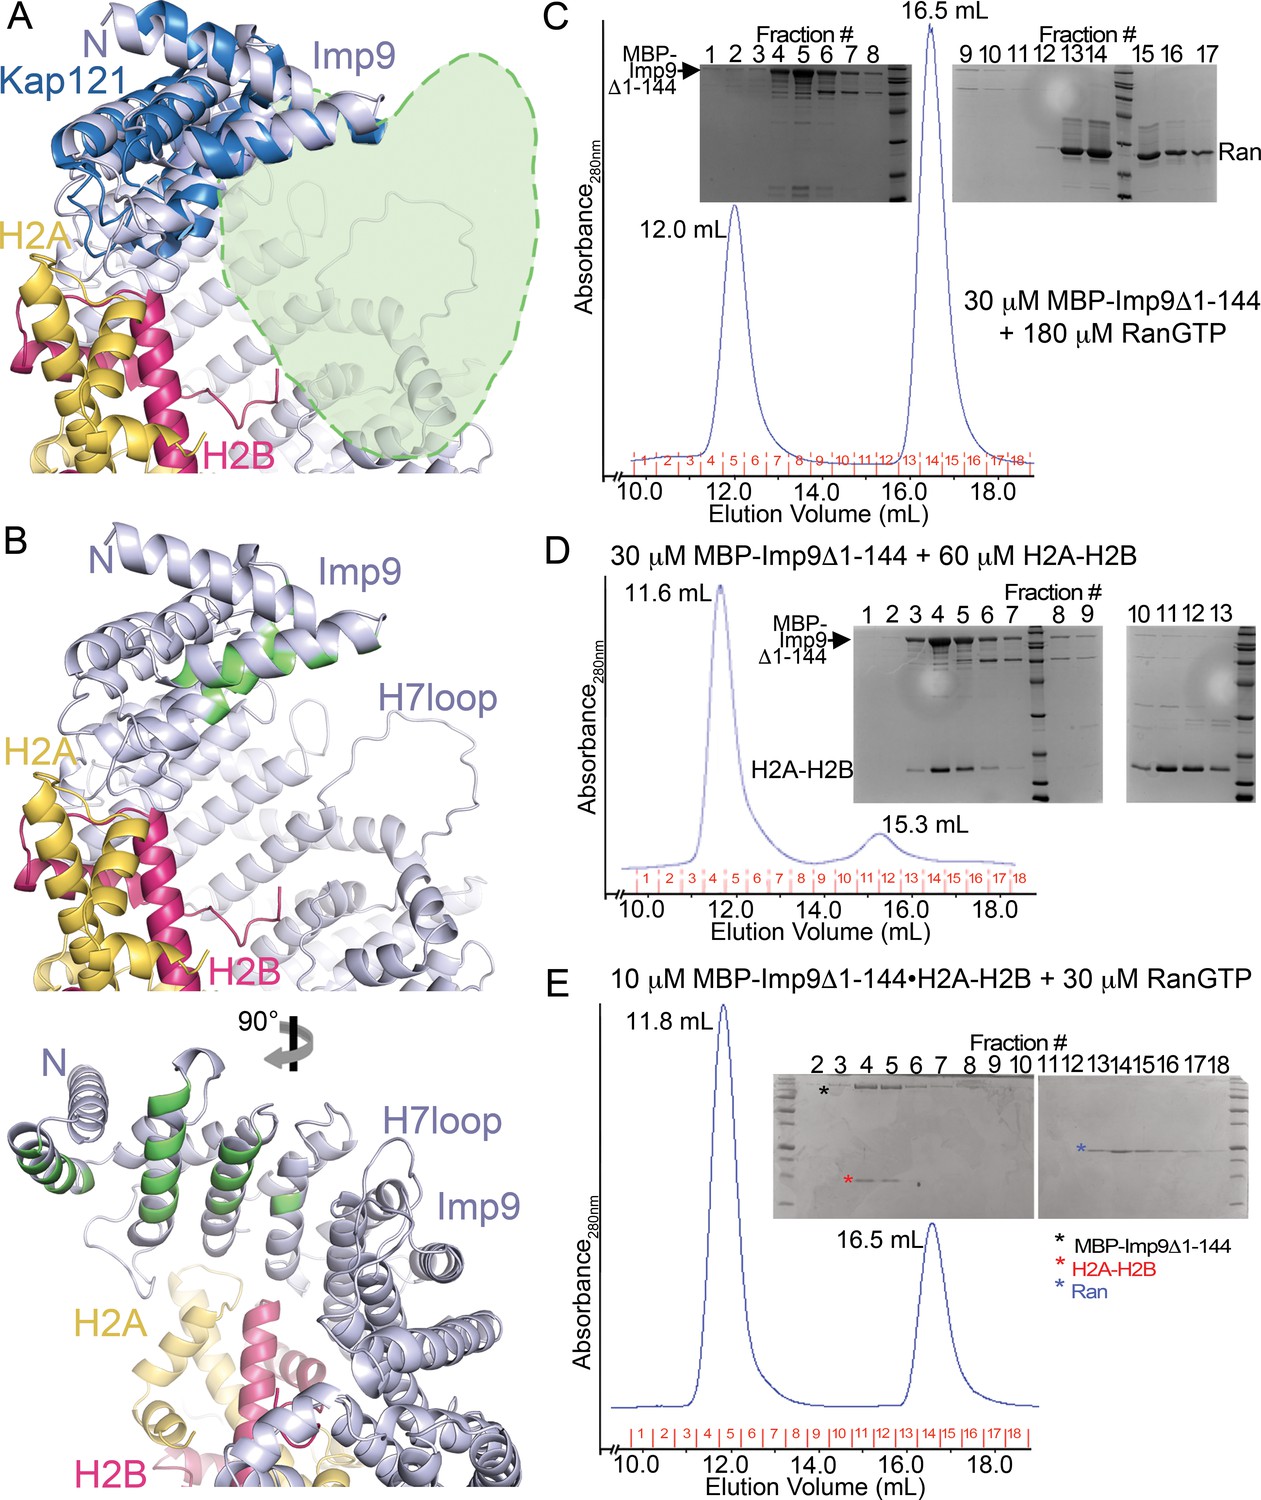
The predicted RanGTP binding site at HEAT repeats 1–4 of Imp9.
(A) A zoomed in view (the N-terminal half of Imp9) of the Imp9•H2A-H2B structure shown in the same orientation as the importins in Figure 4—figure supplement 5D. Imp9 is in blue, H2A in yellow and H2B in red. Imp9 is structurally aligned with the 1st four HEAT repeats of Kap121 (shown in dark blue) in the Kap121•RanGTP structure (3W3Z). RanGTP from the Kap121•RanGTP structure is not shown but is schematically depicted by the light-green heart-shape drawing to mark the predicted location of the Ran site on Imp9. (B) Top panel, same view of the Imp9•H2A-H2B structure as in A), with Imp9 residues at the predicted RanGTP binding site colored green. Bottom panel shows the view upon 90° rotation about the vertical axis.( C–E) Size exclusion chromatography of MBP-Imp9Δ1–144 + excess RanGTP (C), MBP-Imp9Δ1–144 + H2A-H2B (D) and previously purified MBP-Imp9Δ1–144•H2A-H2B + excess RanGTP (E). 500 μL protein samples were loaded on to a Superdex S200 Increase 10/300 column and the size exclusion chromatography experiments were performed in buffer containing 20 mM HEPES pH 7.4, 200 mM sodium chloride, 2 mM magnesium acetate, 2 mM DTT and 10% glycerol. The elution volume for each protein peak is shown and proteins in the fractions are visualized by Coomassie-stained SDS-PAGE gels shown above the chromatograms. SEC analysis shows that RanGTP does not interact with the Imp9 mutant. No interaction is seen at micromolar concentrations even when RanGTP is added at a 6-fold molar excess. This is obvious from the SDS-PAGE analysis of SEC fractions, showing that the Imp9 mutant and RanGTP do not co-migrate (C). The Imp9 mutant protein is functional as the interaction is maintained with H2A-H2B (D). This is consistent with the crystal structure showing that the region spanning HEAT repeats 1–3 of Imp9 (residues 1–144) is only a very small portion of the very large Imp9•H2A-H2B interface. Not surprisingly, like Imp9 mutant alone in C), the histone-bound Imp9 mutant also does not bind RanGTP when the GTPase is added at a molar excess (E).
Figure 5 with 1 supplement
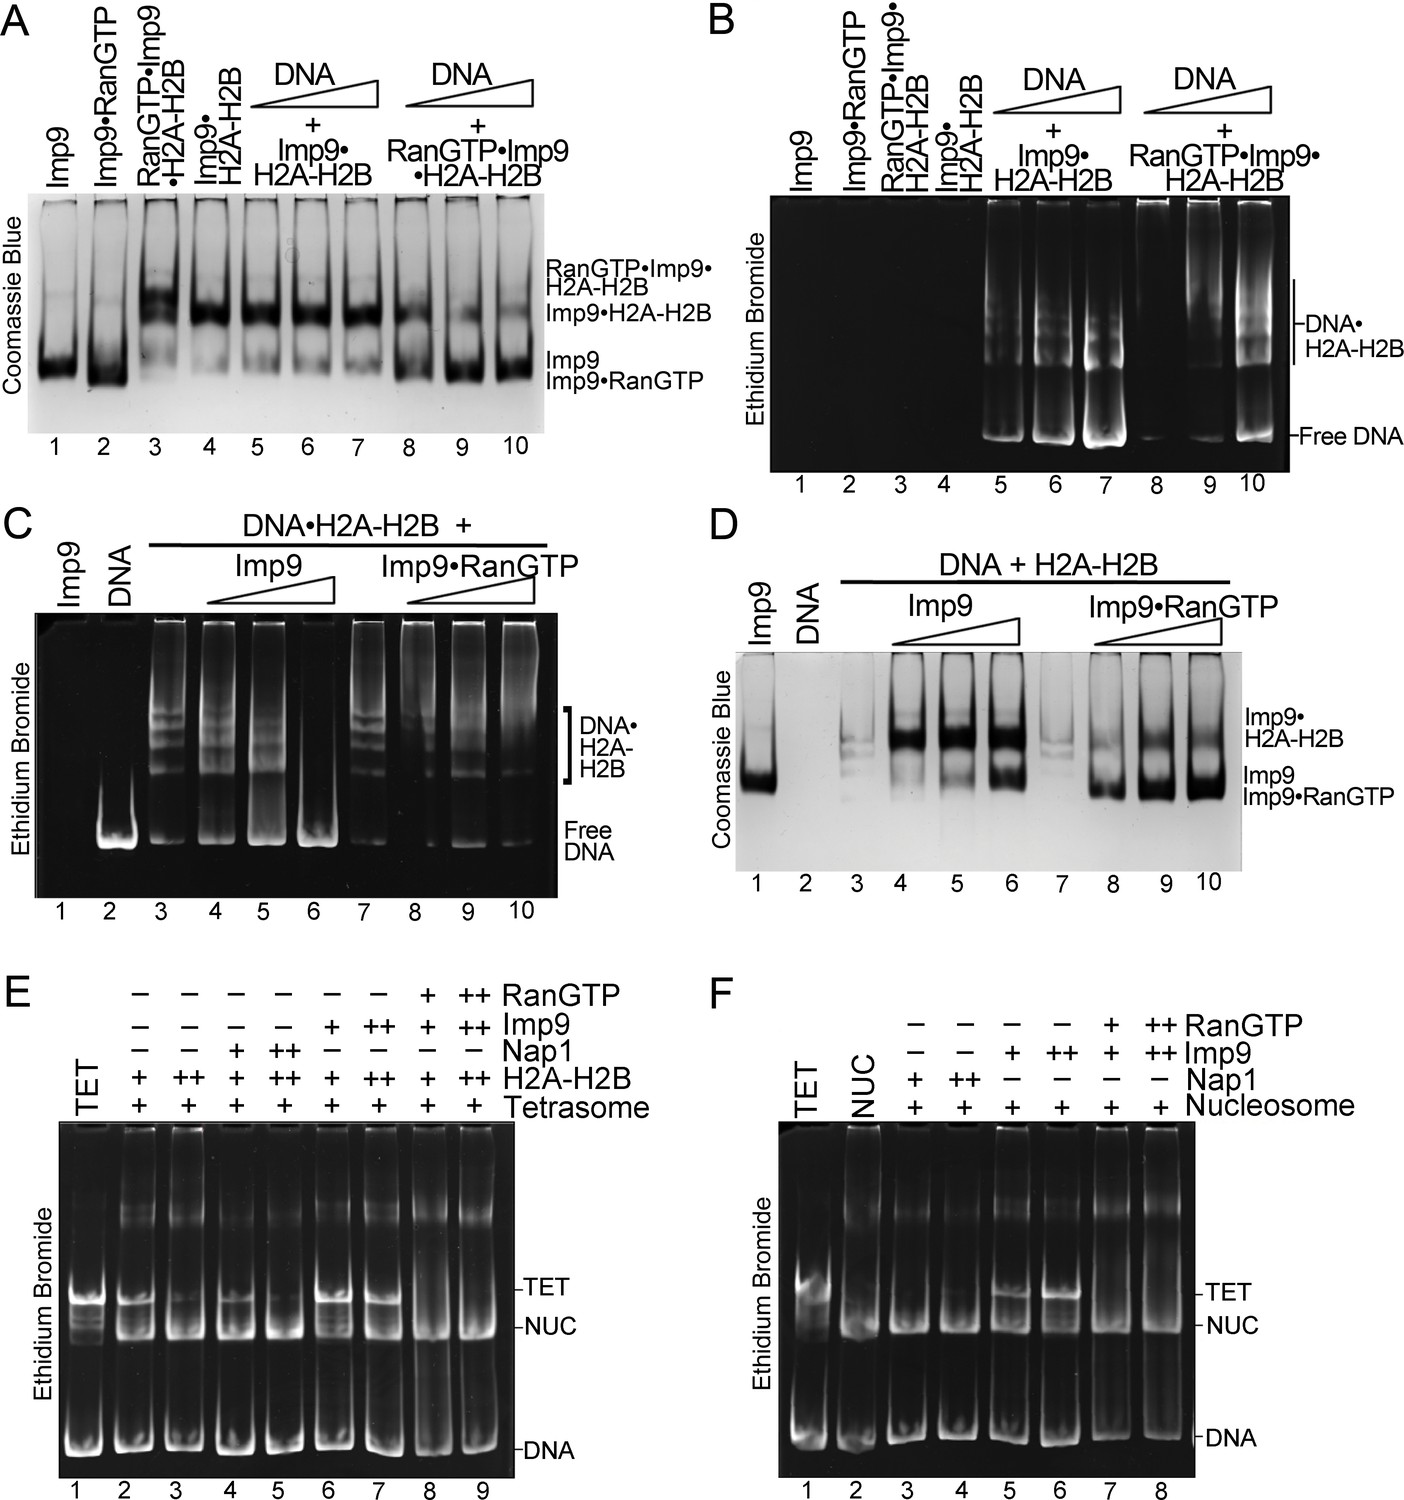
RanGTP modulates Imp9-H2A-H2B interactions for H2A-H2B deposition.
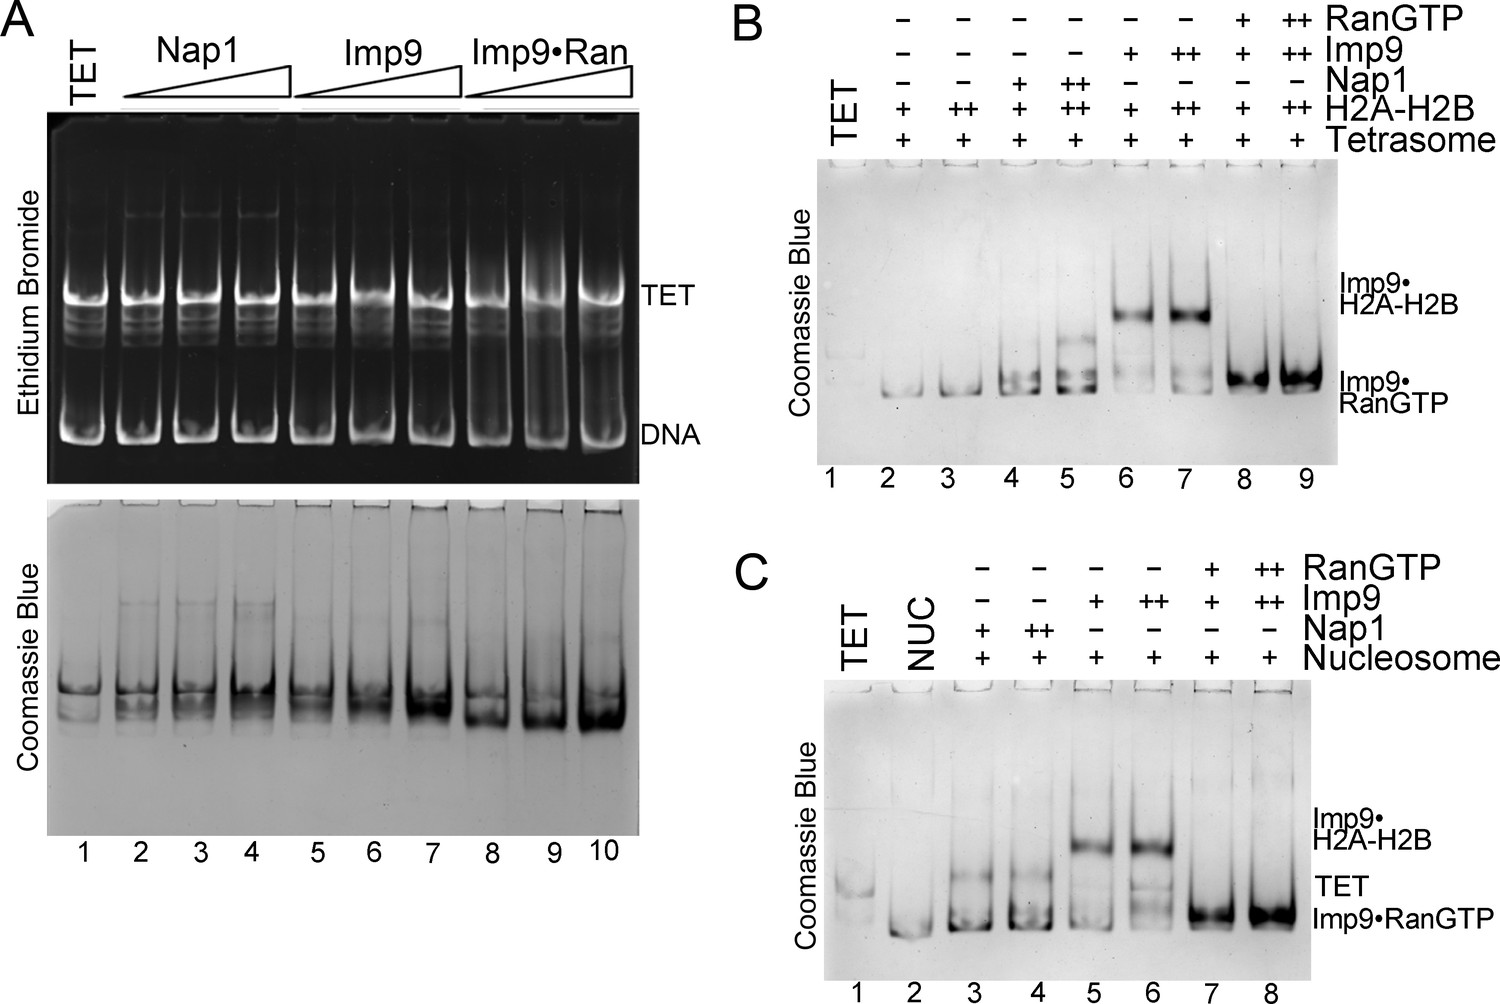
(A, B) DNA is titrated at 0.5, 1 and 2 molar equivalents of preformed Imp9•H2A-H2B (equimolar Imp9 and H2A-H2B mixed together) or RanGTP•Imp9•H2A-H2B (equimolar Imp9, H2A-H2B and RanGTP added together). Images of the same native gel, Coomassie stained in (A) and ethidium bromide stained in (B), are aligned for comparison. DNA cannot compete for H2A-H2B from the Imp9•H2A-H2B, leaving free DNA (B, increasing amounts from lanes 5 to 7) and intact Imp9•H2A-H2B (A, lanes 5–7). In contrast, DNA can compete for H2A-H2B from RanGTP•Imp9•H2A-H2B resulting in Imp9•RanGTP complexes (A, lanes 8–10), DNA•H2A-H2B complexes and very little free DNA (B, lanes 8–10). (C, D) Imp9 or Imp9•RanGTP (equimolar Imp9 and RanGTP added together) is titrated at 0.5–1.5 molar equivalents of H2A-H2B (in a DNA•H2A-H2B 1:7 complex). Images of the same native gel, ethidium bromide stained in (C) and Coomassie stained in (D), are aligned for comparison. Imp9 releases free DNA from DNA•H2A-H2B (C, lanes 3–6) and binds histones to form an Imp9•H2A-H2B complex (D, lanes 4–6). By comparison, Imp9•RanGTP releases little free DNA from DNA•H2A-H2B (C, lanes 7–10). (E) The presence of RanGTP and Imp9 facilitates H2A-H2B deposition onto the nucleosome. Nucleosome assembly assay where either H2A-H2B, Nap1•H2A-H2B, Imp9•H2A-H2B or RanGTP•Imp9•H2A-H2B is titrated in molar equivalents of 0.5 and 0.75 to tetrasome (TET; 2.5 µM). Nap1 and Imp9•RanGTP can form nucleosomes (NUC) while Imp9 cannot. Coomassie staining in Figure 5—figure supplement 1B. (F) Nucleosome disassembly assay where either Nap1, Imp9 or Imp9•Ran is titrated in molar equivalents of 0.5 and 0.75 to constant nucleosome (NUC; 2.5 µM). Imp9 can disassemble nucleosomes to tetrasomes while Nap1 and Imp9-Ran cannot. Coomassie staining in Figure 5—figure supplement 1C.
Figure 5—figure supplement 1
RanGTP modulates Imp9-histones interaction for H2A-H2B deposition.
(A) Controls for nucleosome assembly assay where either Nap1, Imp9 or Imp9•RanGTP is titrated in molar equivalents of 0.25, 0.5 and 0.75 to tetrasome (TET; 2.5 µM). These proteins do not alter the tetrasome. (B) Nucleosome assembly assay where either H2A-H2B, Nap1•H2A-H2B, Imp9•H2A-H2B or RanGTP•Imp9•H2A-H2B is titrated in molar equivalents of 0.5 and 0.75 to tetrasome (TET; 2.5 µM). Nap1 and Imp9•RanGTP can form nucleosomes (NUC) while Imp9 cannot. Gels are Coomassie stained (ethidium bromide stained gels are shown in Figure 5E). (C) Nucleosome disassembly assay where either Nap1, Imp9 or Imp9•RanGTP is titrated in molar equivalents of 0.5 and 0.75 to constant nucleosome (NUC; 2.5 µM). Imp9 can disassemble nucleosomes to tetrasomes while Nap1 and Imp9-RanGTP cannot. Gels are Coomassie stained (ethidium bromide stained gels are shown in Figure 5F).
Author response image 1
SEC for SAXS sample prepation.
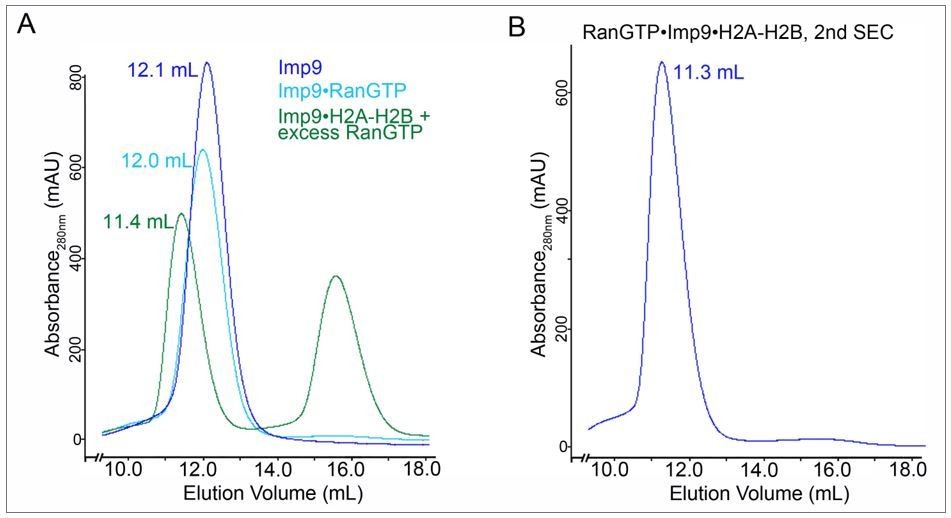
A. SEC profiles of 1) Imp9 alone (blue trace), 2) a previously purified Imp9•RanGTP complex (light blue trace) and 3) a previously purified Imp9•H2A-H2B + excess RanGTP (green; the peak at ~ 16 ml is excess RanGTP). Elution volume for each of the Imp9-containing peaks is listed. B. Fractions for the Imp9 containing peak in the SEC of Imp9•H2A-H2B + excess RanGTP (green trace in A) were pooled and subjected to a second round of SEC to produce the SAXS sample for the heterotetrameric complex.
Tables
Table 1
Imp9-H2A-H2B binding affinities by Isothermal Titration Calorimetry.
https://doi.org/10.7554/eLife.43630.007| Binding species | KD(nM)* | ΔH (kCal/mol) | ΔS (Cal/mol.K) | ΔG (kCal/mol) | Imp9 concentration correction factor |
|---|---|---|---|---|---|
| Imp9 + H2A-H2B | 30 [10, 70]† | −10.2 [−10.6, -9.8]‡ | −0.6 | −10.0 | 0.90 [0.88, 0.92]§ 0.90 [0.87, 0.93] 0.90 [0.88, 0.92] |
| Imp9 + H2AΔTail¶ -H2B | 40 [20, 60] | −11.9 [−12.4,–11.5] | −6.7 | −10.0 | 0.83 [0.81,0.84] 0.86 [0.84,0.88] 0.85 [0.83,0.86] |
| Imp9 + H2A-H2BΔ(1-35) | 40 [10, 110] | −12.5 [−13.2,–11.9] | −8.5 | −10.0 | 0.87 [0.82, 0.91] 0.89 [0.86, 0.91] 0.87 [0.83, 0.91] |
| Imp9 + H2AΔTail-H2BΔTail†† | 40 [10, 100] | −11.7 [−12.2,–11.2] | −5.9 | −9.9 | 1.0 [0.98, 1.03] 0.97 [0.92, 1.01] 0.92 [0.88, 0.96] |
| Imp9ΔH8loop + H2A-H2B | 10 [1, 20] | −10.1 [−10.4,–9.9] | 2.4 | −10.8 | 0.97 [0.96, 0.99] 1.06 [1.05, 1.07] 0.99 [0.98, 1.00] |
| Imp9ΔH18-H19loop + H2A-H2B | 450 [350, 600] | 7.9 [7.6, 8.3] | 56 | −8.5 | 1.12 [1.1, 1.2] 1.16 [1.12, 1.2] 1.15 [1.11, 1.19] |
| Imp9ΔH19loop + H2A-H2B | 40 [10, 100] | −11.0 [−11.4,–10.5] | −3.5 | −9.9 | 0.99 [0.98,1.02] 1.00 [0.98,1.03] 1.00 [0.97,1.04] |
-
* The KD value corresponds to a best-fit value obtained from global analysis of each experimental set carried out in triplicate.
† The 68.3% confidence interval for KD determined by global fit analysis of the triplicates in each experimental set.
-
‡ The 68.3% confidence interval for ΔH determined by global fit analysis of the triplicates in each experimental set.
§ The 68.3% confidence interval for concentration correction factor of Imp9 is determined by local fit analysis of each individual experiment in an experimental set of triplicates.
-
¶ H2AΔTail – globular domain of H2A (residues 14–119).
†† H2AΔTail-H2BΔTail - heterodimer of residues 14–119 of H2A with residues 25–123 of H2B.
-
The following supplement is available for Table 1:Figure 1—figure supplement 1
Additional files
-
Transparent reporting form
- https://doi.org/10.7554/eLife.43630.024
Download links
A two-part list of links to download the article, or parts of the article, in various formats.
Downloads (link to download the article as PDF)
Open citations (links to open the citations from this article in various online reference manager services)
Cite this article (links to download the citations from this article in formats compatible with various reference manager tools)
Importin-9 wraps around the H2A-H2B core to act as nuclear importer and histone chaperone
eLife 8:e43630.
https://doi.org/10.7554/eLife.43630


