Single cell, super-resolution imaging reveals an acid pH-dependent conformational switch in SsrB regulates SPI-2
- National University of Singapore, Singapore
- University of Texas Medical Branch, United States
Figures
Figure 1
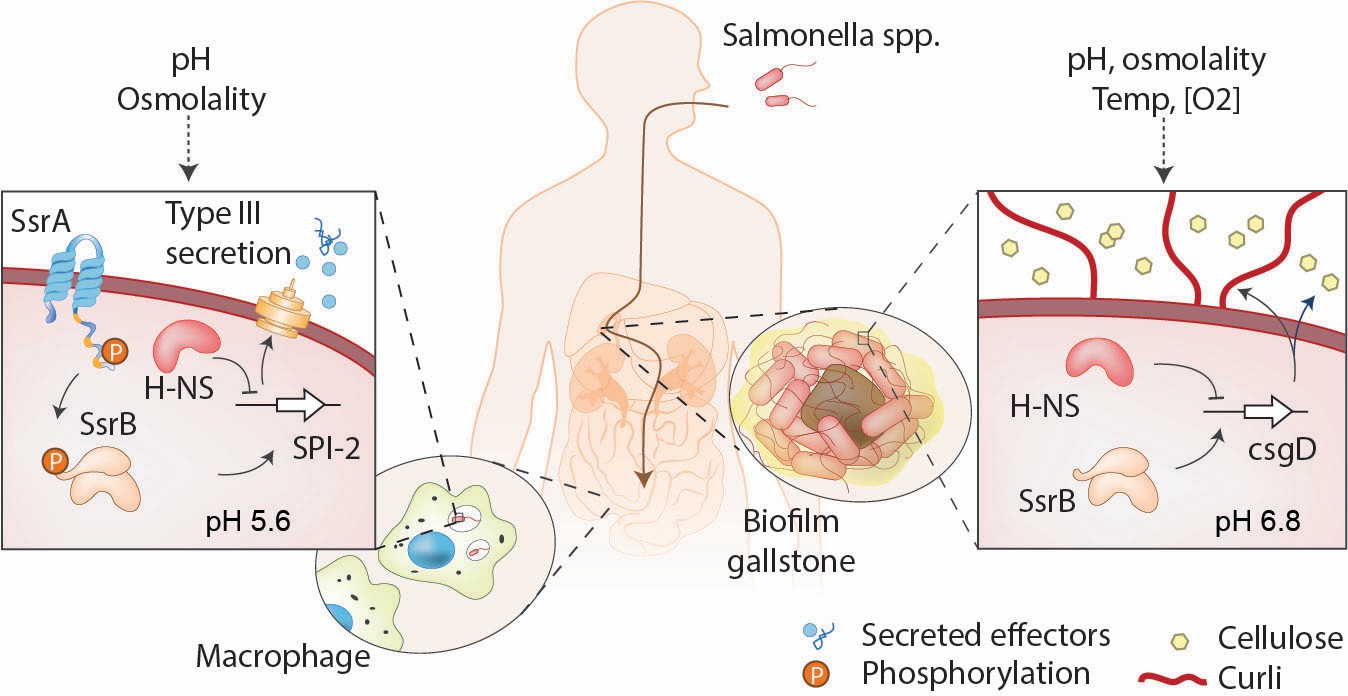
SsrB is a lifestyle switch that can function non-canonically.
Left: When Salmonella resides in an acidic compartment such as the macrophage vacuole, its cytoplasm acidifies to pH 5.6 through the action of EnvZ/OmpR (Chakraborty et al., 2015; Chakraborty et al., 2017). In response to acidification, the number of molecules of SsrA and SsrB increases, as does SsrB binding to DNA (this work). SsrB~P functions to de-repress H-NS at SPI-2 (Walthers et al., 2011) and to activate SPI-2 transcription (Feng et al., 2004). Right: At neutral pH (pHi = 6.8), the SsrA kinase is nearly absent, and unphosphorylated SsrB de-represses H-NS at the csgD promoter, the master regulator of biofilms, driving biofilm expression (Desai et al., 2016). This promotes the carrier state, as Salmonella forms biofilms on gallstones in the gall bladder.
Figure 2

SsrB- and SsrA-PAmCherry fusions induce SPI-2 promoter activation in response to acid pH.
(A) The ssrA/B gene structure. OmpR binds upstream of ssrA, PhoP binds upstream of ssrB. The transcription start sites are noted by the bent arrows and the untranslated regions are denoted by the cross-hatchings. See Feng et al. (2003) for more details. (B) The ability of N-terminal fusions of SsrB linked via a 4XGGSG or 10XGGSG linker to PAmCherry (PAmCherry-4-SsrB and PAmCherry-10-SsrB) or C-terminal fusions (SsrB-4-PAmCherry and SsrB-10-PAmCherry) to activate transcription of a SPI-2-linked promoter PsseI-lacZ, was measured by a β-galactosidase assay. Both N-terminal SsrB fusions activated sseI transcription, indicating that the N-terminal fusions were functionally active. In contrast, the activity of SsrB C-terminal fusions was similar to a ΔssrB strain, indicating that they were not functionally active. (C) A C-terminal fusion of SsrA linked via a 10XGGSG linker to PAmCherry (SsrA-10-PAmCherry) had higher activation of sseI-lacZ compared to the wild-type, but showed a similar fold induction between acid and neutral pH (3.4-fold and 5-fold). Error bars represent standard deviations obtained from three, independent experiments, each measurement was in triplicate.
-
Figure 2—source data 1
- https://doi.org/10.7554/eLife.45311.005
-
Figure 2—source data 2
- https://doi.org/10.7554/eLife.45311.006
Figure 3 with 1 supplement
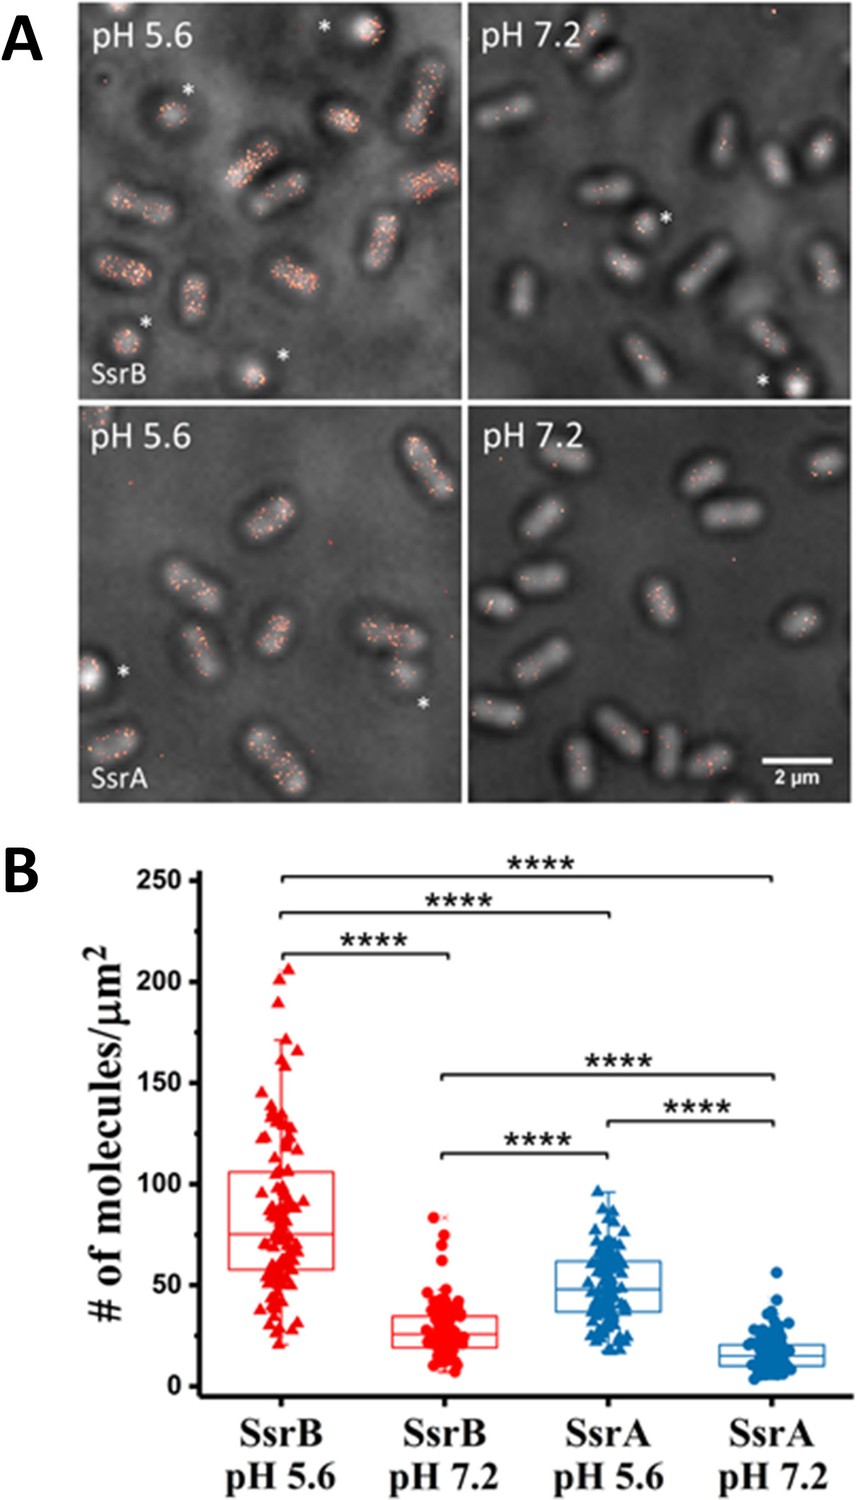
PALM imaging of SsrB and SsrA.
(A) PALM-Brightfield overlay images of PAmCherry-SsrB (top panel) and SsrA-PAmCherry (bottom panel) grown in MgM at acid pH 5.6 or neutral pH 7.2. Asterisk highlights cells that are oriented axially to the glass coverslip. Scale bar = 2 µm. (B) Boxplot quantification of the number of SsrB (red) and SsrA (blue) molecules in individual cells. SsrB and SsrA PAmCherry levels were 3-fold higher during acid pH induction (triangles) compared to neutral pH (circles). The number of molecules/µm2 was calculated by normalizing the total number of localizations within individual cells to its corresponding cell area (µm2). Results were combined from two, independent experiments. The total number of cells analyzed for SsrB at pH 5.6 = 120, SsrB at pH 7.2 = 92, SsrA at pH 5.6 = 117 and SsrA at pH 7.2 = 125. Statistical significance was determined by a two-tailed t-test (unpaired, unequal variances) using Microsoft Excel. **** Denotes p<0.0001.
-
Figure 3—source data 1
- https://doi.org/10.7554/eLife.45311.009
Figure 3—figure supplement 1
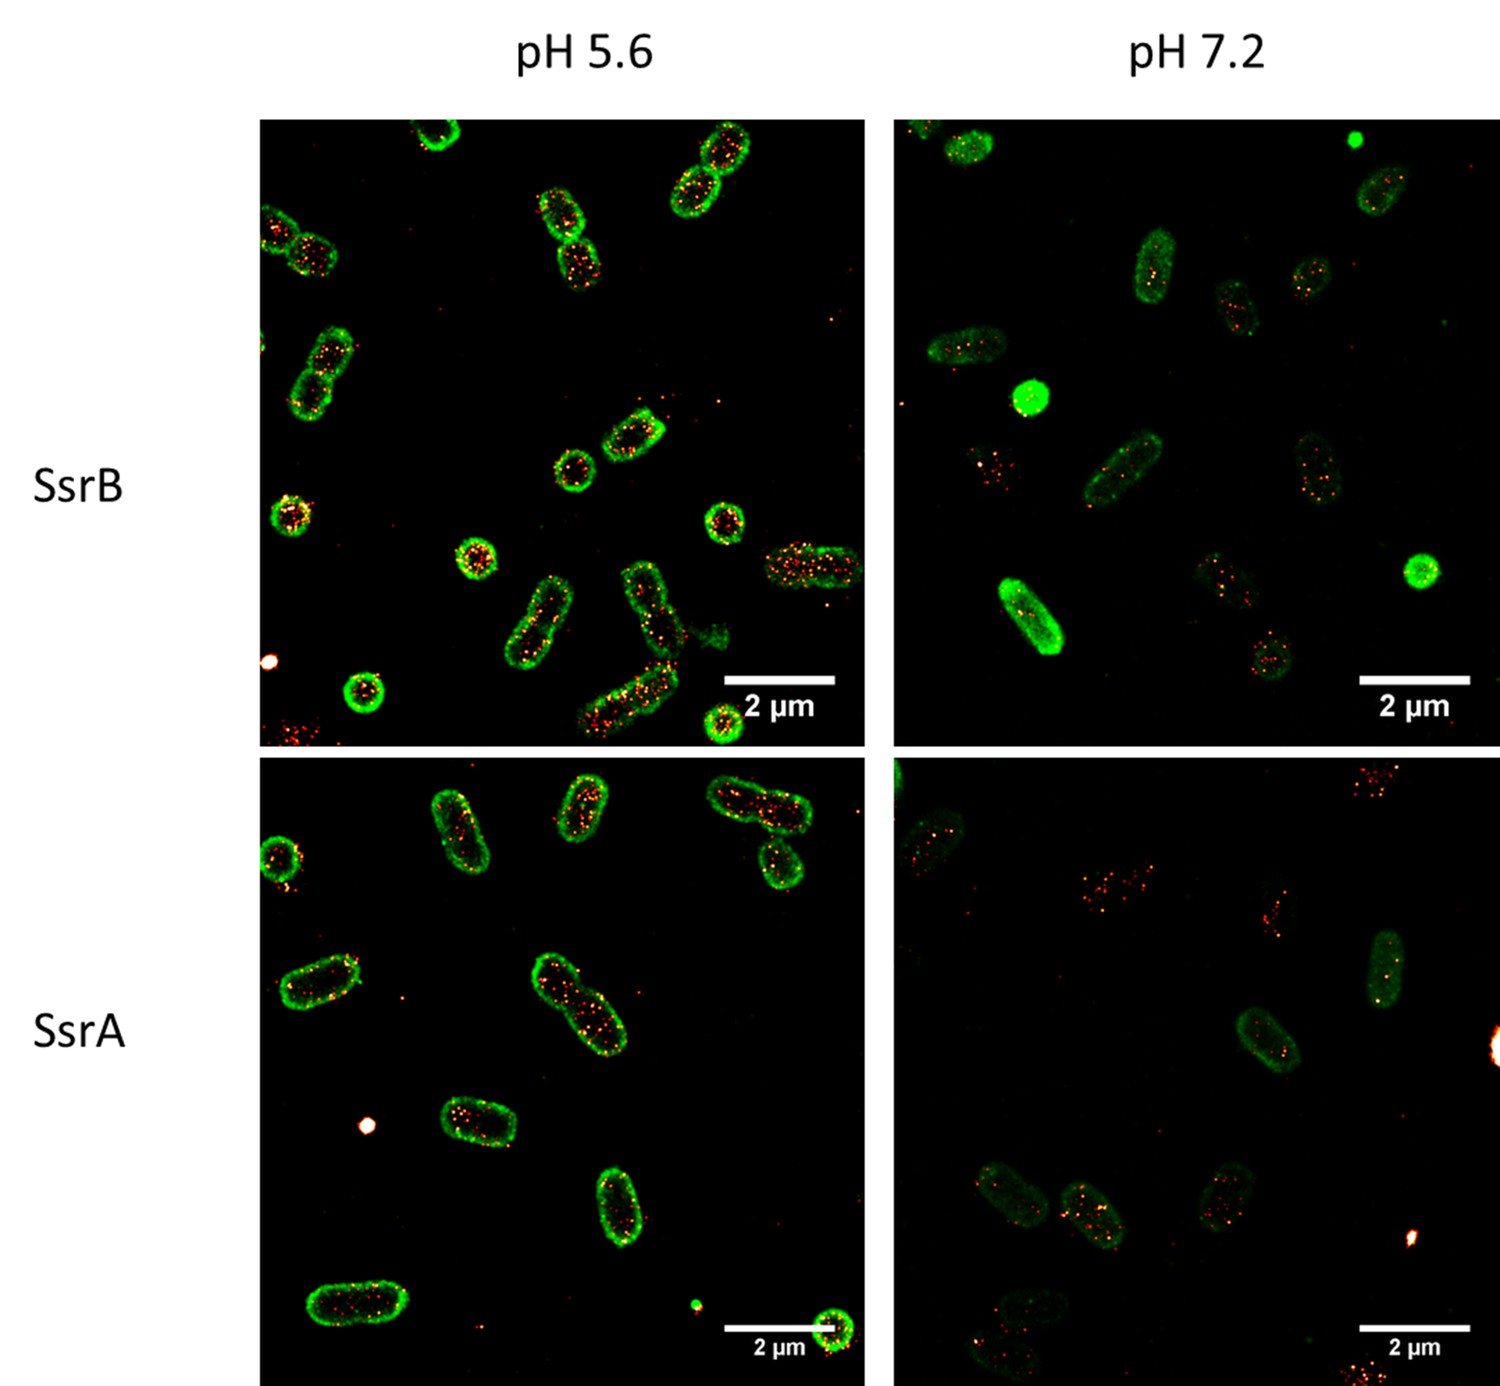
Two color, PALM-PAINT imaging of PAmCherry-SsrB (top panel) and SsrA–PAmCherry fusions (bottom panels) in red and cell membranes labeled with Nile red (green) grown in acid-inducing (left panels) or neutral pH conditions (right panels).
Nile red staining is more heterogeneous at neutral pH. Scale bar = 2 μm.
Figure 4 with 5 supplements
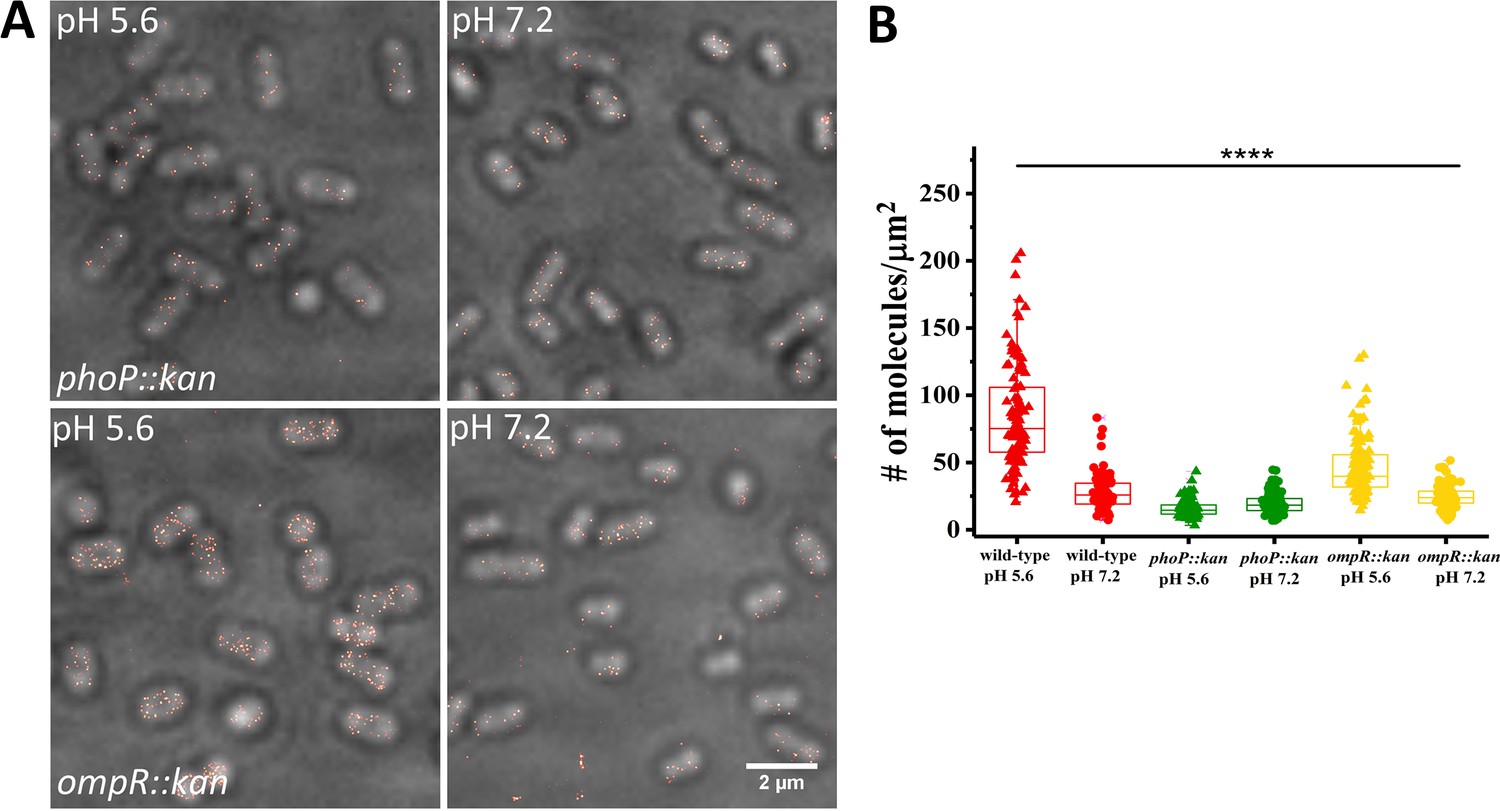
SsrB levels are reduced in ompR and phoP null strains.
(A) PALM-Brightfield overlay images of cells expressing PAmCherry-SsrB in phoP::kan (top) or ompR::kan (bottom) strains. Cells were grown in MgM media in acid (pH 5.6) and neutral pH (pH 7.2). Scale bar is 2 µm. (B) Boxplot showing quantification of the number of PAmCherry-SsrB molecules in the phoP::kan and ompR::kan mutants when grown in acid pH or neutral pH. The # molecules/µm2 was calculated by normalizing the total number of localizations within individual cells to its corresponding cell area (µm2). Results were combined from two, independent experiments. The total number of cells analyzed for wild-type at pH 5.6 = 120, at pH 7.2 = 92, phoP::kan at pH 5.6 = 131, at pH 7.2 = 140, ompR::kan at pH 5.6 = 131, at pH 7.2 = 117 cells. To determine the background level, we imaged an ssrB null strain lacking PAmCherry. The average localization counts for the strain lacking PAmCherry was four localizations/μm2 (n = 66 cells), while there were 16 localizations/μm2 in the PAmCherry-SsrB phoP::kan strain. Thus, SsrB is detectible above the background. Statistical significance was determined by a two-tailed t-test (unpaired, unequal variances) using Microsoft Excel. The line above the bar graph indicates statistical significance between pairwise group comparisons of all groups. **** Denotes p<0.0001.
-
Figure 4—source data 1
- https://doi.org/10.7554/eLife.45311.019
-
Figure 4—source data 2
- https://doi.org/10.7554/eLife.45311.020
-
Figure 4—source data 3
- https://doi.org/10.7554/eLife.45311.021
Figure 4—figure supplement 1

Determining the background counts in an ssrB null strain in the absence of PAmCherry.
The average localization counts for the strain lacking PAmCherry was four localizations/μm2 (n = 66 cells). The number of localizations in the PAmCherry-SsrB phoP::kan strain was 16/μm2 (Figure 4). Thus, it is apparent that we can detect SsrB molecules in the phoP null background. It is worth noting that it was difficult to image the strain, as the extremely low levels of fluorescence made it especially difficult to identify the correct imaging plane. Thus, some of the background signals might be coming from the coverglass itself.
Figure 4—figure supplement 2
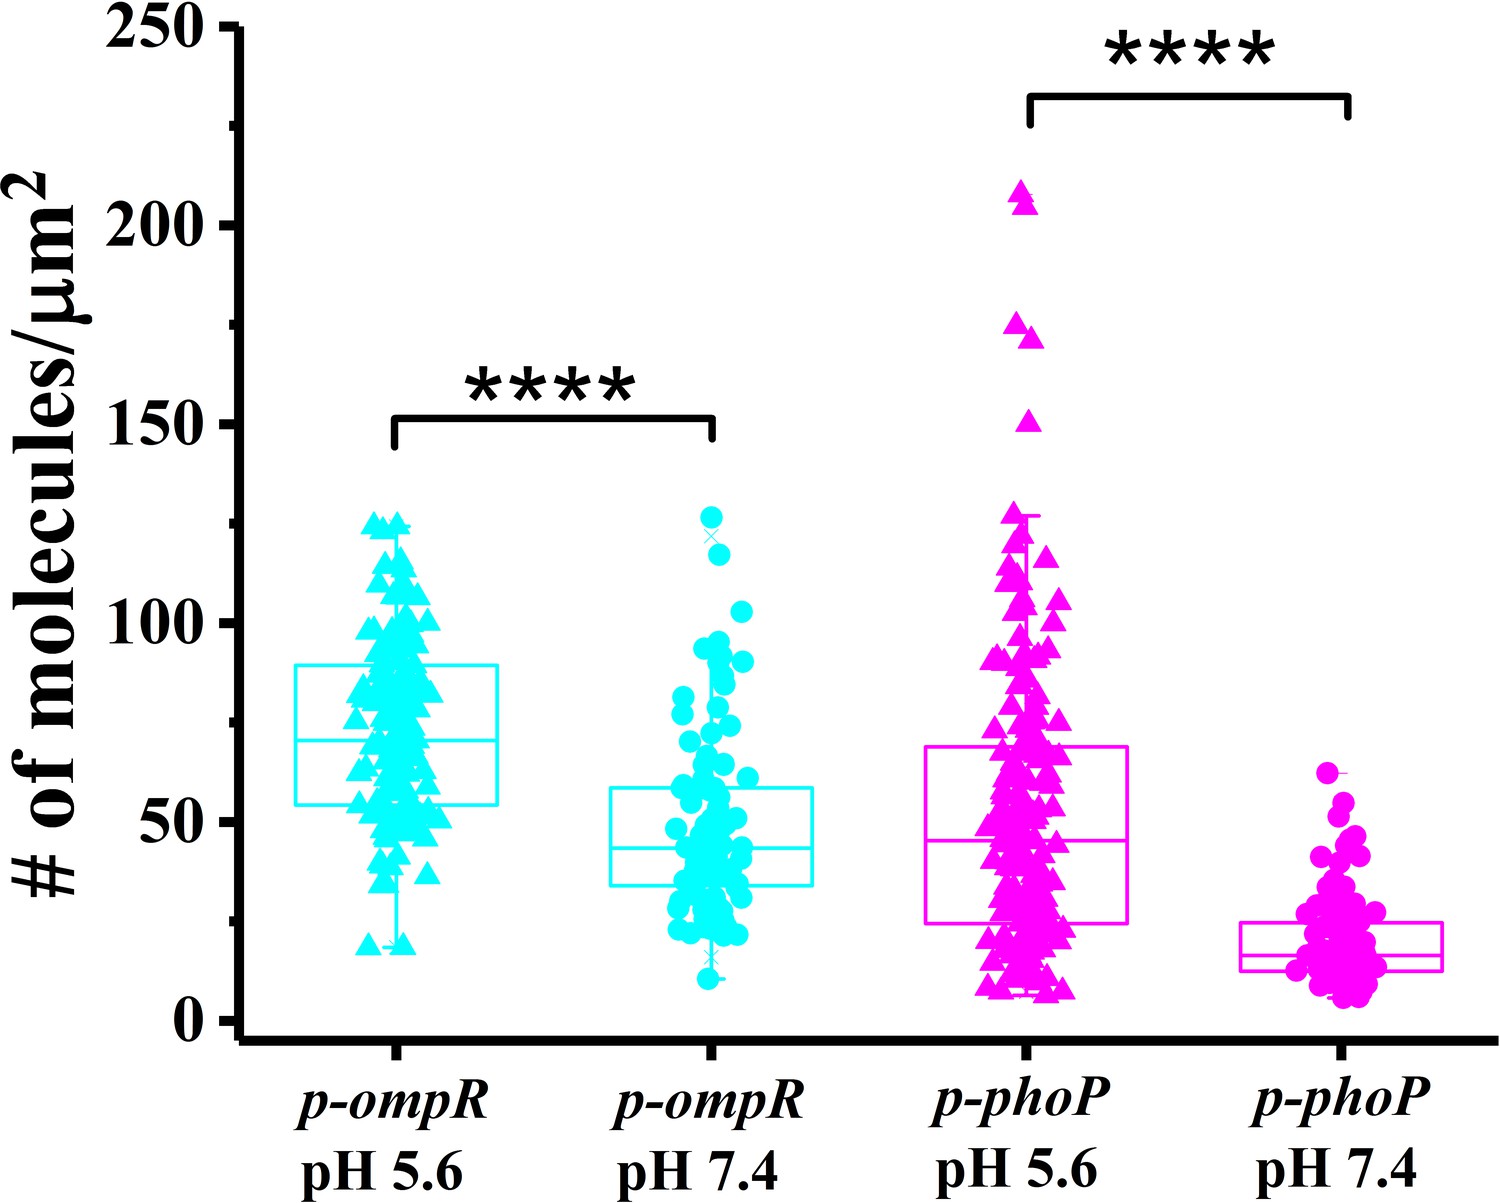
The ompR::kan and phoP::kan mutant strains were complemented by the expression of OmpR and PhoP from p-ompR and p-phoP plasmids in trans.
A boxplot shows the quantification of the number of PAmCherry-SsrB molecules in the p-ompR and p-phoP complemented strains when grown in acid pH or neutral pH. The # molecules/µm2 was calculated by normalizing the total number of localizations within individual cells to its corresponding cell area (µm2). Results were combined from two, independent experiments. The total number of cells analyzed for p-phoP at pH 5.6 = 188, at pH 7.2 = 109, p-ompR at pH 5.6 = 144, at pH 7.2 = 101 cells. Statistical significance was determined by a two-tailed t-test (unpaired, unequal variances) using Microsoft Excel. **** Denotes p<0.0001.
-
Figure 4—figure supplement 2—source data 1
- https://doi.org/10.7554/eLife.45311.013
Figure 4—figure supplement 3
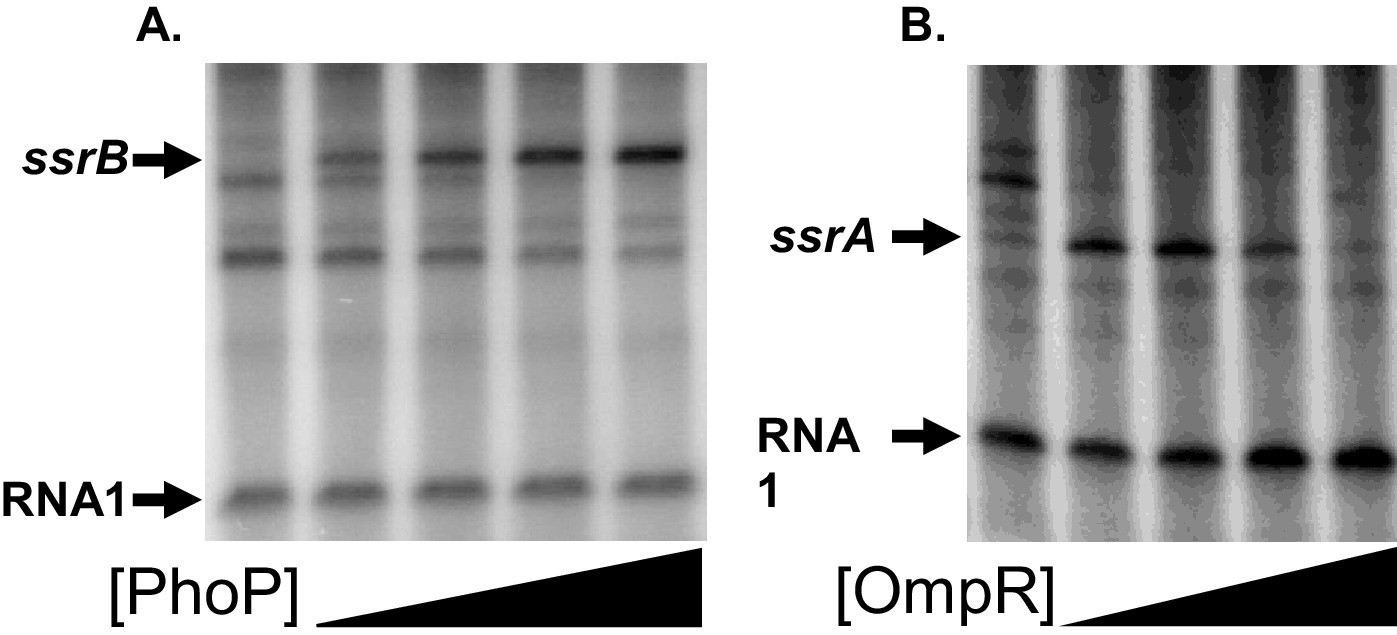
Transcription of the ssrA and ssrB promoters is directly coupled to the PhoQ/PhoP and EnvZ/OmpR signaling pathways, respectively.
In contrast to many two-component systems, transcription of ssrA and ssrB is uncoupled and differentially regulated. In vitro transcription assays using supercoiled ssrB (A) and ssrA (B) templates and phosphorylated PhoP~P and OmpR~P, respectively, were employed to confirm previous genetic and biochemical evidence suggesting a direct role for each regulator in activation of transcription. The activator-specific ssrB or ssrA transcripts and 110 nt RNA1 control are indicated by arrows. From left to right in 2-fold increments, reactions contained from 12.5 to 200 nM PhoP~P or OmpR~P. The levels of phosphoprotein for PhoP and OmpR and were 70% and 90%, respectively under the reaction conditions used. In the absence of phosphorylation, neither protein was able to activate transcription of its respective target promoter.
-
Figure 4—figure supplement 3—source data 1
- https://doi.org/10.7554/eLife.45311.015
Figure 4—figure supplement 4
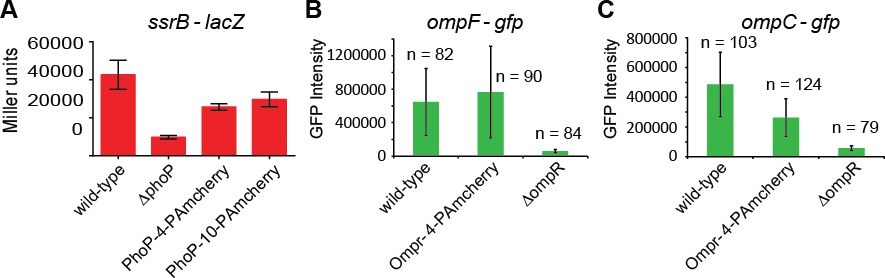
(A) Wild type, ΔphoP, PhoP-PAmCherry and PhoP-PAmCherry strains containing PssrB-lacZ were grown in acid MgM media and assayed for β-galactosidase activity. The mean and standard deviations from two independent experiments was plotted, n = 3. (B) Wild type, ΔompR and OmpR-PAmCherry strains containing (PompF-gfp) were grown in low osmolality A media and imaged under a wide-field microscope for GFP intensity. (C) Wild type, ΔompR and OmpR-PAmCherry strains containing (PompC-gfp) were grown at high osmolality in A media supplemented with 15% sucrose and imaged under a wide-field microscope for GFP intensity in each cell. The mean and standard deviations were obtained from individual bacterial cells and the n is listed above the column.
-
Figure 4—figure supplement 4—source data 1
- https://doi.org/10.7554/eLife.45311.017
Figure 4—figure supplement 5
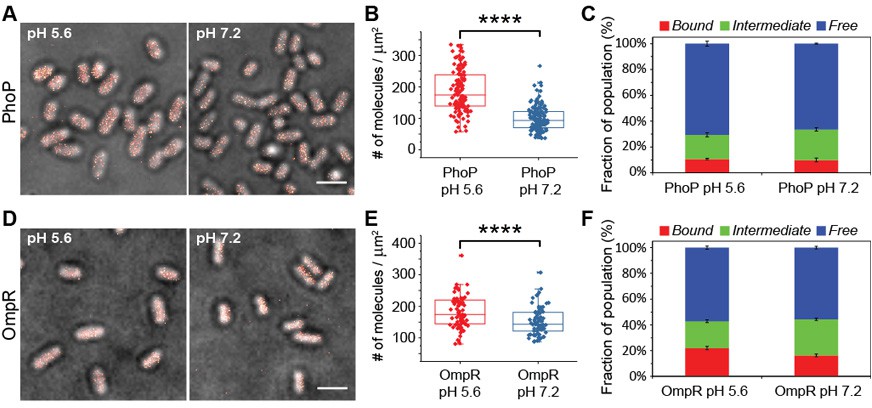
DNA binding by PhoP or OmpR is not acid-sensitive.
(A) PALM-Brightfield overlay images of PhoP-PAmCherry grown in MgM media at acid pH (left panel) or neutral pH (right panel). Scale bar = 2 µm. (B) Boxplot shows the quantification of the number of PhoP molecules in individual cells. The number of molecules/µm2 was calculated by normalizing the total number of localizations within individual cells to its corresponding cell area (µm2). The total number of cells analyzed for PhoP-PAmCherry at pH 5.6 = 122, at pH 7.2 = 140 cells. Statistical analysis was performed by using an unpaired two-tailed t-test (Microsoft Excel). **** Denotes p<0.0001. (C) The fraction of bound and free PhoP-PAmCherry molecules obtained from Spt-PALM during growth in MgM media at acid or neutral pH. The bound fraction (F1) does not change significantly in the two different growth conditions. (D) PALM-Brightfield overlay images of OmpR-PAmCherry when grown in MgM media in acid pH (left panel) or neutral pH (right panel). Scale bar = 2 µm. (E) Boxplot quantifies the number of OmpR molecules in individual cells. The total number of cells analyzed for OmpR-PAmCherry at pH 5.6 = 75, at pH 7.2 = 75 cells. Statistical analysis was performed by using an unpaired two-tailed t-test (Microsoft Excel). **** Denotes p<0.0001. (F) The fraction of bound and free OmpR-PAmCherry molecules obtained from Spt-PALM during growth in MgM media in acid or neutral pH. The bound fraction (F1) was higher in acid (21.9 ± 1.4) compared to neutral pH (16.4 ± 1.0), indicating a 5% increase in the number of OmpR molecules bound to DNA in acid pH.
Figure 5
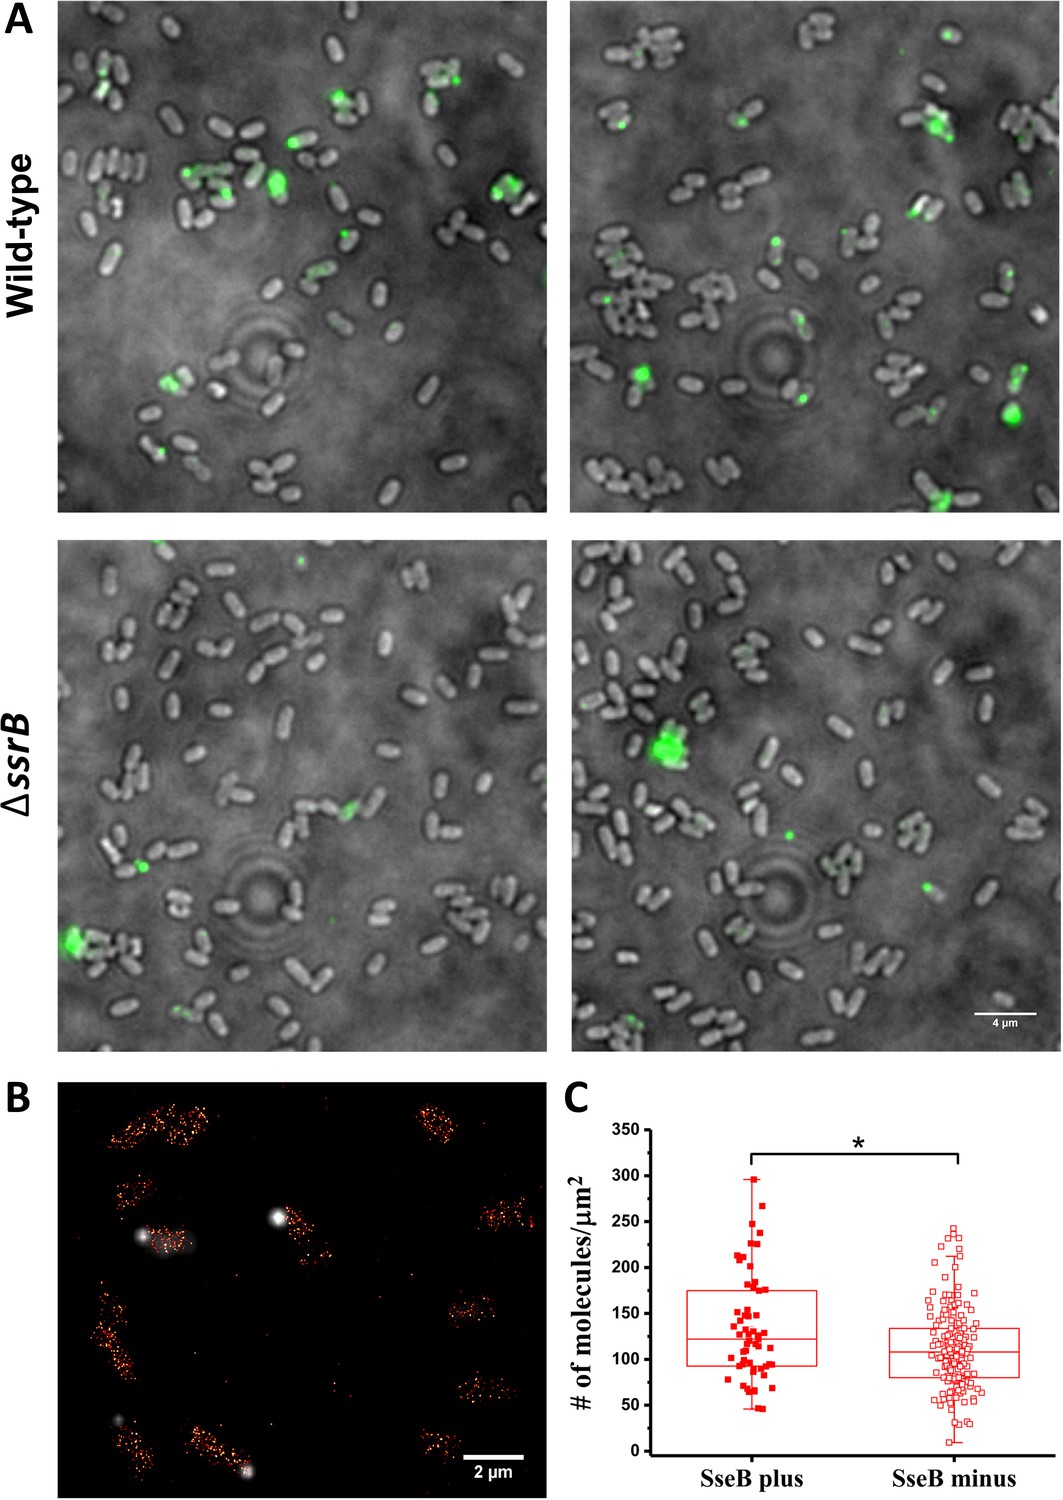
SsrB variation in vitro does not affect the appearance of SseB translocons on the cell surface.
(A) SseB production requires SsrB. Immunofluorescence using rabbit anti-SseB antibody (green) of wild-type (top panels) and ΔssrB cells (lower panels). In the wildtype, 17% of the population possessed injectisomes (of 276 cells examined), but only 5% of ΔssrB cells (277 cells) were stained with SseB antibody. Two different images for each strain are shown. A and B are results combined from two, independent experiments. (B) PALM-SseB immunofluorescence overlay image of PAmCherry-SsrB. Arrows indicate cells that produce SseB on their surface. Scale bar is 2 µm. (C) Boxplot shows quantification of the number of PAmCherry-SsrB molecules in cells containing SseB on their surface (SseB plus) or without (SseB minus) (total = 227 cells). Salmonella was grown in MgM media at acid pH. The # molecules/µm2 was calculated by normalizing the total number of localizations within individual cells to its corresponding cell area (µm2). Results from two, independent experiments were combined. Statistical analysis was performed using an unpaired two-tailed t-test (Microsoft Excel). * Denotes p<0.05.
-
Figure 5—source data 1
- https://doi.org/10.7554/eLife.45311.023
-
Figure 5—source data 2
- https://doi.org/10.7554/eLife.45311.024
Figure 6 with 2 supplements
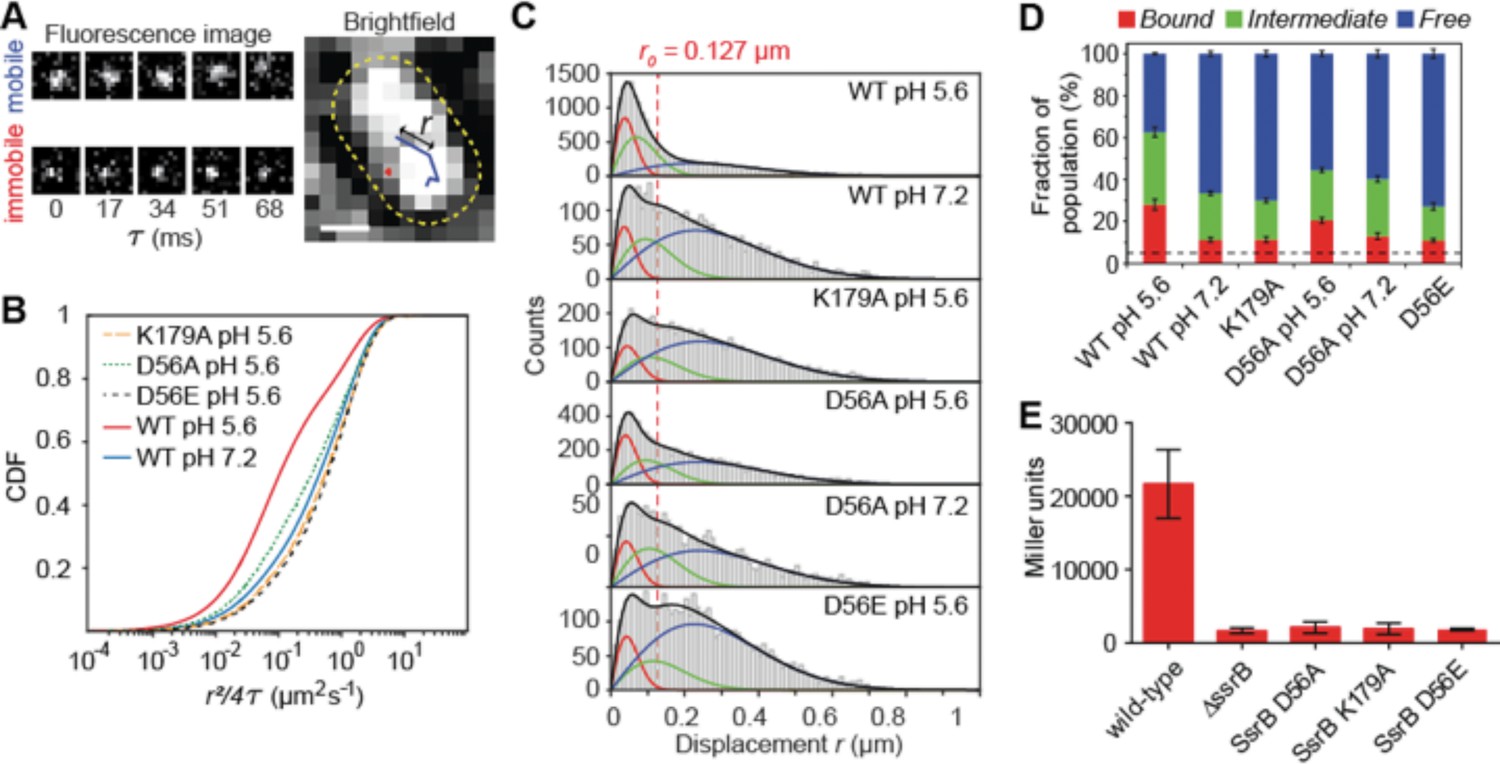
SsrB binding to DNA increases in acid pH.
(A) The left panel contains two representative fluorescence signals of a mobile and immobile molecule. Images were acquired at 17 ms intervals. The right panel contains the tracks of the signals from the left panel. The yellow dotted line is the outline of the bacterial cell obtained from brightfield imaging segmentation. Displacement r is the distance travelled in adjacent frames by a molecule. (B) The values of the displacement r, were plotted as a CDF. The CDF fits of various SsrB mutants and wild-type SsrB grown in different pH are shown. A shift in the curve to the right indicates an increase in D. The fitted values can be found in Table 1. (C) Values obtained from the CDF are represented onto the PDF histogram of r to display the distribution of r values responsible for the corresponding D. The red curve indicates the distribution for D1, the green curve indicates the distribution for D2 and the blue curve indicates the distribution for D3. r values below the red dotted line are threshold values indicative of the bound fraction obtained from fixed cells expressing SsrB (see Table 1 for the number of tracks for each experiment and the number of cells analyzed). The distribution of D2 extends past this threshold, suggesting that D2 is a transient, weaker binding fraction. (D) Values of F1, F2 and F3 of the SsrB mutants. An increase in the values of F1 and F2 for WT grown in pH 5.6 illustrates increased SsrB binding to DNA. The dotted line indicates the basal bound F1 value (5.4%) obtained from PAmCherry alone, which is not bound to DNA. (E) SsrBD56A-, SsrBK179A-, and SsrBD56E-PAmCherry fusions do not activate SPI-2 gene transcription. Wild-type, ΔssrB and strains expressing the corresponding PAmCherry-SsrB fusions containing sseI-lacZ were grown in acid MgM media and β-galactosidase activity was measured. The mean and standard deviations were obtained from two, independent experiments.
-
Figure 6—source data 1
- https://doi.org/10.7554/eLife.45311.029
Figure 6—figure supplement 1
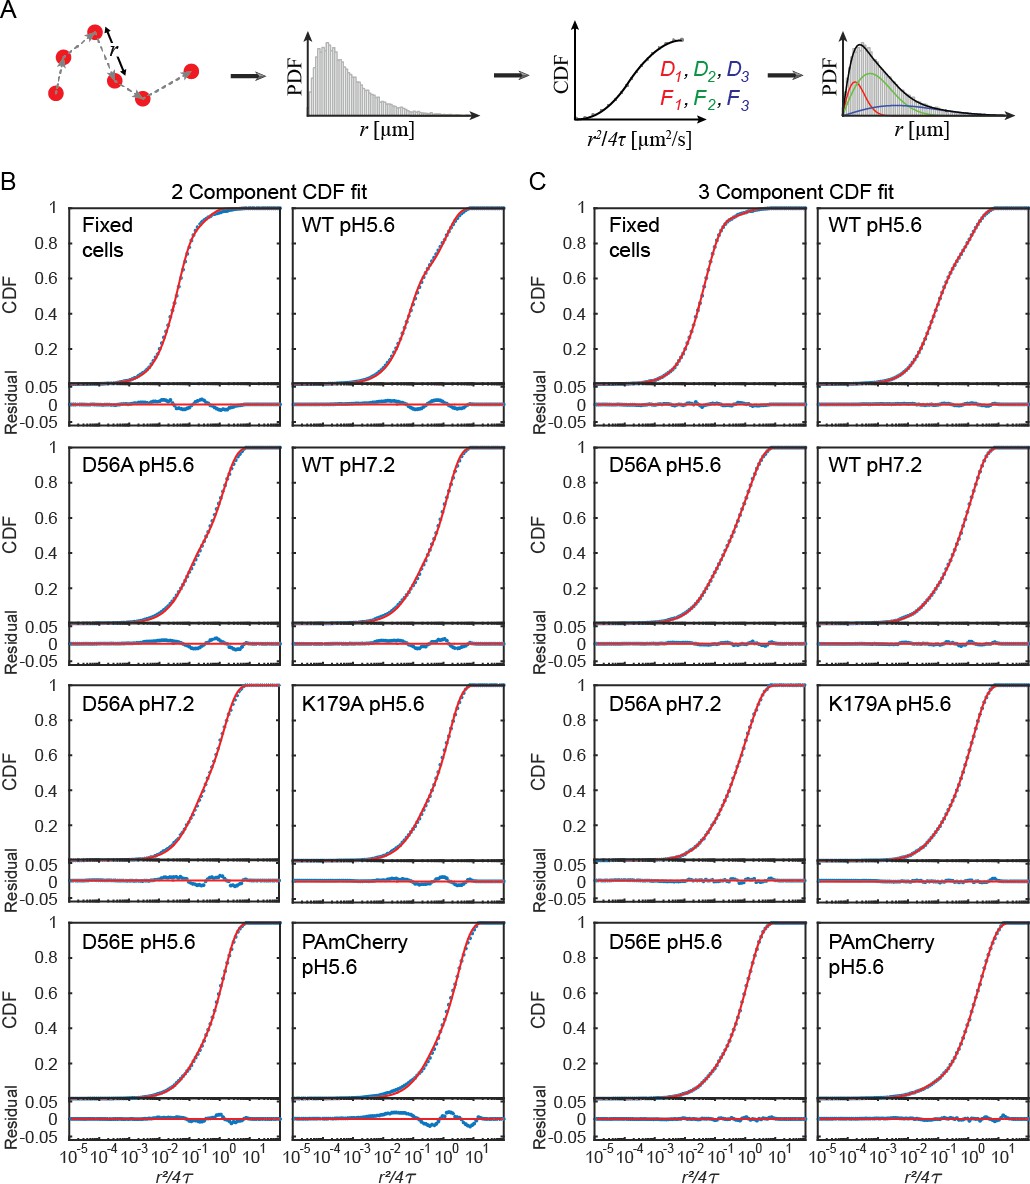
(A) Work flow of Spt-PALM. The distance moved by a molecule in subsequent camera frames, termed displacement r, can be plotted as a probability distribution function (PDF), which contains r from all the tracks obtained. Obtaining the apparent diffusion coefficient D from a fit of the PDF depends on the binning. Thus, the PDF is converted into a cumulative distribution function (CDF) and fitted with Equation 3 (see Materials and methods). The values obtained from the fit are then plotted back into the PDF for presentation. (B) Data fitted with a two-component diffusion model equation vs (C) data fitted with three-component diffusion model (Equation 3). From the residuals of the fits, a three-component diffusion model best fit our data and was used throughout.
Figure 6—figure supplement 2
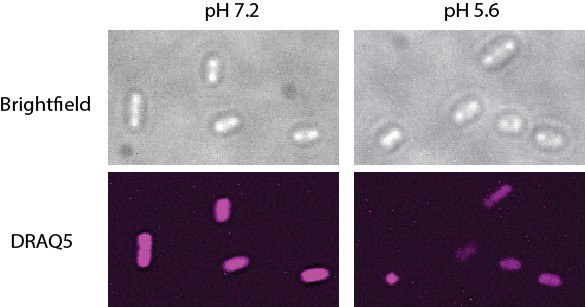
Structured illumination microscopy (SIM) images of Salmonella grown in pH 7.2 and 5.6.
The nucleoids were stained with DRAQ5. The nucleoid area of cells grown at pH 7.2 was 0.62 ± 0.15 µm2, n = 161. At pH 5.6, the nucleoid area was 0.50 ± 0.22 µm2, n = 182 (a ratio of 0.81). The intensity of the DRAQ5 signal in cells grown at pH 7.2 was 80553 ± 25446, while at pH 5.6 it was 66410 ± 20727 (ratio of 0.82).
-
Figure 6—figure supplement 2—source data 1
- https://doi.org/10.7554/eLife.45311.028
Figure 7
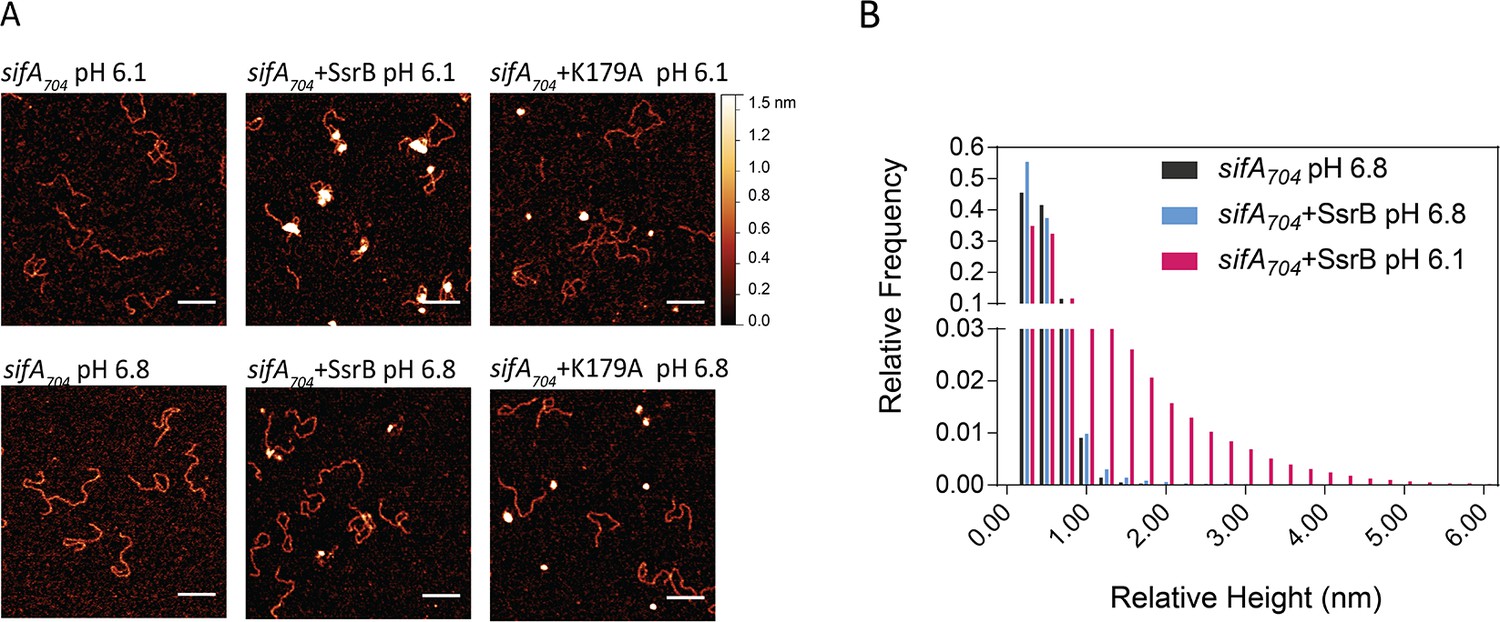
SsrB binding to DNA is increased in acid pH.
(A) AFM image of sifA704 DNA in the absence of SsrB, or in the presence of 30 nM SsrB or 30 nM SsrBK179A at pH 6.8 (lower panels) and pH 6.1 (upper panels). The AFM images of sifA704 DNA were identical at pH 6.8 and pH 6.1 (left panels). When 30 nM SsrB was added, binding and bending of DNA was apparent in a minor percentage of the population at pH 6.8, whereas binding and DNA condensation was significantly increased at pH 6.1. The pH values were selected based on the previously measured pH values in response to acid stress (Chakraborty et al., 2017). The K179A mutant did not bind to DNA (Carroll et al., 2009). Scale bar, 100 nm. (B) A relative height distribution histogram of the sifA704 promoter complexed with 30 nM SsrB at pH 6.8 (blue bars) compared to pH 6.1 (red bars). The apparent height of naked DNA peaks at ~0.5 nm (black columns), while above 1 nm, the probability of the height decreases to near zero (Gao et al., 2017). Therefore, the height detected at above 1 nm corresponds to SsrB binding. SsrB shows an extended height distribution at pH 6.1 (up to 5 nm), reflecting its enhanced ability to bind, bend, and condense DNA at acid pH (Desai et al., 2016).
-
Figure 7—source data 1
- https://doi.org/10.7554/eLife.45311.031
Figure 8 with 2 supplements
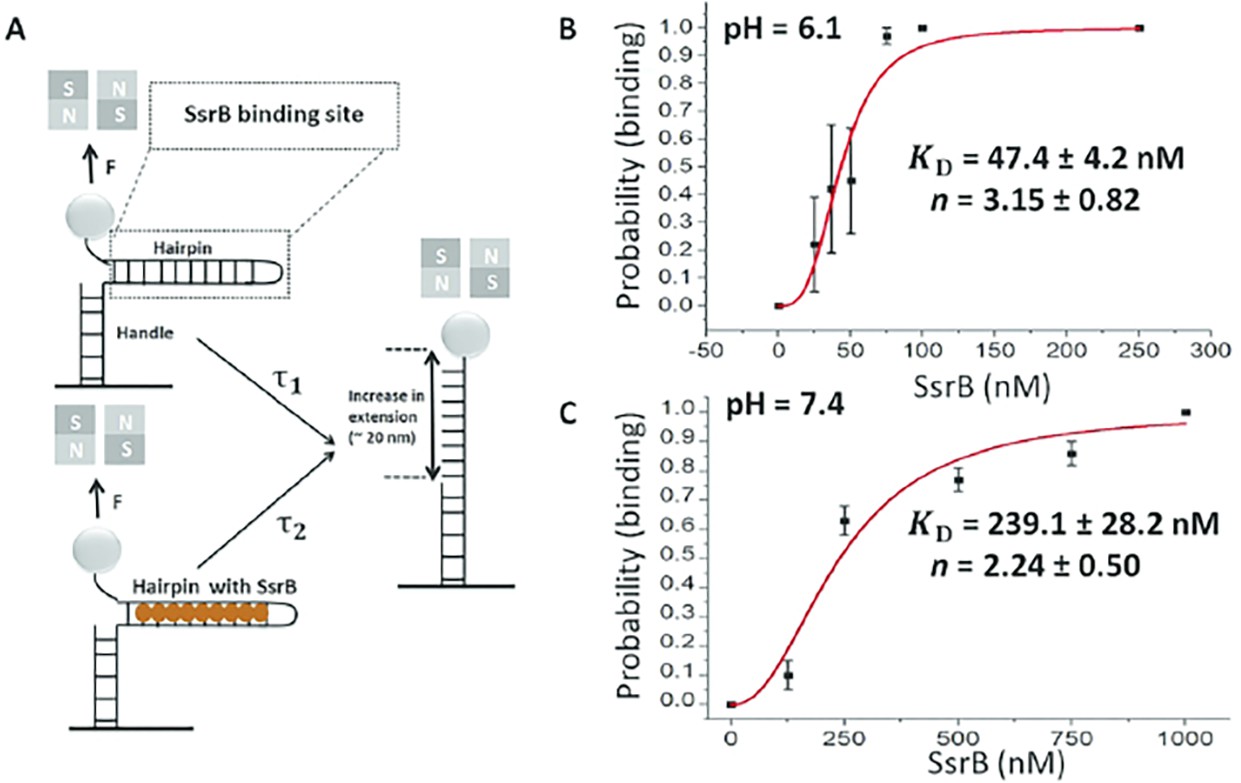
Quantification of SsrB-DNA binding affinity.
(A) Schematic of the principle of the measurement (see Gulvady et al., 2018 for more details). A force is applied to the hairpin using a pair of permanent magnets shown in gray (N: north pole, S: south pole). At a force slightly greater than the critical force, Fc, the naked DNA hairpin has a short lifetime of τ1, while the hairpin bound with SsrB has a much longer lifetime of τ2. This delayed unzipping indicates SsrB binding. See Figure 8—figure supplement 1 for the binding traces. (B) The equilibrium binding probability as a function of SsrB concentration was plotted at pH 6.1 and (C) pH 7.4. These were the measured intracellular pH values of Salmonella in response to acid or neutral pH (Chakraborty et al., 2015; Chakraborty et al., 2017). The solid curves are the fitted curves to the Hill equation, the error bars represent the S.E.M. At pH 6.1 the KD was 47.4 ± 4.2 nM and the Hill coefficient (n) was 3.15 ± 0.82 nM. At pH 7.4, the KD increased to 239.1 ± 28.2 nM and the Hill coefficient (n) was still cooperative at 2.14 ± 0.5. Three to five independent tethers were analyzed for each point of the curves, and at least three independent probability values were determined at each SsrB concentration.
-
Figure 8—source data 1
- https://doi.org/10.7554/eLife.45311.037
Figure 8—figure supplement 1
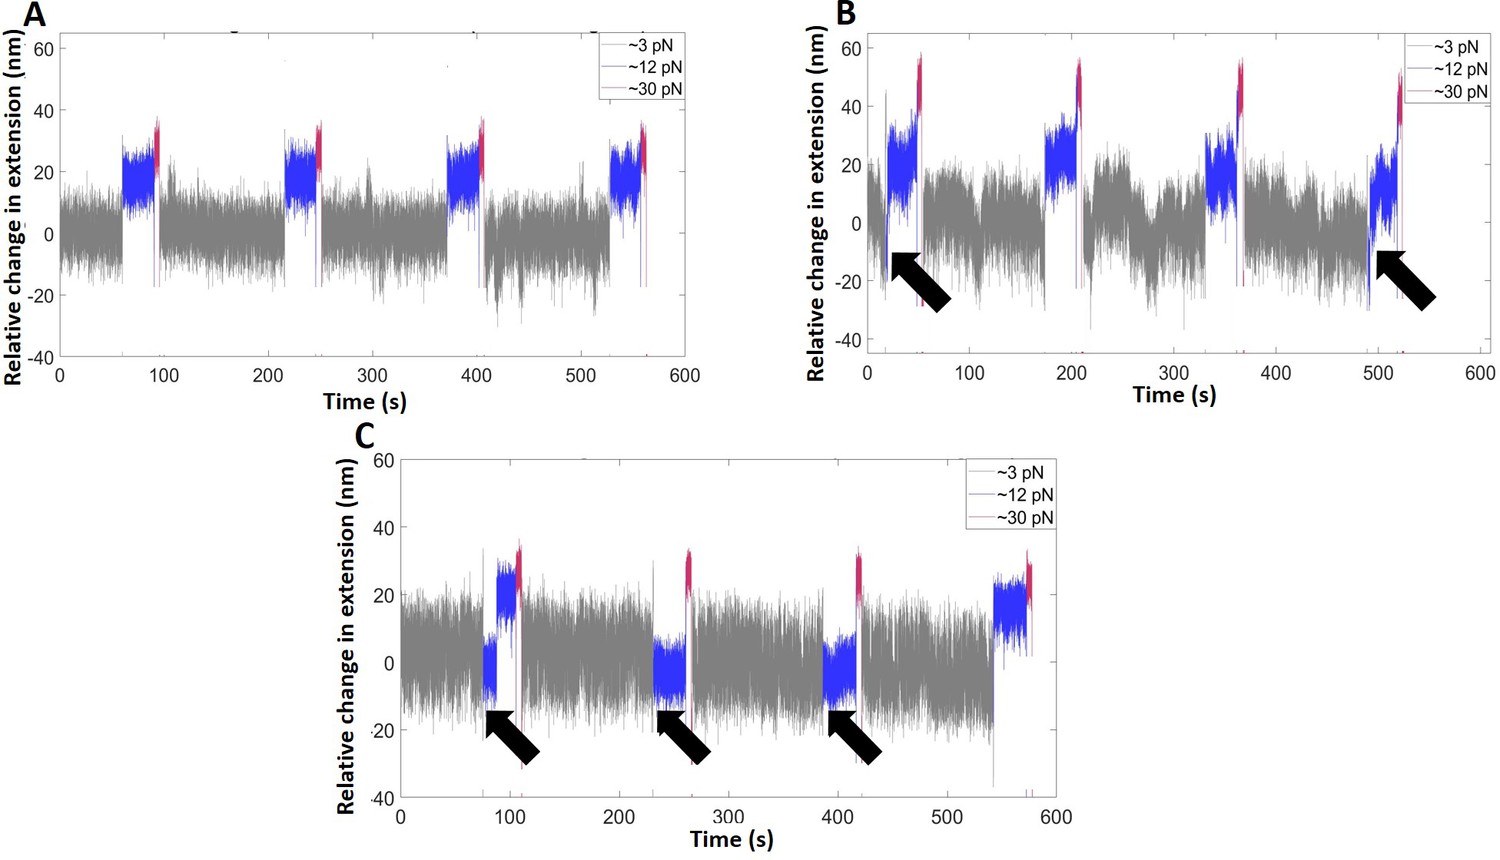
Representative time traces of the extension change of the hairpin (pH = 6.1) in the absence of SsrB (A), and in the presence of SsrB at 37 nM (B) and 75 nM (C).
The measurements were recorded at three forces: the binding force (∼3 pN, gray, 2 min), at which the SsrB-hairpin complex reaches equilibrium, the probing force (∼12 pN, blue, 30 s), slightly greater than Fc, to observe the binding signals, if any, and the displacing force (∼30 pN, magenta, 5 s), to rapidly displace bound SsrB. The black arrows indicate the cycles at which SsrB-DNA binding was observed.
-
Figure 8—figure supplement 1—source data 1
- https://doi.org/10.7554/eLife.45311.034
-
Figure 8—figure supplement 1—source data 2
- https://doi.org/10.7554/eLife.45311.036
Figure 8—figure supplement 2
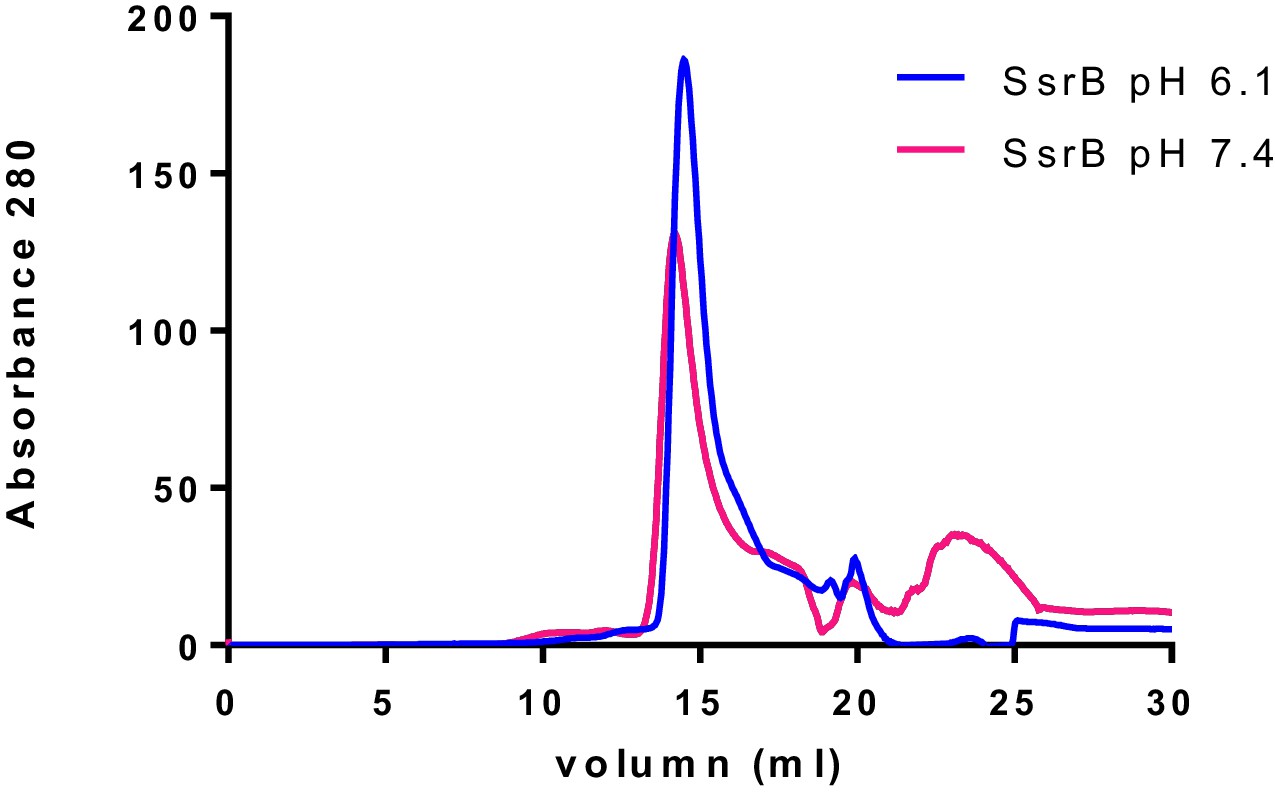
SsrB is a monomer at both acid and neutral pH.
Purified SsrB was resuspended in acid buffer (20 mM MES pH 6.1, 50 mM KCl, 2 mM MgCl2, 2 mM DTT, 5% glycerol) or neutral buffer (20 mM Hepes pH 7.4, 50 mM KCl, 2 mM MgCl2, 2 mM DTT, 5% glycerol) and then separated on a gel filtration column using an AKTA FPLC system. The nearly identical elution profiles of SsrB indicate that SsrB is a monomer at both acid and neutral pH.
Author response image 1

Tables
Table 1
Apparent diffusion coefficient D obtained from SptPALM of SsrB mutants.
https://doi.org/10.7554/eLife.45311.038| No. of cells | No. of tracks | F1 (%) | F2 (%) | F3 (%) | D1 (µm2s−1) | D2 (µm2s−1) | D3 (µm2s−1) | |
|---|---|---|---|---|---|---|---|---|
| Fixed | 41 | 496 | 26.9 ± 4.0 | 65.0 ± 3.7 | 8.1 ± 0.6 | 0.020 ± 0.002 | 0.066 ± 0.003 | 0.88 ± 0.08 |
| WT pH5.6 | 89 | 2618 | 28.1 ± 2.6 | 34.5 ± 2.3 | 37.3 ± 0.5 | 0.041 ± 0.002 | 0.14 ± 0.01 | 1.49 ± 0.02 |
| WT pH7.2 | 71 | 569 | 11.3 ± 1.1 | 22.2 ± 1.0 | 66.5 ± 1.2 | 0.037 ± 0.004 | 0.25 ± 0.03 | 1.53 ± 0.03 |
| K179A pH5.6 | 113 | 1038 | 11.3 ± 1.3 | 18.7 ± 1.2 | 69.9 ± 1.5 | 0.056 ± 0.006 | 0.32 ± 0.05 | 1.70 ± 0.03 |
| D56A pH5.6 | 109 | 1345 | 20.5 ± 1.4 | 24.0 ± 1.1 | 55.5 ± 1.2 | 0.045 ± 0.003 | 0.26 ± 0.03 | 1.61 ± 0.03 |
| D56A pH7.2 | 74 | 384 | 13.0 ± 1.5 | 27.3 ± 1.4 | 59.8 ± 1.9 | 0.050 ± 0.005 | 0.31 ± 0.04 | 1.66 ± 0.04 |
| D56E pH5.6 | 111 | 796 | 11.1 ± 0.8 | 16.2 ± 1.7 | 72.8 ± 2.2 | 0.053 ± 0.004 | 0.39 ± 0.06 | 1.52 ± 0.03 |
| PAmCherry pH5.6 | 53 | 715 | 5.4 ± 0.3 | 27.8 ± 1.3 | 66.7 ± 1.4 | 0.029 ± 0.004 | 0.67 ± 0.04 | 3.61 ± 0.07 |
| PhoP pH 5.6 | 81 | 3665 | 9.8 ± 1.5 | 23.7 ± 1.3 | 66.4 ± 0.4 | 0.033 ± 0.004 | 0.14 ± 0.01 | 1.54 ± 0.01 |
| PhoP pH 7.2 | 103 | 2930 | 10.6 ± 0.6 | 18.8 ± 1.5 | 70.6 ± 1.8 | 0.043 ± 0.003 | 0.40 ± 0.04 | 1.58 ± 0.03 |
| OmpR pH 5.6 | 43 | 1610 | 21.9 ± 1.4 | 20.9 ± 1.0 | 57.0 ± 1.3 | 0.054 ± 0.003 | 0.26 ± 0.03 | 1.34 ± 0.02 |
| OmpR pH 7.2 | 55 | 2119 | 16.4 ± 1.0 | 28.0 ± 0.9 | 55.6 ± 1.0 | 0.045 ± 0.003 | 0.25 ± 0.02 | 1.45 ± 0.02 |
| OmpR pH 5.6 (E.coli) | 23 | 1644 | 24.3 ± 0.9 | 39.4 ± 3.7 | 36.2 ± 4.2 | 0.066 ± 0.003 | 0.55 ± 0.06 | 2.06 ± 0.14 |
| OmpR pH 7.2 (E.coli) | 22 | 478 | 15.3 ± 1.2 | 45 ± 1.8 | 39.7 ± 2.4 | 0.057 ± 0.005 | 0.40 ± 0.03 | 2.06 ± 0.09 |
Table 2
Strains and plasmid used in this study.
https://doi.org/10.7554/eLife.45311.039| Strain number/plasmid | Description/genotype | Reference/Source |
|---|---|---|
| Salmonella strains | ||
| AL63 | Wild-type Salmonella Typhimurium 14028 s | Lab stock |
| AL142 | ssrA::tetRA (TetRA) | (Winardhi et al., 2015) |
| AL160 | ssrA::tetRA attB:: ssrA-PAmCherry (CmR) | This work |
| AL123 | ssrB::ssrB-4-PAmCherry (TetRA) | This work |
| AL125 | ssrB::ssrB-10-PAmCherry (TetRA) | This work |
| AL159 | attB:: PssrB-PAmCherry (CmR) | This work |
| AL60 | ΔssrB | Lab stock |
| AL89 | ΔssrB attB::PAmCherry-4-ssrB (CmR) | This work |
| AL92 | ΔssrB attB::PAmCherry-10-ssrB (CmR) | This work |
| AL286 | ΔssrB attB::PAmCherry-4-ssrB D56A (CmR) | This work |
| AL489 | ΔssrB attB::PAmCherry-4-ssrB D56E (CmR) | This work |
| AL289 | ΔssrB attB::PAmCherry-4-ssrB K179A (CmR) | This work |
| AL518 | phop::kanR | This work |
| AL522 | phop::kanR attB::PAmCherry-4-ssrB (CmR) | This work |
| AL325 | ΔphoP | This work |
| AL391 | ΔphoP attB::phoP-4-PAmCherry (CmR) | This work |
| AL394 | ΔphoP attB::phoP-10-PAmCherry (CmR) | This work |
| AL520 | ompR::kanR | This work |
| AL524 | ompR::kanR attB::PAmCherry-4-ssrB (CmR) | This work |
| AL525 | ΔompR | This work |
| E. coli strains | ||
| AL53 | BW25141 pir+ | (Bijlsma and Groisman, 2005) |
| AL217 | BL21 (DE3) | Lab stock |
| Plasmids vectors | ||
| pKD46 | λ-Red recombinase expression plasmid (AmpR). | (Kenney, 2018) |
| pCP20 | Plasmid containing FLP recombinase for removal of CmR resistance marker flanked by FRT sites (AmpR). | (Kenney, 2018) |
| pKD3 | Plasmid used as a template for amplifying the CmR resistance cassette for constructing gene knockouts in Salmonella (CmR). | (Kenney, 2018) |
| pINT-ts | CRIM helper plasmid (AmpR). | (Bijlsma and Groisman, 2005) |
| pCAH63 | CRIM cloning vector (CmR). | (Bijlsma and Groisman, 2005) |
| pAL-4-PAmCherry | CRIM cloning vector containing the 4XGGSG linker upstream of PAmCherry (CmR). | This work |
| pAL-10-PAmCherry | CRIM cloning vector containing the 10XGGSG linker upstream of PAmCherry (CmR). | This work |
| pAL-PAmCherry-4-SsrB | CRIM plasmid containing the N-terminal PAmCherry-4XGGSG-ssrB fusion (CmR). | This work |
| pAL-PAmCherry-4-SsrB D56A | CRIM plasmid containing the N-terminal PAmCherry-4XGGSG-ssrB D56A fusion (CmR). | This work |
| pAL-PAmCherry-4-SsrB D56E | CRIM plasmid containing the N-terminal PAmCherry-4XGGSG-ssrB D56E fusion (CmR). | This work |
| pAL-PAmCherry-4-SsrB K179A | CRIM plasmid containing the N-terminal PAmCherry-4XGGSG-ssrB K179A fusion (CmR). | This work |
| pAL-PssrB-PAmCherry | CRIM plasmid with a 500 bps 5’UTR fragment containing the ssrB promoter cloned upstream of PAmCherry. | This work |
| pAL-PAmCherry-10-SsrB | CRIM plasmid containing the N-terminal PAmCherry-10XGGSG-ssrB fusion (CmR). | This work |
| pAL-SsrA-10-PAmCherry | CRIM plasmid containing the C-terminal ssrA-10XGGSG-PAmCherry fusion (CmR). | This work |
| pAL-PhoP-4-PAmCherry | CRIM plasmid containing the C-terminal phoP-4XGGSG-PAmCherry fusion (CmR). | This work |
| pAL-PhoP-10-PAmCherry | CRIM plasmid containing the C-terminal phoP-10XGGSG-PAmCherry fusion (CmR). | This work |
| pMPM-A5Ω | pBR322 ori araC PBAD promoter Ω-interposon MCS (AmpR) | Lab stock |
| pMPM-A5Ω-his-ssrB | pMPM-A5Ω plasmid cloned with 6xhis-ssrB (AmpR) | (Arnoldini et al., 2014) |
| pMPM-A5Ω-his-ssrB-D56A | pMPM-A5Ω plasmid cloned with 6xhis-ssrB D56A (AmpR) | (Arnoldini et al., 2014) |
| pMPM-A5Ω-his-ssrB-D56E | pMPM-A5Ω plasmid cloned with 6xhis-ssrB D56E (AmpR) | This work |
| pMPM-A5Ω-his-ssrB-K179A | pMPM-A5Ω plasmid cloned with 6xhis-ssrB K179A (AmpR) | (Chakraborty et al., 2017) |
| pMPM-A5Ω-his-ssrBc | pMPM-A5Ω plasmid cloned with 6xhis-ssrBc (AmpR) | (Arnoldini et al., 2014) |
| pMPM-A5Ω-his-phoP | pMPM-A5Ω plasmid cloned with 6xhis-phoP (AmpR) | This work |
| pKF61 | Plasmid pKLC-II containing the promoter fragment of sseI fused to lacZ (AmpR) | (Arnoldini et al., 2014) |
| pKF8A | Plasmid pMC1871 containing the promoter fragment of ssrB fused to lacZ (TetRA) | (Gao et al., 2017) |
-
*Antibiotic resistance markers are expressed as follows: TetRA; tetracycline resistance, AmpR; ampicillin resistance, CmR; chloramphenicol resistance, KanR: Kanamycin resistance.
Additional files
-
Transparent reporting form
- https://doi.org/10.7554/eLife.45311.040
Download links
A two-part list of links to download the article, or parts of the article, in various formats.
Downloads (link to download the article as PDF)
Open citations (links to open the citations from this article in various online reference manager services)
Cite this article (links to download the citations from this article in formats compatible with various reference manager tools)
Single cell, super-resolution imaging reveals an acid pH-dependent conformational switch in SsrB regulates SPI-2
eLife 8:e45311.
https://doi.org/10.7554/eLife.45311


