Electron cryo-microscopy of bacteriophage PR772 reveals the elusive vertex complex and the capsid architecture
- Uppsala University, Sweden
- Stockholm University, Sweden
- Academy of Sciences of the Czech Republic, Czech Republic
- KTH Royal Institute of Technology, Sweden
Figures
Figure 1 with 1 supplement
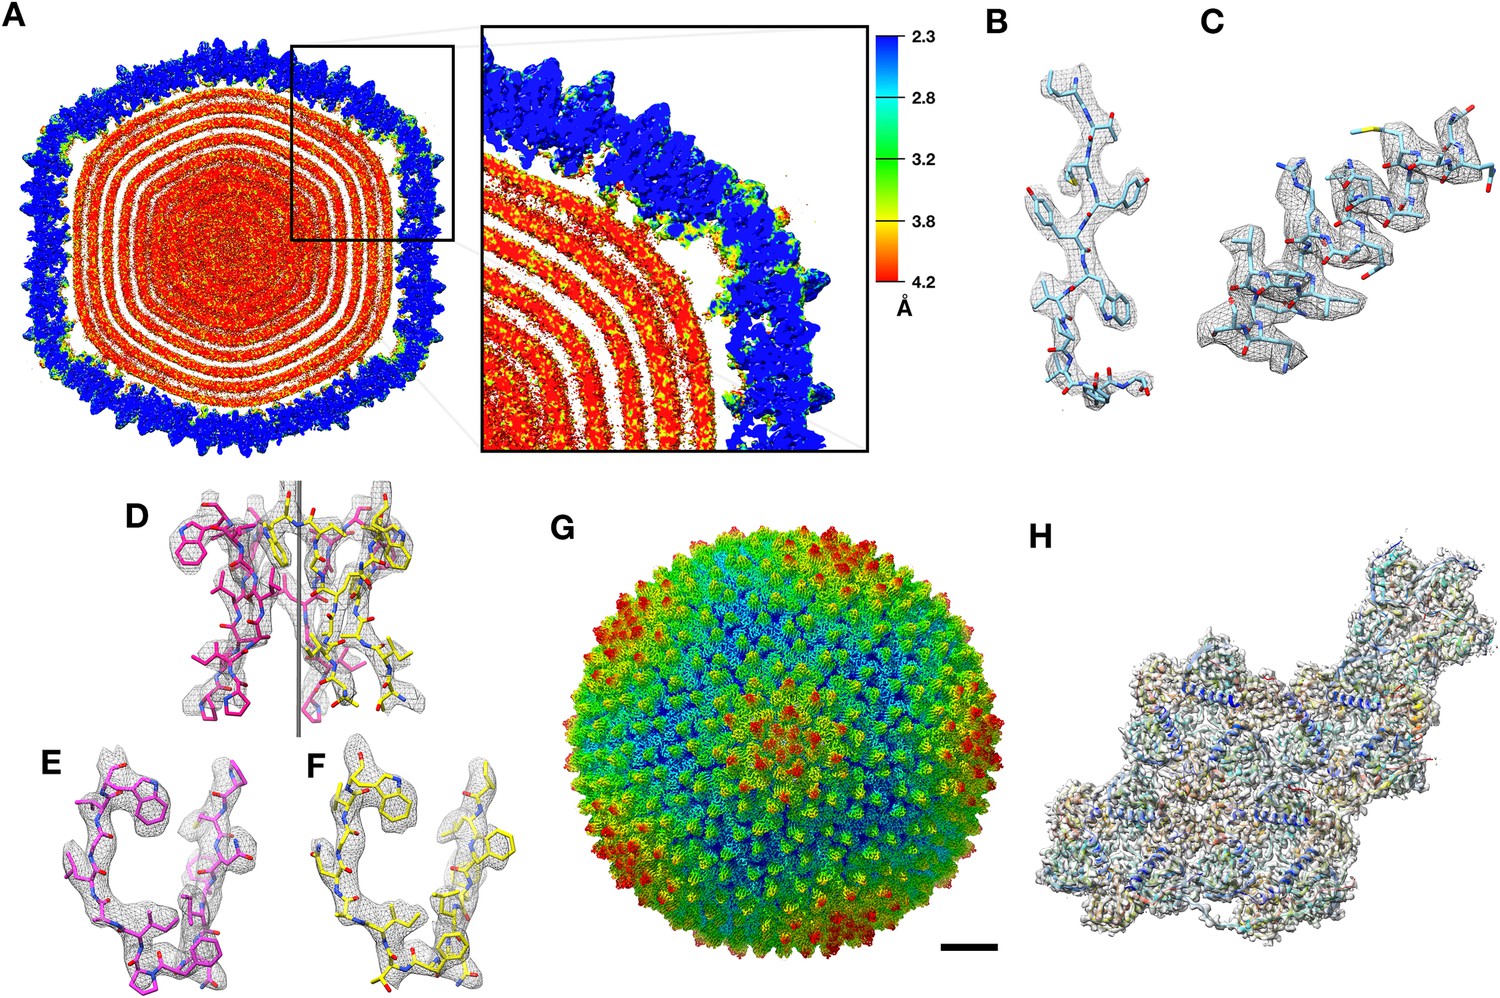
CryoEM structure of PR772 and resolution estimates.
(A) The local resolution estimate of the CryoEM map from ResMap. The map shows the distribution of resolution in different regions. (Visualized using USCF Chimera, with volume viewer parameters: Style surface, step 1 and level 0.037, Plane 418, Axis Y, Depth 23). Most of the capsid that was used for model building is resolved at 2.3 Å. (B, C and D) Show the quality of the map in different regions. (B) Quality of the map at the core of the capsid protein P3 (Chain B, residues 162–173) where the local resolution estimate is 2.3 Å. (C) Quality of the map close to the membrane (P3 Chain B, residues 18–35) where the resolution is estimated to 3.2 Å. (D) Quality of the map close to the five-fold vertex of the icosahedral viral particle. The black vertical line represents the five-fold axis. (E and F) The initial model fit of P5 residues 108-121(in pink) and P31 residues 113–126 (in yellow) to the same region of the map using Phenix: Find helix and sheets with respective protein sequences as input. (G) The post processed map of PR772 and the scale bar represents 10 nm. (H) The map:model fit of the asymmetric unit as seen from the inside of the viral particle.
-
Figure 1—source data 1
Relion postprocess star file.
- https://doi.org/10.7554/eLife.48496.005
Figure 1—figure supplement 1
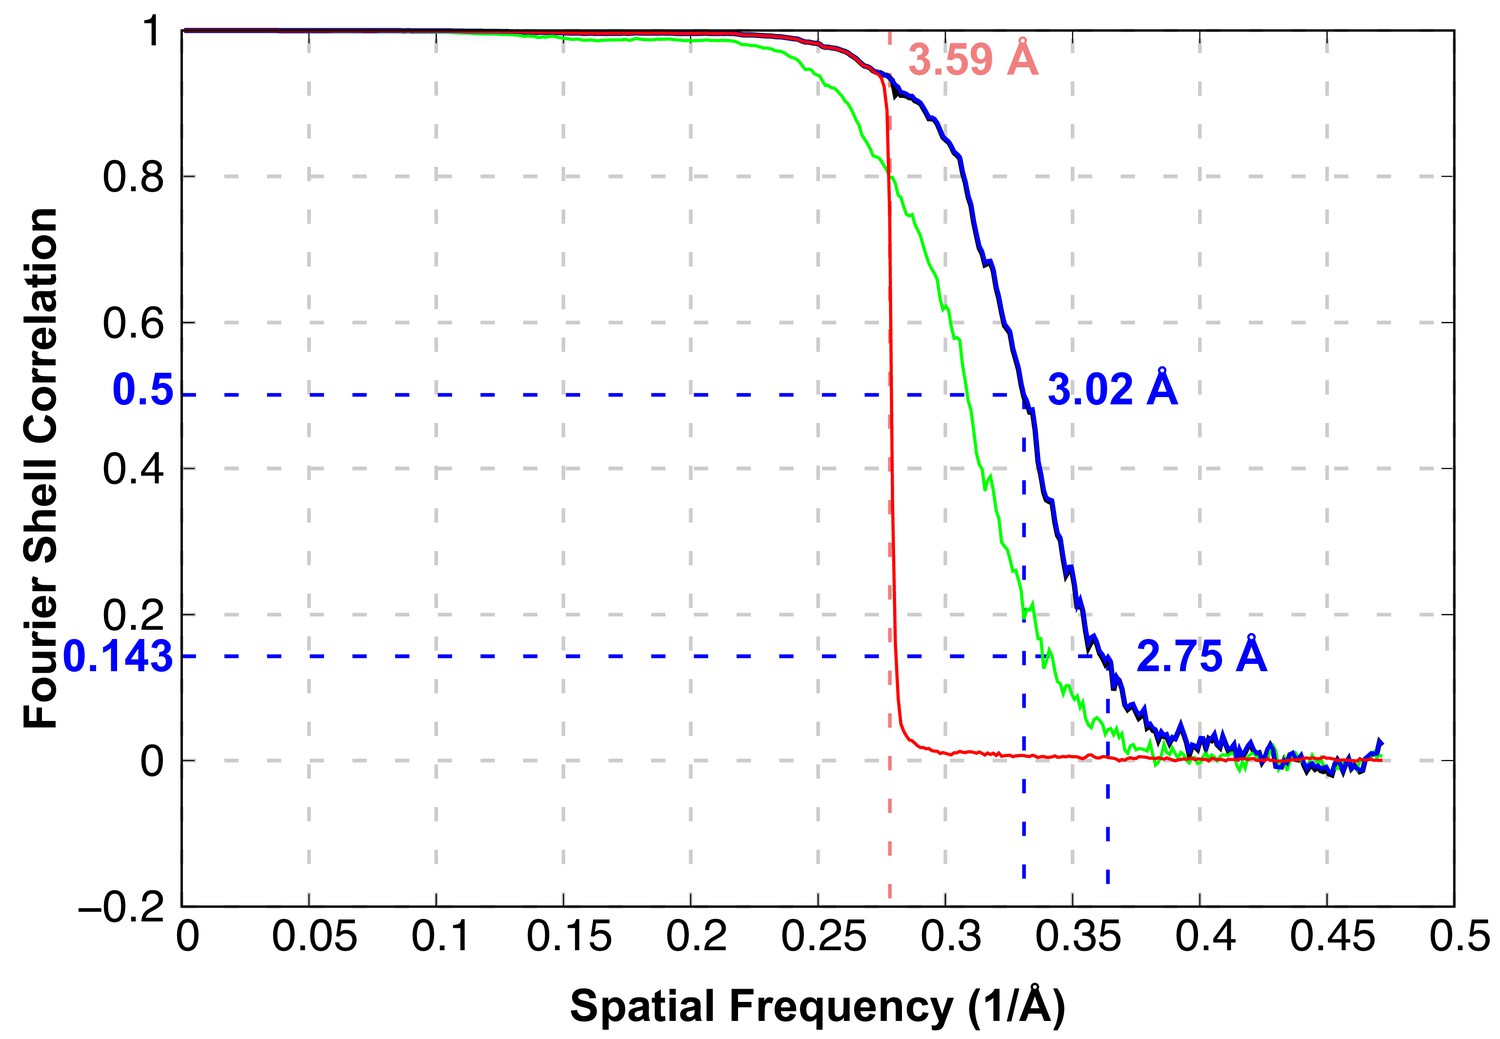
FSC curves of the overall resolution estimate of the 3D reconstruction (green: unmasked map, blue: masked map, black: FSC corrected, red: phase randomized map).
FSC@0.143 is 2.75 Å and the FSC@0.5 is 3.02 Å. The phase randomization to test model bias was done at 3.59 Å.
Figure 2 with 3 supplements
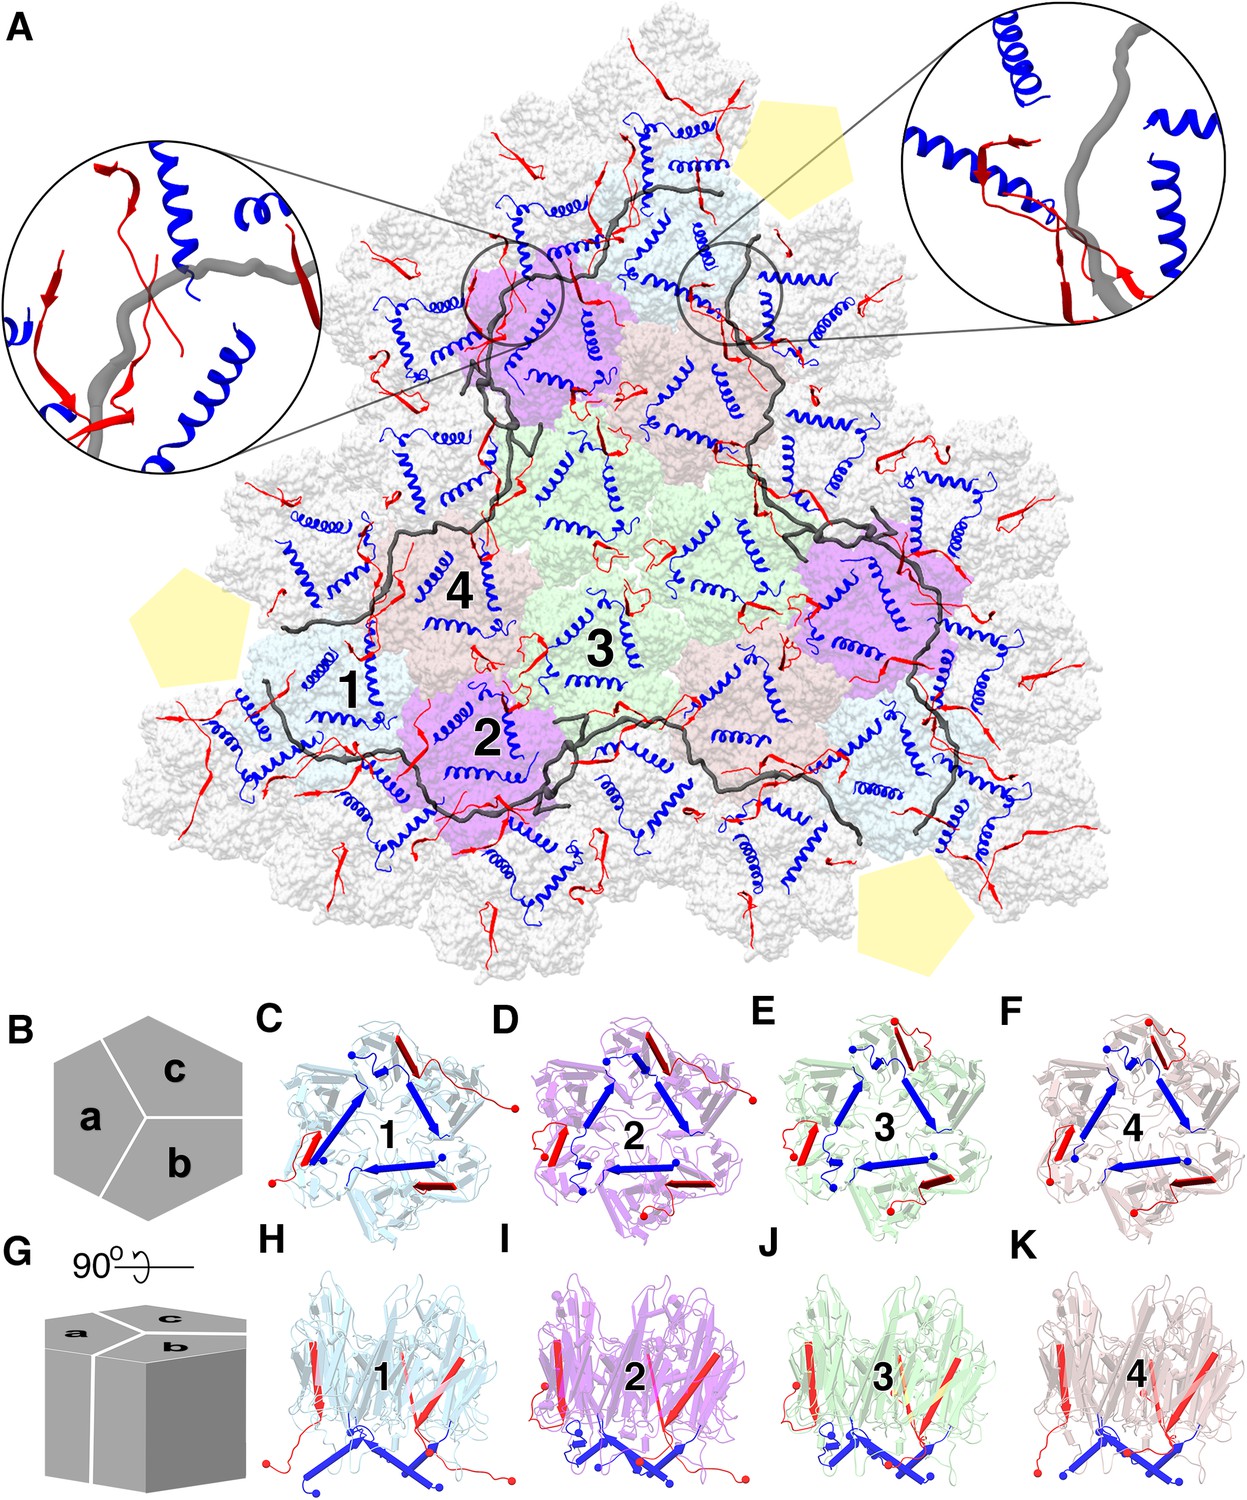
Major capsid protein P3 and its conformations.
(A) (visualized from the outside of the viral particle) The four unique P3 trimers (represented in four different colors) and their arrangement forming the trisymmetron bound by the P30 dimers (in gray). The C-terminal region and the N-terminal region of P3 subunits are colored in red and blue respectively. The highlighted regions show the locking of P30 (in black) by the C-terminal region of the neighboring P3 subunits, leading to the formation of a hinge-like mechanism which is not seen in PRD1. (B) Schematic representation of the P3 trimers and the subunit arrangement to form a hexagonal capsomer (as viewed from outside) and (C), (D), (E,) (F) are aligned to this view. (G) It is the orthogonal view to the schematic (B) and (H), (I), (J), (K) are aligned to this view. Different views of trimer 1 (C,H), trimer 2 (D,I), trimer 3 (E,J) and trimer 4 (F,K) show the variation in the N-terminal (shown as blue cylinders with the arrow heads pointing towards the C-terminal) and C-terminal (shown as red planks with the arrow heads pointing towards the C-terminal) region of P3 subunits. N and C termini are shown as spheres with respective colors. They are colored to match (A). The yellow pentagons are a schematic representation of the penton.
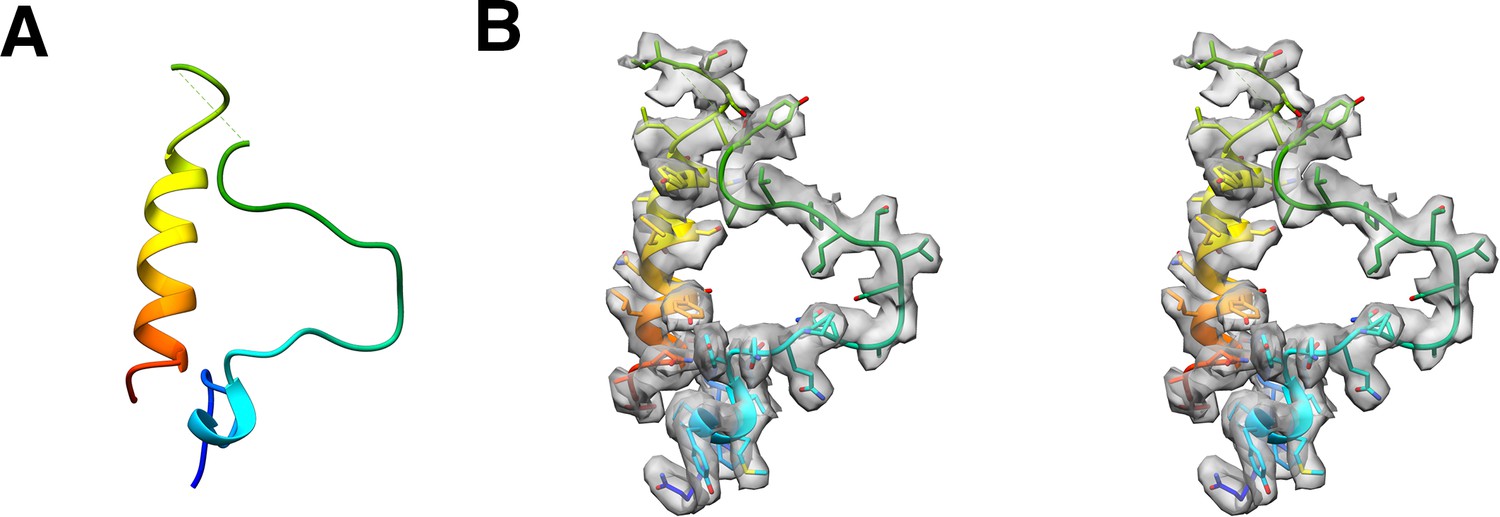
Figure 2—figure supplement 1
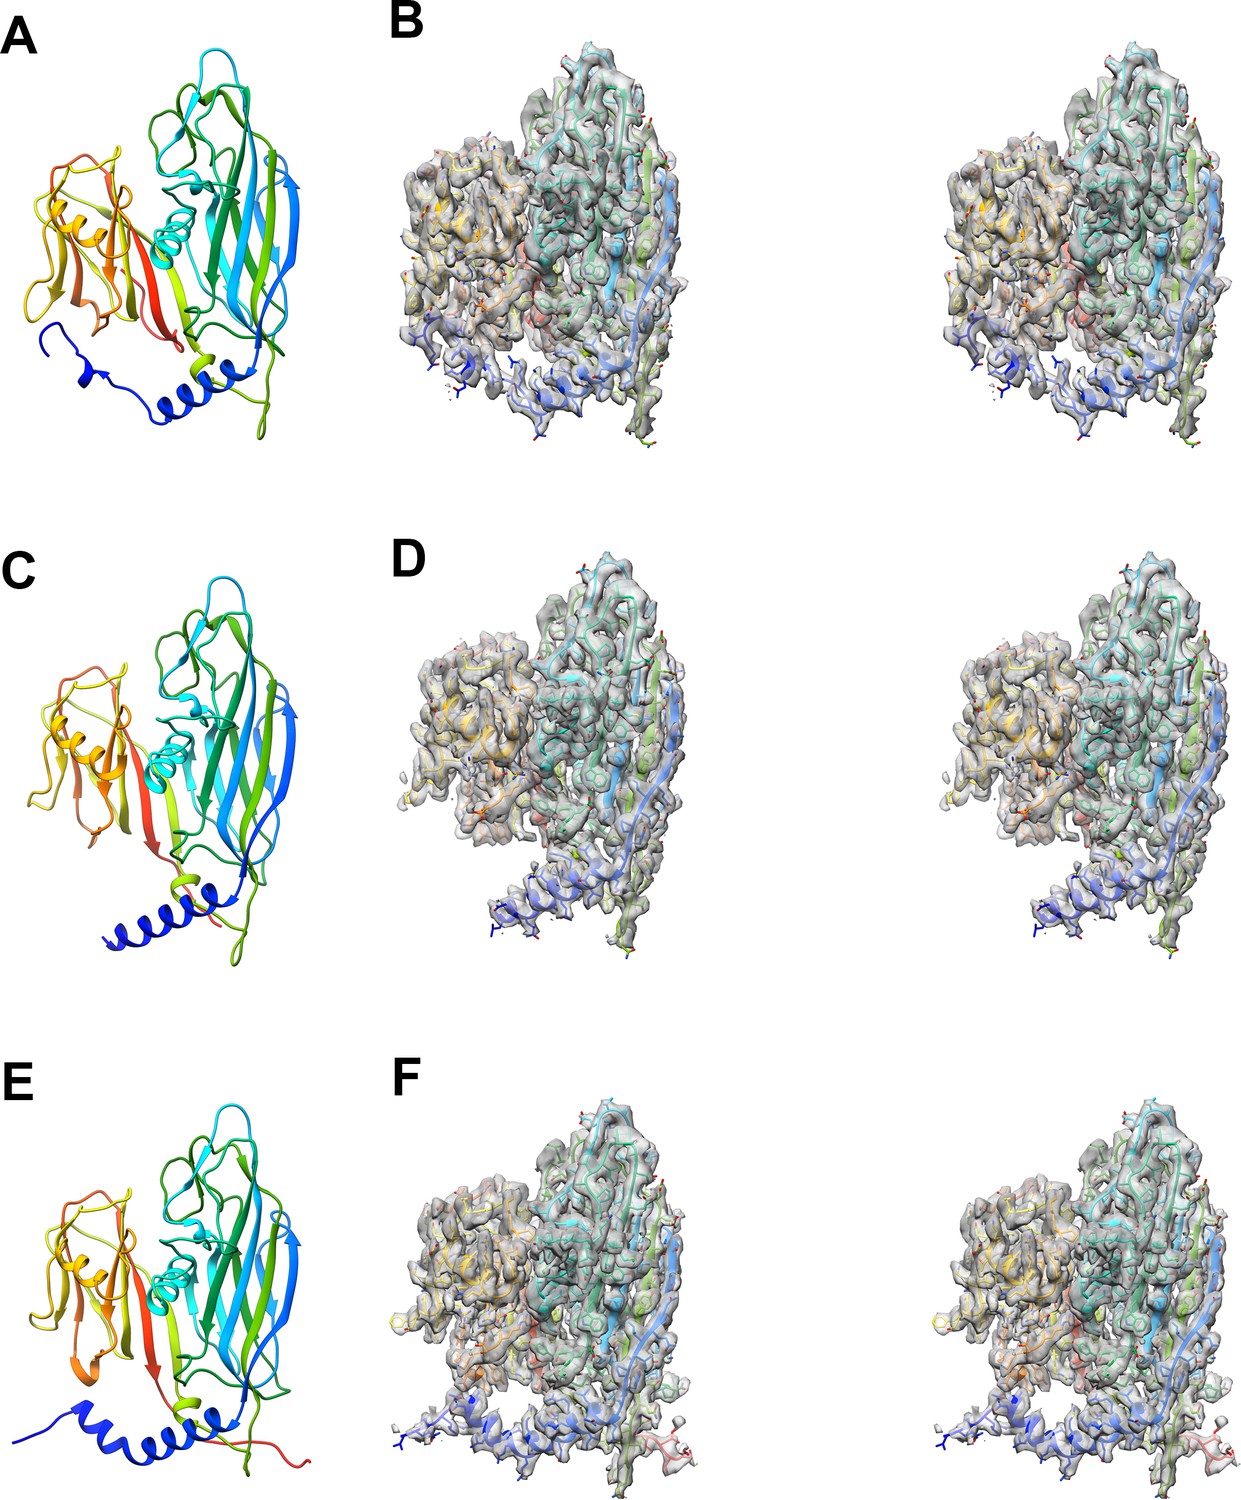
Shows the different N-terminal conformations of the P3 monomer.
(A, C and E) represents the model of subunits a, b and c respectively of the trimer labeled two in Figure 2. (B, D and F) represents the stereo images of the model of subunit a, b and c fit into their respective CryoEM maps. The N-terminal conformations of P3 in (A, C and E) represent the helix turn helix, the long helix and the long helix with a kink respectively.
Figure 2—figure supplement 2
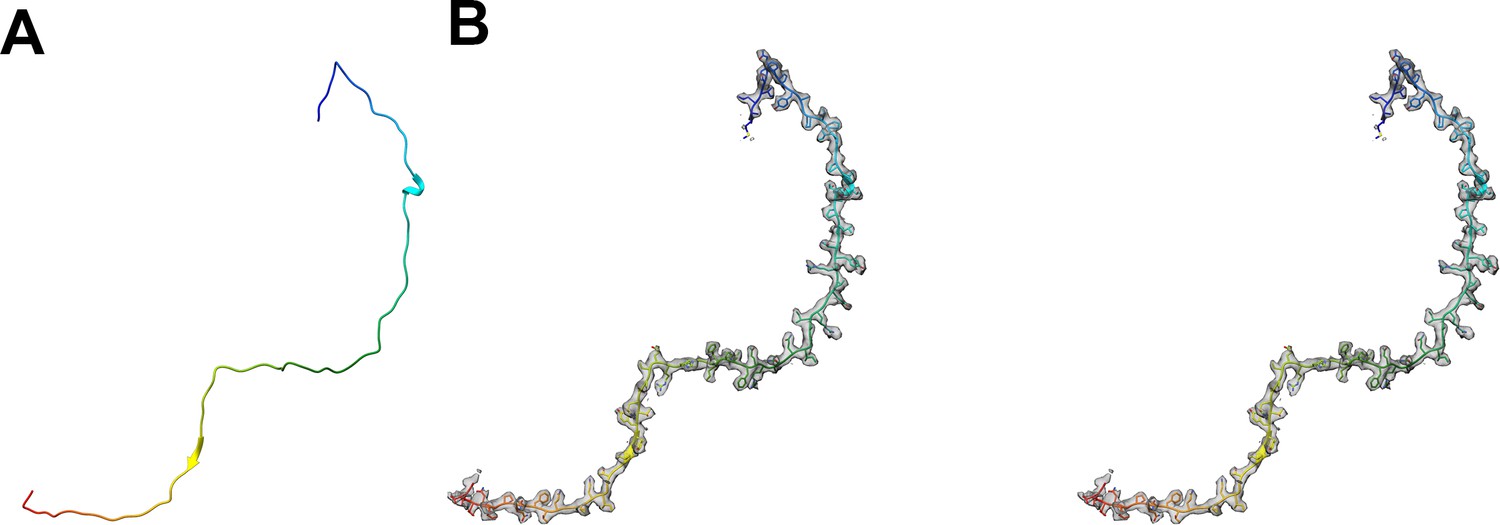
Modelled P30 protein and its map density fit.
(A) The model of the tape-like protein, P30. (B) The stereo images of the model fitted into the CryoEM map.
Figure 2—figure supplement 3
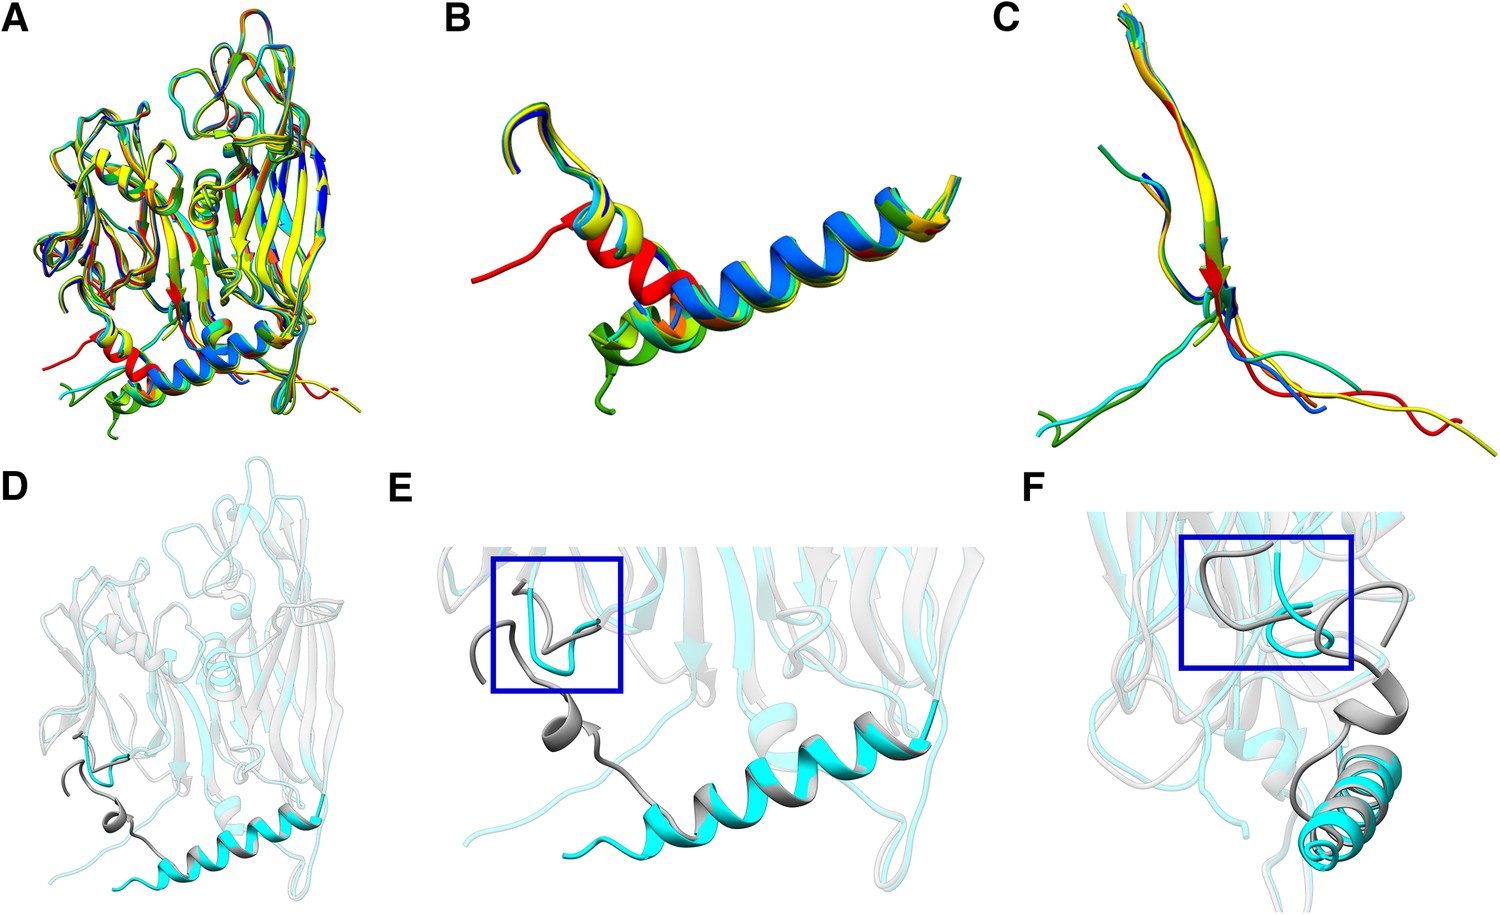
Variations in the P3 subunits.
(A) Shows the superposition of twelve P3 subunits that form the asymmetric unit. (B) Shows all the N-terminal regions of P3, isolated from (A). (C) Shows all the C-terminal regions of P3, isolated from (A). (B) and (C) shows the structural variability in the C and N-terminal regions of P3. (D, E and F) Shows the superposition of two P3 subunits, one with helix turn helix conformation of the N-terminal regions of P3 (gray) and the other with a long helical conformation of the N-terminal region of P3 (cyan). (E) and (F) highlight the loop formed by Tyr351-Val358 residues. Here, the P3 subunit with helix turn helix conformation of the N-terminal regions (gray) shows that the loop formed by Tyr351-Val358 residues is flipped compared to the loop in the P3 subunit with a long helical conformation of the N-terminal regions (cyan).
Figure 3
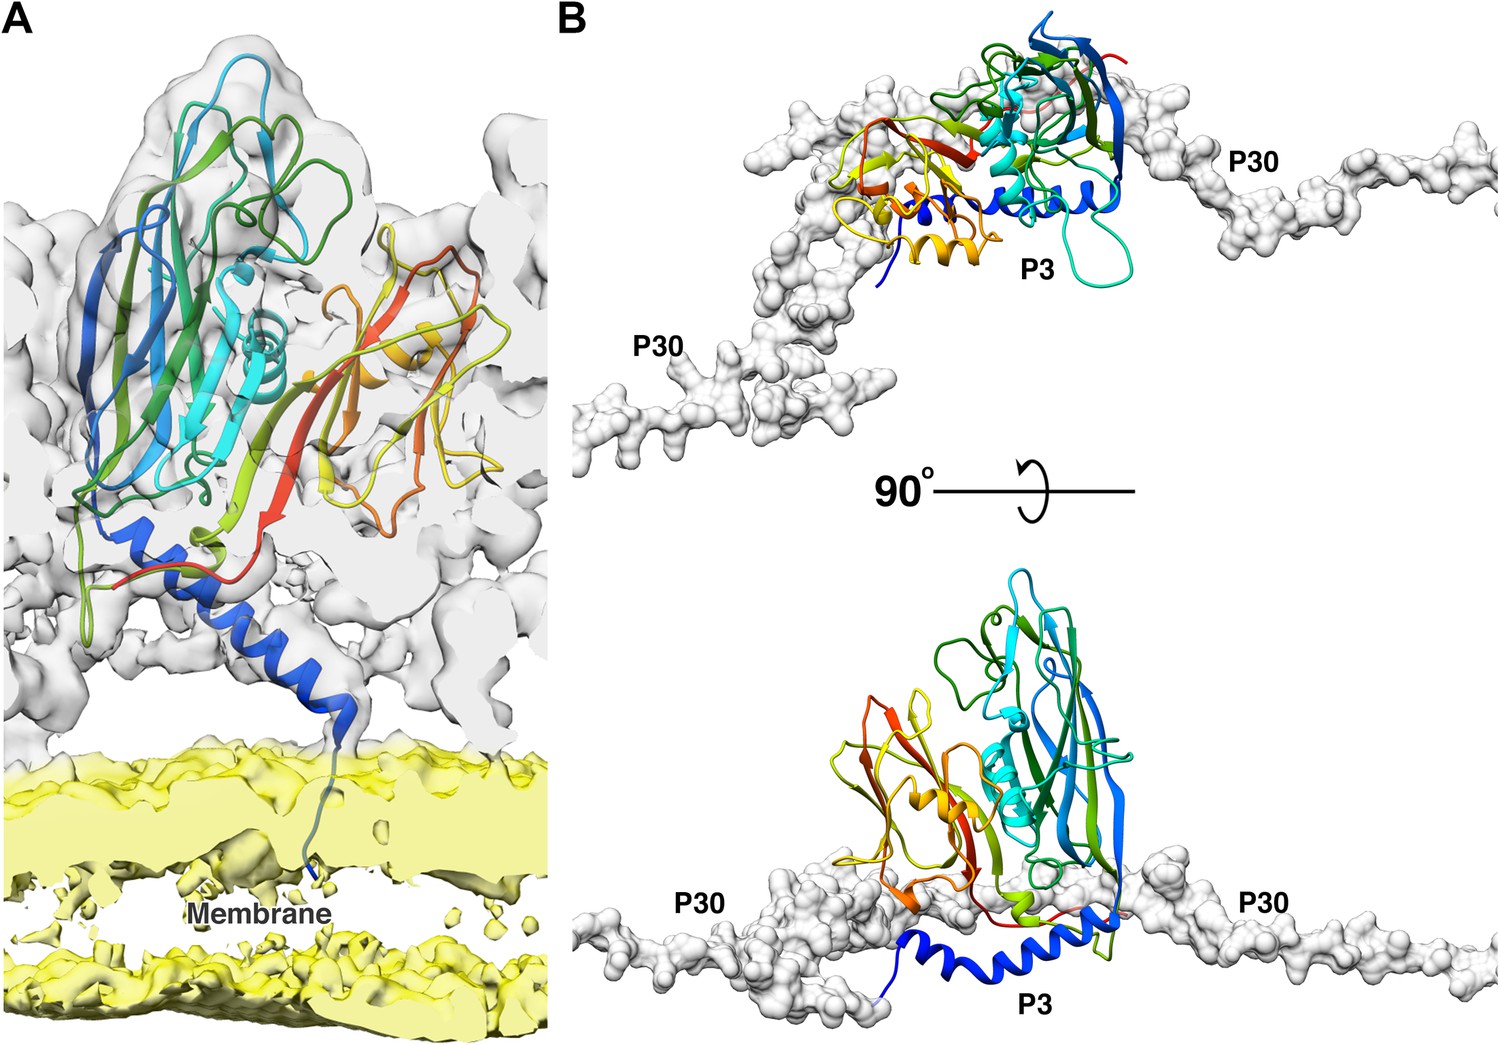
Function of 2 N-terminal helices of the P3 subunits.
(A) Shows the model of the long N-terminal helix conformation (blue) of the P3 subunit anchoring to the membrane. The CryoEM map was low pass filtered to 5 Å to reduce noise in the membrane region due to map sharpening. In the CryoEM map, the capsid region is shown in gray and the membrane region is shown in yellow. (B) The newly discovered P3 N-terminal conformation, a long helix with a kink accommodates the P30 dimer (shown in gray, rendered as surface).
Figure 4 with 7 supplements
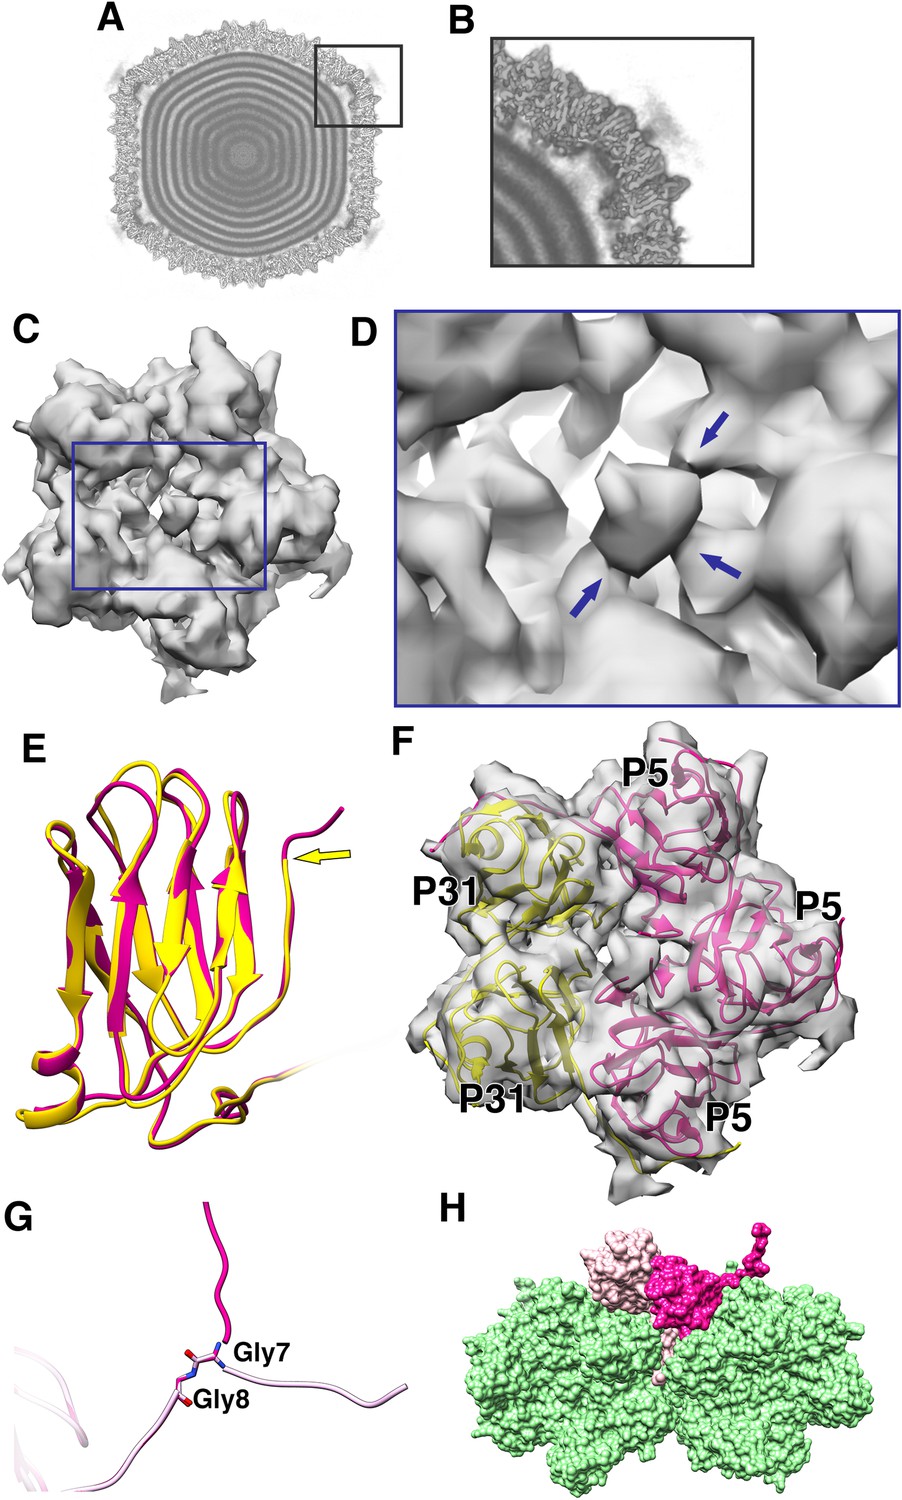
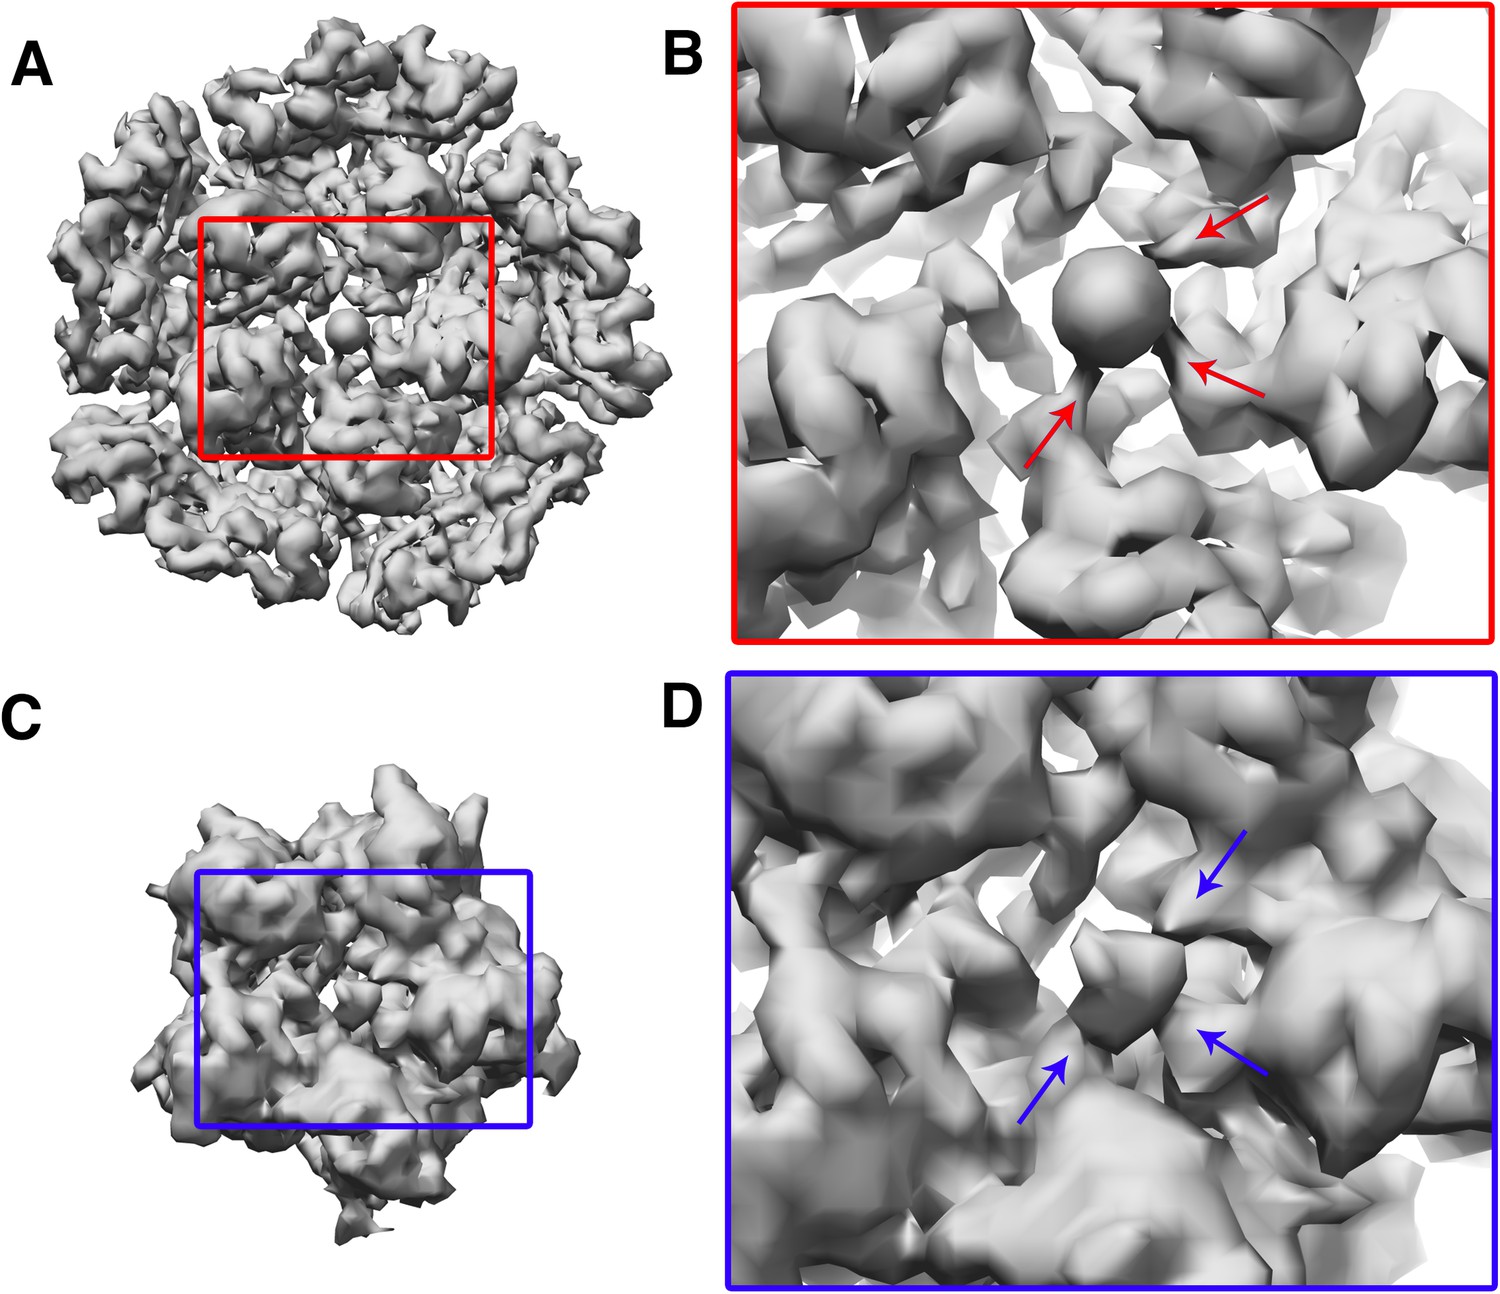
Penton as a heteropentamer of P5 and P31.
(A) Icoshedrally averaged CryoEM map of PR772 showing the smeared densities at the five-fold vertices (Visualized using USCF Chimera, with volume viewer parameters: Style solid, step 1 and level 0.065, Plane 418, Axis Y, Depth 23). (B) Magnified image of a vertex showing the smearing of densities due to mismatch in symmetry. (C) Typical top view of the vertex map from the localized asymmetric reconstruction shown as a gray surface and the highlighted region is magnified in (D). In (D), the three stem-like protrusions (indicated by blue arrows) which interact with one another to form the stalk are shown. (E) The structure of P31 (yellow) and P5 (pink, residues 1–124) are superimposed and P31 terminates close to the five-fold (indicated by a yellow arrow) and P5 (residues 121–124) continues upward. (F) The N-terminal domain of P5 and P31 are fitted into the localized reconstruction vertex map as rigid bodies and the P5 residues 121–124 fit into the stem-like density shown in (D). (G) Shows Gly7 and Gly8 residues at the N-terminal end of the P5 subunit and the two conformations (regular conformation as a bright pink structure and the special conformation as a pale pink structure). (H) Shows how the two conformations of the N-terminal region of P5 interact with the neighboring protein. The regular confirmation of the N-terminal end of P5 (bright pink) hugs the neighboring penton subunit whereas the special conformation (pale pink) is wedged in-between the P3 trimers (green).
Figure 4—figure supplement 1
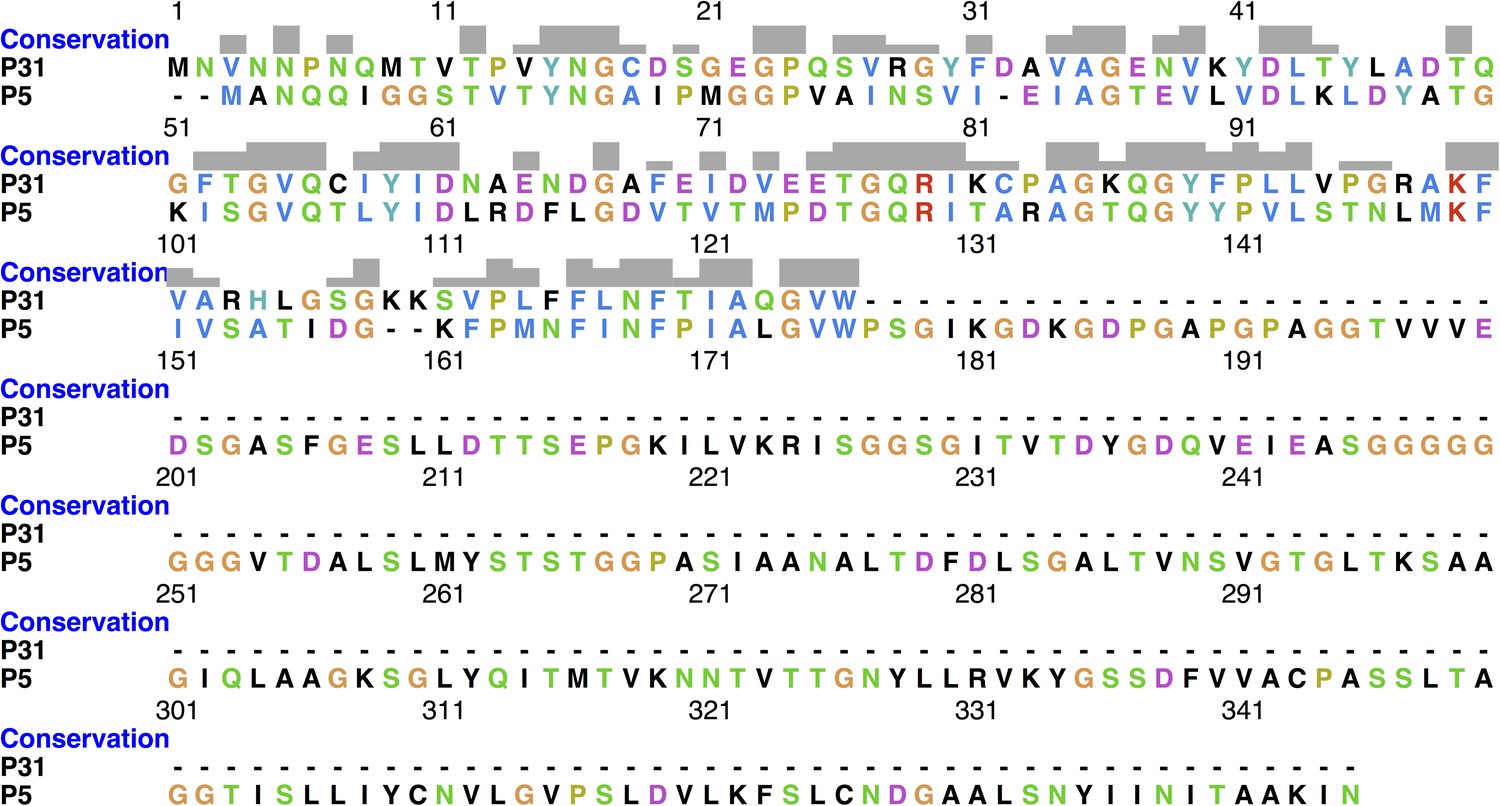
Shows the protein sequence conservation between P31 and P5.
The protein sequence of N-terminal domain of P5 and P31 show 38.3% identity and 71.3% similarity.
Figure 4—figure supplement 2
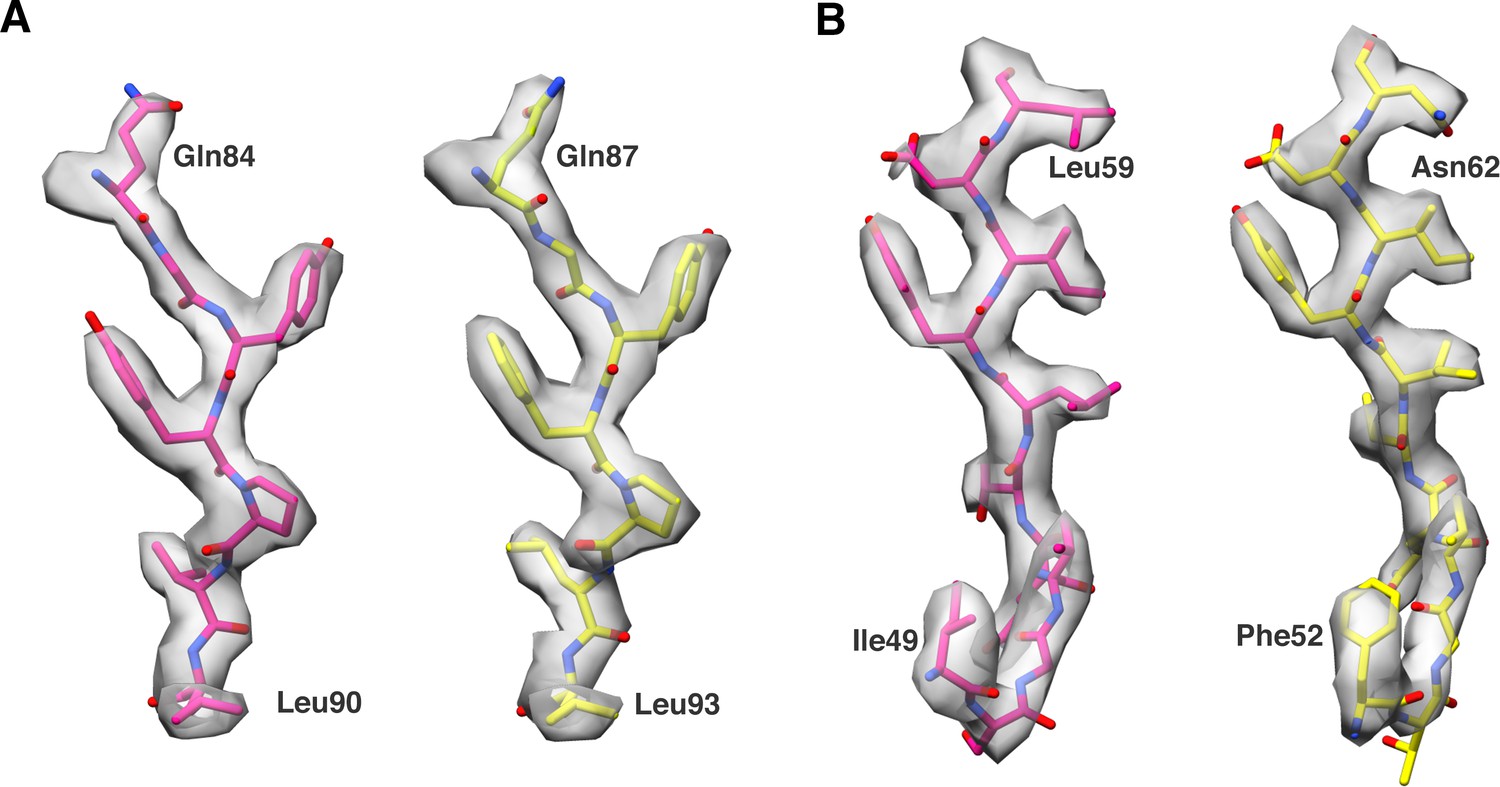
Comparison of model fitted into map density in few of the conserved regions between P31 and P5.
P5 and P31 models are shown in pink and yellow respectively.
Figure 4—figure supplement 3
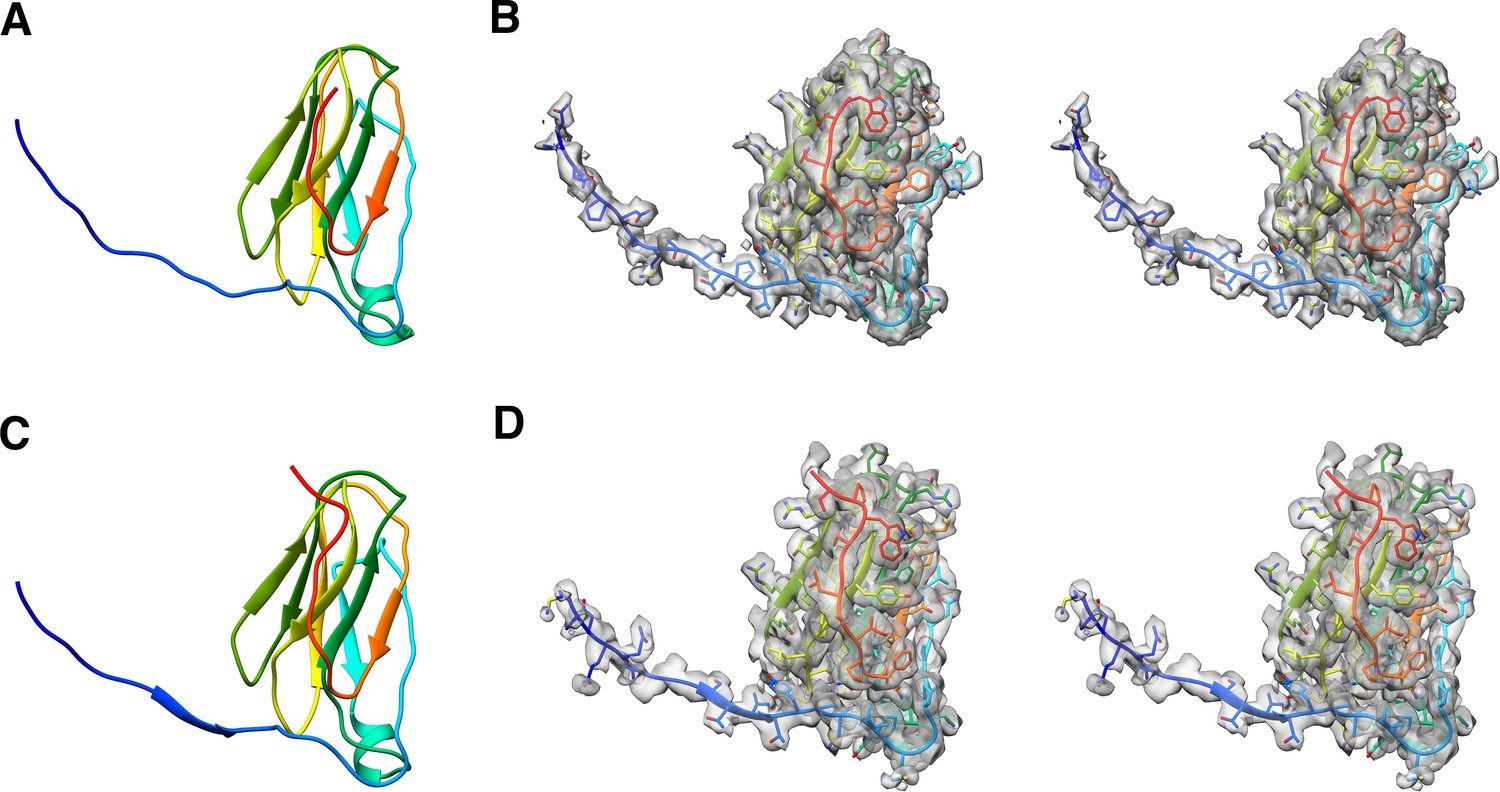
Modelled P31 protein and its map density fit.
(A) and (C) are the models of P31 and the N-terminal domain of P5 respectively. (B) and (D) are the stereo images of P31 and the N-terminal domain of P5 fitted into the CryoEM map respectively.
Figure 4—figure supplement 4

Comparison of residues from the N-terminal domain of P5 that contribute to the formation of the stalk and the lack of residues in P31 that contribute to the density.
(A) shows the overview of the map:model for the adjacent subunits of P31(yellow) and N-terminal domain of P5 (pink). Blue box highlights the region shown in (B). (B) shows the stereo view of the region highlighted in (A). The P5 residues Trp121 - Gly124 (shown as pink sticks) extend upwards filling the map density, but there is no contribution from P31 (shown as yellow sticks). Trp126 of P31 is the terminal residue.
Figure 4—figure supplement 5
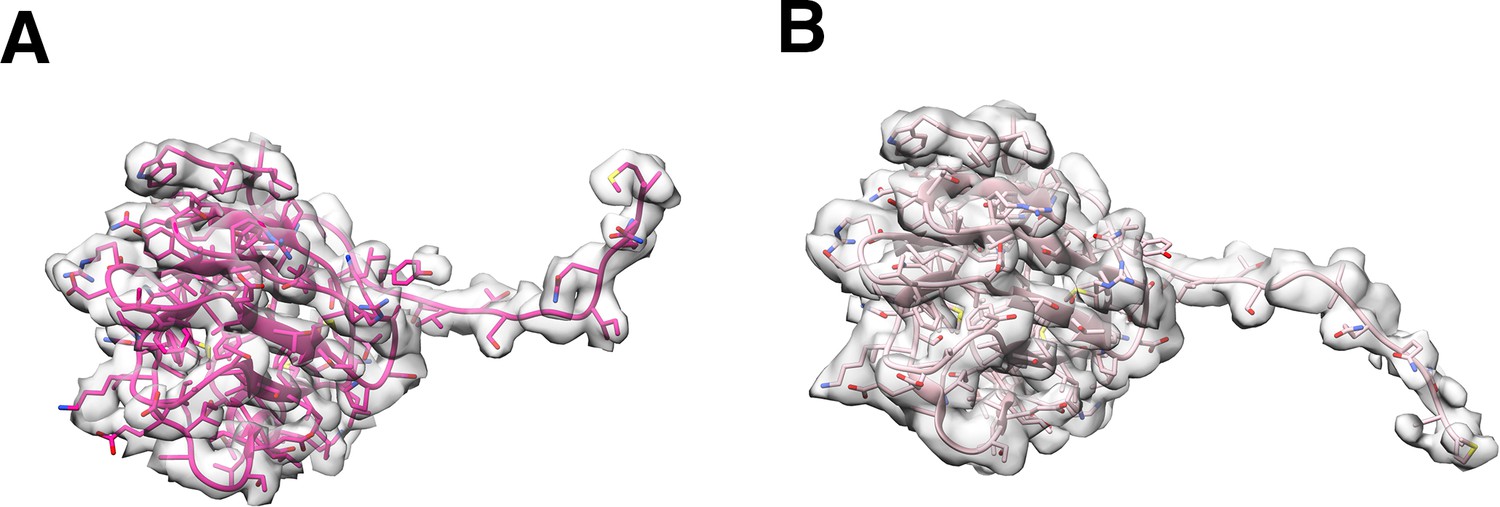
Two conformations of the P5 N-terminal base.
(A) The typical conformation showing the N-terminal region that hug the neighboring subunit of the penton base. (B) Special conformation of the N-terminal region that can be wedged in-between the P3 trimers. The low occupancy of the special N-terminal conformation leads to poor map intensities due to map sharpening. So, the unsharpened filtered maps are used in the above image to fit the models.
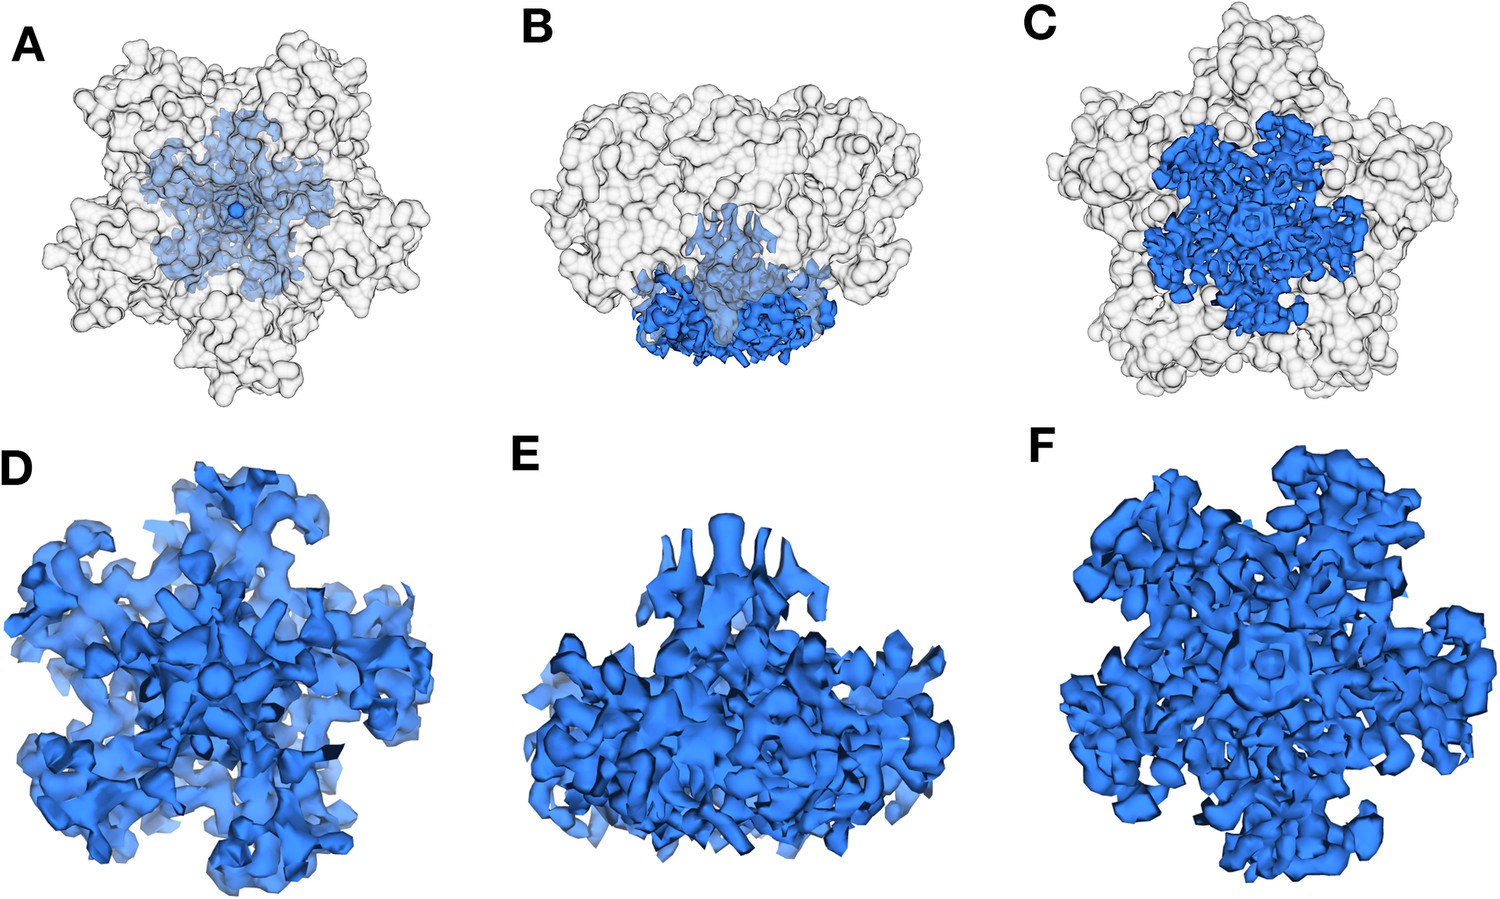
Figure 4—figure supplement 6
Reconstruction of the penton region.
(A) and (B) are maps generated by focused classification. (C) and (D) are maps generated by localized asymmetric reconstruction. The maps generated by both the methods show the heteropentameric nature of the penton with only three subunits showing the formation of stalk.
Figure 4—figure supplement 7
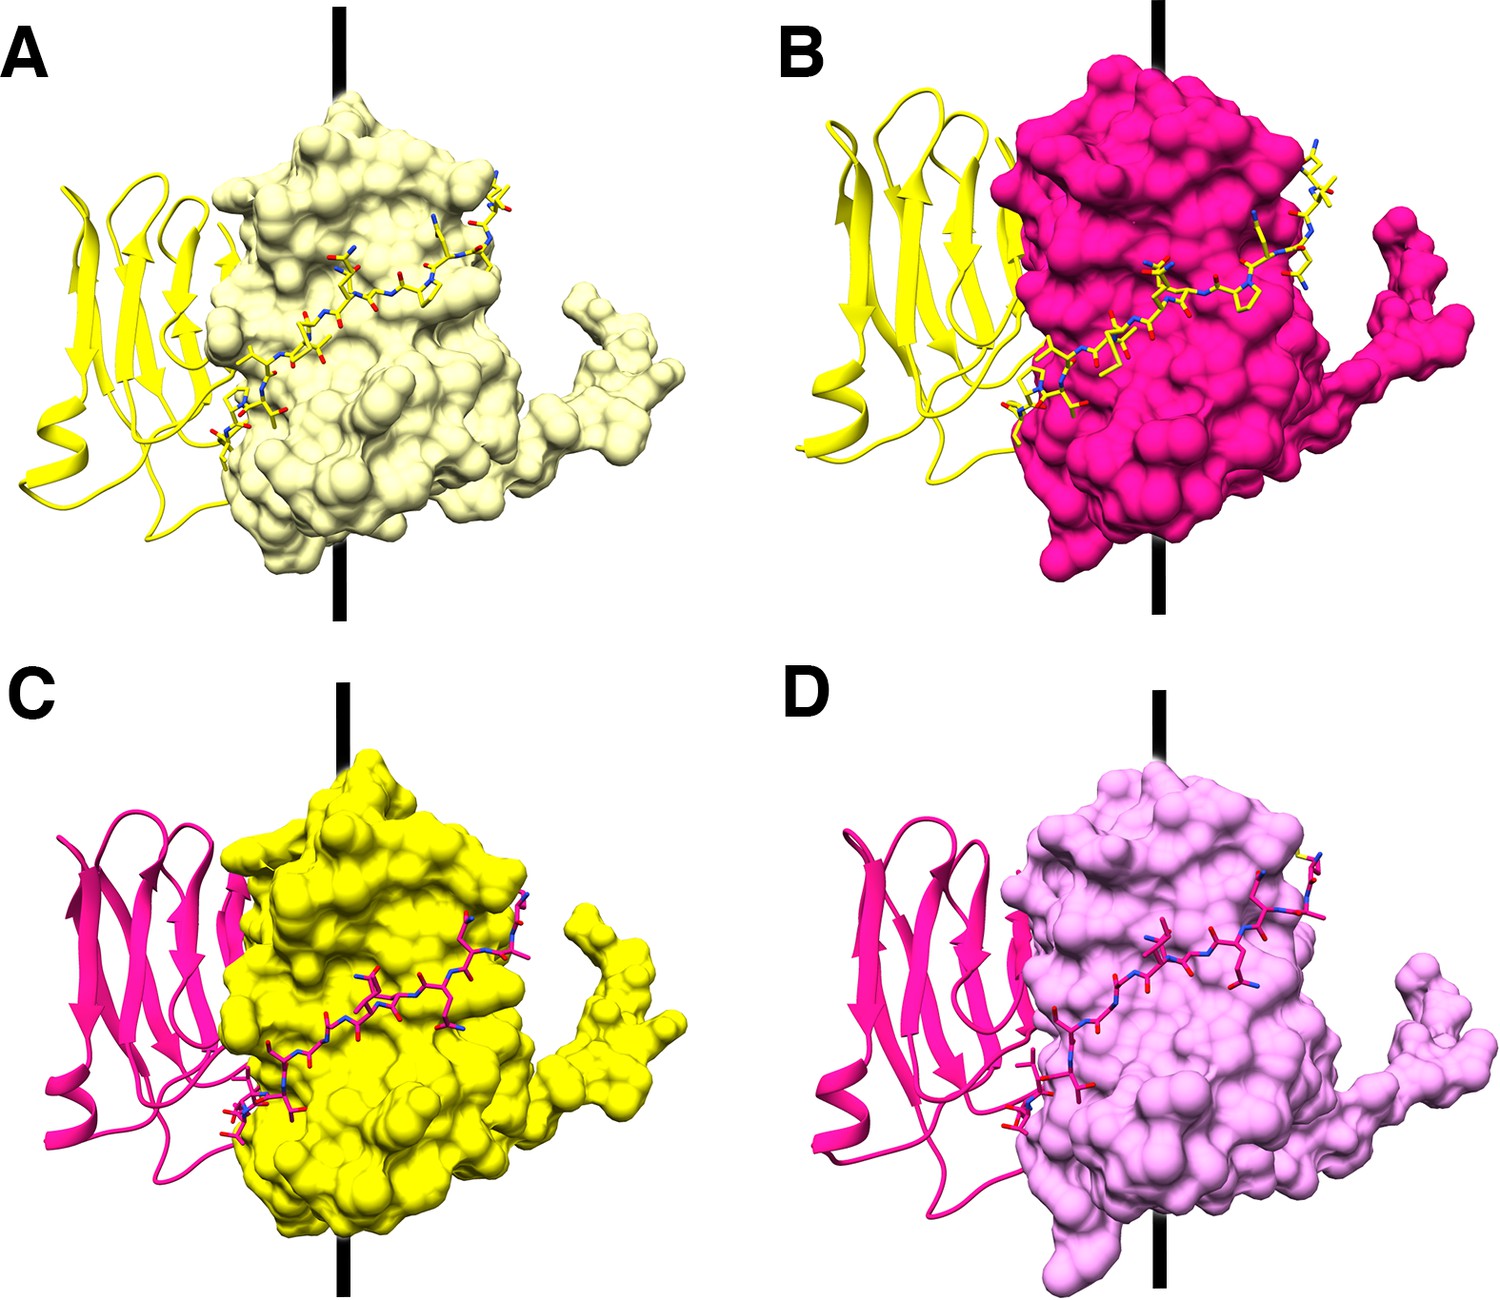
P31 and P5 residues stabilizing the heteropentameric penton.
As viewed from the side, (A–D) shows inter-digiting and hugging of the N-terminal residues of P31 (shown in shades of yellow) and P5 (shown in shades of pink) that stabilize the penton. The 5-fold axis is shown as a black bar.
Figure 5 with 3 supplements

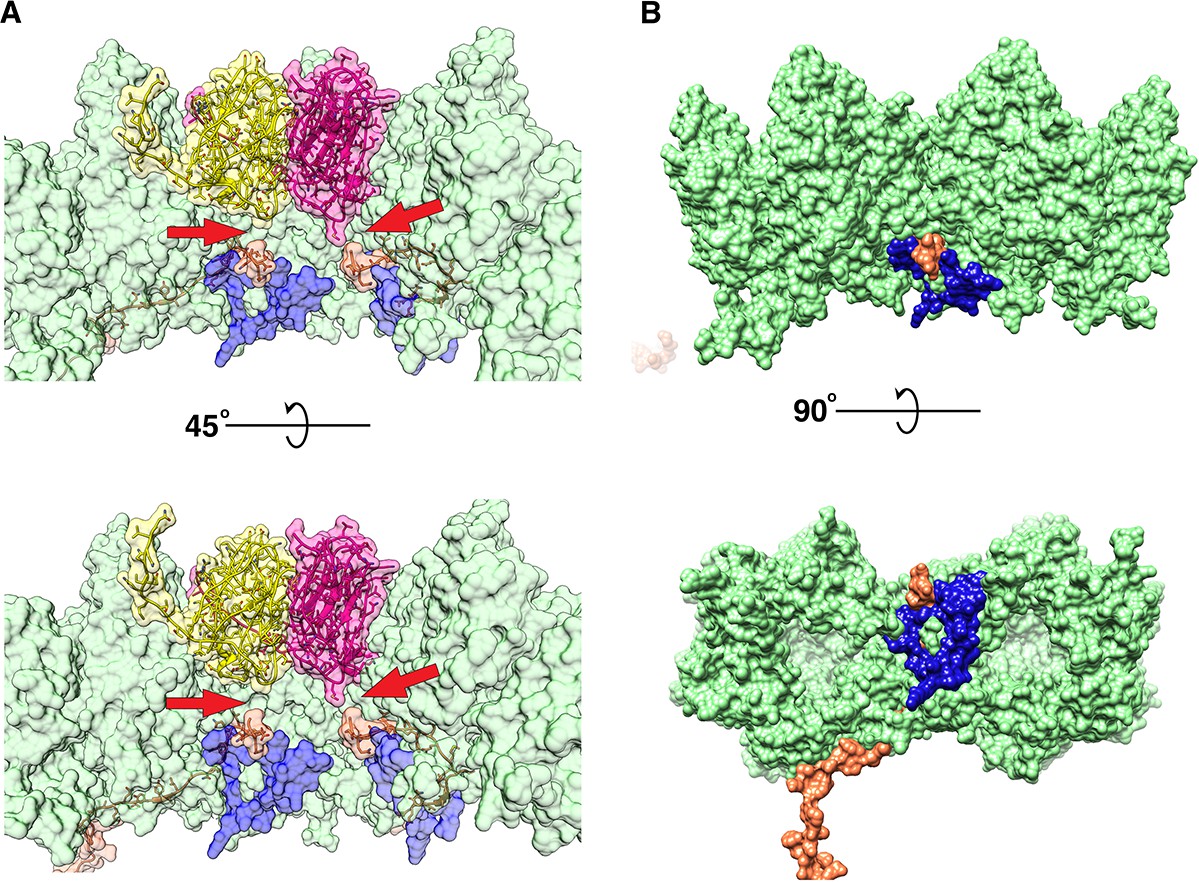
Monomeric P2 bound to P5.
Localized asymmetric reconstruction of the vertex complex showing the two protruding densities as gray surfaces where (A) is the side view and (B) is the top view. P2 (orange), P5 N-terminal base (bright pink) and P31 (yellow) structures fitted into these map densities. (C) Isolated CryoEM density that represents the P2 subunit. It represents the region highlighted by the blue box in (A) and (B). (D and E) Superimposed vertex maps with P2 bound (yellow) and without P2 bound (gray). In classes where P2 is bound to P5, the stalk region is nudged by ≈35.60 when compared to the classes where P2 is not bound to P5. Chimera: Volume Trace tool was used to place the red spheres in the density and Chimera: Measure Angles tool to determine the angles.
Figure 5—figure supplement 1

Maps generated by localized reconstruction of the sub-particles.
Top row shows all the maps that were generated by the localized reconstruction followed by initial 3D classification without image alignment and the bottom row shows the 45o tilted counterparts of the maps displayed in the top row. The map highlighted by the blue rectangle shows the class that was selected and the 3D classification was further refined with local image alignment. In this case, the resolution of the localized reconstruction was about 10 Å. No tight masks were used during the 3D classification to avoid any masking bias. This results in a lower resolution map but the maps are more reliable.
Figure 5—figure supplement 2
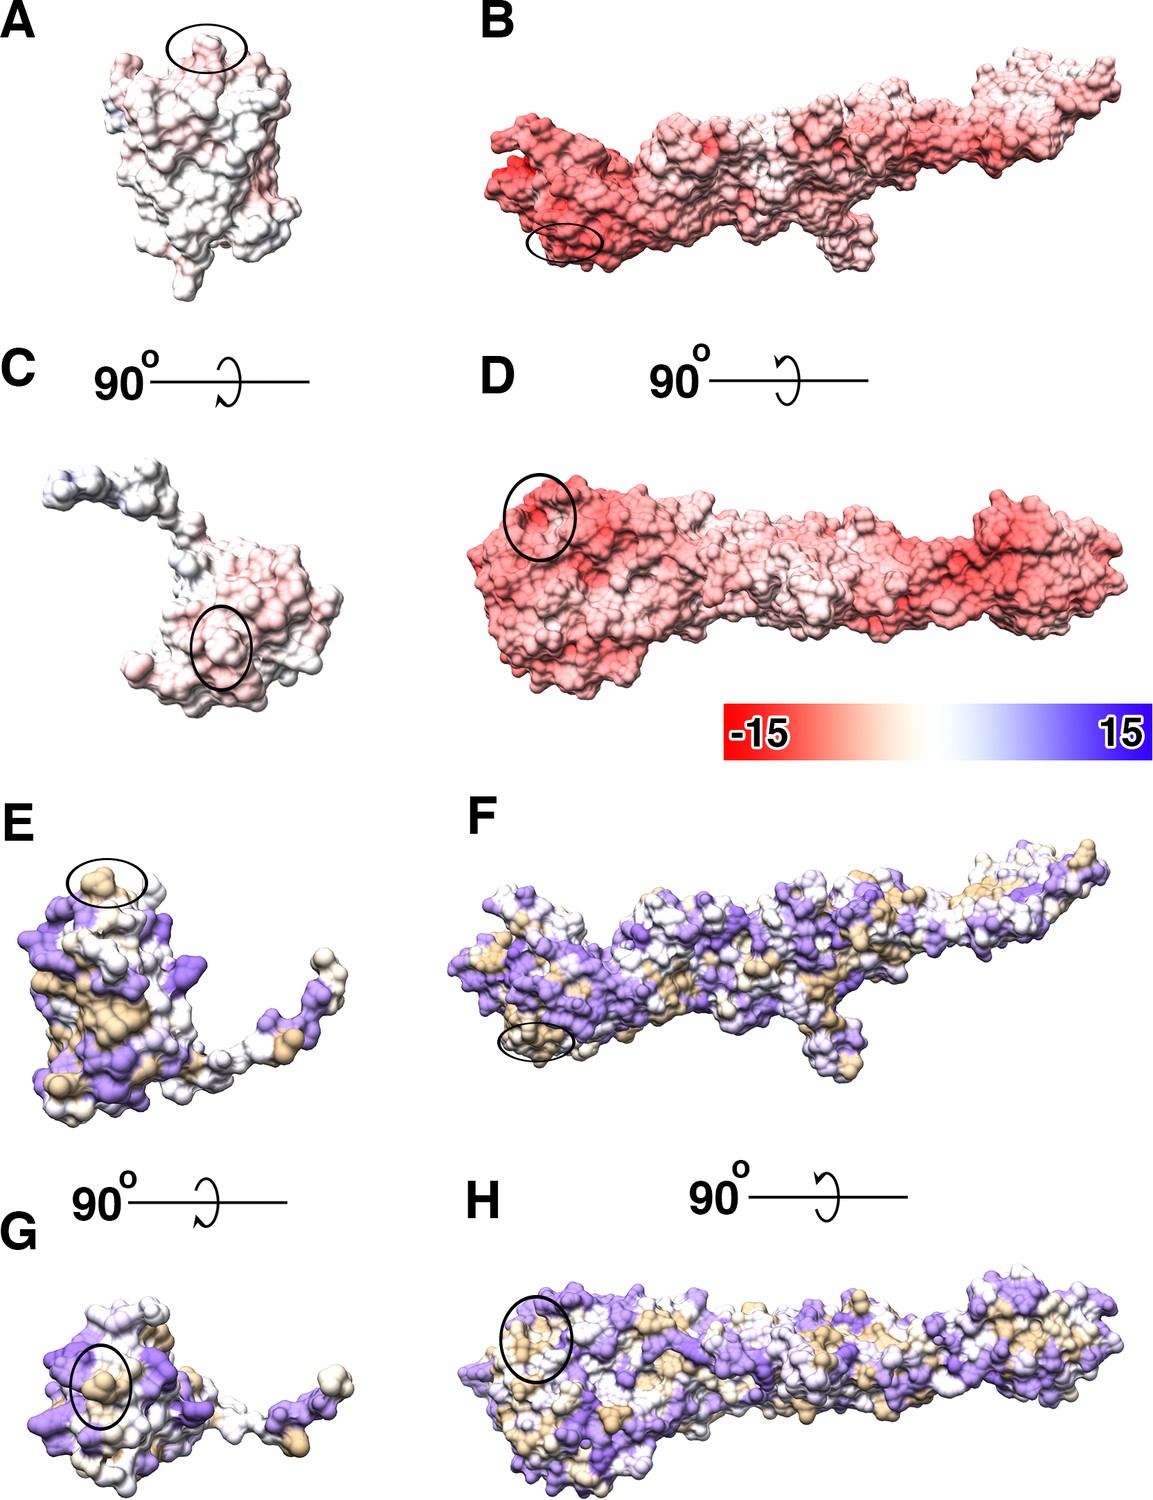
Distribution of electrostatic potential and hydrophobic surface in P2 and P5.
(A–D) Show the distribution of coulombic electrostatic potential on the surface of P2 and P5 where red represents negative potential, blue represents positive potential and white for neutral. (E–H) Show the distribution of hydrophobic residues on the surface of P2 and P5 (according to Kyte and Doolittle scale) where purple represents least hydrophobic residues, brown represents most hydrophobic residues and white for neutral residues. The highlighted regions on all the images shows the region of interaction between the N-terminal domain of P5 and P2.
Figure 5—video 1
Shows the distribution of coulombic electrostatic potential on the surface of P2 and P5 and the regions of interaction between the N-terminal domain of P5 and P2.
https://doi.org/10.7554/eLife.48496.022
Figure 6 with 5 supplements
P16 and P30 intractions close to the vertex.
(A) Shows the difference in interaction (pointed by red arrow) of the C-terminal Gly84 of P30 (orange) with P5 (bright pink), P31 (yellow) and P3 (green). The hydrophobic intraction of P30 with P5 is more obvious. (B) Shows the P3-P30-P16 complex (the view is similar to (A) but one copy of P16 and P30 are shown and the penton proteins are hidden), P16 (blue) locks the two adjacent P3 trimers (trimer 1)(green) and the P30 protein (orange).
Figure 6—figure supplement 1
Partial model of P16 and its map density fit.
(A) The model of P16. (B) The stereo images of the model fitted into the CryoEM map.
Figure 6—figure supplement 2
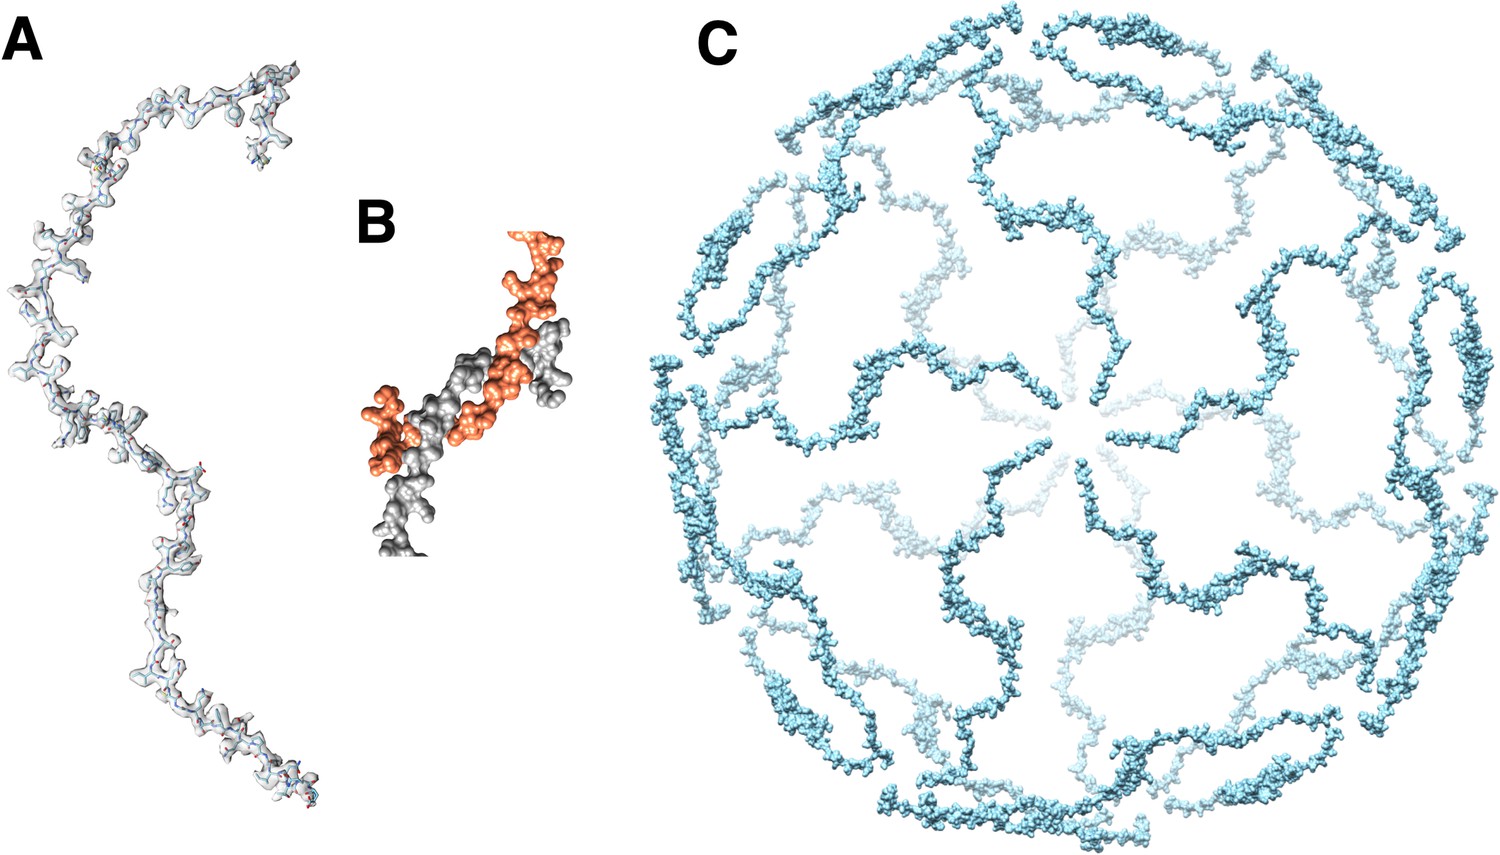
P30 network.
(A) P30 monomer and its fit into the CryoEM density map. (B) interlocked N-terminal hook forming the dimer that spans between two adjacent vertices. Residues Met1-Val32 are involved the formation of the N-terminal hook. (C) Complete P30 cage that stabilizes the trisymmetrons and in turn the whole particle.
Figure 6—figure supplement 3
Difference density map showing the disordered region under the penton.
(A–C) Difference density map (blue) at the vertex region where the densities of the penton (P31 and P5) are shown in transparent gray. (A, D), (B, E) and (C, F) show the top, side and the bottom view of the difference density map, respectively.
Figure 6—figure supplement 4
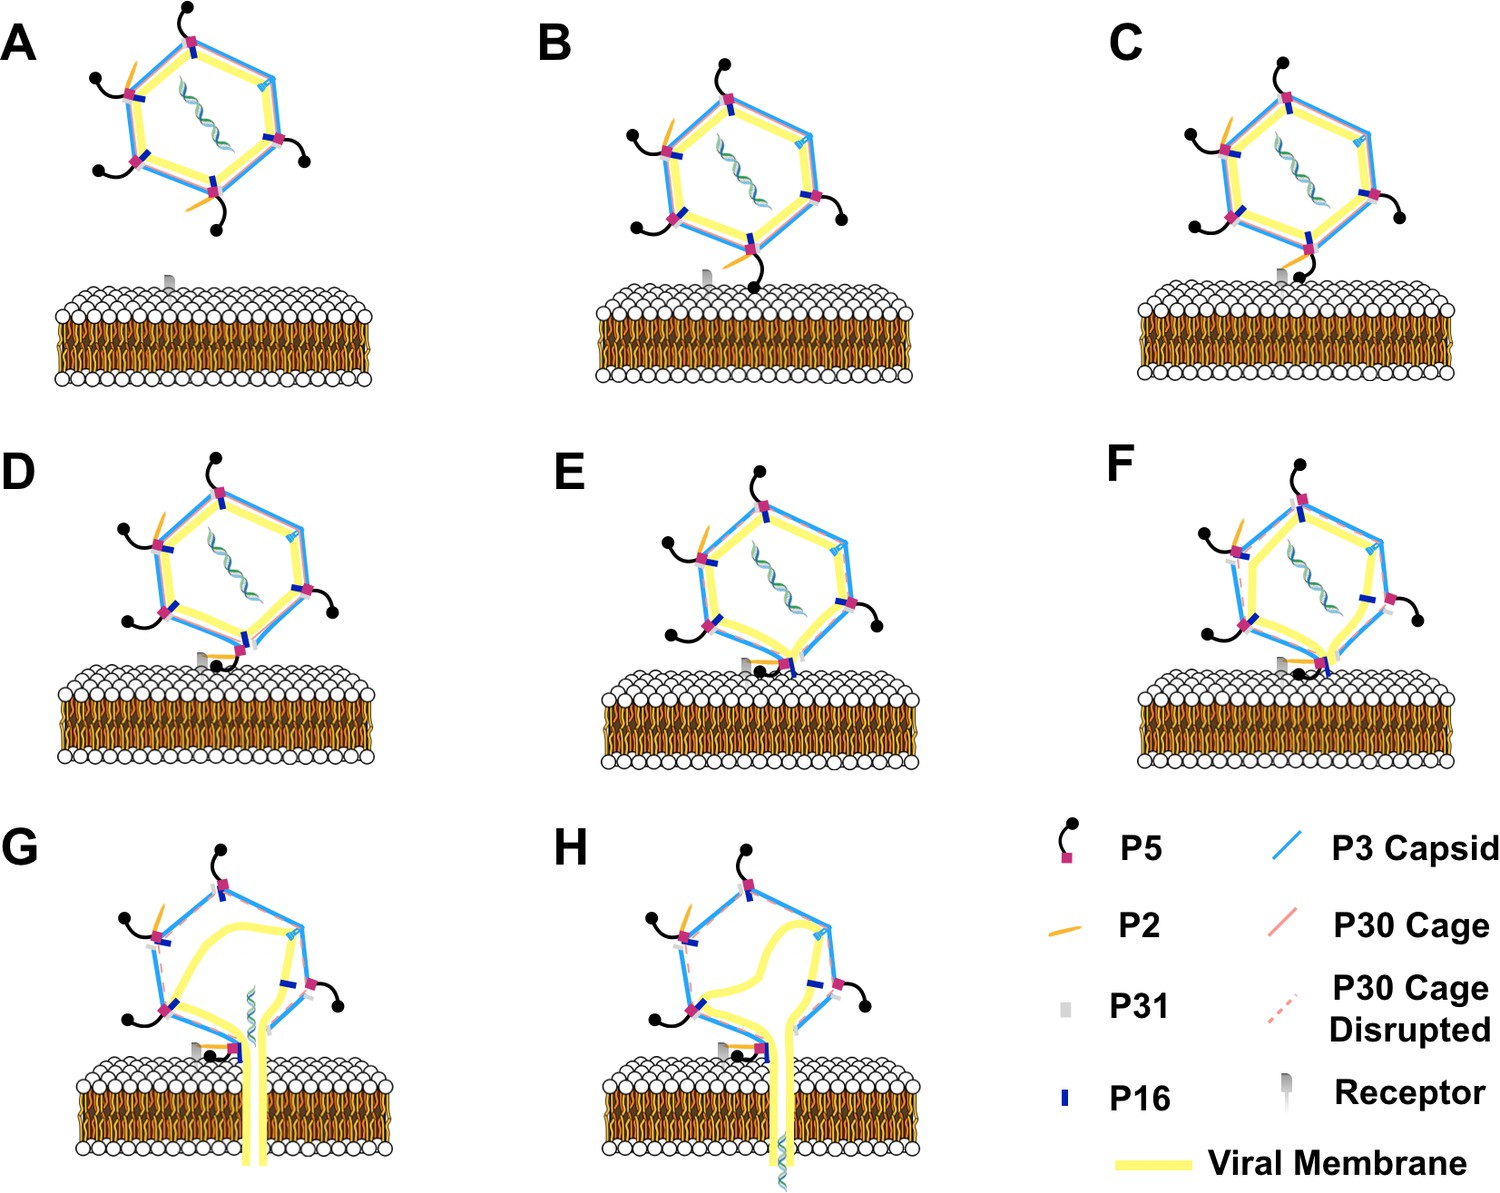
Schematic of the infection mechanism model of bacteriophage PR772.
(A) Shows bacteriophage PR772 approaching the host membrane with the receptor. (B) The trimeric knob domain of P5 recognizes the host. The binding of the trimeric knob of P5 is transient. (C) High-affinity P2 binding to the surface receptor stabilizes the host binding. The binding is irreversible and attaches the virus to the host membrane. (D) P2 binding disturbs of the vertex complex by pulling the P5. (E) The disordered vertex complex disrupts the interactions between P5 and P30 resulting in a cascade that leads to the disruption of the P30 cage that stabilizes the viral capsid. (F) Disrupted P30 cage, destabilizes other adjacent vertices and the interactions that anchor the viral membrane. (G) P16 anchors into the host membrane and facilitates the formation of the membranous tube. (H) Destabilized viral membrane collapses and the dsDNA is delivered into the host.
Figure 6—video 1
Movie showing the P3-P30-P16 complex.
https://doi.org/10.7554/eLife.48496.028
Figure 7
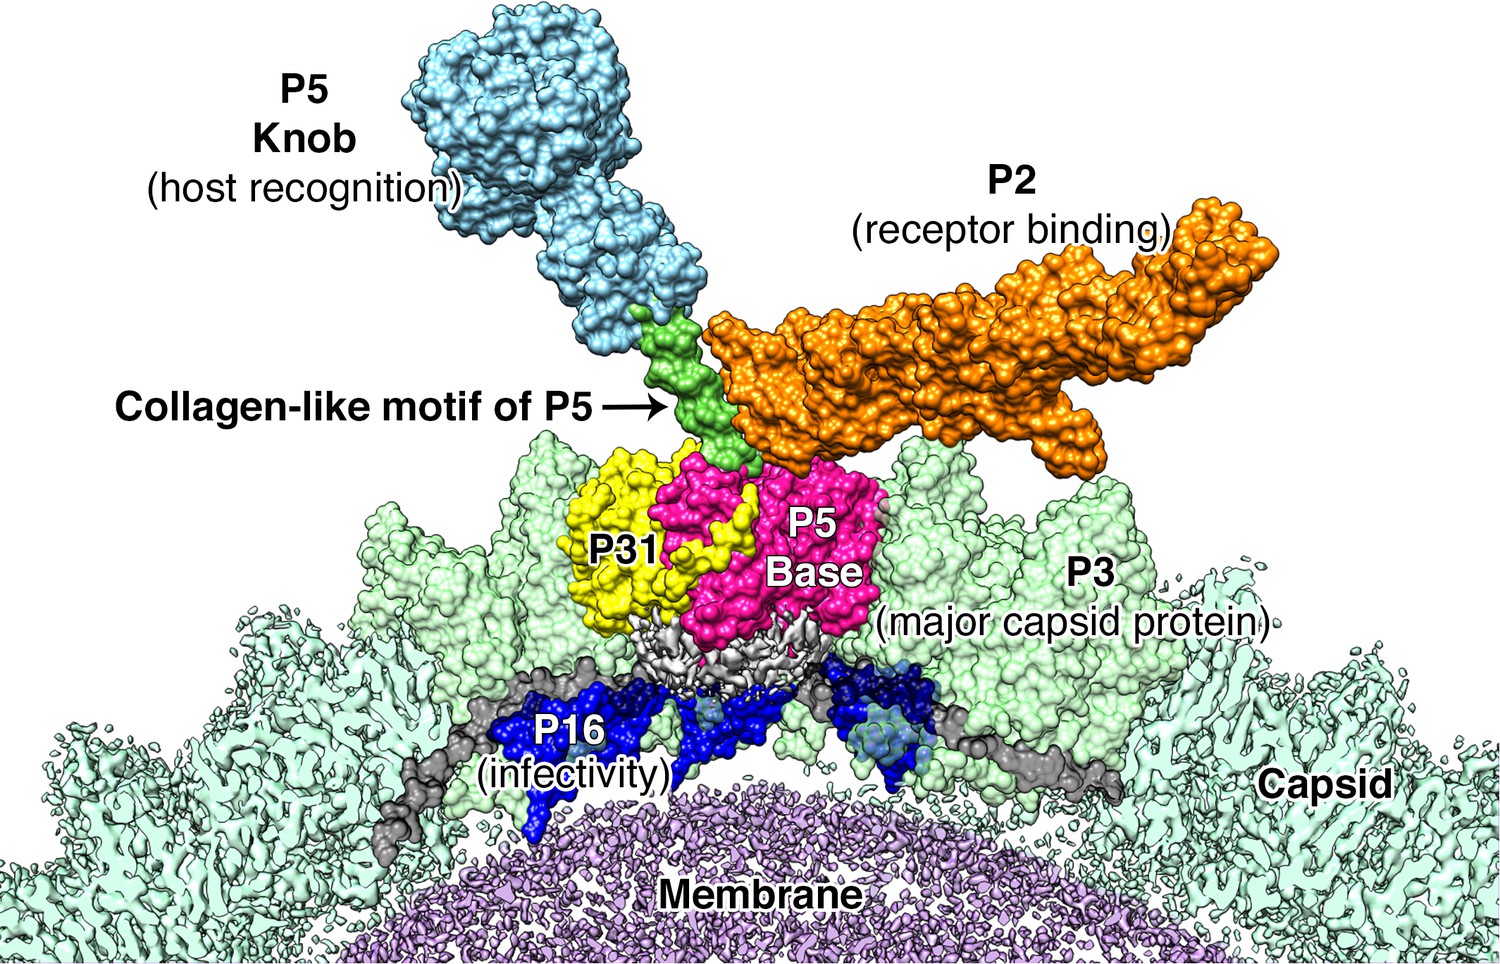
Proposed model for the vertex region.
Shows the structural arrangement of P5 (P5 N-terminal base shown in bright pink, Collagen-like motif of P5 shown in bright green and P5 Knob is shown in pale blue), P31 (yellow) and P2 (orange) that form the vertex. The region below the vertex complex (shown as a gray density) is the unorganized/unmodeled region that links the surrounding P16 (blue) and the P30 (black). Capsid is shown in pale green (raw CryoEM map is labeled as Capsid and the modeled region is labeled as P3). The lipid membrane is shown in purple.
Tables
Table 1
Data collection, Processing and Model refinement parameters.
https://doi.org/10.7554/eLife.48496.003| Parameter | Value |
|---|---|
| Data collection | |
| Voltage (kV) | 300 |
| Magnification (x) | 130000 |
| Å/pix | 1.06 |
| Energy Filter with Slit (eV) | 20 |
| Frames per Micrograph | 40 |
| Total Dose (e- /Å2) | 40 |
| Micrographs | 3220 |
| Defocus Range (μm) | 0.8–2.6 |
| Data Processing | |
| Micrographs | 3200 |
| Frames used | 4–40 |
| Å/pix | 1.06 |
| Particles (Total) | 46348 (56275) |
| Symmetry Applied | I4 |
| Overall Resolution@FSC0.143 (Å) | 2.75* |
| B-factor (Å2) | −104.93* |
| Model Refinement | |
| Composition | |
| Chains | 19 |
| Atoms | 41731 (Hydrogens: 0) |
| Refinement | |
| CCmask | 0.7961 |
| CCvolume | 0.7941 |
| ADP (B-factors) | |
| Iso/Aniso | 41731/0 |
| Mean | 101.95 |
| RMS deviations | |
| Bonds (Å) | 0.006 |
| Angles (O) | 0.806 |
| EMRinger Score | 5.40 |
| MolProbity validation | |
| Clash score, all atoms | 3.35 |
| MolProbity score | 1.57 |
| Rotamer Outliers (%) | 0.16 |
| Ramachandran | |
| Favoured (%) | 93.04 |
| Allowed (%) | 6.83 |
| Outliers (%) | 0.13 |
-
* Calculated by RELION
Additional files
-
Supplementary file 1
Protein traces in the PR772 model and comparison of RMSD of different protein subunits from PR772 and PRD1, from a similar region of the map using Chimera and SuperPose.
- https://doi.org/10.7554/eLife.48496.030
-
Supplementary file 2
Preliminary results for the whole particle asymmetric reconstruction using symmetry relaxation in EMAN2 of the wild type PR772.
- https://doi.org/10.7554/eLife.48496.031
-
Supplementary file 3
Flowchart of the 3D reconstruction of the icosahadrally averaged PR772 map.
- https://doi.org/10.7554/eLife.48496.032
-
Supplementary file 4
Mtriage summary of the map quality analysis.
- https://doi.org/10.7554/eLife.48496.033
-
Transparent reporting form
- https://doi.org/10.7554/eLife.48496.034
Download links
A two-part list of links to download the article, or parts of the article, in various formats.
Downloads (link to download the article as PDF)
Open citations (links to open the citations from this article in various online reference manager services)
Cite this article (links to download the citations from this article in formats compatible with various reference manager tools)
Electron cryo-microscopy of bacteriophage PR772 reveals the elusive vertex complex and the capsid architecture
eLife 8:e48496.
https://doi.org/10.7554/eLife.48496


