Olfactory connectivity mediates sleep-dependent food choices in humans
- Northwestern University, United States
- San Diego State University, United States
- University of Pennsylvania, United States
Figures
Figure 1 with 4 supplements
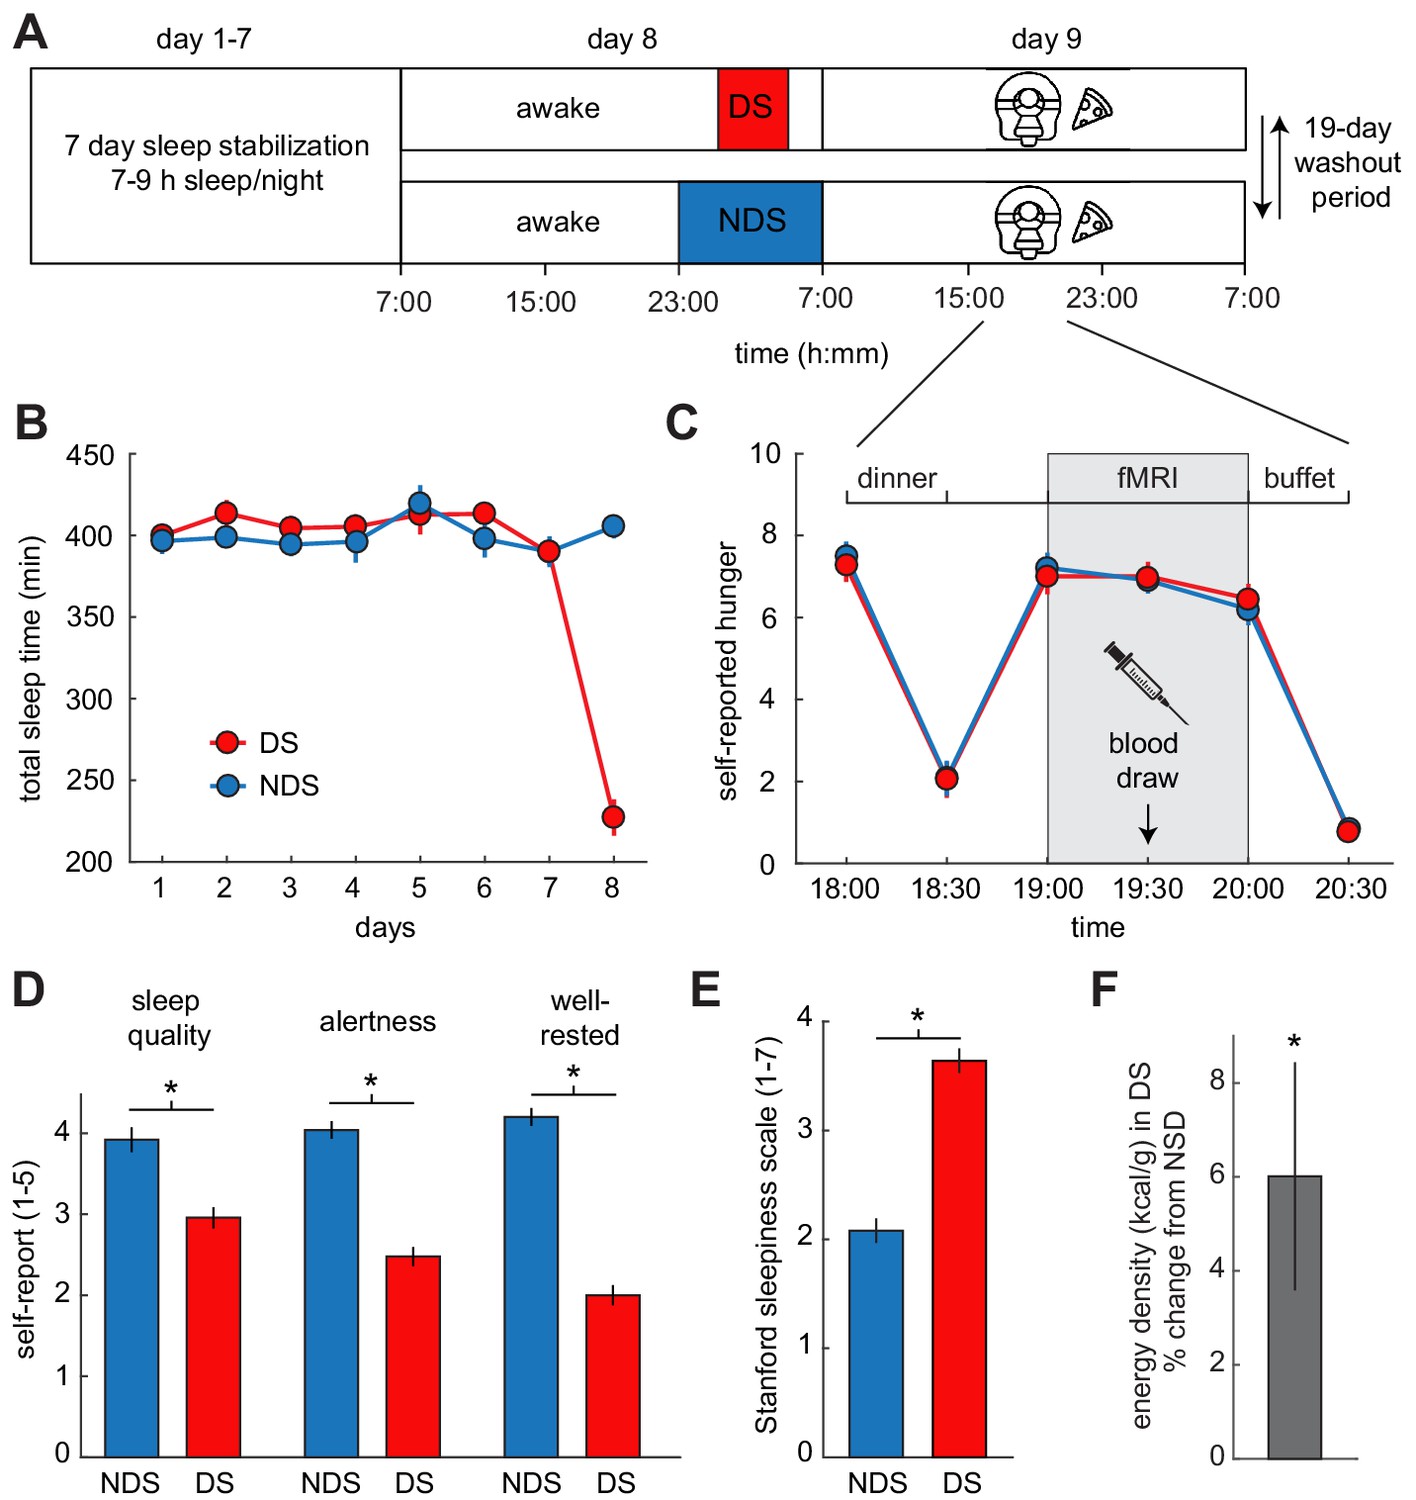
Experimental design and behavioral effects of sleep deprivation.
(A) Study protocol for deprived sleep (DS) and non-deprived sleep (NDS) sessions with a 19 day washout period. Dinner was served at 6 pm, the fMRI session started at 7 pm, and the ad libitum buffet started after 8 pm. (B) Actigraphy data showed no differences in sleep duration during the sleep stabilization phase, but confirmed a significant difference between the two sleep conditions during the night of sleep manipulation (day 8). (C) Ratings of hunger on a visual analog scale showed significant effects of time, but no sleep-dependent effects (time-by-sleep ANOVA, main effect time, F5,120=70.86, p=3.63×10⁻³⁴, main effect sleep, F1,24=0.06, p=0.81, interaction F5,120=0.24, p=0.95). (D) In the DS compared to the NDS session, participants reported lower sleep quality (DS 2.96 ± 0.19, NDS 3.96 ± 0.18, T22=−3.98, p=6.38×10⁻⁴), reduced alertness (DS 2.49 ± 0.14, NDS 4.09 ± 0.14, T22=−8.66, p=1.55×10⁻⁸), and felt less well-rested (DS 2.00 ± 0.14, NDS 4.17 ± 0.17, T22=−9.72, p=2.01×10⁻⁹). (E) Stanford Sleepiness Scale scores were higher in the DS session (DS 3.64 ± 0.24, NDS 2.08 ± 0.19, T24 = 6.96, p=3.40×10⁻⁷). (F) Energy-density (kcal/g) of food consumed after scanning at the ad libitum buffet, expressed as % change from NDS baseline. *p<0.05. Data are presented as mean ± SEM.
-
Figure 1—source data 1
Relates to panel (B).
- https://doi.org/10.7554/eLife.49053.008
-
Figure 1—source data 2
Relates to panel (C).
- https://doi.org/10.7554/eLife.49053.009
-
Figure 1—source data 3
Relates to panel (D).
- https://doi.org/10.7554/eLife.49053.010
-
Figure 1—source data 4
Relates to panel (E).
- https://doi.org/10.7554/eLife.49053.011
-
Figure 1—source data 5
Relates to panel (F).
- https://doi.org/10.7554/eLife.49053.012
Figure 1—figure supplement 1
Actigraphy data.
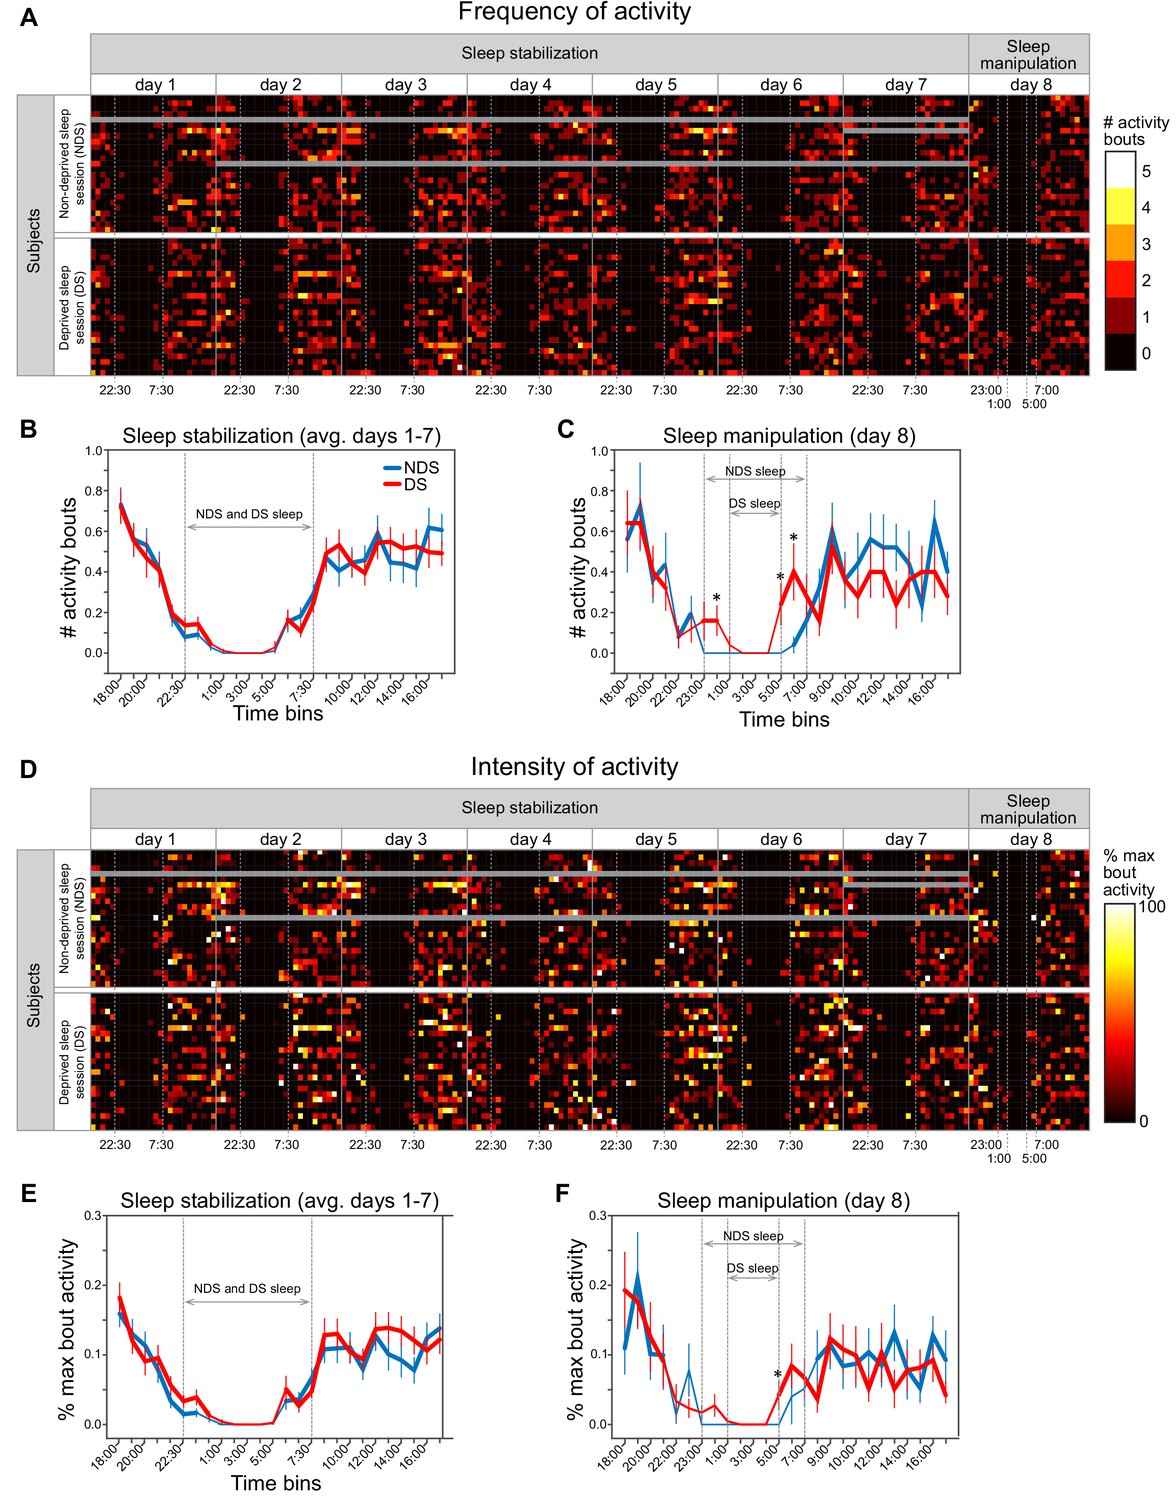
(A) Heat maps show individually scored ActiGraph activity data for each subject (rows) in successive time bins (columns) spanning the 7 day sleep stabilization phase and the 1 day sleep manipulation. All time bins correspond to 1 hr of activity, with the exception that time points starting at 7:00, 7:30, 22:00, 22:30 correspond to 30 min of activity. Frequency of activity is calculated as the total number of Freedson bouts of activity with each time bin. Dotted vertical lines in the sleep stabilization phase demarcate the beginning (22:30) and end (7:30) of the instructed sleep period for both the non-deprived sleep (NDS) and deprived sleep (DS) sessions. Dotted vertical lines in the sleep manipulation phase indicate the instructed sleep for NDS sessions (23:00-7:00) and DS sessions (1:00-5:00). Gray data points indicate missing data. (B) There were no differences between NDS and DS sessions in the number of activity bouts in any time bin, averaged across the 7 days of the sleep stabilization period (P’s > 0.091, paired t-tests between NDS and DS sessions on each time bin). Thicker lines in this and subsequent panels indicate time bin in which average number of bouts was significantly greater than zero (P’s < 0.05, one-sample t-tests). Error bars in this and subsequent panels represent within-subject SEM (C) On the day of sleep manipulation, subjects in the SD session had significantly greater number of activity bouts than those in the NDS session at three time points (0:00-1:00, p=0.043; 5:00-6:00, p=0.031; 6:00-7:00, p=0.017, paired t-tests). (D) Heat maps show intensity of activity averaged across activity bouts within each time bin, calculated as the percentage of the maximum activity count for each subject and testing session (i.e., divided by the maximum activity count calculated separately in each row). (E) There were no differences between NDS and DS sessions in the %-maximum bout activity in any time bin, averaged across the 7 days of the sleep stabilization phase (P’s > 0.057). (F) On the day of sleep manipulation, subjects in the DS session had significantly greater %-maximum bout activity in the 5:00-6:00 time bin (p=0.050, paired t-test).
-
Figure 1—figure supplement 1—source data 1
Relates to panel (A).
- https://doi.org/10.7554/eLife.49053.013
-
Figure 1—figure supplement 1—source data 2
Relates to panel (B).
- https://doi.org/10.7554/eLife.49053.014
-
Figure 1—figure supplement 1—source data 3
Relates to panel (C).
- https://doi.org/10.7554/eLife.49053.015
-
Figure 1—figure supplement 1—source data 4
Relates to panel (D).
- https://doi.org/10.7554/eLife.49053.016
-
Figure 1—figure supplement 1—source data 5
Relates to panel (E).
- https://doi.org/10.7554/eLife.49053.017
-
Figure 1—figure supplement 1—source data 6
Relates to panel (F).
- https://doi.org/10.7554/eLife.49053.018
Figure 1—figure supplement 2
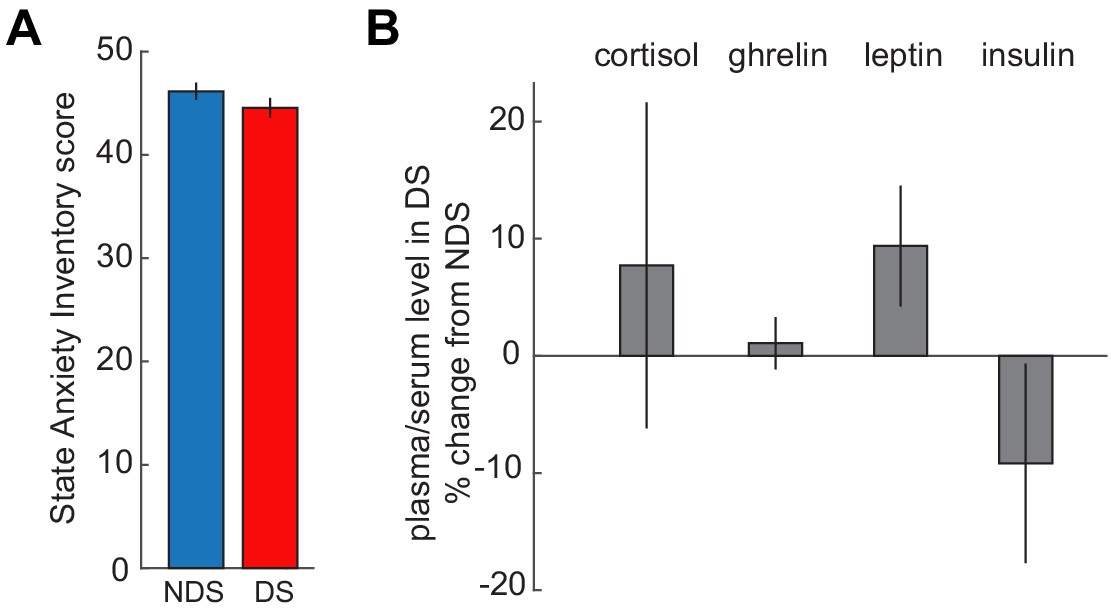
No effects of sleep deprivation on anxiety and hormones.
(A) State Anxiety Inventory scores did not differ between DS and NDS sessions (DS: 46.16 ± 0.834, NDS: 44.56 ± 0.951; T24=−1.49, p=0.148). (B) Percent changes in levels of appetite-regulating and stress hormones from NDS baseline were not altered by sleep deprivation (serum cortisol: 7.72 ± 13.91% change from NDS, T24 = 0.70, p=0.584; plasma ghrelin: 1.08 ± 2.23% change from NDS, T24 = 0.49, p=0.63; plasma leptin: 9.38 ± 5.15% change from NDS, T24 = 1.82, p=0.081; plasma insulin: −9.17 ± 8.69% change from NDS, T23=−1.06, p=0.301). Insulin samples from one participant were excluded because changes were >4 xSTD above the group average. Data are represented as mean ± SEM.
-
Figure 1—figure supplement 2—source data 7
Relates to panel (A).
- https://doi.org/10.7554/eLife.49053.019
-
Figure 1—figure supplement 2—source data 8
Relates to panel (B).
- https://doi.org/10.7554/eLife.49053.020
Figure 1—figure supplement 3
Odor pleasantness and intensity ratings, and respiratory responses during fMRI.
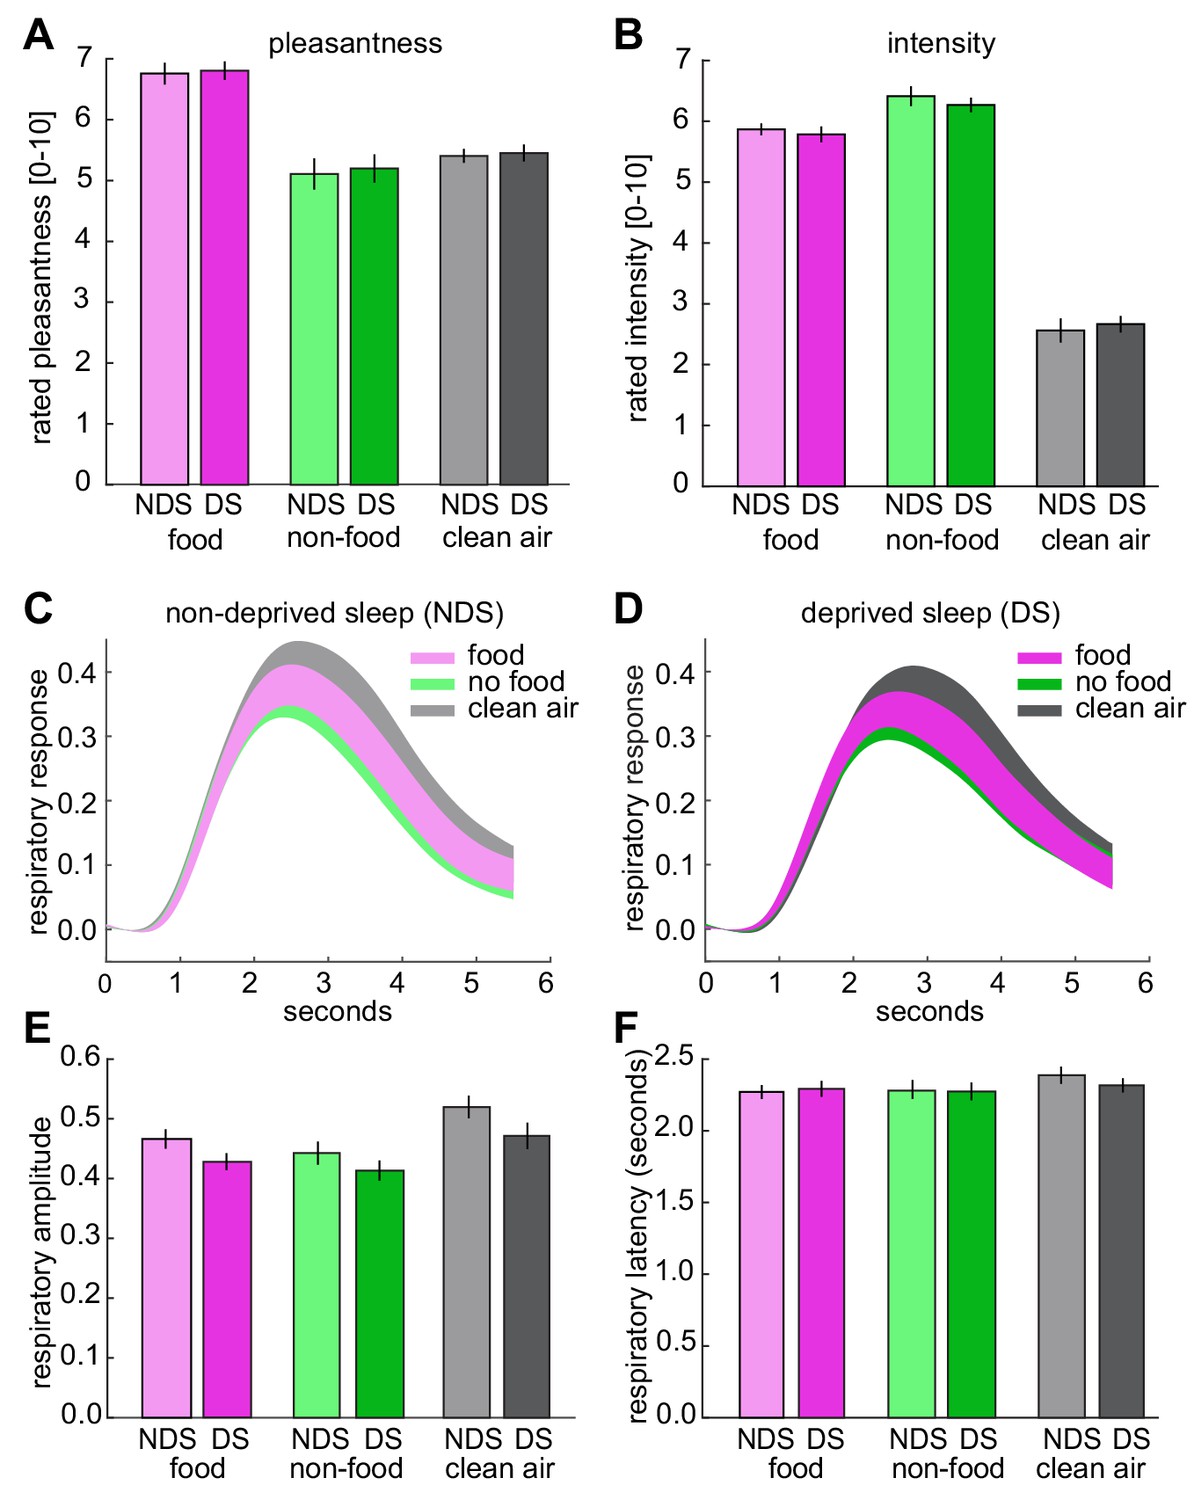
(A) No sleep-dependent differences in rated odor pleasantness were observed (sleep-by-odor ANOVA; main effect sleep, F1,24=0.54, p=0.470; main effect odor, F2,48=17.08, p=2.50×10⁻⁶; sleep-by-odor interaction, F2,48=0.02, p=0.980). (B), No sleep-dependent differences in rated odor intensity were observed (main effect sleep, F1,24=0.133, p=0.718; main effect odor, F2,48=201.75, p=1.70×10⁻²⁴; sleep-by-odor interaction, F2,48=0.47, p=0.625). (C) Respiratory responses (mean ± SEM) to different odors in the NDS session. (D) Respiratory responses (mean ± SEM) to different odors in the DS session. (E) No sleep-dependent differences in respiratory amplitude were observed (sleep-by-odor ANOVA; main effect sleep, F1,24=1.37, p=0.245; main effect odor, F1,24=19.94, p=4.97×10⁻⁷; odor-by-sleep interaction, F2,48=1.18, p=0.317). (F) No sleep-dependent differences in respiratory latency were observed (sleep-by-odor ANOVA; main effect sleep, F1,24=0.05, p=0.831; main effect odor, F2,48=2.56, p=0.09; sleep-by-odor interaction, F2,48=0.460, p=0.634). There were also sleep-depended effects on amplitude and latency when comparing odor (collapsed across food and non-food odors) vs. clean air trials (sleep-by-odor ANOVA on amplitude; main effect sleep F1,24=1.45, p=0.240; main effect odor F1,24=22.41, p<0.0001; sleep-by-odor interaction, F1,24=1.24, p=0.277; sleep-by-odor ANOVA on latency; main effect sleep F1,24=0.14, p=0.715; main effect odor F1,24=3.50, p=0.074; sleep-by-odor interaction, F1,24=0.53, p=0.474). The absence of significant interactions in perceptual ratings and respiratory responses shows that the observed sleep-dependent differences in odor information in piriform cortex (Figure 3) and piriform connectivity (Figure 5) were not confounded (or driven) by differences in odor pleasantness/intensity or respiratory activity. Data are represented as mean ±SEM.
-
Figure 1—figure supplement 3—source data 9
Relates to panel (A).
- https://doi.org/10.7554/eLife.49053.021
-
Figure 1—figure supplement 3—source data 10
Relates to panel (B).
- https://doi.org/10.7554/eLife.49053.022
-
Figure 1—figure supplement 3—source data 11
Relates to panel (C).
- https://doi.org/10.7554/eLife.49053.023
-
Figure 1—figure supplement 3—source data 12
Relates to panel (D).
- https://doi.org/10.7554/eLife.49053.024
-
Figure 1—figure supplement 3—source data 13
Relates to panel (E).
- https://doi.org/10.7554/eLife.49053.025
-
Figure 1—figure supplement 3—source data 14
Relates to panel (F).
- https://doi.org/10.7554/eLife.49053.026
Figure 1—figure supplement 4
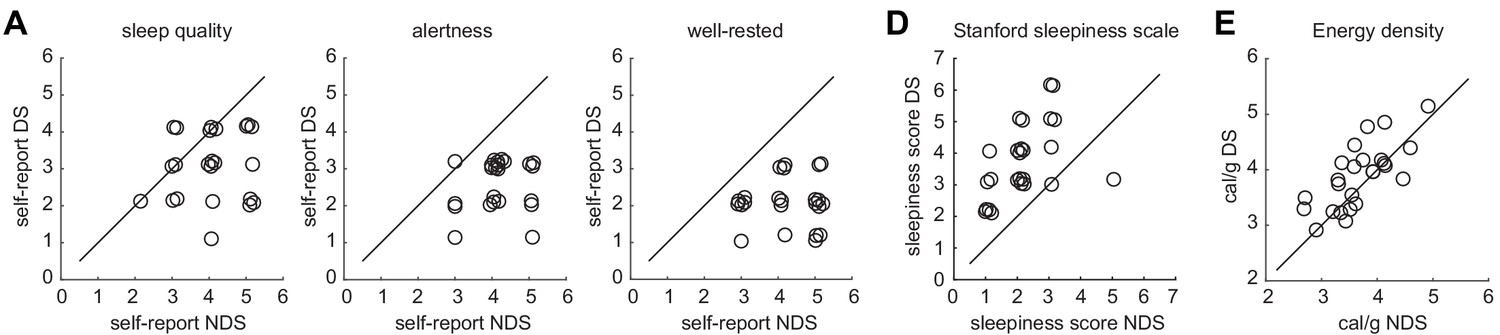
Individual data points for sleep quality, sleepiness, and energy-dense food choices.
(A) Self-report ratings of sleep quality (left) alertness (middle), and well-restedness (right) collected in the morning after the night of sleep manipulation in the NDS and DS session. (B) Stanford sleepiness scale scores collected upon arrival at the imaging center in the NDS and DS session. (C) Energy density (cal/g) of food consumed at the post-scanning buffet in the NDS and DS session. Circles represent individual data points and overlapping data points have been slightly shifted to reduce overlap. Diagonal represents identity line.
-
Figure 1—figure supplement 4—source data 15
Relates to panel (A).
- https://doi.org/10.7554/eLife.49053.027
-
Figure 1—figure supplement 4—source data 16
Relates to panel (B).
- https://doi.org/10.7554/eLife.49053.028
-
Figure 1—figure supplement 4—source data 17
Relates to panel (C).
- https://doi.org/10.7554/eLife.49053.029
Figure 2 with 1 supplement
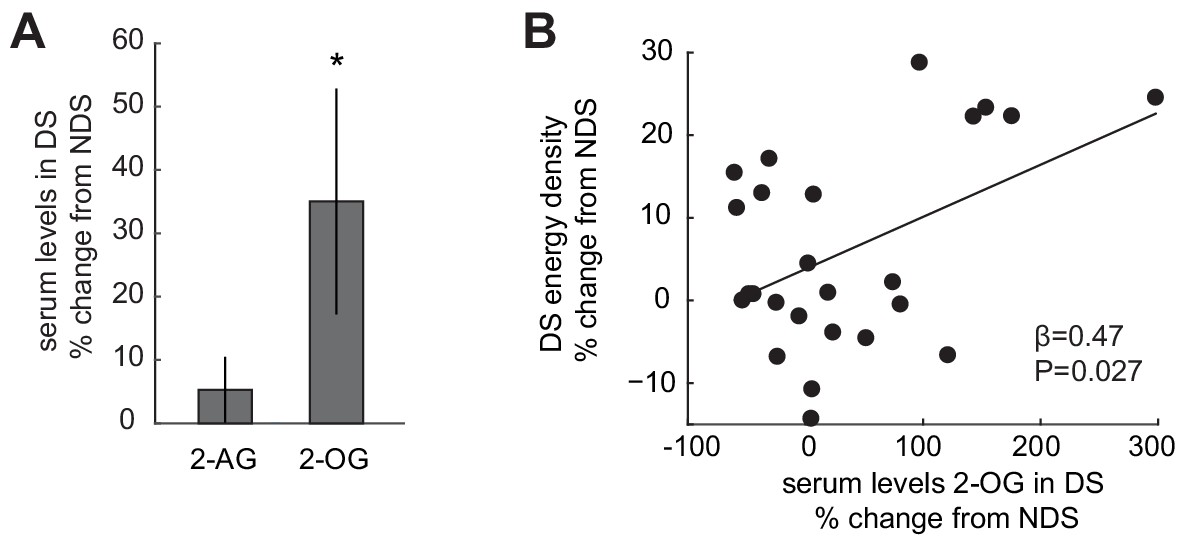
Sleep-dependent changes in the ECS correlate with energy-dense food choices.
(A) Relative changes in 2-AG and 2-OG levels in the SD condition (% change from NDS baseline). Data are presented as mean ± SEM. (B) Percent changes in 2-OG in DS from NDS baseline correlate positively with % changes in energy density of food consumed at the ad libitum buffet in the DS condition relative to NDS baseline (robust regression, β = 0.47, p=0.027).
-
Figure 2—source data 1
Relates to panel (A).
- https://doi.org/10.7554/eLife.49053.032
-
Figure 2—source data 2
Relates to panel (B).
- https://doi.org/10.7554/eLife.49053.033
Figure 2—figure supplement 1

Individual data points for 2-AG and 2-OG.
(A) Serum levels of 2-AG and (B) 2-OG collected during fMRI scanning in the NDS and DS session. Circles represent individual data points and diagonal represents identity line.
-
Figure 2—figure supplement 1—source data 1
Relates to panel (A).
- https://doi.org/10.7554/eLife.49053.034
-
Figure 2—figure supplement 1—source data 2
Relates to panel (B).
- https://doi.org/10.7554/eLife.49053.035
Figure 3 with 2 supplements
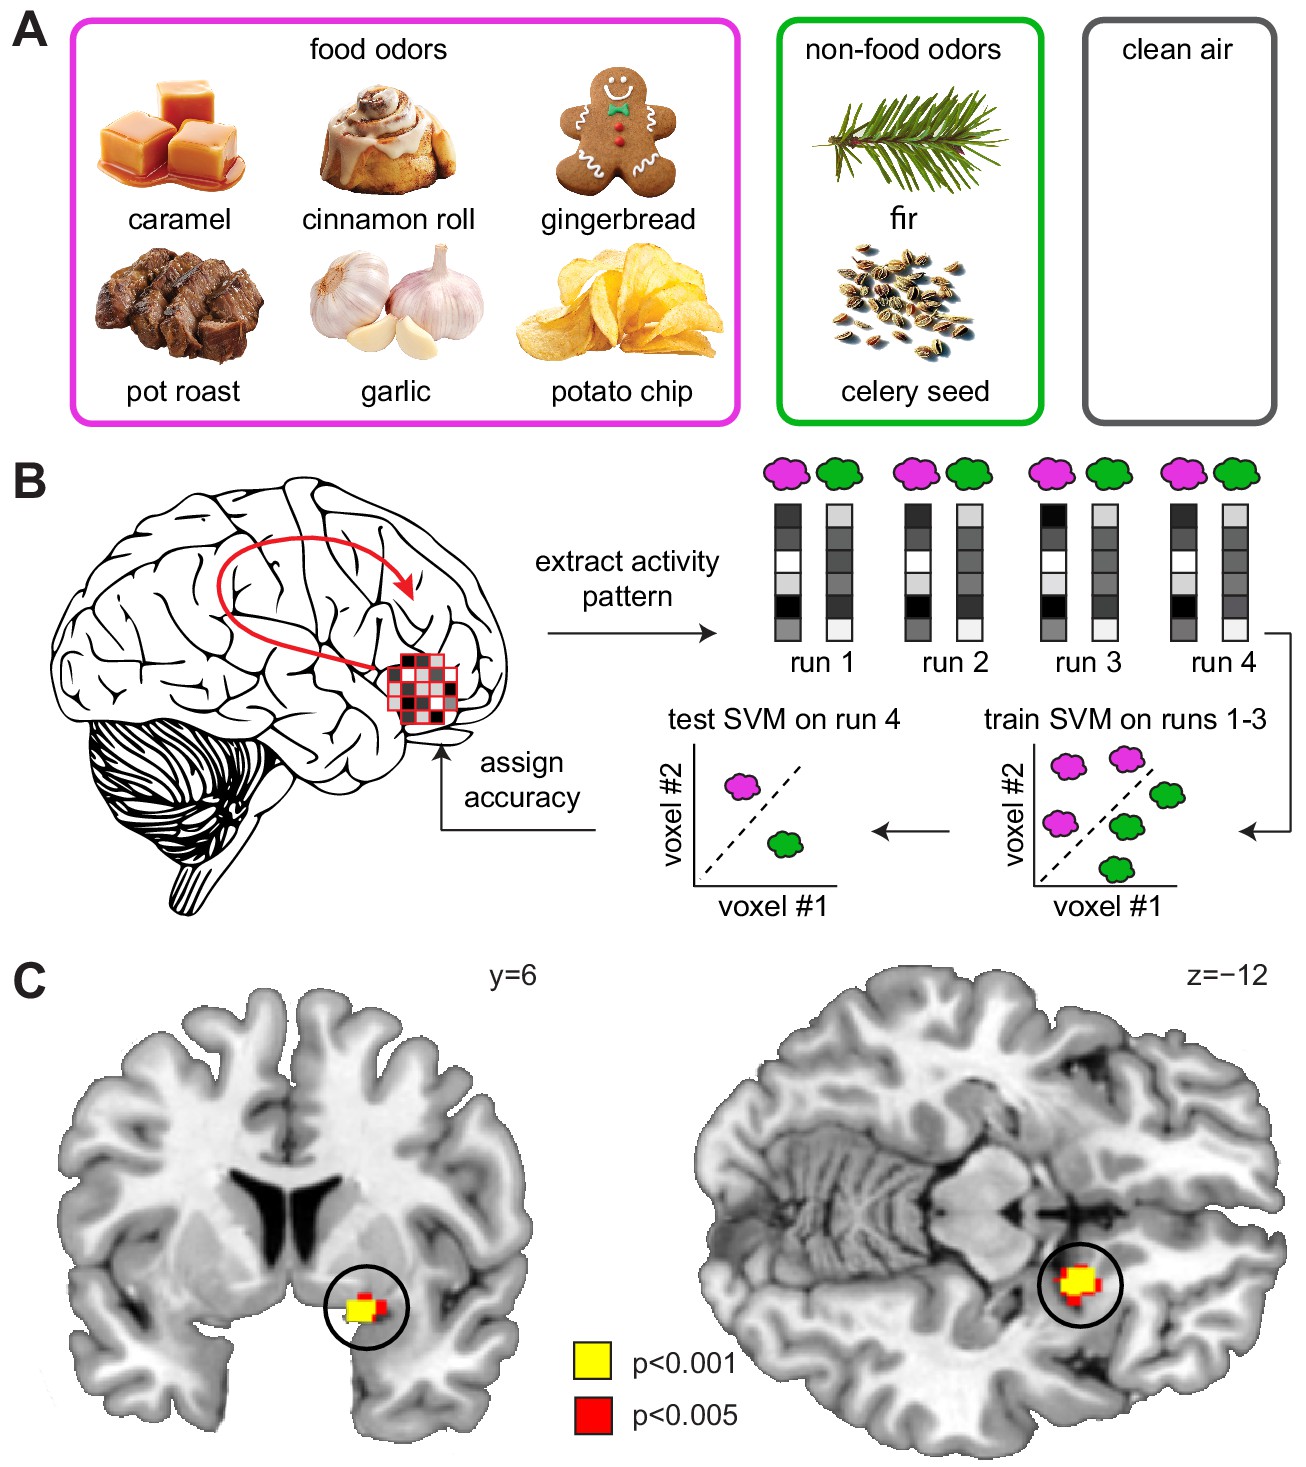
Sleep deprivation enhances encoding of odor information in piriform cortex.
(A) Sweet and savory food odors and non-food control odors presented during fMRI. (B) Schematic of the searchlight decoding analysis used to reveal information about food vs. non-food odors in the DS compared to the NDS session. (C) Decoding accuracy for food vs. non-food odors in the piriform cortex (black circle) was significantly higher in the DS compared to the NDS session (T24 = 5.91, PFWE-SVC = 0.001). This result did not change when including covariates for head motion (translation and rotation) into the group-level model (x = 20 y = 8 z=−12, T23 = 6.12, PFWE-SVC = 0.0001). In addition, results were still significant when including covariates for odor pleasantness in the first- (x = 20, y = 8, z=−10, T24 = 3.12, PFWE-SVC = 0.045) and group-level models (x = 20, y = 8, z=−12, T23 = 6.34, PFWE-SVC = 0.0001). Finally, controlling for respiratory response functions (Birn et al., 2008) did not change the result (x = 20, y = 8, z=−12, T24 = 4.83, PFWE-SVC = 0.001). Whole-brain map can be viewed at neurovault.org/images/132917/.
Figure 3—figure supplement 1
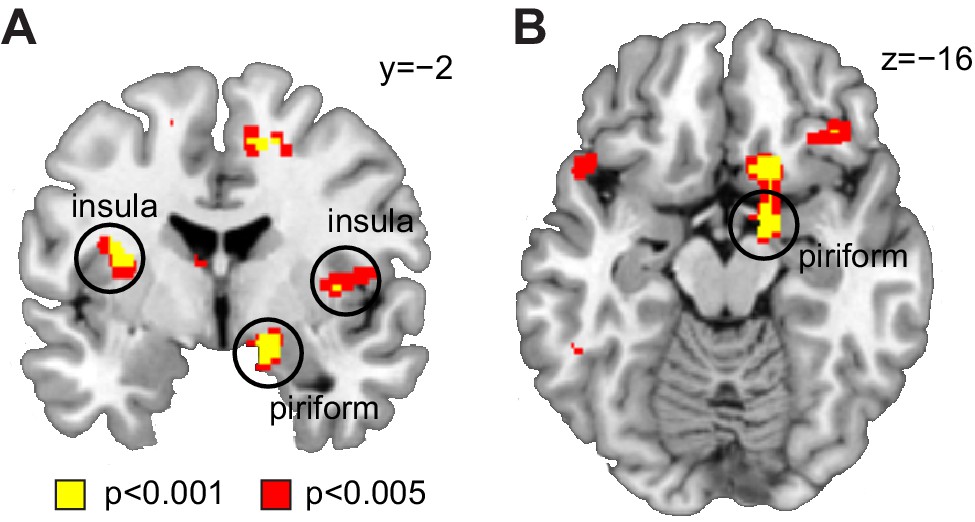
Decoding of odor information across sleep sessions.
(A) Coronal and (B) axial sections showing significant decoding accuracy for food vs non-food odors (averaged across sleep sessions) in piriform cortex (x = 16, y=−2, z=−14, T24 = 4.20, PFWE-SVC = 0.012) and insula (left x=−32, y=−4, z = 16, T24 = 4.75, PFWE-SVC = 0.021; right x = 44, y = 8, z = 10, T24 = 4.84, PFWE-SVC = 0.017). Whole-brain map can be viewed at neurovault.org/images/132918/.
Figure 3—figure supplement 2
fMRI signal coverage.
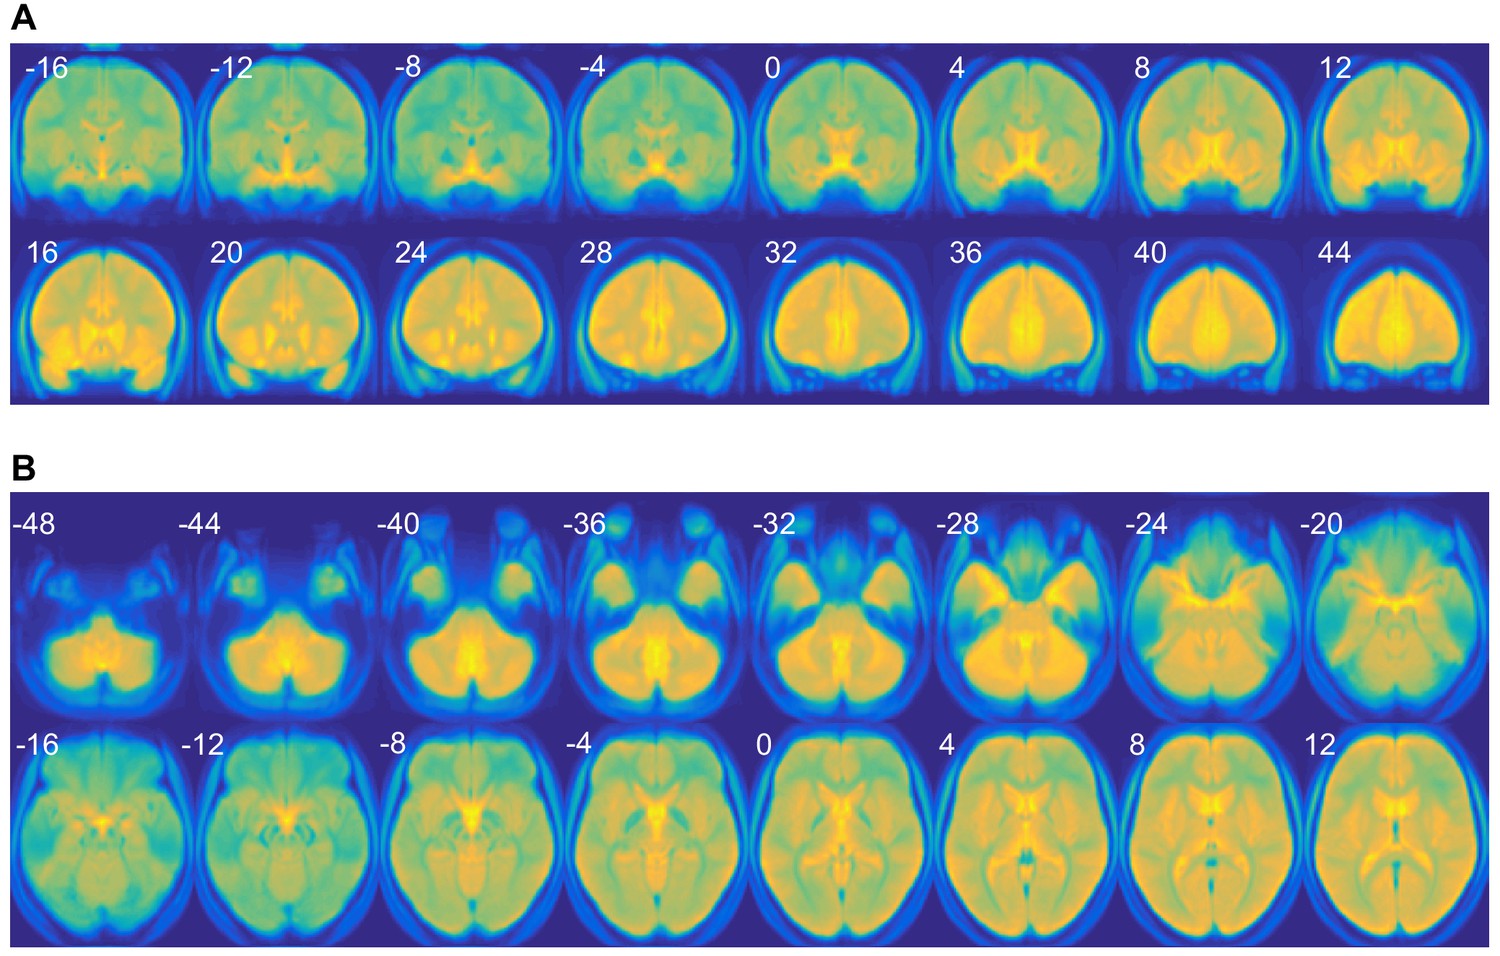
(A) Coronal and (B) axial sections of a normalized EPI scans averaged across subjects and sessions. Numbers indicate y- and z-coordinates in MNI space, respectively.
Figure 4

Sleep deprivation does not enhance univariate fMRI responses to odors.
(A) Significant univariate odor-evoked fMRI responses (food and non-food odors > clean air) in piriform cortex, averaged across both sleep sessions (right, x = 22, y = −4, z = −18, T24 = 12.53, PFWE = 4.42×10⁻⁷; left, x = −24, y = 4, z = −18, T24 = 9.06, PFWE = 2.83×10⁻⁴). Whole-brain map can be viewed at neurovault.org/images/132916/ (B) Parameter estimates in piriform cortex show no differences between food and non-food odors, and no sleep-dependent effects (two-way ANOVA, main effect of sleep, F1,24=0.003, p=0.954; main effect of odor, F2,48=112.88, p=7.12×10⁻¹⁹; sleep-by-odor interaction, F2,482=0.29, p=0.748). Data are represented as mean ± SEM.
-
Figure 4—source data 1
Relates to panel (B).
- https://doi.org/10.7554/eLife.49053.040
Figure 5
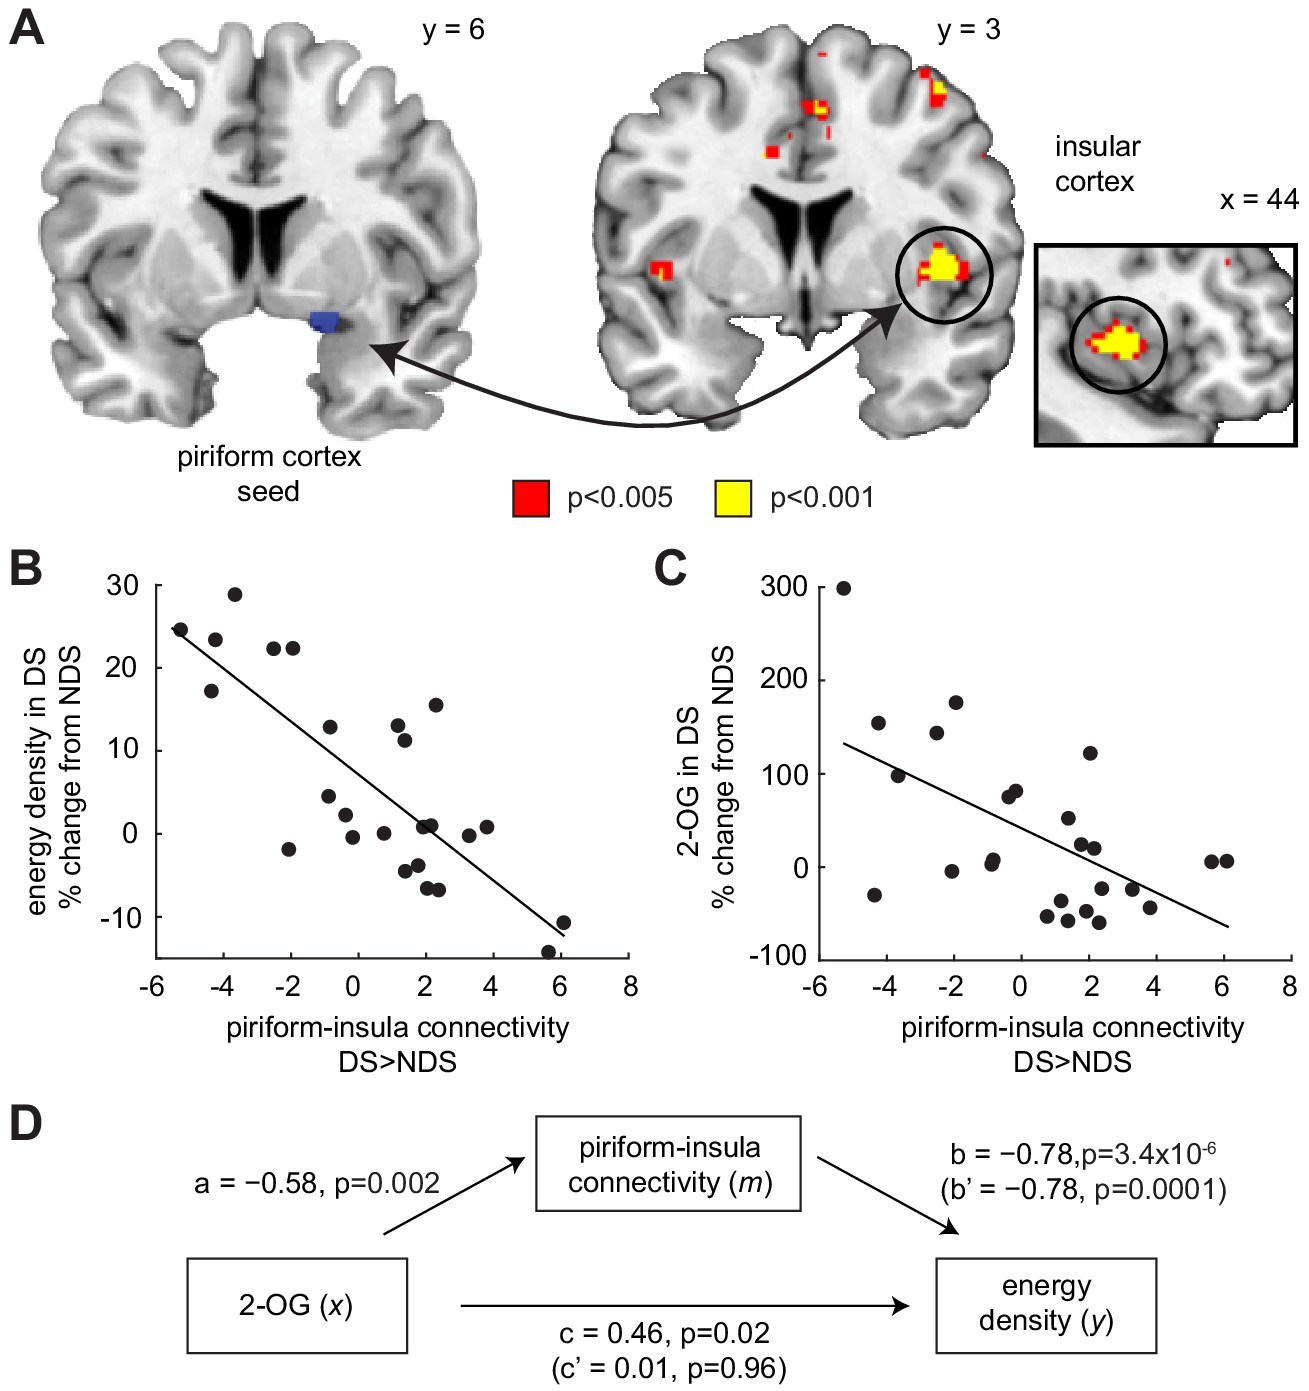
Piriform-insula connectivity mediates the effects of 2-OG on sleep-dependent food choices.
(A) Sleep-dependent changes in odor-evoked connectivity (odor >clean air) between piriform cortex and insula negatively correlated with the energy density of foods consumed at the post-fMRI buffet (T23 = 6.04, PFWE-SVC = 0.005). This result did not change when including covariates for head motion (translation and rotation) into the group-level model (x = 40, y = 6, z = 0, T21 = 5.42, PFWE-SVC = 0.021). In addition, controlling for respiratory response functions (Birn et al., 2008) did not change the result (x = 40, y = 6, z = 0, T23 = 5.59, PFWE-SVC = 0.011). Whole-brain map can be viewed at neurovault.org/images/132919/ (B and C) For illustrative purposes, scatter plots depict association between sleep-dependent changes in piriform-insula connectivity and (B) energy density of food intake (r=−0.78, p=3.4×10⁻⁶) and (C) 2-OG (r=−0.58, p=0.002). (D) Mediation analysis. Sleep-dependent changes in 2-OG separately correlated with choices of energy-dense foods (c = 0.46, p=0.019) and piriform-insular connectivity (a=−0.58, p=0.002), and piriform-insula connectivity correlated with food intake (b = 0.785, p=3.39×10⁻⁶). The association between 2-OG and food choices was no longer significant when the indirect effect of piriform-insula connectivity on food choice was included in the regression model (c’=0.01, p=0.956), which itself remained significant when controlling for 2-OG (b’=−0.78, p=0.0001).
-
Figure 5—source data 1
Relates to panel (B).
- https://doi.org/10.7554/eLife.49053.042
-
Figure 5—source data 2
Relates to panel (C).
- https://doi.org/10.7554/eLife.49053.043
Additional files
-
Supplementary file 1
Sleep monitoring (actigraphy) data.
Means ± SEM of time in bed (TIB), total sleep time (TST), wake after sleep onset (WASO), and sleep efficiency (SE) in the DS and NDS session for the week of sleep stabilization (average across seven nights) and the night of sleep manipulation. P-values from paired t-tests of the difference between NDS and DS sessions.
- https://doi.org/10.7554/eLife.49053.044
-
Supplementary file 2
Ratings of odor stimuli during screening session.
Means ± SEM of ratings for pleasantness, intensity, quality (sweet vs savory), and edibility for the six food and two non-food odors used in this study. For each subject, four food and two non-food odors were presented. Numbers in parenthesis indicate the number of subjects for which a given odor was selected. F- and P-values from one-way ANOVAs across odors.
- https://doi.org/10.7554/eLife.49053.045
-
Transparent reporting form
- https://doi.org/10.7554/eLife.49053.046
Download links
A two-part list of links to download the article, or parts of the article, in various formats.
Downloads (link to download the article as PDF)
Open citations (links to open the citations from this article in various online reference manager services)
Cite this article (links to download the citations from this article in formats compatible with various reference manager tools)
Olfactory connectivity mediates sleep-dependent food choices in humans
eLife 8:e49053.
https://doi.org/10.7554/eLife.49053


